ghettos in canada’s cities? racial segregation, ethnic ... ´etablir des comparaisons entre les...
TRANSCRIPT
Ghettos in Canada’s cities? Racial segregation, ethnicenclaves and poverty concentration in Canadianurban areas
R. ALAN WALKSDepartment of Geography, University of Toronto at Mississauga, Mississauga, ON, Canada, L5L 1C6 (e-mail: [email protected])
LARRY S. BOURNEDepartment of Geography and Program in Planning, University of Toronto, Toronto, ON, Canada, M5S 3G3 (e-mail: [email protected])
Recent literature suggests a growing relationshipbetween the clustering of certain visible minoritygroups in urban neighbourhoods and the spatialconcentration of poverty in Canadian cities, raisingthe spectre of ghettoization. This paper examineswhether urban ghettos along the U.S. model areforming in Canadian cities, using census data for1991 and 2001 and borrowing a neighbourhoodclassification system specifically designed forcomparing neighbourhoods in other countries to theU.S. situation. Ecological analysis is then performedin order to compare the importance of minorityconcentration, neighbourhood classification andhousing stock attributes in improving ourunderstanding of the spatial patterning of low-incomepopulations in Canadian cities in 2001. The findingssuggest that ghettoization along U.S. lines is not afactor in Canadian cities and that a high degree ofracial concentration is not necessarily associated withgreater neighbourhood poverty. On the other hand,the concentration of apartment housing, of visibleminorities in general, and of a high level of racialdiversity in particular, do help in accounting for theneighbourhood patterning of low income. We suggestthat these findings result as much from growing
Il ressort de la litterature la plus recente qu’ilexisterait une association de plus en plus etroite entrela forte concentration en milieu urbain de personnesappartenant a des groupes de minorites visibles et laconcentration spatiale de la pauvrete dans les villescanadiennes, phenomene qui n’est pas sans souleverle spectre de la ghettoısation. C’est dans cette optiqueque ce papier examine si les ghettos urbains al’americaine ont vu le jour dans les villescanadiennes, a partir des donnees des recensementsde 1991 et de 2001 et a l’aide d’un systeme declassification des quartiers concu specifiquementpour etablir des comparaisons entre les quartiers dedifferents pays et ceux des Etats-Unis. Une analyseecologique est ensuite menee afin de comparerl’importance de la concentration des minorites, laclassification par quartier, et les caracteristiques duparc de logements et ainsi mieux comprendre laconfiguration spatiale des populations a faible revenudans les villes canadiennes en 2001. Les resultatslaissent entendre que la ghettoısation a l’americainen’est pas un facteur a prendre en compte en ce quiconcerne les villes canadiennes, et que la tendancevers une concentration de groupes ethniques n’estpas necessairement associee au niveau de pauvrete
The Canadian Geographer / Le Geographe canadien 50, no 3 (2006) 273–297C© / Canadian Association of Geographers / L’Association canadienne des geographes
274 R. Alan Walks and Larry S. Bourne
income inequality within as between each visible mi-nority group. This increases the odds of poor visibleminorities of each group ending up in the lowest-cost,least-desirable neighbourhoods from which they can-not afford to escape (including social housing in theinner suburbs). By contrast, wealthier members of mi-nority groups are more mobile and able to self-selectinto higher-status ‘ethnic communities’. This researchthus reinforces pleas for a more nuanced interpreta-tion of segregation, ghettoization and neighbourhooddynamics.
dans le voisinage. En revanche, la concentrationd’immeubles a logements multiples, de minoritesvisibles en general et d’un niveau eleve de diversiteraciale en particulier, expliquent, en partie, ladistribution des personnes a faible revenu dans levoisinage. Ces resultats laissent entendre que lacroissance de l’inegalite des revenus au sein desgroupes de minorites visibles est aussi importanteque l’inegalite qui existe entre eux. Ceci augmente leschances que les membres les plus defavorises de tousles groupes de minorites visibles echouent dans unquartier precaire et moins que desirable duquel ilsn’ont pas les moyens de s’echapper (y compris leslogements sociaux dans les quartiers centraux). Parcontre, les membres les plus aises des groupesminoritaires peuvent choisir de vivre dans une�communaute ethnique� dont le statutsocio-economique est plus eleve. Cette recherche peutservir dans les plaidoyers en faveur d’uneinterpretation plus nuancee de la segregation, laghettoısation et les dynamiques de quartier.
Introduction
Are there urban ghettos in Canada? There hasbeen increasing interest in analyzing the impactsof growing visible minority populations in Cana-dian cities, particularly in terms of their linksto levels of concentrated poverty and neighbour-hood distress. Recent reports commissioned bymunicipal governments and service agencies (Fed-eration of Canadian Municipalities 2003; UnitedWay of Greater Toronto 2004) as well as by Statis-tics Canada (Heisz and McLeod 2004) suggest thatpoverty (or more accurately, low income) is notonly growing in Canadian cities but is becomingincreasingly concentrated in poor neighbour-hoods. Not unsurprisingly, the spatial concentra-tion of visible minorities, Aboriginals and recentimmigrants is cited as one of a number of po-tential factors underpinning the growth of con-centrated urban poverty. Information containedin the United Way report, ‘Poverty by Postal Code’(United Way of Greater Toronto 2004, 49–50), forinstance, suggests that the growth in visible mi-nority families may explain all of the growth infamily poverty within the City of Toronto be-tween 1981 and 2001, since the level of low in-come rose both in the city at large and among
visible minority families, but declined for non-visible minority families. According to this report,visible minority families made up 77.5 percent ofthe poor families residing in high poverty neigh-bourhoods in 2001, double the level in 1981.
This raises the spectre of ghettoization emerg-ing within Canadian cities along the lines wit-nessed in the United States, a spectre fuelledby media reporting of violent crimes potentiallylinked to minorities and to gangs, particularlyin Toronto.1 The relationship between visibleminority concentration and high-poverty neigh-bourhoods in Canada, however, remains under-examined, with most studies concerned withsegregation conducted by a small number of de-voted sociologists and geographers (for example,Darroch and Marston 1971; Balakrishnan 1976,1982; Clarke et al. 1984; Ray and Moore 1991;Murdie 1994a; Fong 1996; Bauder and Sharpe2002; Fong and Wilkes 2003; White et al. 2003,2005; see also Walks 2001). Much of the liter-ature, and the dominant discourse, concerningurban ghetto formation has emanated from the
1 The Toronto media has labeled 2005 ‘the year of the gun’,due to the high proportion of murders committed usingfirearms (see Huffman 2006; Toronto Star 2006).
The Canadian Geographer / Le Geographe canadien 50, no 3 (2006)
Ghettos in Canada’s cities? 275
United States where racial segregation, particu-larly of the black population, has been an over-riding concern. Studies undertaken in the UnitedStates have found not only very high levelsof spatial segregation for blacks and Hispanics,but strong neighbourhood effects that grow withthe level of racial concentration. In the UnitedStates living in a highly segregated neighbour-hood not only increases the chance that one isalready poor, but also limits the ability of res-idents to escape poverty due to, among otherthings, a lack of social networks, locally basedresources, and access to employment (Wilson1987; Massey and Denton 1993; Jargowsky 1997;Ihlanfeldt 1999). Although the most recent U.S.census shows a decline in both residential seg-regation and neighbourhood poverty, this changehas mostly occurred in cities with few blacks orHispanics to begin with: in cities with larger blackpopulations there has been much less change(Jargowsky 2003; Kingsley and Pettit 2003).
Hajnal (1995) was one of the first to raisethe alarm about the growth of neighbourhoodpoverty in Canada. He showed that a higher pro-portion of Canadians lived in high-poverty neigh-bourhoods in 1986 than did residents of theUnited States in 1981, although he rightly pointedout that the low proportion of visible minori-ties in such neighbourhoods at the time meantthat the main source of this difference lay else-where. Fong and Shibuya’s (2000, 2003) researchusing the 1986 and 1991 census data contin-ued to uncover a relationship between visible mi-nority concentration and neighbourhood poverty.Yet, it is Kazemipur and Halli’s (2000) work thathas perhaps been most influential in bringingthe discourse of ghettoization to Canada: theirprovocative use of the subtitle ‘Ethnic Groups andGhetto Neighbourhoods’ implied that Canada waswitnessing the birth of urban underclass ghet-tos directly linked to growing ethnic communi-ties. Analyzing census data to 1991 for CensusMetropolitan Areas (CMAs) they suggest that Abo-riginals and recent immigrants from Africa, Asia,Latin America and the Caribbean in particularare increasingly likely to live in ‘ghetto’ or ‘un-derclass’ neighbourhoods. This result stands insharp contrast to other studies of ethnic andracial segregation trends that suggest that theydo not mimic the pattern of ghettoization foundin the United States (Fong 1996; Balakrishnan
2001; Bauder and Sharpe 2002; Balakrishnan andGyimah 2003; Myles and Hou 2004; Peters 2005).
Each of these studies, however, uses differ-ent definitions (of ghettos, concentrated poverty,etc.) and a different methodology to arrive attheir conclusions, and the methods used oftendo not permit direct comparison with existingU.S. and international studies. Furthermore, theeffect of changes witnessed in the most recentcensus period is not yet known. While a posi-tive turn in the business cycle has led to a de-cline in concentrated low income in most CMAsin Canada between 1996 and 2001, the benefitsare shared unequally with some cities worse offthan a decade earlier (Heisz and McLeod 2004). Itremains unclear whether the growth of the visi-ble minority population (that mainly results fromchanges in the source countries of immigrantsto Canada as well as higher birth rates amongcertain minority groups), has led to their spatialintegration or segregation, and whether such spa-tial changes are linked to the patterning of high-poverty neighbourhoods.
This paper seeks to answer these questions. Itexplores the relationship between the spatial con-centration of visible minorities and the growth ofneighbourhood poverty, using information fromthe 1991 and 2001 censuses at the level of cen-sus tracts. In so doing it simultaneously updatesand expands upon the existing Canadian litera-ture on the subject in two directions (see alsoHiebert 2000; Bauder and Sharpe 2002). First,to examine the question of ghetto formation, aneighbourhood classification system is adoptedthat has been recently developed precisely for thetask of comparing levels of neighbourhood iso-lation, ghettoization and integration across na-tional contexts (Poulsen et al. 2001; Johnstonet al. 2003). This classification scheme allows fora comparative test of whether ghetto formationis also occurring in Canada, and whether neigh-bourhood poverty rises as visible minority con-centration increases. The relative importance ofminority concentrations for predicting the spa-tial patterning of high-poverty neighbourhoodsin comparison with other factors is then ascer-tained using regression analysis undertaken forthe most highly segregated metropolitan areas.
We are aware that this analysis sits at the inter-section of parallel research interests in the studyof immigrants, ethnic communities and racialized
The Canadian Geographer / Le Geographe canadien 50, no 3 (2006)
276 R. Alan Walks and Larry S. Bourne
groups. These groups are not the same, althoughthere is considerable overlap as most recentimmigrants also qualify as members of dis-tinct ethnic and racial communities. It should benoted, however, that the concept and meaning,and the formal categorization, of visible minori-ties are themselves problematic, and such labelstend to obscure a considerable diversity in thecharacter and living conditions of the populationinvolved. Despite these misgivings, our focus ison the visible minority population since it is theincreasingly widely used currency in the censusdata and in social science research.2
The Geography of Assimilationand Exclusion? Enclaves, Communitiesand Ghettos
A situation of increasing neighbourhood concen-tration of visible minority groups violates tradi-tional ecological models that see immigrants andethnic groups integrating geographically as theyassimilate culturally (Park et al. 1925). While con-gregation in a particular district may have tem-porary benefits for a particular group, continuedor increasing concentration implies a breakdownof the assimilation process and/or social exclu-sion on the part of the ‘host’ society (Philpott1978). However, a more nuanced approach char-acterizes recent thinking, particularly concerningthe growth of ‘EthniCities’ and multiculturalist/pluralist policy (Clarke et al. 1984; Rosemanet al. 1996). Long-term ethnic concentration mayhelp promote cultural goals and group identity(Peach 1996; Boal 2005), and may be strategicin light of increasing transnationalism and/orthe global marketing of ethnic spaces (Lin 1998;Ong 1999; Walton-Roberts 2003), and thus shouldnot be viewed as necessarily negative (Qadeer2005). It is important to differentiate between in-duced, involuntary and strategic forms of spatial
2 The concept and practice of identifying visible minoritypopulations in the census derives primarily from an in-terest in equity issues, concerns regarding discrimination,and the need for information on social change and diver-sity that is not provided by standard ethno-cultural classi-fications. The concept generally refers to all populations ofnon-European and non-Aboriginal origin, and is an implicitmarker of racialization. Since 1996, respondents to the Cen-sus of Canada have been able to self-identify as a memberof a visible minority group.
concentration—between ghettoization, which theliterature invariably views negatively, and otherforms including the growth of traditional en-claves dominated by a single ethnic group,which is now often looked upon as potentiallybeneficial.
The traditional definition of the ghetto in theU.S. context is of a residential district that bothconcentrates a particular racial or ethnic groupand at the same time contains it, in that a major-ity of its members are forced to live there due todiscrimination on behalf of the host community(Philpott 1978; Massey and Denton 1993; Peach1996; Jargowsky 1997; Marcuse 1997; Logan et al.2002; Johnston et al. 2003; Pattillo 2003). Suchghettos are produced through race-based discrim-ination in the housing and labour markets. Thisis a different definition of the ghetto than thatemployed by Wilson (1987) who examines the in-crease in high poverty levels among black andHispanic neighbourhoods, with residents often re-ferred to as the ‘ghetto poor’. Bridging the two,Marcuse (1997) suggests that as a result of in-dustrial decentralization and globalization, a newform of ‘outcast ghetto’ (distinguished from theghetto of old) may be emerging in U.S. cities,composed only of the poorest segments of sub-jugated racialized groups (mostly blacks and His-panics) who are marginal to current productionneeds.
A number of authors contrast the ghetto withthe ethnic enclave in which residency appearsvoluntary and members have the option of leav-ing. Enclaves, therefore, crystallize because theyconform at least partly to the needs of a mi-nority group, while ghettos are formed throughexclusion on behalf of the host society againstthe interests of its residents and from whichthey cannot easily escape (Marcuse 1997). Loganet al. (2002) distinguish further between the im-migrant enclave of old, typically seen as a tem-porary neighbourhood of convenience containingethnic resources to be drawn upon until immi-grants assimilate into the host society and relo-cate, and an emerging new ideal type, the ‘eth-nic community’. Unlike the immigrant enclave,many (but certainly not all) ethnic and culturalgroups view the ethnic community as the desiredresidential endpoint, typically a neighbourhoodwith a single group dominant and at the sametime relatively prosperous (Logan et al. 2002).
The Canadian Geographer / Le Geographe canadien 50, no 3 (2006)
Ghettos in Canada’s cities? 277
Finally, there are the citadels, the isolated ex-clusive neighbourhoods formed by the elite classof the host community for their own benefit(Marcuse 1997).
Confusion over these definitions is one rea-son for the lack of comparability among Cana-dian research on the topic. For example, manystudies that conclude that there is little evidenceof ghetto formation in Canadian cities are basedon an examination of indices of dissimilarityor exposure to own-group members, a methodthat cannot distinguish between ghettos and en-claves (Balakrishnan 2001; Bauder and Sharpe2002; Balakrishnan and Gyimah 2003; Myles andHou 2004). On the other hand, Kazemipur andHalli (2000) parrot Wilson (1987) in employingthe terms ‘ghetto’, ‘underclass’ and ‘high povertyneighbourhood’ interchangeably, defining them asany census tract with an incidence of low incomeabove 40 percent. Such a practice, however, im-pedes clarity when it is the relationship betweenethnic segregation and concentrated poverty thatis in question. As yet, few Canadian studies haveemployed strict criteria that would allow one todistinguish between the growth of ethnic enclavesand contained ghettos.
Recently, Johnston et al. (2002) have presentedexplicit criteria for classifying urban neighbour-hoods. They employ an approach of absolutefloors and ceilings, rather than relative measuresand indices, in order to compare situations acrosstime and space. According to the authors, thisclassification is ‘a robust approach to compar-ative study’ across international contexts, whichin turn is ‘directly linked to the homogeneity–heterogeneity continuum which underpins allstudies of segregation’ because it simultane-ously identifies three different types of spa-tial segregation proposed by Massey and Denton(1993): isolation, clustering and concentration(Poulsen et al. 2001, 2071). Such a classificationallows for the examination of a number of inter-esting questions, including the proposition that‘outcast’ ghettos or ‘ethnic communities’ couldbe forming among particular minorities regard-less of the direction of movement in overall seg-regation indices. This approach facilitates a morecomplex investigation into the importance of vis-ible minority concentration for our understand-ing of the growth of concentrated neighbourhoodpoverty.
This classification has so far been used to com-pare British cities, and cities in Australia andNew Zealand, to the U.S. case (Poulsen et al.2001; Johnston et al. 2002), and to analyze dif-ferences between U.S. cities over time (Johnstonet al. 2003). Under this definition, ghettos suchas those in New York, Los Angeles, Chicagoand Miami, were found only to exist in a fewsmaller British cities, namely Leicester, Oldhamand Bradford, with South Asians being the mostconcentrated in such areas. There is no evidenceof ghettoization in larger British cities such asLondon, nor in Australia or New Zealand, coun-tries that are said to have adopted a similar pol-icy of multiculturalism to the Canadian model(Smolicz 1995, 592; Johnston et al. 2002). It isnot yet known how Canadian cities compare tothese others.
Immigration, Visible MinorityNeighbourhoods and ConcentratedPoverty in Canada
It is clear that changes in immigration pol-icy implemented in the late 1960s have hadan increasingly disproportionate impact on theface of urban Canada. Between 1971 and 2001,the proportion of Canada’s population that hadbeen born in Asia, Africa, the West Indies,or Latin America rose from 1.7 to 10.4 per-cent, while visible minorities grew from 4.7 to13.4 percent of the population between 1981and 2001 (Statistics Canada 2003, 10). Changesin the source countries of immigrants havebeen accompanied by their increased concen-tration within Canada’s census metropolitan ar-eas (CMAs) (Hou 2004; Simmons and Bourne2003).3 Recent immigrants, in particular, haveincreasingly preferred to move to the largesturban regions since 1971, when 50.3 percentof foreign-born residents lived in one of thefive largest cities. By 2001, this proportionhad risen to 80.4 percent, with a full 43 per-cent of immigrants arriving in the preceding
3 In 1971 approximately 68.4 percent of all foreign-born res-idents lived in urban areas with populations over 100,000.This level increased to 77.8 percent in 1981, 84.2 percent in1991 and 89.2 percent by 2001. This is a much faster rate ofincrease than experienced by the total population (calculatedby the authors from Census of Canada, various years).
The Canadian Geographer / Le Geographe canadien 50, no 3 (2006)
278 R. Alan Walks and Larry S. Bourne
10 years moving to the Toronto CMA (StatisticsCanada 2003, 7). Accordingly, visible minoritieshave become highly concentrated in the largestcities and their suburbs. Both the Toronto andVancouver CMAs went from having just under14 percent to just under 37 percent of their pop-ulation classified as visible minorities between1981 and 2001 (Statistics Canada 2003, 44).4
Meanwhile, the Aboriginal population, which istreated as a distinct group in the census, isbecoming more concentrated in a number ofPrairie cities, particularly Saskatoon, Regina andWinnipeg.
While the Canadian media may have con-structed immigrant settlement patterns as a na-tional policy issue (mostly in relation to regionaldevelopment and the distribution of services)(Abu-Laban and Garber 2005), there is no con-sensus in the literature concerning whether thegrowth and concentration of visible minorities inCanadian cities is leading to their increased iso-lation from mainstream society. Studies of eth-nic and racial segregation have found that whilecertain groups are highly concentrated in certainneighbourhoods (Jewish, then South Asian groupswere the most segregated), the levels of concen-tration for such groups were not as high as foreither blacks or Asians in U.S. cities (Fong 1996;Balakrishnan and Hou 1999; White et al. 2003)and they changed little or declined between 1986to 1996 (Balakrishnan 2001; Bauder and Sharpe2002; Balakrishnan and Gyimah 2003).
Such trends have led some researchers toconclude that mobility and assimilation, ratherthan entrapment, exclusion or cultural separa-tion, more commonly characterize the residentialgeography of immigrant groups in Canada (Leyand Smith 2000; Hiebert and Ley 2003). How-ever, the results are decidedly uneven (Bauderand Sharpe 2002; Hou and Milan 2003), and re-cent findings concerning the relationship betweenlow income, immigration and visible minority sta-tus raise some new concerns. While the earningsgap between both whites and visible minorities,
4 Change over time in the proportion of the population madeup of visible minorities would be even steeper if the samemethod for classifying visible minorities had been used ineach census year. The method used in the 1996 and 2001censuses, respondent self-identification, leads to counts thatare roughly six percent lower than would be the case usingethnic origin, the method used until 1996 (Hou and Picot2003, 1).
and whites and Aboriginals, decreased during the1970s and stabilized during the 1980s, it grewrapidly during the first half of the 1990s (Pen-dakur and Pendakur 2002). Morissette and Drolet(2000) found that members of visible minoritiesand immigrants who arrived after 1977 suffereddisproportionately from low income during theearly 1990s. Picot and Fou (2003) show that bothlow-income levels and gaps grew among recentimmigrants between 1980 and 2000, particularlyduring the 1990s among immigrants from Asiaand Africa.
Deterioration in earnings levels for recent im-migrants occurred despite demographic shiftsamong recent immigrant cohorts (toward highereducation and skill levels) that should have leftthem significantly better off, rather than worse,than earlier cohorts (Aydemir and Skuterud2004). Part of the blame lies with declining re-turns to foreign work experience and the deval-uation and non-recognition of foreign credentials(Bauder 2003). It is argued that this trend stemsnot only from an inability to transfer skills, butalso from institutionalized forms of occupationalexclusion as well as racial discrimination withinthe labour market (Bloom et al. 1995; Bauder2003).5 While recent immigrants arriving in the1990s were found to be able to catch up tothe Canadian-born faster than was the case inthe past (Li 2003), this outcome is least true forvisible minority immigrants, particularly refugeesfrom Africa, Latin America and the Middle Eastwho rarely ever attain occupational levels theyenjoyed in their countries of origin (Krahn et al.2000).
As a result of such shifts, Moore and Pacey(2003) found that much of the increase in incomeinequality experienced across Canada during theearly 1990s may be accounted for by the growthof inequality and low income within recent immi-gration cohorts. Furthermore, as a result of therestructuring of Canada’s set of taxes and trans-fers during the 1990s, welfare-state programs andbenefits did not offset either the growth of low-income intensity (Picot et al. 2003) or incomeinequality (Frenette et al. 2004) that followedthe severe recession of the early 1990s. This
5 Ironically, the relative lack of competition between native-born Canadians and recent immigrants for privileged jobsmay help explain the disproportionately higher support forimmigration in Canada (Hiebert 2006).
The Canadian Geographer / Le Geographe canadien 50, no 3 (2006)
Ghettos in Canada’s cities? 279
contrasts with the situation during the 1980swhen the transfer and tax system largely negatedthe growth in market-driven wage inequality andlow-income employment.
What is yet unclear is how the rising inci-dence of low income and inequality among vis-ible minorities is related to concentrated povertyin Canadian cities, and in turn, how neighbour-hood concentration might reduce or enhanceopportunities and access to resources. A lackof labour market ties between ethnic groupsand the rest of Canadian society might be ex-pected to impede improvement in their incomes,job qualifications and language skills (Hou andPicot 2003, 3), though Teixeira (2001) suggeststhat the local community can be an important re-source for ethnic business. Examining trends be-tween 1981 and 1996 for the three largest CMAs,Hou and Picot (2003) find that living in neigh-bourhoods with high concentrations of membersfrom one’s own minority group has only insignif-icant effects on both labour market segregationand employment earnings. These general results,however, mask important intra-group differences.While residence in Chinese enclaves had little ef-fect on the earnings or occupations of their in-habitants, the association between living amongown-group members and negative labour marketoutcomes was strong and significant for blacks,even though blacks were the least segregated ofthe groups studied (Hou and Picot 2003, 24).
These latter findings are echoed in Myles andHou’s (2004) in-depth study of ‘locational attain-ment’ among visible minority groups in Torontoin 1996. They argue that the Chinese have beenbetter able to move into their desired residentialenvironments (highly concentrated but wealthyChinese neighbourhoods resembling Logan et al.’s‘ethnic communities’) because they were ableto take greater advantage of family credit inthe pursuit of homeownership. This then gavethem a substantial asset advantage over othergroups. Blacks, on the other hand, have largelyremained tenants. Such trends are all the moreworrying considering that the income gap hasgrown wider between renters and homeowners(Hulchanski 2001; Moore and Skaburskis 2004),and that homeownership rates have been unex-plainably falling among certain immigrant groups(Haan, 2005). In particular, Hou and Milan (2003)demonstrate that blacks are both more likely
to live in, and to move into, neighbourhoodswith lower socio-economic status, while Murdie’s(1994a) research showed that blacks were alsodisproportionately concentrated within Toronto’ssocial housing stock, typically the residence oflast resort. Schellenberg (2004) reveals that recentimmigrants are now disproportionately concen-trated in rental housing and dependent on publictransit and public schooling.
A recent longitudinal study of neighbour-hood exit opportunities found that low-incomeneighbourhoods in Toronto and Vancouver, butnot Montreal, exhibited ‘negative duration de-pendence’, meaning that their residents becomeincreasingly less likely to leave such neighbour-hoods the longer they reside in them, even af-ter controlling for various demographic variables(Frenette et al. 2004). Approximately one-thirdof low-income residents lived for at least 6years in tracts with levels of low income over30 percent, and just over one-third of thosewho left moved into another tract with a highlevel of low income. There would thus appearto be a tendency for some low-income resi-dents to become trapped in low-income neigh-bourhoods. It is not clear, however, that thistrend presents an extra impediment for the poor.Another longitudinal study by Oreopoulos (2002)found no significant independent neighbourhoodimpacts of living in the poorest neighbourhoodson education, earnings, income and/or unemploy-ment among residents of social housing projectsin Toronto, after controlling for individual-levelsocio-demographic variables, including immigrantstatus.
It thus may not be residential location per se,but factors such as tenancy, poverty, family sit-uation and racial discrimination in housing andlabour markets that are most important for deter-mining the life chances of Canada’s urban poor.A number of researchers (Ray and Moore 1991;Ray 1994; Fong, 1996; Bauder and Sharpe 2002;White et al. 2003) suggest that housing afford-ability is also a serious problem among signif-icant segments of new immigrant groups, andthat this is one cause of the concentration ofvisible minorities within cheap rental accommo-dation. Further research on racial discriminationand its relationship with spatial entrapment ofpoor visible minorities in low-income neighbour-hoods is clearly warranted.
The Canadian Geographer / Le Geographe canadien 50, no 3 (2006)
280 R. Alan Walks and Larry S. Bourne
The research discussed above presents a com-plex picture of the relationship between grow-ing visible minority populations, segregation andconcentrated poverty. It is still unclear whatgeographic effects growing inequality and low-income may have, what their relationship tominority–majority neighbourhoods might be, andwhether Canada may be witnessing the growth ofurban ghettos. This paper seeks to shed light onthese questions.
Data and Method
Data for this research come from the census tractfiles for the 1991 and 2001 census of Canada.We initially examine all CMAs in order to pro-vide a context for the detailed analysis of changesin the most highly segregated cities. Visible mi-nority status was chosen over ethnicity as thecritical classification variable for this research asthe discourse on ghettoization, whether comingfrom the United States or elsewhere, is clearlyconstructed in relation to the history of racial-ization and racial discrimination (Philpott 1978;Massey and Denton 1993; Peach 1996; Marcuse1997; Bauder and Sharpe 2002; Pattillo 2003).
Admittedly, there are problems with this ap-proach, particularly in relation to debates con-cerning the social construction of different racialcategories in contrast to the actual fluidity ofidentity, and their statistical aggregation in cen-sus data (Bauder and Sharpe 2002, 208–209).However, the data on ethnicity are even morecomplex and unclear, particularly in light of thegrowing proclivity of respondents to self-identifyas ‘Canadian’ (Boyd and Norris 2001), and suchdata do not allow for the aggregation of thenon-white population. As Canadian research sug-gests a possible relationship between growingAboriginal populations, marginality and povertyin Prairie cities (Kazemipur and Halli 2000; Peters2001, 2005), the spatial concentration of Aborigi-nals is also examined here. Ideally, we would havewanted to examine the different characteristics ofeach visible minority group, including the timeof arrival, but this is beyond the scope of thepresent study.
Changes in the way census data are collectedpresent one further limitation. Until 1996 dataon visible minority status was imputed by Statis-
tics Canada from ethnicity and ancestry. From1996 onwards the classification of visible mi-norities has been based on self-identification.While this difference impedes easy comparabilityacross time, the evidence is that this shift biasesdownwards the estimate of the visible minor-ity population in 2001, thus presenting a moreconservative picture of change than would bethe case using the method from 1991 (Hou andPicot 2003, 1). Similarly, the identification of Abo-riginals changed, from measures of ancestry andethnicity, to Aboriginal identity and Aboriginalorigins that are acquired through respondent self-identification. Because of changes in the way vis-ible minorities and Aboriginals are recorded, it ispossible that there was an overlap between thesetwo categories in 2001, but not in 1991, and thispoint should be taken into account when inter-preting the results.
This analysis first employs a traditional mea-sure of segregation, the index of dissimilarity(DIS), to examine segregation trends over the pe-riod 1991 to 2001. Research by Townshend andWalker (2002, 48) found that this measure alonewas sufficient to account for a significant major-ity of the geographical variation in income acrossCanadian CMAs (though see Ross et al. 2004). Af-ter examining changes in segregation levels us-ing this index, this paper adopts the taxonomyproposed by Johnston et al. (2003) for classify-ing urban neighbourhoods in order to examinewhether ghettos, according to their definition, ex-ist in Canada and whether levels of visible mi-nority concentration are related to the concentra-tion of low income. Out of convenience, and inline with other studies of residential segregation,neighbourhoods are operationalized here as cen-sus tracts.6
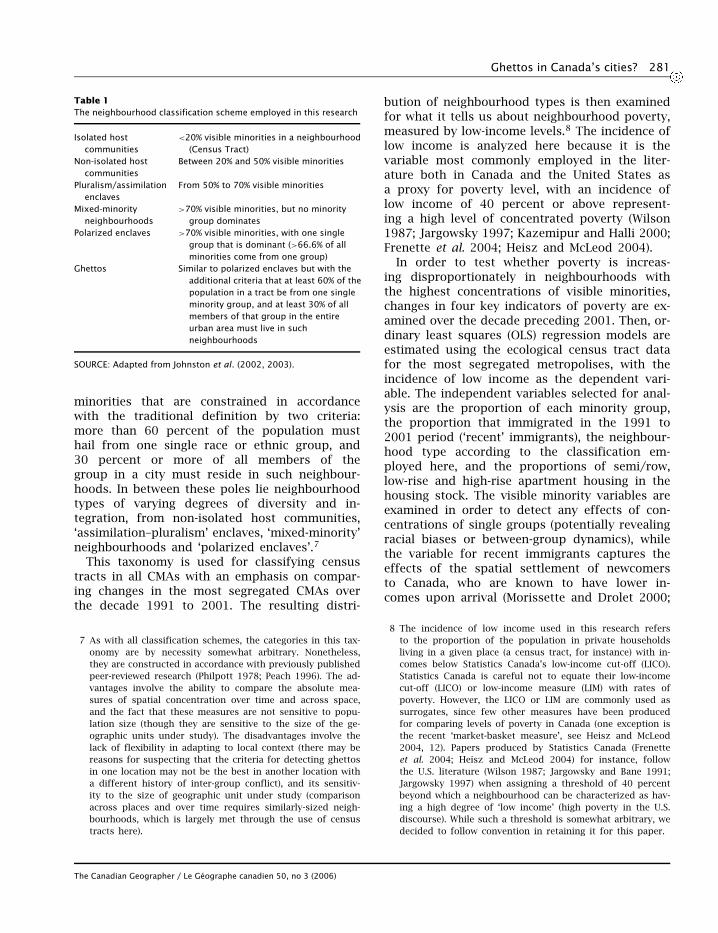
Johnston et al. (2003) present absolute crite-ria for classifying urban neighbourhoods alonga continuum from isolated host communitiesto ghettos (Table 1). The former are definedas neighbourhoods with fewer than 20 percentvisible minorities, while the latter are neigh-bourhoods containing at least 70 percent visible
6 Census tracts are geographic units, containing on average4,000 people, created by Statistics Canada for aggregatingcensus data to boundaries that approximate those of distinctneighbourhoods with similar social and economic character-istics.
The Canadian Geographer / Le Geographe canadien 50, no 3 (2006)
Ghettos in Canada’s cities? 281
Table 1The neighbourhood classification scheme employed in this research
Isolated hostcommunities
<20% visible minorities in a neighbourhood(Census Tract)
Non-isolated hostcommunities
Between 20% and 50% visible minorities
Pluralism/assimilationenclaves
From 50% to 70% visible minorities
Mixed-minorityneighbourhoods
>70% visible minorities, but no minoritygroup dominates
Polarized enclaves >70% visible minorities, with one singlegroup that is dominant (>66.6% of allminorities come from one group)
Ghettos Similar to polarized enclaves but with theadditional criteria that at least 60% of thepopulation in a tract be from one singleminority group, and at least 30% of allmembers of that group in the entireurban area must live in suchneighbourhoods
SOURCE: Adapted from Johnston et al. (2002, 2003).
minorities that are constrained in accordancewith the traditional definition by two criteria:more than 60 percent of the population musthail from one single race or ethnic group, and30 percent or more of all members of thegroup in a city must reside in such neighbour-hoods. In between these poles lie neighbourhoodtypes of varying degrees of diversity and in-tegration, from non-isolated host communities,‘assimilation–pluralism’ enclaves, ‘mixed-minority’neighbourhoods and ‘polarized enclaves’.7
This taxonomy is used for classifying censustracts in all CMAs with an emphasis on compar-ing changes in the most segregated CMAs overthe decade 1991 to 2001. The resulting distri-
7 As with all classification schemes, the categories in this tax-onomy are by necessity somewhat arbitrary. Nonetheless,they are constructed in accordance with previously publishedpeer-reviewed research (Philpott 1978; Peach 1996). The ad-vantages involve the ability to compare the absolute mea-sures of spatial concentration over time and across space,and the fact that these measures are not sensitive to popu-lation size (though they are sensitive to the size of the ge-ographic units under study). The disadvantages involve thelack of flexibility in adapting to local context (there may bereasons for suspecting that the criteria for detecting ghettosin one location may not be the best in another location witha different history of inter-group conflict), and its sensitiv-ity to the size of geographic unit under study (comparisonacross places and over time requires similarly-sized neigh-bourhoods, which is largely met through the use of censustracts here).
bution of neighbourhood types is then examinedfor what it tells us about neighbourhood poverty,measured by low-income levels.8 The incidence oflow income is analyzed here because it is thevariable most commonly employed in the liter-ature both in Canada and the United States asa proxy for poverty level, with an incidence oflow income of 40 percent or above represent-ing a high level of concentrated poverty (Wilson1987; Jargowsky 1997; Kazemipur and Halli 2000;Frenette et al. 2004; Heisz and McLeod 2004).
In order to test whether poverty is increas-ing disproportionately in neighbourhoods withthe highest concentrations of visible minorities,changes in four key indicators of poverty are ex-amined over the decade preceding 2001. Then, or-dinary least squares (OLS) regression models areestimated using the ecological census tract datafor the most segregated metropolises, with theincidence of low income as the dependent vari-able. The independent variables selected for anal-ysis are the proportion of each minority group,the proportion that immigrated in the 1991 to2001 period (‘recent’ immigrants), the neighbour-hood type according to the classification em-ployed here, and the proportions of semi/row,low-rise and high-rise apartment housing in thehousing stock. The visible minority variables areexamined in order to detect any effects of con-centrations of single groups (potentially revealingracial biases or between-group dynamics), whilethe variable for recent immigrants captures theeffects of the spatial settlement of newcomersto Canada, who are known to have lower in-comes upon arrival (Morissette and Drolet 2000;
8 The incidence of low income used in this research refersto the proportion of the population in private householdsliving in a given place (a census tract, for instance) with in-comes below Statistics Canada’s low-income cut-off (LICO).Statistics Canada is careful not to equate their low-incomecut-off (LICO) or low-income measure (LIM) with rates ofpoverty. However, the LICO or LIM are commonly used assurrogates, since few other measures have been producedfor comparing levels of poverty in Canada (one exception isthe recent ‘market-basket measure’, see Heisz and McLeod2004, 12). Papers produced by Statistics Canada (Frenetteet al. 2004; Heisz and McLeod 2004) for instance, followthe U.S. literature (Wilson 1987; Jargowsky and Bane 1991;Jargowsky 1997) when assigning a threshold of 40 percentbeyond which a neighbourhood can be characterized as hav-ing a high degree of ‘low income’ (high poverty in the U.S.discourse). While such a threshold is somewhat arbitrary, wedecided to follow convention in retaining it for this paper.
The Canadian Geographer / Le Geographe canadien 50, no 3 (2006)
282 R. Alan Walks and Larry S. Bourne
Table 2Visible minorities and Aboriginals as a proportion of the population, all CMAs 2001
Visible Other South Latin Arab/ AboriginalCMA Mins. Chinese E. Asian∗ Asian Black Filipino Amer. W. Asian identity
Toronto 36.8 8.8 2.4 10.2 6.7 2.9 1.6 2.0 0.4Vancouver 36.8 17.4 4.0 8.4 0.9 2.9 1.0 1.4 1.9Abbotsford 17.8 1.1 1.7 12.9 0.4 0.4 0.7 0.1 2.9Calgary 17.5 5.5 2.1 3.9 1.4 1.7 0.9 1.2 2.3Edmonton 14.6 4.5 1.5 3.1 1.5 1.5 0.8 1.2 4.4Ottawa-Gatineau 14.1 2.7 1.2 2.1 3.6 0.5 0.7 2.7 1.3Montreal 13.6 1.5 1.4 1.7 4.1 0.5 1.6 2.3 0.3Windsor 12.9 1.9 1.0 2.1 2.7 1.0 0.7 2.9 1.3Winnipeg 12.5 1.7 1.2 1.9 1.7 4.5 0.7 0.3 8.4Kitchener-Waterloo 10.7 1.4 1.7 2.7 1.8 0.3 1.2 0.9 0.8Hamilton 9.8 1.4 1.2 2.2 2.0 0.8 0.8 1.0 1.1London 9.0 1.1 1.2 1.2 1.8 0.4 1.0 1.7 1.3Victoria 8.9 3.7 1.2 1.9 0.7 0.6 0.4 0.2 2.8Halifax 7.0 0.7 0.4 0.7 3.7 0.1 0.1 0.9 1.0Oshawa 7.0 0.8 0.6 1.6 2.4 0.3 0.3 0.3 1.0Saskatoon 5.6 1.8 0.6 0.8 0.7 0.7 0.4 0.4 9.1Regina 5.1 1.2 0.9 0.9 0.8 0.5 0.4 0.3 8.3Kingston 4.6 1.1 0.6 1.1 0.6 0.3 0.4 0.4 1.5St. Catharines-Niagara 4.5 0.7 0.8 0.7 1.0 0.3 0.4 0.4 1.3Kelowna 3.9 0.8 1.0 1.0 0.3 0.2 0.3 0.1 2.7Saint John 2.6 0.4 0.1 0.3 1.2 0.1 0.2 0.2 0.8Sherbrooke 2.5 0.2 0.2 0.1 0.7 0.1 0.7 0.4 0.2Thunder Bay 2.2 0.3 0.5 0.3 0.4 0.2 0.2 0.2 6.8Greater Sudbury 2.0 0.5 0.1 0.3 0.7 0.1 0.1 0.1 4.8Quebec 1.6 0.2 0.3 0.1 0.5 0 0.3 0.2 0.6St. John’s 1.3 0.3 0.1 0.4 0.2 0.1 0 0.2 0.7Trois-Rivieres 0.9 0.1 0.2 0 0.4 0 0.1 0.1 0.5Chicoutimi-Jonquiere 0.6 0.2 0 0 0.2 0 0.1 0 0.7
All CMAs 19.7 5.2 1.8 4.6 3.2 1.5 1.1 1.5 1.6All of Canada 13.4 3.5 1.3 3.1 2.2 1.0 0.7 1.0 3.3
SOURCE: Census of Canada, 2001.NOTE: Proportions greater than the Canadian average are in bold. (∗) Other East Asian aggregates the Southeast Asian (Vietnamese, Thai,Laotian), Korean, and Japanese categories. Aboriginal identity is recorded separately from visible minority status in the 2001 census.
Pendakur and Pendakur 2002; Picot and Hou2003). The neighbourhood types derived fromthe classification scheme are included in orderto test for the impact of relative levels of mi-nority concentration, while the housing variablescontrol for the geography of the existing stock,which has been shown to have effects on thespatial articulation of inequality and neighbour-hood poverty (Murdie 1994b; Ley and Smith 2000;Walks 2001).
Ghettos in Canadian Cities?
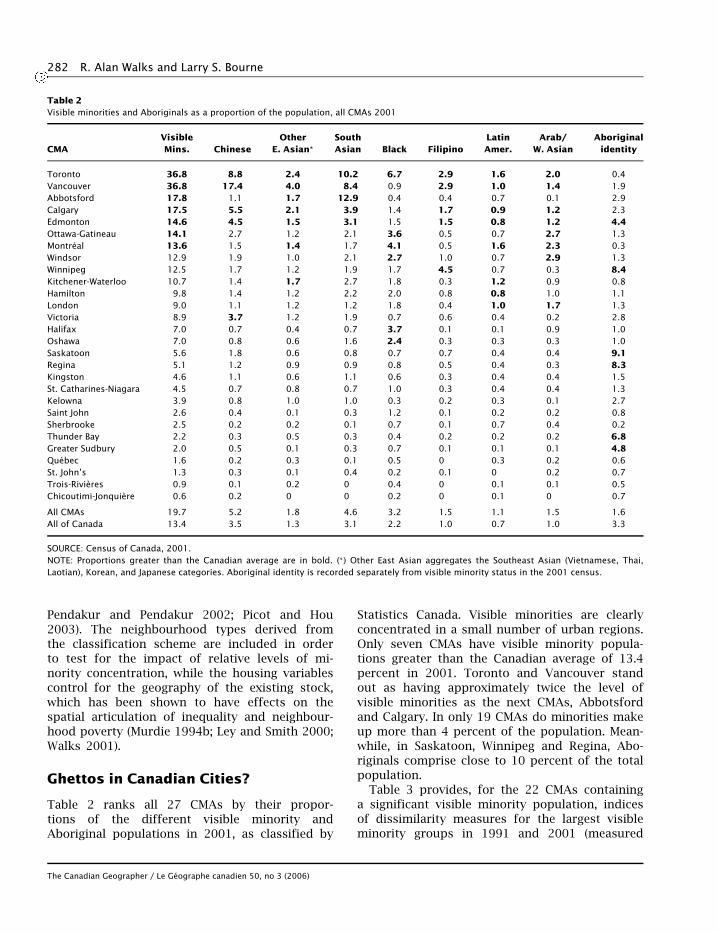
Table 2 ranks all 27 CMAs by their propor-tions of the different visible minority andAboriginal populations in 2001, as classified by
Statistics Canada. Visible minorities are clearlyconcentrated in a small number of urban regions.Only seven CMAs have visible minority popula-tions greater than the Canadian average of 13.4percent in 2001. Toronto and Vancouver standout as having approximately twice the level ofvisible minorities as the next CMAs, Abbotsfordand Calgary. In only 19 CMAs do minorities makeup more than 4 percent of the population. Mean-while, in Saskatoon, Winnipeg and Regina, Abo-riginals comprise close to 10 percent of the totalpopulation.
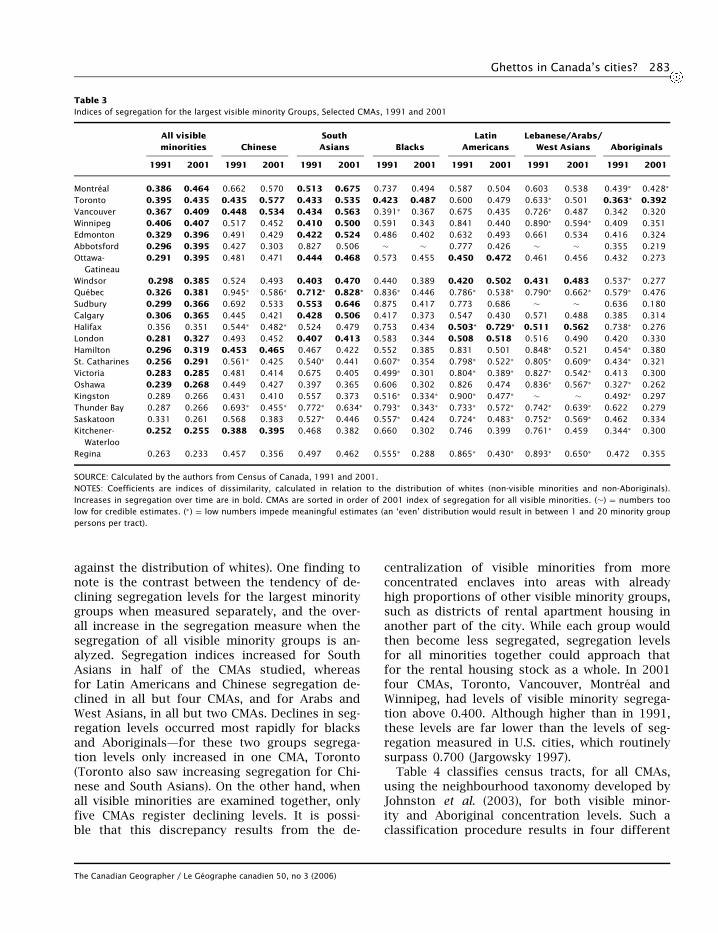
Table 3 provides, for the 22 CMAs containinga significant visible minority population, indicesof dissimilarity measures for the largest visibleminority groups in 1991 and 2001 (measured
The Canadian Geographer / Le Geographe canadien 50, no 3 (2006)
Ghettos in Canada’s cities? 283
Table 3Indices of segregation for the largest visible minority Groups, Selected CMAs, 1991 and 2001
All visible South Latin Lebanese/Arabs/minorities Chinese Asians Blacks Americans West Asians Aboriginals
1991 2001 1991 2001 1991 2001 1991 2001 1991 2001 1991 2001 1991 2001
Montreal 0.386 0.464 0.662 0.570 0.513 0.675 0.737 0.494 0.587 0.504 0.603 0.538 0.439∗ 0.428∗
Toronto 0.395 0.435 0.435 0.577 0.433 0.535 0.423 0.487 0.600 0.479 0.633∗ 0.501 0.363∗ 0.392Vancouver 0.367 0.409 0.448 0.534 0.434 0.563 0.391∗ 0.367 0.675 0.435 0.726∗ 0.487 0.342 0.320Winnipeg 0.406 0.407 0.517 0.452 0.410 0.500 0.591 0.343 0.841 0.440 0.890∗ 0.594∗ 0.409 0.351Edmonton 0.329 0.396 0.491 0.429 0.422 0.524 0.486 0.402 0.632 0.493 0.661 0.534 0.416 0.324Abbotsford 0.296 0.395 0.427 0.303 0.827 0.506 ∼ ∼ 0.777 0.426 ∼ ∼ 0.355 0.219Ottawa-
Gatineau0.291 0.395 0.481 0.471 0.444 0.468 0.573 0.455 0.450 0.472 0.461 0.456 0.432 0.273
Windsor 0.298 0.385 0.524 0.493 0.403 0.470 0.440 0.389 0.420 0.502 0.431 0.483 0.537∗ 0.277Quebec 0.326 0.381 0.945∗ 0.586∗ 0.712∗ 0.828∗ 0.836∗ 0.446 0.786∗ 0.538∗ 0.790∗ 0.662∗ 0.579∗ 0.476Sudbury 0.299 0.366 0.692 0.533 0.553 0.646 0.875 0.417 0.773 0.686 ∼ ∼ 0.636 0.180Calgary 0.306 0.365 0.445 0.421 0.428 0.506 0.417 0.373 0.547 0.430 0.571 0.488 0.385 0.314Halifax 0.356 0.351 0.544∗ 0.482∗ 0.524 0.479 0.753 0.434 0.503∗ 0.729∗ 0.511 0.562 0.738∗ 0.276London 0.281 0.327 0.493 0.452 0.407 0.413 0.583 0.344 0.508 0.518 0.516 0.490 0.420 0.330Hamilton 0.296 0.319 0.453 0.465 0.467 0.422 0.552 0.385 0.831 0.501 0.848∗ 0.521 0.454∗ 0.380St. Catharines 0.256 0.291 0.561∗ 0.425 0.540∗ 0.441 0.607∗ 0.354 0.798∗ 0.522∗ 0.805∗ 0.609∗ 0.434∗ 0.321Victoria 0.283 0.285 0.481 0.414 0.675 0.405 0.499∗ 0.301 0.804∗ 0.389∗ 0.827∗ 0.542∗ 0.413 0.300Oshawa 0.239 0.268 0.449 0.427 0.397 0.365 0.606 0.302 0.826 0.474 0.836∗ 0.567∗ 0.327∗ 0.262Kingston 0.289 0.266 0.431 0.410 0.557 0.373 0.516∗ 0.334∗ 0.900∗ 0.477∗ ∼ ∼ 0.492∗ 0.297Thunder Bay 0.287 0.266 0.693∗ 0.455∗ 0.772∗ 0.634∗ 0.793∗ 0.343∗ 0.733∗ 0.572∗ 0.742∗ 0.639∗ 0.622 0.279Saskatoon 0.331 0.261 0.568 0.383 0.527∗ 0.446 0.557∗ 0.424 0.724∗ 0.483∗ 0.752∗ 0.569∗ 0.462 0.334Kitchener-
Waterloo0.252 0.255 0.388 0.395 0.468 0.382 0.660 0.302 0.746 0.399 0.761∗ 0.459 0.344∗ 0.300
Regina 0.263 0.233 0.457 0.356 0.497 0.462 0.555∗ 0.288 0.865∗ 0.430∗ 0.893∗ 0.650∗ 0.472 0.355
SOURCE: Calculated by the authors from Census of Canada, 1991 and 2001.NOTES: Coefficients are indices of dissimilarity, calculated in relation to the distribution of whites (non-visible minorities and non-Aboriginals).Increases in segregation over time are in bold. CMAs are sorted in order of 2001 index of segregation for all visible minorities. (∼) = numbers toolow for credible estimates. (∗) = low numbers impede meaningful estimates (an ‘even’ distribution would result in between 1 and 20 minority grouppersons per tract).
against the distribution of whites). One finding tonote is the contrast between the tendency of de-clining segregation levels for the largest minoritygroups when measured separately, and the over-all increase in the segregation measure when thesegregation of all visible minority groups is an-alyzed. Segregation indices increased for SouthAsians in half of the CMAs studied, whereasfor Latin Americans and Chinese segregation de-clined in all but four CMAs, and for Arabs andWest Asians, in all but two CMAs. Declines in seg-regation levels occurred most rapidly for blacksand Aboriginals—for these two groups segrega-tion levels only increased in one CMA, Toronto(Toronto also saw increasing segregation for Chi-nese and South Asians). On the other hand, whenall visible minorities are examined together, onlyfive CMAs register declining levels. It is possi-ble that this discrepancy results from the de-
centralization of visible minorities from moreconcentrated enclaves into areas with alreadyhigh proportions of other visible minority groups,such as districts of rental apartment housing inanother part of the city. While each group wouldthen become less segregated, segregation levelsfor all minorities together could approach thatfor the rental housing stock as a whole. In 2001four CMAs, Toronto, Vancouver, Montreal andWinnipeg, had levels of visible minority segrega-tion above 0.400. Although higher than in 1991,these levels are far lower than the levels of seg-regation measured in U.S. cities, which routinelysurpass 0.700 (Jargowsky 1997).
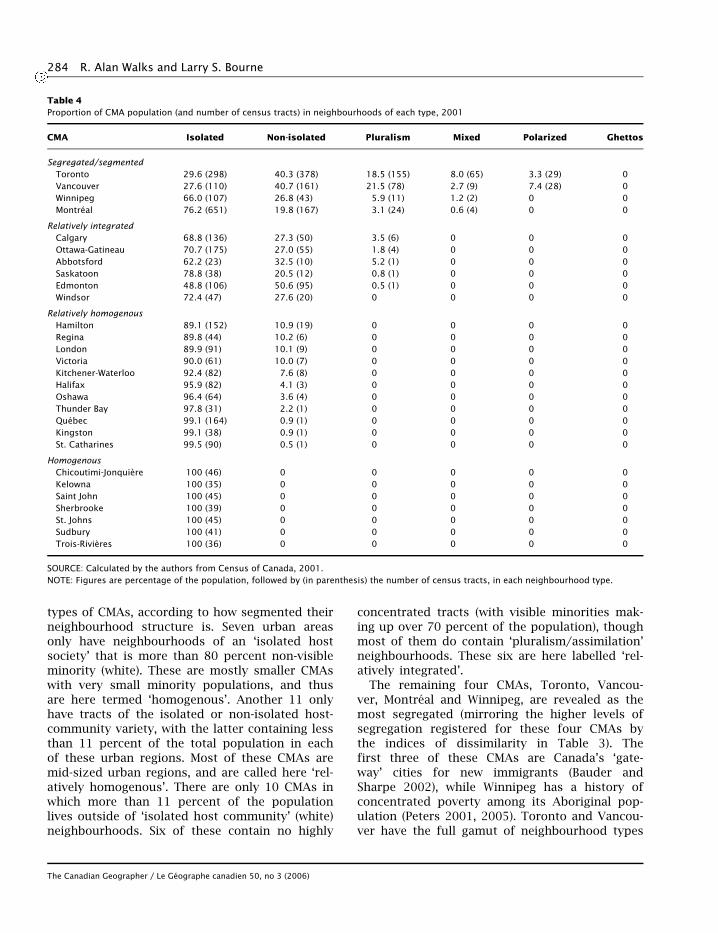
Table 4 classifies census tracts, for all CMAs,using the neighbourhood taxonomy developed byJohnston et al. (2003), for both visible minor-ity and Aboriginal concentration levels. Such aclassification procedure results in four different
The Canadian Geographer / Le Geographe canadien 50, no 3 (2006)
284 R. Alan Walks and Larry S. Bourne
Table 4Proportion of CMA population (and number of census tracts) in neighbourhoods of each type, 2001
CMA Isolated Non-isolated Pluralism Mixed Polarized Ghettos
Segregated/segmentedToronto 29.6 (298) 40.3 (378) 18.5 (155) 8.0 (65) 3.3 (29) 0Vancouver 27.6 (110) 40.7 (161) 21.5 (78) 2.7 (9) 7.4 (28) 0Winnipeg 66.0 (107) 26.8 (43) 5.9 (11) 1.2 (2) 0 0Montreal 76.2 (651) 19.8 (167) 3.1 (24) 0.6 (4) 0 0
Relatively integratedCalgary 68.8 (136) 27.3 (50) 3.5 (6) 0 0 0Ottawa-Gatineau 70.7 (175) 27.0 (55) 1.8 (4) 0 0 0Abbotsford 62.2 (23) 32.5 (10) 5.2 (1) 0 0 0Saskatoon 78.8 (38) 20.5 (12) 0.8 (1) 0 0 0Edmonton 48.8 (106) 50.6 (95) 0.5 (1) 0 0 0Windsor 72.4 (47) 27.6 (20) 0 0 0 0
Relatively homogenousHamilton 89.1 (152) 10.9 (19) 0 0 0 0Regina 89.8 (44) 10.2 (6) 0 0 0 0London 89.9 (91) 10.1 (9) 0 0 0 0Victoria 90.0 (61) 10.0 (7) 0 0 0 0Kitchener-Waterloo 92.4 (82) 7.6 (8) 0 0 0 0Halifax 95.9 (82) 4.1 (3) 0 0 0 0Oshawa 96.4 (64) 3.6 (4) 0 0 0 0Thunder Bay 97.8 (31) 2.2 (1) 0 0 0 0Quebec 99.1 (164) 0.9 (1) 0 0 0 0Kingston 99.1 (38) 0.9 (1) 0 0 0 0St. Catharines 99.5 (90) 0.5 (1) 0 0 0 0
HomogenousChicoutimi-Jonquiere 100 (46) 0 0 0 0 0Kelowna 100 (35) 0 0 0 0 0Saint John 100 (45) 0 0 0 0 0Sherbrooke 100 (39) 0 0 0 0 0St. Johns 100 (45) 0 0 0 0 0Sudbury 100 (41) 0 0 0 0 0Trois-Rivieres 100 (36) 0 0 0 0 0
SOURCE: Calculated by the authors from Census of Canada, 2001.NOTE: Figures are percentage of the population, followed by (in parenthesis) the number of census tracts, in each neighbourhood type.
types of CMAs, according to how segmented theirneighbourhood structure is. Seven urban areasonly have neighbourhoods of an ‘isolated hostsociety’ that is more than 80 percent non-visibleminority (white). These are mostly smaller CMAswith very small minority populations, and thusare here termed ‘homogenous’. Another 11 onlyhave tracts of the isolated or non-isolated host-community variety, with the latter containing lessthan 11 percent of the total population in eachof these urban regions. Most of these CMAs aremid-sized urban regions, and are called here ‘rel-atively homogenous’. There are only 10 CMAs inwhich more than 11 percent of the populationlives outside of ‘isolated host community’ (white)neighbourhoods. Six of these contain no highly
concentrated tracts (with visible minorities mak-ing up over 70 percent of the population), thoughmost of them do contain ‘pluralism/assimilation’neighbourhoods. These six are here labelled ‘rel-atively integrated’.
The remaining four CMAs, Toronto, Vancou-ver, Montreal and Winnipeg, are revealed as themost segregated (mirroring the higher levels ofsegregation registered for these four CMAs bythe indices of dissimilarity in Table 3). Thefirst three of these CMAs are Canada’s ‘gate-way’ cities for new immigrants (Bauder andSharpe 2002), while Winnipeg has a history ofconcentrated poverty among its Aboriginal pop-ulation (Peters 2001, 2005). Toronto and Vancou-ver have the full gamut of neighbourhood types
The Canadian Geographer / Le Geographe canadien 50, no 3 (2006)
Ghettos in Canada’s cities? 285
except for ghettos. Montreal and Winnipeg havemixed-minority tracts but no ghettos or polarizedneighbourhoods. The Chinese dominate approx-imately three-quarters of all polarized tracts inboth Toronto and Vancouver and South Asiansare; dominant in the rest (eight tracts in eachCMA). There are no black (or Hispanic) polarizedtracts in any Canadian CMA.
This classification reveals an absence of ur-ban ghettos anywhere in Canada. On the sur-face, this exercise would seem to place Canadiancities in general in a relatively positive light incomparison with both its U.S. neighbours (John-ston et al. 2003) and some British cities (John-ston et al. 2002). However, all four of the mostsegregated Canadian cities (Vancouver, Toronto,Winnipeg, Montreal) appear more segregated thaneither London or Sydney. Thus, at least for someCanadian CMAs, there could be grounds for con-cern that previous processes of spatial assimila-tion (Hiebert and Ley 2003) might be breakingdown, particularly if such neighbourhoods showdeclining incomes. Of course, it is also possiblethat the growth of concentrated visible minorityneighbourhoods is the end result of a culturalstrategy of ethnic community formation (Loganet al. 2002). If so, they might be expected to bewealthier than average, and thus less problem-atic, at least from the perspectives of ghettoiza-tion or social exclusion. In Canadian cities, it isSouth Asians and Chinese that are most segre-gated, again revealing greater similarities to theBritish rather than U.S. context.
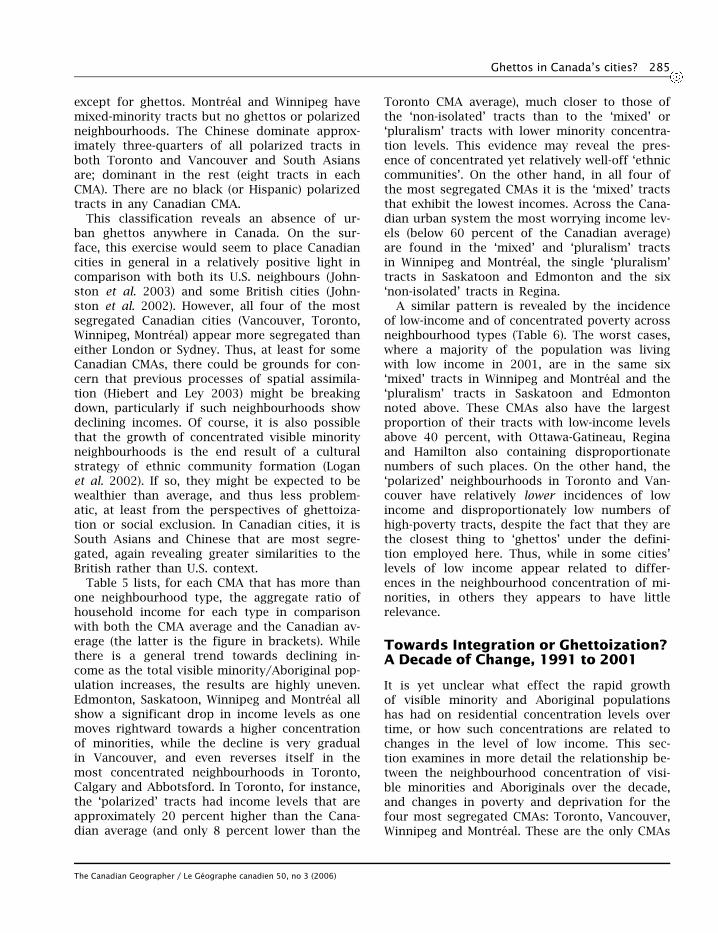
Table 5 lists, for each CMA that has more thanone neighbourhood type, the aggregate ratio ofhousehold income for each type in comparisonwith both the CMA average and the Canadian av-erage (the latter is the figure in brackets). Whilethere is a general trend towards declining in-come as the total visible minority/Aboriginal pop-ulation increases, the results are highly uneven.Edmonton, Saskatoon, Winnipeg and Montreal allshow a significant drop in income levels as onemoves rightward towards a higher concentrationof minorities, while the decline is very gradualin Vancouver, and even reverses itself in themost concentrated neighbourhoods in Toronto,Calgary and Abbotsford. In Toronto, for instance,the ‘polarized’ tracts had income levels that areapproximately 20 percent higher than the Cana-dian average (and only 8 percent lower than the
Toronto CMA average), much closer to those ofthe ‘non-isolated’ tracts than to the ‘mixed’ or‘pluralism’ tracts with lower minority concentra-tion levels. This evidence may reveal the pres-ence of concentrated yet relatively well-off ‘ethniccommunities’. On the other hand, in all four ofthe most segregated CMAs it is the ‘mixed’ tractsthat exhibit the lowest incomes. Across the Cana-dian urban system the most worrying income lev-els (below 60 percent of the Canadian average)are found in the ‘mixed’ and ‘pluralism’ tractsin Winnipeg and Montreal, the single ‘pluralism’tracts in Saskatoon and Edmonton and the six‘non-isolated’ tracts in Regina.
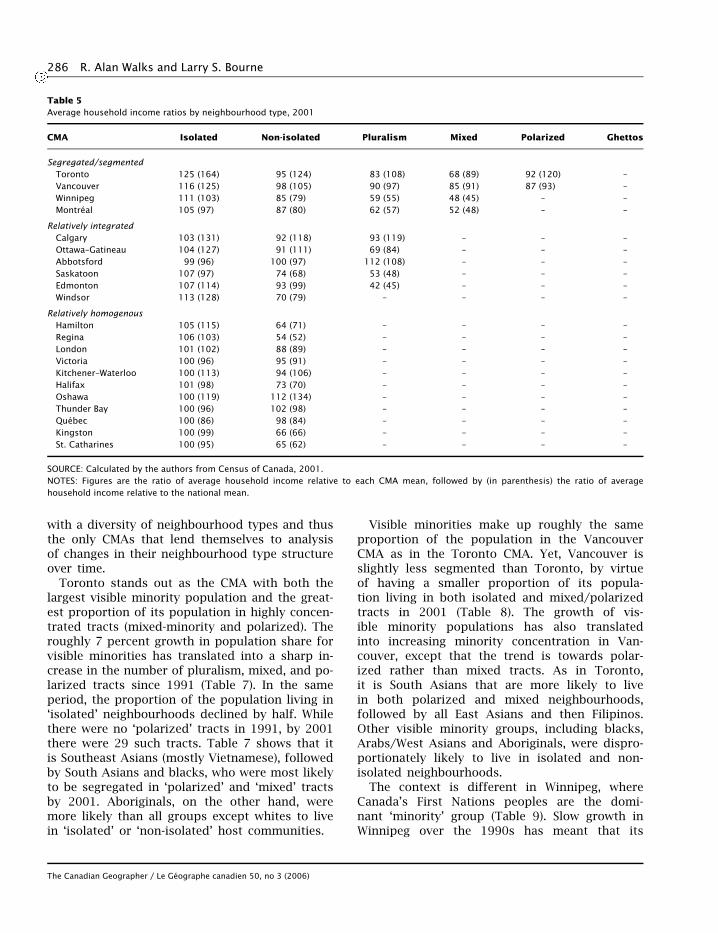
A similar pattern is revealed by the incidenceof low-income and of concentrated poverty acrossneighbourhood types (Table 6). The worst cases,where a majority of the population was livingwith low income in 2001, are in the same six‘mixed’ tracts in Winnipeg and Montreal and the‘pluralism’ tracts in Saskatoon and Edmontonnoted above. These CMAs also have the largestproportion of their tracts with low-income levelsabove 40 percent, with Ottawa-Gatineau, Reginaand Hamilton also containing disproportionatenumbers of such places. On the other hand, the‘polarized’ neighbourhoods in Toronto and Van-couver have relatively lower incidences of lowincome and disproportionately low numbers ofhigh-poverty tracts, despite the fact that they arethe closest thing to ‘ghettos’ under the defini-tion employed here. Thus, while in some cities’levels of low income appear related to differ-ences in the neighbourhood concentration of mi-norities, in others they appears to have littlerelevance.
Towards Integration or Ghettoization?A Decade of Change, 1991 to 2001
It is yet unclear what effect the rapid growthof visible minority and Aboriginal populationshas had on residential concentration levels overtime, or how such concentrations are related tochanges in the level of low income. This sec-tion examines in more detail the relationship be-tween the neighbourhood concentration of visi-ble minorities and Aboriginals over the decade,and changes in poverty and deprivation for thefour most segregated CMAs: Toronto, Vancouver,Winnipeg and Montreal. These are the only CMAs
The Canadian Geographer / Le Geographe canadien 50, no 3 (2006)
286 R. Alan Walks and Larry S. Bourne
Table 5Average household income ratios by neighbourhood type, 2001
CMA Isolated Non-isolated Pluralism Mixed Polarized Ghettos
Segregated/segmentedToronto 125 (164) 95 (124) 83 (108) 68 (89) 92 (120) –Vancouver 116 (125) 98 (105) 90 (97) 85 (91) 87 (93) –Winnipeg 111 (103) 85 (79) 59 (55) 48 (45) – –Montreal 105 (97) 87 (80) 62 (57) 52 (48) – –
Relatively integratedCalgary 103 (131) 92 (118) 93 (119) – – –Ottawa–Gatineau 104 (127) 91 (111) 69 (84) – – –Abbotsford 99 (96) 100 (97) 112 (108) – – –Saskatoon 107 (97) 74 (68) 53 (48) – – –Edmonton 107 (114) 93 (99) 42 (45) – – –Windsor 113 (128) 70 (79) – – – –
Relatively homogenousHamilton 105 (115) 64 (71) – – – –Regina 106 (103) 54 (52) – – – –London 101 (102) 88 (89) – – – –Victoria 100 (96) 95 (91) – – – –Kitchener–Waterloo 100 (113) 94 (106) – – – –Halifax 101 (98) 73 (70) – – – –Oshawa 100 (119) 112 (134) – – – –Thunder Bay 100 (96) 102 (98) – – – –Quebec 100 (86) 98 (84) – – – –Kingston 100 (99) 66 (66) – – – –St. Catharines 100 (95) 65 (62) – – – –
SOURCE: Calculated by the authors from Census of Canada, 2001.NOTES: Figures are the ratio of average household income relative to each CMA mean, followed by (in parenthesis) the ratio of averagehousehold income relative to the national mean.
with a diversity of neighbourhood types and thusthe only CMAs that lend themselves to analysisof changes in their neighbourhood type structureover time.
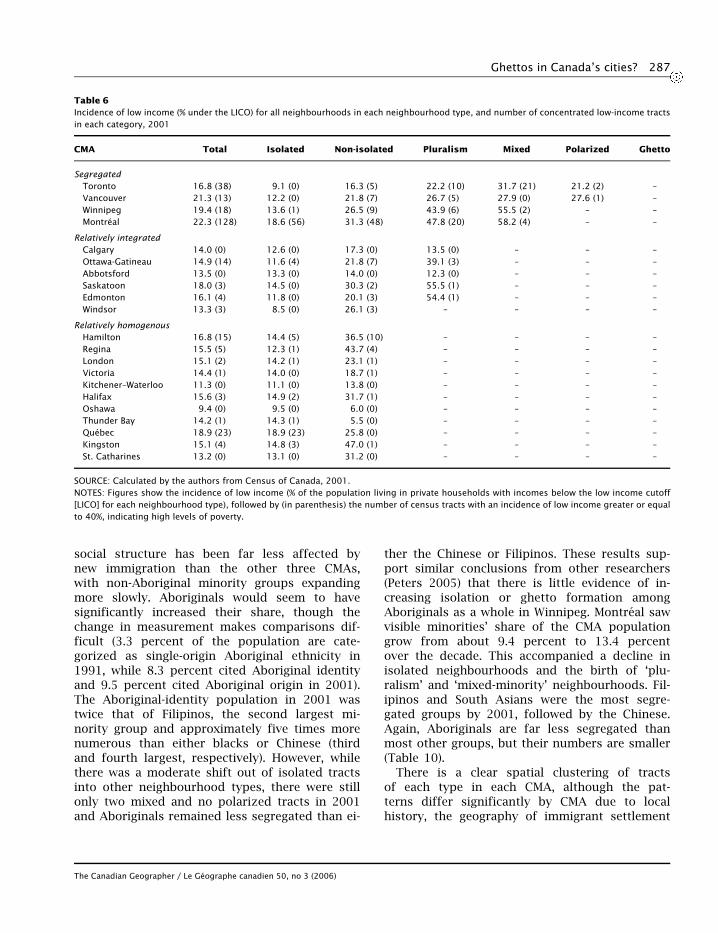
Toronto stands out as the CMA with both thelargest visible minority population and the great-est proportion of its population in highly concen-trated tracts (mixed-minority and polarized). Theroughly 7 percent growth in population share forvisible minorities has translated into a sharp in-crease in the number of pluralism, mixed, and po-larized tracts since 1991 (Table 7). In the sameperiod, the proportion of the population living in‘isolated’ neighbourhoods declined by half. Whilethere were no ‘polarized’ tracts in 1991, by 2001there were 29 such tracts. Table 7 shows that itis Southeast Asians (mostly Vietnamese), followedby South Asians and blacks, who were most likelyto be segregated in ‘polarized’ and ‘mixed’ tractsby 2001. Aboriginals, on the other hand, weremore likely than all groups except whites to livein ‘isolated’ or ‘non-isolated’ host communities.
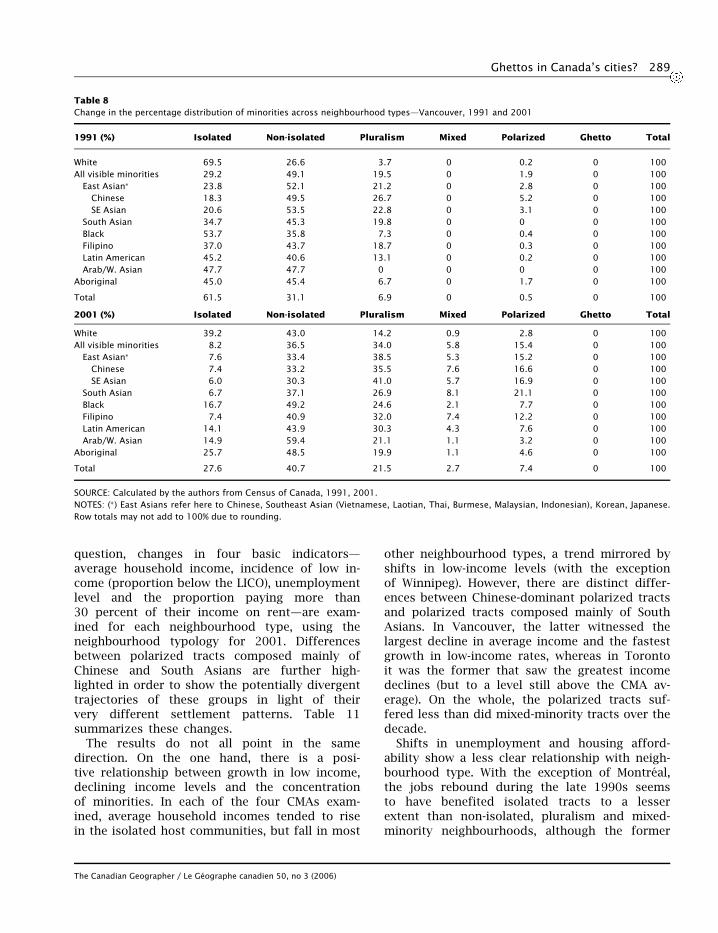
Visible minorities make up roughly the sameproportion of the population in the VancouverCMA as in the Toronto CMA. Yet, Vancouver isslightly less segmented than Toronto, by virtueof having a smaller proportion of its popula-tion living in both isolated and mixed/polarizedtracts in 2001 (Table 8). The growth of vis-ible minority populations has also translatedinto increasing minority concentration in Van-couver, except that the trend is towards polar-ized rather than mixed tracts. As in Toronto,it is South Asians that are more likely to livein both polarized and mixed neighbourhoods,followed by all East Asians and then Filipinos.Other visible minority groups, including blacks,Arabs/West Asians and Aboriginals, were dispro-portionately likely to live in isolated and non-isolated neighbourhoods.
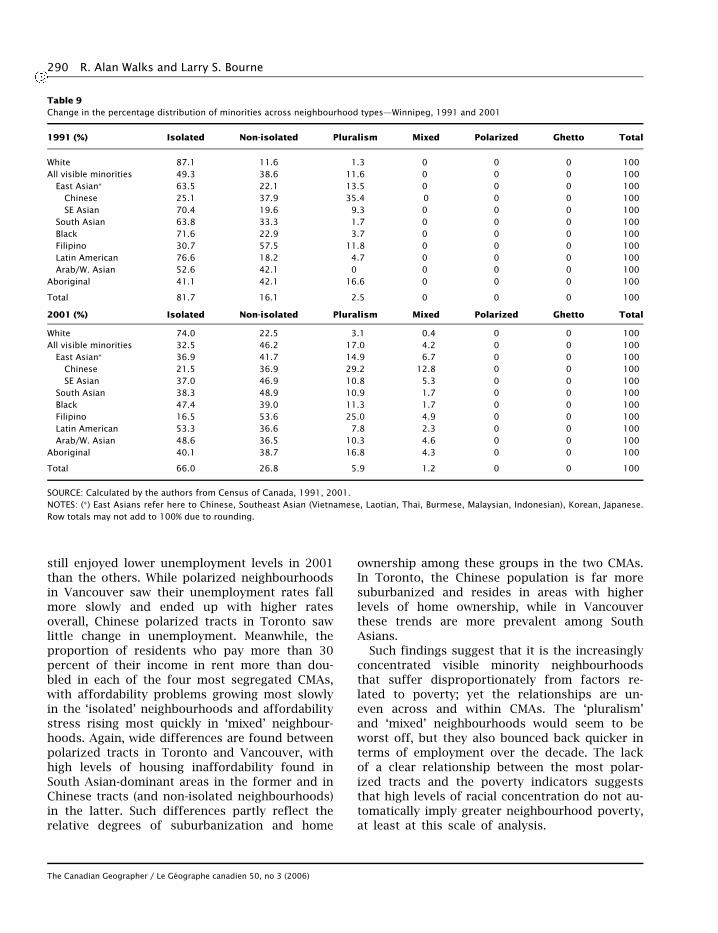
The context is different in Winnipeg, whereCanada’s First Nations peoples are the domi-nant ‘minority’ group (Table 9). Slow growth inWinnipeg over the 1990s has meant that its
The Canadian Geographer / Le Geographe canadien 50, no 3 (2006)
Ghettos in Canada’s cities? 287
Table 6Incidence of low income (% under the LICO) for all neighbourhoods in each neighbourhood type, and number of concentrated low-income tractsin each category, 2001
CMA Total Isolated Non-isolated Pluralism Mixed Polarized Ghetto
SegregatedToronto 16.8 (38) 9.1 (0) 16.3 (5) 22.2 (10) 31.7 (21) 21.2 (2) –Vancouver 21.3 (13) 12.2 (0) 21.8 (7) 26.7 (5) 27.9 (0) 27.6 (1) –Winnipeg 19.4 (18) 13.6 (1) 26.5 (9) 43.9 (6) 55.5 (2) – –Montreal 22.3 (128) 18.6 (56) 31.3 (48) 47.8 (20) 58.2 (4) – –
Relatively integratedCalgary 14.0 (0) 12.6 (0) 17.3 (0) 13.5 (0) – – –Ottawa-Gatineau 14.9 (14) 11.6 (4) 21.8 (7) 39.1 (3) – – –Abbotsford 13.5 (0) 13.3 (0) 14.0 (0) 12.3 (0) – – –Saskatoon 18.0 (3) 14.5 (0) 30.3 (2) 55.5 (1) – – –Edmonton 16.1 (4) 11.8 (0) 20.1 (3) 54.4 (1) – – –Windsor 13.3 (3) 8.5 (0) 26.1 (3) – – – –
Relatively homogenousHamilton 16.8 (15) 14.4 (5) 36.5 (10) – – – –Regina 15.5 (5) 12.3 (1) 43.7 (4) – – – –London 15.1 (2) 14.2 (1) 23.1 (1) – – – –Victoria 14.4 (1) 14.0 (0) 18.7 (1) – – – –Kitchener–Waterloo 11.3 (0) 11.1 (0) 13.8 (0) – – – –Halifax 15.6 (3) 14.9 (2) 31.7 (1) – – – –Oshawa 9.4 (0) 9.5 (0) 6.0 (0) – – – –Thunder Bay 14.2 (1) 14.3 (1) 5.5 (0) – – – –Quebec 18.9 (23) 18.9 (23) 25.8 (0) – – – –Kingston 15.1 (4) 14.8 (3) 47.0 (1) – – – –St. Catharines 13.2 (0) 13.1 (0) 31.2 (0) – – – –
SOURCE: Calculated by the authors from Census of Canada, 2001.NOTES: Figures show the incidence of low income (% of the population living in private households with incomes below the low income cutoff[LICO] for each neighbourhood type), followed by (in parenthesis) the number of census tracts with an incidence of low income greater or equalto 40%, indicating high levels of poverty.
social structure has been far less affected bynew immigration than the other three CMAs,with non-Aboriginal minority groups expandingmore slowly. Aboriginals would seem to havesignificantly increased their share, though thechange in measurement makes comparisons dif-ficult (3.3 percent of the population are cate-gorized as single-origin Aboriginal ethnicity in1991, while 8.3 percent cited Aboriginal identityand 9.5 percent cited Aboriginal origin in 2001).The Aboriginal-identity population in 2001 wastwice that of Filipinos, the second largest mi-nority group and approximately five times morenumerous than either blacks or Chinese (thirdand fourth largest, respectively). However, whilethere was a moderate shift out of isolated tractsinto other neighbourhood types, there were stillonly two mixed and no polarized tracts in 2001and Aboriginals remained less segregated than ei-
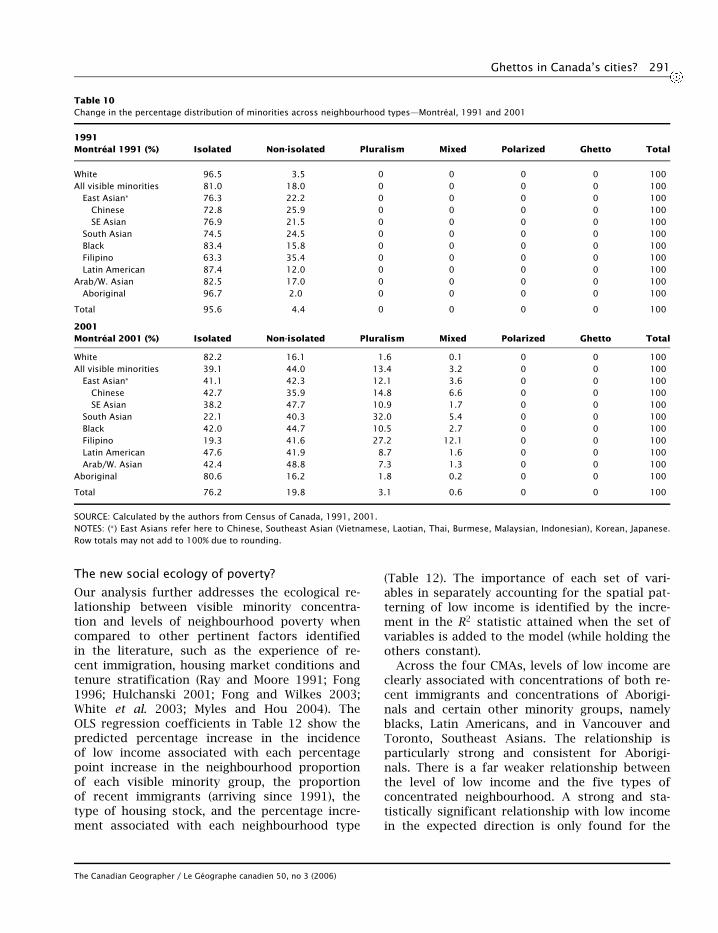
ther the Chinese or Filipinos. These results sup-port similar conclusions from other researchers(Peters 2005) that there is little evidence of in-creasing isolation or ghetto formation amongAboriginals as a whole in Winnipeg. Montreal sawvisible minorities’ share of the CMA populationgrow from about 9.4 percent to 13.4 percentover the decade. This accompanied a decline inisolated neighbourhoods and the birth of ‘plu-ralism’ and ‘mixed-minority’ neighbourhoods. Fil-ipinos and South Asians were the most segre-gated groups by 2001, followed by the Chinese.Again, Aboriginals are far less segregated thanmost other groups, but their numbers are smaller(Table 10).
There is a clear spatial clustering of tractsof each type in each CMA, although the pat-terns differ significantly by CMA due to localhistory, the geography of immigrant settlement
The Canadian Geographer / Le Geographe canadien 50, no 3 (2006)
288 R. Alan Walks and Larry S. Bourne
Table 7Change in the percentage distribution of minorities across neighbourhood types—Toronto, 1991 and 2001
1991 (%) Isolated Non-isolated Pluralism Mixed Polarized Ghetto Total
White 70.4 27.1 2.3 0.1 0 0 100All visible minorities 33.1 49.4 15.5 1.8 0 0 100
East Asian∗ 30.0 48.9 18.9 1.7 0 0 100Chinese 37.7 54.6 6.8 0.1 0 0 100SE Asian 25.8 49.7 22.1 2.1 0 0 100
South Asian 30.4 55.9 11.4 2.0 0 0 100Black 32.2 56.5 9.6 1.2 0 0 100Filipino 39.4 48.8 9.8 1.5 0 0 100Latin American 41.0 48.8 8.9 0.9 0 0 100Arab/W. Asian 44.8 48.4 4.0 0 0 0 100
Aboriginal 58.9 34.4 1.7 0.2 0 0 100
Total 63.3 31.7 4.4 0.4 0 0 100
2001 (%) Isolated Non-isolated Pluralism Mixed Polarized Ghetto Total
White 42.2 42.4 11.9 2.5 1.1 0 100All visible minorities 8.1 36.8 30.1 17.7 7.2 0 100
East Asian∗ 8.7 33.7 30.1 14.4 13.0 0 100Chinese 10.3 39.8 31.4 15.6 2.6 0 100SE Asian 6.8 31.0 30.8 15.4 15.9 0 100
South Asian 6.0 31.7 32.7 22.6 7.1 0 100Black 7.5 40.8 29.0 19.3 3.2 0 100Filipino 9.3 44.7 27.1 15.7 3.0 0 100Latin American 11.4 50.9 24.7 11.3 1.5 0 100Arab/W. Asian 11.2 39.9 31.7 13.9 3.1 0 100
Aboriginal 34.2 47.2 12.7 3.9 1.4 0 100
Total 29.6 40.3 18.5 8.0 3.3 0 100
SOURCE: Calculated by the authors from Census of Canada, 1991, 2001.NOTES: (∗) East Asians refer here to Chinese, Southeast Asian (Vietnamese, Laotian, Thai, Burmese, Malaysian, Indonesian), Korean, Japanese.Row totals may not add to 100% due to rounding.
and development in each locality and the effectsof public policies. In Toronto and Vancouver,visible minorities show strong concentrations inthe suburbs, in accordance with previously notedtrends showing increasing settlement of immi-grants in these areas (Ray et al. 1997; Walks2001). In contrast, in Winnipeg, Aboriginals andvisible minorities are still clustered in centralneighbourhoods. Montreal shows a pattern ofdecentralized clusters both within the city and ininner-suburban areas, but virtually all on the Is-land of Montreal.
The distribution of polarized tracts in Van-couver reveals two distinct clusters, with theChinese found in Richmond and southeast Van-couver city, while South Asians are clustered incentral Surrey. Mixed-minority tracts fill up muchof the space between them. The geography ofthese two groups is different in Toronto owingin part to their very different times of arrival.
Polarized tracts in which the Chinese are domi-nant are clustered in northern Scarborough andwest Markham, areas with a high proportion ofowner-occupied housing, whereas polarized tractsdominated by South Asians are decentralized,peppered across the inner and outer suburbs invastly different types of neighbourhoods. Mixed-minority tracts, it should be noted, are mostlyfound in districts with the highest concentrationsof social housing and high-rise rental apartmenthousing. In most cases, isolated host communi-ties also have their own distinct geography, fol-lowing closely sectors of high income (see Bourne1993; Walks 2001).
Minority neighbourhoodsand concentrated poverty
Is the concentration of visible minorities inminority–majority neighbourhoods associatedwith an increase in poverty? To answer this
The Canadian Geographer / Le Geographe canadien 50, no 3 (2006)
Ghettos in Canada’s cities? 289
Table 8Change in the percentage distribution of minorities across neighbourhood types—Vancouver, 1991 and 2001
1991 (%) Isolated Non-isolated Pluralism Mixed Polarized Ghetto Total
White 69.5 26.6 3.7 0 0.2 0 100All visible minorities 29.2 49.1 19.5 0 1.9 0 100
East Asian∗ 23.8 52.1 21.2 0 2.8 0 100Chinese 18.3 49.5 26.7 0 5.2 0 100SE Asian 20.6 53.5 22.8 0 3.1 0 100
South Asian 34.7 45.3 19.8 0 0 0 100Black 53.7 35.8 7.3 0 0.4 0 100Filipino 37.0 43.7 18.7 0 0.3 0 100Latin American 45.2 40.6 13.1 0 0.2 0 100Arab/W. Asian 47.7 47.7 0 0 0 0 100
Aboriginal 45.0 45.4 6.7 0 1.7 0 100
Total 61.5 31.1 6.9 0 0.5 0 100
2001 (%) Isolated Non-isolated Pluralism Mixed Polarized Ghetto Total
White 39.2 43.0 14.2 0.9 2.8 0 100All visible minorities 8.2 36.5 34.0 5.8 15.4 0 100
East Asian∗ 7.6 33.4 38.5 5.3 15.2 0 100Chinese 7.4 33.2 35.5 7.6 16.6 0 100SE Asian 6.0 30.3 41.0 5.7 16.9 0 100
South Asian 6.7 37.1 26.9 8.1 21.1 0 100Black 16.7 49.2 24.6 2.1 7.7 0 100Filipino 7.4 40.9 32.0 7.4 12.2 0 100Latin American 14.1 43.9 30.3 4.3 7.6 0 100Arab/W. Asian 14.9 59.4 21.1 1.1 3.2 0 100
Aboriginal 25.7 48.5 19.9 1.1 4.6 0 100
Total 27.6 40.7 21.5 2.7 7.4 0 100
SOURCE: Calculated by the authors from Census of Canada, 1991, 2001.NOTES: (∗) East Asians refer here to Chinese, Southeast Asian (Vietnamese, Laotian, Thai, Burmese, Malaysian, Indonesian), Korean, Japanese.Row totals may not add to 100% due to rounding.
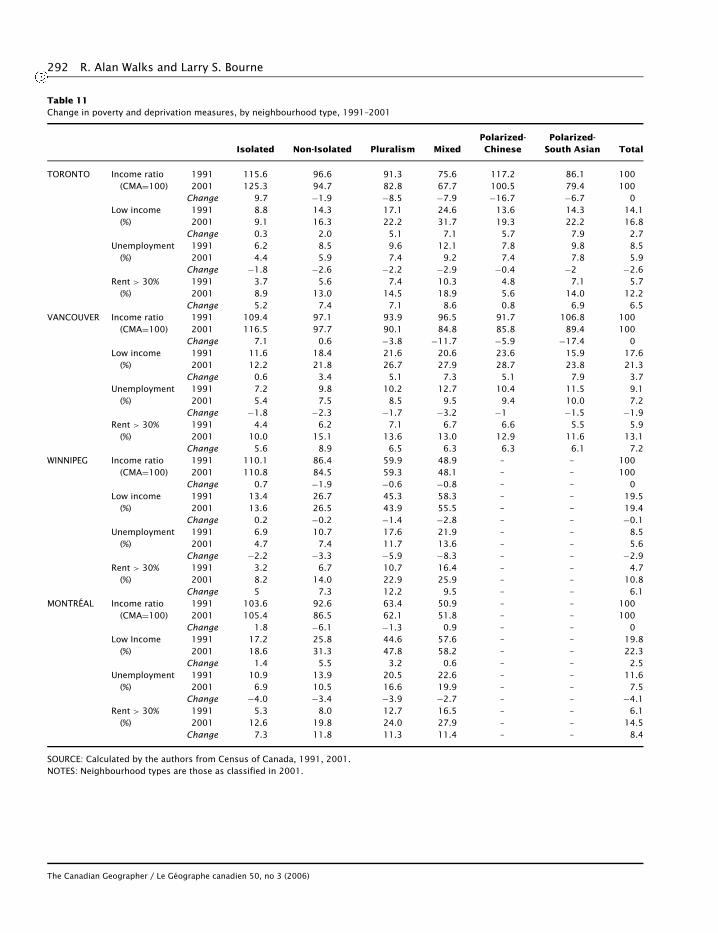
question, changes in four basic indicators—average household income, incidence of low in-come (proportion below the LICO), unemploymentlevel and the proportion paying more than30 percent of their income on rent—are exam-ined for each neighbourhood type, using theneighbourhood typology for 2001. Differencesbetween polarized tracts composed mainly ofChinese and South Asians are further high-lighted in order to show the potentially divergenttrajectories of these groups in light of theirvery different settlement patterns. Table 11summarizes these changes.
The results do not all point in the samedirection. On the one hand, there is a posi-tive relationship between growth in low income,declining income levels and the concentrationof minorities. In each of the four CMAs exam-ined, average household incomes tended to risein the isolated host communities, but fall in most
other neighbourhood types, a trend mirrored byshifts in low-income levels (with the exceptionof Winnipeg). However, there are distinct differ-ences between Chinese-dominant polarized tractsand polarized tracts composed mainly of SouthAsians. In Vancouver, the latter witnessed thelargest decline in average income and the fastestgrowth in low-income rates, whereas in Torontoit was the former that saw the greatest incomedeclines (but to a level still above the CMA av-erage). On the whole, the polarized tracts suf-fered less than did mixed-minority tracts over thedecade.
Shifts in unemployment and housing afford-ability show a less clear relationship with neigh-bourhood type. With the exception of Montreal,the jobs rebound during the late 1990s seemsto have benefited isolated tracts to a lesserextent than non-isolated, pluralism and mixed-minority neighbourhoods, although the former
The Canadian Geographer / Le Geographe canadien 50, no 3 (2006)
290 R. Alan Walks and Larry S. Bourne
Table 9Change in the percentage distribution of minorities across neighbourhood types—Winnipeg, 1991 and 2001
1991 (%) Isolated Non-isolated Pluralism Mixed Polarized Ghetto Total
White 87.1 11.6 1.3 0 0 0 100All visible minorities 49.3 38.6 11.6 0 0 0 100
East Asian∗ 63.5 22.1 13.5 0 0 0 100Chinese 25.1 37.9 35.4 0 0 0 100SE Asian 70.4 19.6 9.3 0 0 0 100
South Asian 63.8 33.3 1.7 0 0 0 100Black 71.6 22.9 3.7 0 0 0 100Filipino 30.7 57.5 11.8 0 0 0 100Latin American 76.6 18.2 4.7 0 0 0 100Arab/W. Asian 52.6 42.1 0 0 0 0 100
Aboriginal 41.1 42.1 16.6 0 0 0 100
Total 81.7 16.1 2.5 0 0 0 100
2001 (%) Isolated Non-isolated Pluralism Mixed Polarized Ghetto Total
White 74.0 22.5 3.1 0.4 0 0 100All visible minorities 32.5 46.2 17.0 4.2 0 0 100
East Asian∗ 36.9 41.7 14.9 6.7 0 0 100Chinese 21.5 36.9 29.2 12.8 0 0 100SE Asian 37.0 46.9 10.8 5.3 0 0 100
South Asian 38.3 48.9 10.9 1.7 0 0 100Black 47.4 39.0 11.3 1.7 0 0 100Filipino 16.5 53.6 25.0 4.9 0 0 100Latin American 53.3 36.6 7.8 2.3 0 0 100Arab/W. Asian 48.6 36.5 10.3 4.6 0 0 100
Aboriginal 40.1 38.7 16.8 4.3 0 0 100
Total 66.0 26.8 5.9 1.2 0 0 100
SOURCE: Calculated by the authors from Census of Canada, 1991, 2001.NOTES: (∗) East Asians refer here to Chinese, Southeast Asian (Vietnamese, Laotian, Thai, Burmese, Malaysian, Indonesian), Korean, Japanese.Row totals may not add to 100% due to rounding.
still enjoyed lower unemployment levels in 2001than the others. While polarized neighbourhoodsin Vancouver saw their unemployment rates fallmore slowly and ended up with higher ratesoverall, Chinese polarized tracts in Toronto sawlittle change in unemployment. Meanwhile, theproportion of residents who pay more than 30percent of their income in rent more than dou-bled in each of the four most segregated CMAs,with affordability problems growing most slowlyin the ‘isolated’ neighbourhoods and affordabilitystress rising most quickly in ‘mixed’ neighbour-hoods. Again, wide differences are found betweenpolarized tracts in Toronto and Vancouver, withhigh levels of housing inaffordability found inSouth Asian-dominant areas in the former and inChinese tracts (and non-isolated neighbourhoods)in the latter. Such differences partly reflect therelative degrees of suburbanization and home
ownership among these groups in the two CMAs.In Toronto, the Chinese population is far moresuburbanized and resides in areas with higherlevels of home ownership, while in Vancouverthese trends are more prevalent among SouthAsians.
Such findings suggest that it is the increasinglyconcentrated visible minority neighbourhoodsthat suffer disproportionately from factors re-lated to poverty; yet the relationships are un-even across and within CMAs. The ‘pluralism’and ‘mixed’ neighbourhoods would seem to beworst off, but they also bounced back quicker interms of employment over the decade. The lackof a clear relationship between the most polar-ized tracts and the poverty indicators suggeststhat high levels of racial concentration do not au-tomatically imply greater neighbourhood poverty,at least at this scale of analysis.
The Canadian Geographer / Le Geographe canadien 50, no 3 (2006)
Ghettos in Canada’s cities? 291
Table 10Change in the percentage distribution of minorities across neighbourhood types—Montreal, 1991 and 2001
1991Montreal 1991 (%) Isolated Non-isolated Pluralism Mixed Polarized Ghetto Total
White 96.5 3.5 0 0 0 0 100All visible minorities 81.0 18.0 0 0 0 0 100
East Asian∗ 76.3 22.2 0 0 0 0 100Chinese 72.8 25.9 0 0 0 0 100SE Asian 76.9 21.5 0 0 0 0 100
South Asian 74.5 24.5 0 0 0 0 100Black 83.4 15.8 0 0 0 0 100Filipino 63.3 35.4 0 0 0 0 100Latin American 87.4 12.0 0 0 0 0 100
Arab/W. Asian 82.5 17.0 0 0 0 0 100Aboriginal 96.7 2.0 0 0 0 0 100
Total 95.6 4.4 0 0 0 0 100
2001Montreal 2001 (%) Isolated Non-isolated Pluralism Mixed Polarized Ghetto Total
White 82.2 16.1 1.6 0.1 0 0 100All visible minorities 39.1 44.0 13.4 3.2 0 0 100
East Asian∗ 41.1 42.3 12.1 3.6 0 0 100Chinese 42.7 35.9 14.8 6.6 0 0 100SE Asian 38.2 47.7 10.9 1.7 0 0 100
South Asian 22.1 40.3 32.0 5.4 0 0 100Black 42.0 44.7 10.5 2.7 0 0 100Filipino 19.3 41.6 27.2 12.1 0 0 100Latin American 47.6 41.9 8.7 1.6 0 0 100Arab/W. Asian 42.4 48.8 7.3 1.3 0 0 100
Aboriginal 80.6 16.2 1.8 0.2 0 0 100
Total 76.2 19.8 3.1 0.6 0 0 100
SOURCE: Calculated by the authors from Census of Canada, 1991, 2001.NOTES: (∗) East Asians refer here to Chinese, Southeast Asian (Vietnamese, Laotian, Thai, Burmese, Malaysian, Indonesian), Korean, Japanese.Row totals may not add to 100% due to rounding.
The new social ecology of poverty?
Our analysis further addresses the ecological re-lationship between visible minority concentra-tion and levels of neighbourhood poverty whencompared to other pertinent factors identifiedin the literature, such as the experience of re-cent immigration, housing market conditions andtenure stratification (Ray and Moore 1991; Fong1996; Hulchanski 2001; Fong and Wilkes 2003;White et al. 2003; Myles and Hou 2004). TheOLS regression coefficients in Table 12 show thepredicted percentage increase in the incidenceof low income associated with each percentagepoint increase in the neighbourhood proportionof each visible minority group, the proportionof recent immigrants (arriving since 1991), thetype of housing stock, and the percentage incre-ment associated with each neighbourhood type
(Table 12). The importance of each set of vari-ables in separately accounting for the spatial pat-terning of low income is identified by the incre-ment in the R2 statistic attained when the set ofvariables is added to the model (while holding theothers constant).
Across the four CMAs, levels of low income areclearly associated with concentrations of both re-cent immigrants and concentrations of Aborigi-nals and certain other minority groups, namelyblacks, Latin Americans, and in Vancouver andToronto, Southeast Asians. The relationship isparticularly strong and consistent for Aborigi-nals. There is a far weaker relationship betweenthe level of low income and the five types ofconcentrated neighbourhood. A strong and sta-tistically significant relationship with low incomein the expected direction is only found for the
The Canadian Geographer / Le Geographe canadien 50, no 3 (2006)
292 R. Alan Walks and Larry S. Bourne
Table 11Change in poverty and deprivation measures, by neighbourhood type, 1991–2001
Polarized- Polarized-Isolated Non-Isolated Pluralism Mixed Chinese South Asian Total
TORONTO Income ratio 1991 115.6 96.6 91.3 75.6 117.2 86.1 100(CMA=100) 2001 125.3 94.7 82.8 67.7 100.5 79.4 100
Change 9.7 −1.9 −8.5 −7.9 −16.7 −6.7 0Low income 1991 8.8 14.3 17.1 24.6 13.6 14.3 14.1
(%) 2001 9.1 16.3 22.2 31.7 19.3 22.2 16.8Change 0.3 2.0 5.1 7.1 5.7 7.9 2.7
Unemployment 1991 6.2 8.5 9.6 12.1 7.8 9.8 8.5(%) 2001 4.4 5.9 7.4 9.2 7.4 7.8 5.9
Change −1.8 −2.6 −2.2 −2.9 −0.4 −2 −2.6Rent > 30% 1991 3.7 5.6 7.4 10.3 4.8 7.1 5.7
(%) 2001 8.9 13.0 14.5 18.9 5.6 14.0 12.2Change 5.2 7.4 7.1 8.6 0.8 6.9 6.5
VANCOUVER Income ratio 1991 109.4 97.1 93.9 96.5 91.7 106.8 100(CMA=100) 2001 116.5 97.7 90.1 84.8 85.8 89.4 100
Change 7.1 0.6 −3.8 −11.7 −5.9 −17.4 0Low income 1991 11.6 18.4 21.6 20.6 23.6 15.9 17.6
(%) 2001 12.2 21.8 26.7 27.9 28.7 23.8 21.3Change 0.6 3.4 5.1 7.3 5.1 7.9 3.7
Unemployment 1991 7.2 9.8 10.2 12.7 10.4 11.5 9.1(%) 2001 5.4 7.5 8.5 9.5 9.4 10.0 7.2
Change −1.8 −2.3 −1.7 −3.2 −1 −1.5 −1.9Rent > 30% 1991 4.4 6.2 7.1 6.7 6.6 5.5 5.9
(%) 2001 10.0 15.1 13.6 13.0 12.9 11.6 13.1Change 5.6 8.9 6.5 6.3 6.3 6.1 7.2
WINNIPEG Income ratio 1991 110.1 86.4 59.9 48.9 – – 100(CMA=100) 2001 110.8 84.5 59.3 48.1 – – 100
Change 0.7 −1.9 −0.6 −0.8 – – 0Low income 1991 13.4 26.7 45.3 58.3 – – 19.5
(%) 2001 13.6 26.5 43.9 55.5 – – 19.4Change 0.2 −0.2 −1.4 −2.8 – – −0.1
Unemployment 1991 6.9 10.7 17.6 21.9 – – 8.5(%) 2001 4.7 7.4 11.7 13.6 – – 5.6
Change −2.2 −3.3 −5.9 −8.3 – – −2.9Rent > 30% 1991 3.2 6.7 10.7 16.4 – – 4.7
(%) 2001 8.2 14.0 22.9 25.9 – – 10.8Change 5 7.3 12.2 9.5 – – 6.1
MONTREAL Income ratio 1991 103.6 92.6 63.4 50.9 – – 100(CMA=100) 2001 105.4 86.5 62.1 51.8 – – 100
Change 1.8 −6.1 −1.3 0.9 – – 0Low Income 1991 17.2 25.8 44.6 57.6 – – 19.8
(%) 2001 18.6 31.3 47.8 58.2 – – 22.3Change 1.4 5.5 3.2 0.6 – – 2.5
Unemployment 1991 10.9 13.9 20.5 22.6 – – 11.6(%) 2001 6.9 10.5 16.6 19.9 – – 7.5
Change −4.0 −3.4 −3.9 −2.7 – – −4.1Rent > 30% 1991 5.3 8.0 12.7 16.5 – – 6.1
(%) 2001 12.6 19.8 24.0 27.9 – – 14.5Change 7.3 11.8 11.3 11.4 – – 8.4
SOURCE: Calculated by the authors from Census of Canada, 1991, 2001.NOTES: Neighbourhood types are those as classified in 2001.
The Canadian Geographer / Le Geographe canadien 50, no 3 (2006)
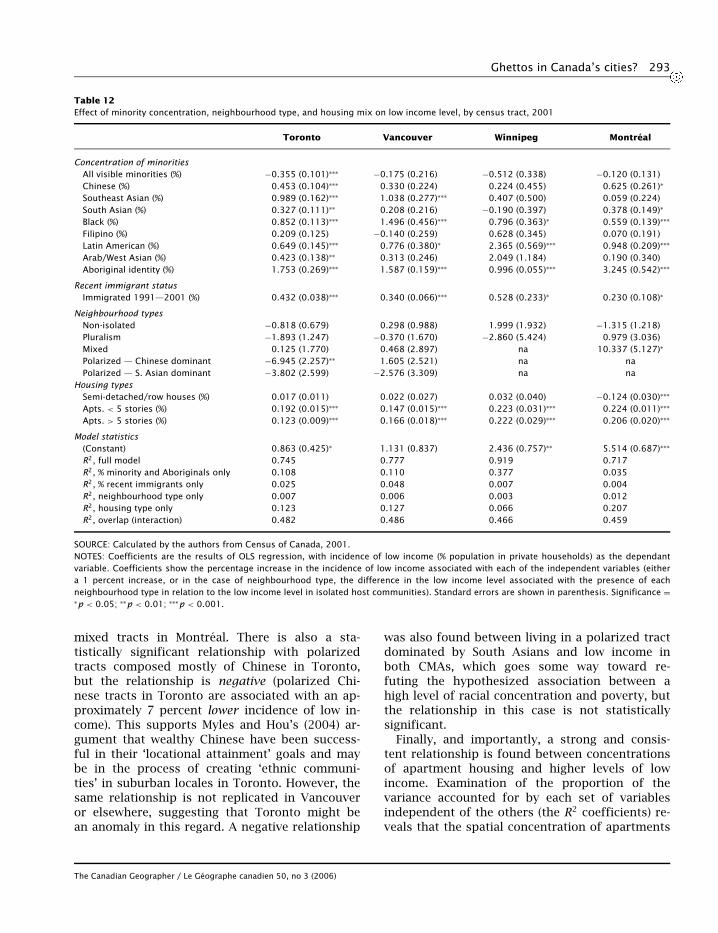
Ghettos in Canada’s cities? 293
Table 12Effect of minority concentration, neighbourhood type, and housing mix on low income level, by census tract, 2001
Toronto Vancouver Winnipeg Montreal
Concentration of minoritiesAll visible minorities (%) −0.355 (0.101)∗∗∗ −0.175 (0.216) −0.512 (0.338) −0.120 (0.131)Chinese (%) 0.453 (0.104)∗∗∗ 0.330 (0.224) 0.224 (0.455) 0.625 (0.261)∗
Southeast Asian (%) 0.989 (0.162)∗∗∗ 1.038 (0.277)∗∗∗ 0.407 (0.500) 0.059 (0.224)South Asian (%) 0.327 (0.111)∗∗ 0.208 (0.216) −0.190 (0.397) 0.378 (0.149)∗
Black (%) 0.852 (0.113)∗∗∗ 1.496 (0.456)∗∗∗ 0.796 (0.363)∗ 0.559 (0.139)∗∗∗
Filipino (%) 0.209 (0.125) −0.140 (0.259) 0.628 (0.345) 0.070 (0.191)Latin American (%) 0.649 (0.145)∗∗∗ 0.776 (0.380)∗ 2.365 (0.569)∗∗∗ 0.948 (0.209)∗∗∗
Arab/West Asian (%) 0.423 (0.138)∗∗ 0.313 (0.246) 2.049 (1.184) 0.190 (0.340)Aboriginal identity (%) 1.753 (0.269)∗∗∗ 1.587 (0.159)∗∗∗ 0.996 (0.055)∗∗∗ 3.245 (0.542)∗∗∗
Recent immigrant statusImmigrated 1991—2001 (%) 0.432 (0.038)∗∗∗ 0.340 (0.066)∗∗∗ 0.528 (0.233)∗ 0.230 (0.108)∗
Neighbourhood typesNon-isolated −0.818 (0.679) 0.298 (0.988) 1.999 (1.932) −1.315 (1.218)Pluralism −1.893 (1.247) −0.370 (1.670) −2.860 (5.424) 0.979 (3.036)Mixed 0.125 (1.770) 0.468 (2.897) na 10.337 (5.127)∗
Polarized — Chinese dominant −6.945 (2.257)∗∗ 1.605 (2.521) na naPolarized — S. Asian dominant −3.802 (2.599) −2.576 (3.309) na na
Housing typesSemi-detached/row houses (%) 0.017 (0.011) 0.022 (0.027) 0.032 (0.040) −0.124 (0.030)∗∗∗
Apts. < 5 stories (%) 0.192 (0.015)∗∗∗ 0.147 (0.015)∗∗∗ 0.223 (0.031)∗∗∗ 0.224 (0.011)∗∗∗
Apts. > 5 stories (%) 0.123 (0.009)∗∗∗ 0.166 (0.018)∗∗∗ 0.222 (0.029)∗∗∗ 0.206 (0.020)∗∗∗
Model statistics(Constant) 0.863 (0.425)∗ 1.131 (0.837) 2.436 (0.757)∗∗ 5.514 (0.687)∗∗∗
R2, full model 0.745 0.777 0.919 0.717R2, % minority and Aboriginals only 0.108 0.110 0.377 0.035R2, % recent immigrants only 0.025 0.048 0.007 0.004R2, neighbourhood type only 0.007 0.006 0.003 0.012R2, housing type only 0.123 0.127 0.066 0.207R2, overlap (interaction) 0.482 0.486 0.466 0.459
SOURCE: Calculated by the authors from Census of Canada, 2001.NOTES: Coefficients are the results of OLS regression, with incidence of low income (% population in private households) as the dependantvariable. Coefficients show the percentage increase in the incidence of low income associated with each of the independent variables (eithera 1 percent increase, or in the case of neighbourhood type, the difference in the low income level associated with the presence of eachneighbourhood type in relation to the low income level in isolated host communities). Standard errors are shown in parenthesis. Significance =∗p < 0.05; ∗∗p < 0.01; ∗∗∗p < 0.001.
mixed tracts in Montreal. There is also a sta-tistically significant relationship with polarizedtracts composed mostly of Chinese in Toronto,but the relationship is negative (polarized Chi-nese tracts in Toronto are associated with an ap-proximately 7 percent lower incidence of low in-come). This supports Myles and Hou’s (2004) ar-gument that wealthy Chinese have been success-ful in their ‘locational attainment’ goals and maybe in the process of creating ‘ethnic communi-ties’ in suburban locales in Toronto. However, thesame relationship is not replicated in Vancouveror elsewhere, suggesting that Toronto might bean anomaly in this regard. A negative relationship
was also found between living in a polarized tractdominated by South Asians and low income inboth CMAs, which goes some way toward re-futing the hypothesized association between ahigh level of racial concentration and poverty, butthe relationship in this case is not statisticallysignificant.
Finally, and importantly, a strong and consis-tent relationship is found between concentrationsof apartment housing and higher levels of lowincome. Examination of the proportion of thevariance accounted for by each set of variablesindependent of the others (the R2 coefficients) re-veals that the spatial concentration of apartments
The Canadian Geographer / Le Geographe canadien 50, no 3 (2006)
294 R. Alan Walks and Larry S. Bourne
is the most important single factor predictingthe spatial patterning of neighbourhood low in-come, followed by the individual minority groupproportions, the proportion recent immigrants,and lastly, neighbourhood type. The latter onlyaccounts for, at most, 4.8 percent of the variationin low income levels (in Vancouver), suggestingthat this method of identifying visible minorityconcentrations is relatively marginal to under-standing the neighbourhood distribution and con-centration of poverty in Canadian urban areas.
This analysis suggests that it is the distributionof low-rent apartment housing (particularly theconcentration of high-rise private rental apart-ments and social housing)9 and increasing afford-ability problems among new immigrants, ratherthan the concentration of visible minority popu-lations per se, that are most responsible for shap-ing the patterning of neighbourhood poverty, atleast in the three largest CMAs.10 This observa-tion is supported by the relatively strong correla-tion between the proportion of visible minoritiesand the proportion of apartments greater thanfive stories in 2001. With increasing inequalityamong visible minorities and recent immigrants,it is likely that the poorest among each minor-ity group are filling up the lowest cost and leastdesirable rental housing. While such a hypothe-sis cannot be examined directly here due to datalimitations, it is supported by recent evidence ofboth growing income polarization and the con-centration of recent immigrants in rental housing(Schellenberg 2004).
The increasing concentration of low-income mi-norities in such apartment districts further illus-trates how segregation levels can decline for eachminority group separately, while growing for visi-ble minorities as a whole (Table 3). As the level ofinequality within minority groups increases, the
9 Social housing is of critical importance in this discussion,though the number of dwelling units involved is relativelysmall compared to the market rental sector. In the TorontoCMA, social housing (allowing for definitional problems) to-tals only seven percent of the total housing stock androughly 20 percent of all rental housing units. Likewise, inthe City of Montreal it makes up roughly eight percent ofthe total stock (Germain and Rose 2000, 178).
10 The exception is Winnipeg, where the concentration of visi-ble minorities and Aboriginals is a stronger predictor of thegeography of low income than is the concentration of apart-ments, as indicated by the R square coefficients for each setof variables.
odds that the poorest end up becoming more seg-regated in the lowest-cost areas also increases,whereas wealthier members of each group areable to afford to own their own home and withit potentially a more desirable location for theformation of more homogenous ‘ethnic commu-nities’.
Conclusion
This study has found that while visible minoritiesand Aboriginals are becoming more numerous inCanadian urban areas, there is little evidence thatthese trends are leading towards the formation ofghettos. Using a neighbourhood classification de-veloped for systematically comparing segregationand concentration levels in cities of the world,it is found that the majority of Canadian urbanareas reveal degrees of segregation lower thanmany cities in the United States and Britain, al-though the four most segregated CMAs, Toronto,Vancouver, Winnipeg and Montreal, have levels ofspatial polarization higher than the largest citiesin either Britain or Australia. This observationdoes not suggest an end to processes of spatialassimilation or the growth of social exclusion, al-though it may reveal for certain groups (partic-ularly the Chinese) a new patterning of culturalpluralism marked by the emergence of ‘ethniccommunities’. It is still somewhat early to drawthis conclusion, and the situation is of course stillevolving.
Examination of low income levels across dif-ferent neighbourhoods suggests that the associ-ation of low income with high levels of minorityconcentration only holds for some urban areasand only for certain minority groups. The associ-ation between low-income and minority concen-tration is strongest for Aboriginals, blacks andLatin Americans. Yet, these groups were not themost segregated, nor were they the most concen-trated in minority–majority neighbourhoods. Themost polarized census tracts had incomes higherthan those neighbourhoods with more mixedpopulations and lower levels of concentration.Examination of various poverty indicators overtime suggests that although neighbourhoods withhigher visible minority concentrations becameworse off in general, the direction of changes isnot consistent across indicators, or across space.
The Canadian Geographer / Le Geographe canadien 50, no 3 (2006)
Ghettos in Canada’s cities? 295
The system of classifying neighbourhoods by de-gree of visible minority concentration was notfound to account for much of the variation inlow income levels. Instead, as Frisken et al. (1997)suggested earlier, it would appear that increasinginequality within individual minority group pop-ulations coupled with the general growth in suchpopulations has meant that the poorest segmentsare becoming concentrated in low-cost rental dis-tricts containing high-rise apartments, includingthe social housing stock. The implications for pol-icy thus point to the need for countering growingincome inequality and addressing the lack of af-fordable rental housing.
This research thus questions the applicabilityof the common discourse on ghettoization to theCanadian context. Not only is there little evi-dence of ghetto formation along U.S. lines, theneighbourhoods closest to this concept—clustersof Chinese majority census tracts in suburbanToronto—have above-average incomes and ratesof home ownership. Levels of segregation formost minority groups have declined, particularlyfor the two minority groups (blacks and Abo-riginals) that were found to have some of thestrongest associations with elevated low incomelevels and for which the discourse of ghettoiza-tion in Canada has most commonly been ap-plied. The one exception is the Toronto CMA,where segregation levels for these two groups aswell as others have increased. The Toronto CMAis also exceptional in having wealthy Chinese-dominant neighbourhoods and for its very highlevels of immigration. If future trends indicateany movement towards increasing segregationand/or ghettoization, or alternatively further ev-idence of newer forms of ethnic enclaves (Mylesand Hou 2004), it would seem that Toronto wouldbe the first place to look.
Even so, current trends in Toronto hardly fitwith common notions of ghettoization and theresearch examined here suggests that the conflu-ence of increasing income inequality and the par-ticular geography of housing in each given place,including that of tenure, form and price, are moreimportant in determining overall patterns of seg-regation. Given the complexity of the resultsoutlined above and the wide diversity within thevisible minority population, a more nuanced ap-preciation of neighbourhood dynamics and hous-ing stock changes is warranted for a better
understanding of the directions of social changesin Canadian urban areas.
Acknowledgements
The authors would like to thank the Social Science ResearchCouncil for their generous support of the empirical researchon which this paper is based. We would also like to thank thethree external reviewers whose insightful comments and sug-gestions substantially improved the quality of the paper. Anyremaining errors or omissions are of course our responsibilityalone.
References
ABU-LABAN, Y., and GARBER, J. A. 2005 ‘The construction of the ge-ography of immigration as a policy problem—The UnitedStates and Canada compared’ Urban Affairs Review 40(4),520–561
AYDEMIR, A., and SKUTERUD, M. 2004 Explaining the Deteriorating En-try Earnings of Canada’s Immigrant Cohorts: 1966–2000(Ottawa: Statistics Canada Analytical Studies Research Pa-per Series), Cat. 11F0019MIE – No. 225
BALAKRISHNAN, T. R. 1976 ‘Ethnic residential segregation in themetropolitan areas of Canada’ Canadian Journal of Sociol-ogy 1(4), 481–498
—. 1982 ‘Changing patterns of ethnic residential segregationin the metropolitan areas of Canada’ Canadian Review ofSociology and Anthropology 19(1), 92–110
—. 2001 ‘Residential segregation and socio-economic integra-tion of Asians in Canadian cities’ Canadian Ethnic Studies33(1), 120–131
BALAKRISHNAN, T. R., and GYIMAH, S. 2003 ‘Spatial residential patternsof selected ethnic groups: significance and policy implica-tions’ Canadian Ethnic Studies 35(1), 113–134
BAUDER, H. 2003 ‘“Brain abuse”, or the devaluation of immigrantlabour in Canada’ Antipode 35(4), 699–717
BAUDER, H., and SHARPE, B. 2002 ‘Residential segregation of visibleminorities in Canada’s gateway cities’ The Canadian Geog-rapher/Le Geographe Canadien 46(3), 204–222
BLOOM, D. E., GRENIER, G., and GUNDERSON, M. 1995 ‘The changing labourmarket position of Canadian immigrants’ Canadian Journalof Economics 28(4), 987–1005
BOAL, F. W. 2005 ‘Urban ethnic segregation and the scenariosspectrum’ in Desegregating the City: Ghettos, Enclaves andInequality, ed D. P. Varady (Albany, NY: State University ofNew York Press) 62–78
BOURNE, L. S. 1993 ‘Close together and worlds apart: An analy-sis of changes in the ecology of income in Canadian cities’Urban Studies 30(8), 1293–1317
BOYD, M., and NORRIS, D. 2001 ‘Who are the “Canadians”?: Chang-ing census responses, 1986–1996’ Canadian Ethnic StudiesJournal 33(1), 1–26
CLARKE, C., LEY, D., and PEACH, C. ed 1984 Geographic and Ethnic Plu-ralism (London: Allen and Unwin)
DARROCH, A. G., and MARSTON, W. G. 1971 ‘The social class basis ofethnic residential segregation: The Canadian case’ AmericanJournal of Sociology 77(3), 491–510
FEDERATION OF CANADIAN MUNICIPALITIES. 2003 Falling Behind: Our Grow-ing Income Gap (Ottawa: Federation of Canadian Municipal-ities)
The Canadian Geographer / Le Geographe canadien 50, no 3 (2006)
296 R. Alan Walks and Larry S. Bourne
FONG, E. 1996 ‘A comparative perspective on racial residentialsegregation: American and Canadian experiences’ The Soci-ological Quarterly 37(2), 199–226
FONG, E., and SHIBUYA, K. 2003 ‘Economic changes in Canadianneighbourhoods’ Population Research and Policy Review22(2), 147–170
—. 2000 ‘The spatial separation of the poor in Canadian cities’Demography 37(4), 449–459
FONG, E., and WILKES, R. 2003 ‘Racial and ethnic residential patternsin Canada’ Sociological Forum 18(4), 577–602
FRENETTE, M., GREEN, D., and PICOT, G. 2004 Rising Income InequalityAmid the Economic Recovery of the 1990s: An Explorationof Three Data Sources (Ottawa: Statistics Canada AnalyticalStudies Research Paper Series) Cat. 11F0019MIE – No. 219
FRENETTE, M., PICOT, G., and SCEVIOUR, R. 2004 How Long Do People Livein Low-income Neighbourhoods? Evidence for Toronto, Mon-treal, and Vancouver (Ottawa: Statistics Canada AnalyticalStudies Research Paper Series) Cat. 11F0019MIE – No. 216
FRISKEN, F., BOURNE, L. S., GAD, G., and MURDIE, R. A. 1997 Governance andSocial Well-being in the Toronto Area: Past Achievementsand Future Challenges (Toronto: University of Toronto Cen-tre for Urban and Community Studies) Research Paper no.193
GERMAIN, A., and ROSE, D. 2000 Montreal: The Quest for a Metropolis(Toronto: Wiley)
HAAN, M. 2005 ‘The decline of the immigrant home-ownershipadvantage: life-cycle, declining fortunes and changing hous-ing careers in Montreal, Toronto and Vancouver, 1981–2001’ Urban Studies 42(12), 2191–2212
HAJNAL, Z. L. 1995 ‘The nature of concentrated urban poverty inCanada and the United States’ Canadian Journal of Sociol-ogy 20(4), 497–528
HEISZ, A., and MCLEOD, L. 2004 Low-Income in Census MetropolitanAreas, 1980–2000 (Ottawa: Statistics Canada Analytical Pa-per Series) Cat. 89-613-MIE – No. 001
HIEBERT, D. 2000 ‘Immigration and the changing Canadian city’The Canadian Geographer/Le Geographe Canadien 44(1),25–43
—. 2006 ‘Winning, losing, and still playing the game: the po-litical economy of immigration in Canada’ Tijdschrift voorEconomische en Sociale Geografie 97(1), 38–48
HIEBERT, D., and LEY, D. 2003 ‘Assimilation, cultural pluralism, andsocial exclusion among ethnocultural groups in Vancouver’Urban Geography 24(1), 16–44
HOU, F. 2004 Recent Immigration and the Formation of VisibleMinority Neighbourhoods in Canada’s Large Cities (Ottawa:Statistics Canada Analytical Studies Research Paper Series)Cat. 11F0019MIE – 221
HOU, F., and MILAN, A. 2003 ‘Neighbourhood ethnic transition andits socio-economic connections’ Canadian Journal of Sociol-ogy 28(3), 387–410
HOU, F., and PAICOT, G. 2003 Visible Minority Neighbourhood En-claves and Labour Market Outcomes of Immigrants (Ottawa:Statistics Canada Analytical Studies Research Paper Series)Cat. 11F0019MIE – No. 204
HUFFMAN, T. 2006. ‘Violence on upswing in Malvern’ Toronto StarMarch 21, B02
HULCHANSKI, D. 2001 A Tale of Two Canadas: Homeowners Get-ting Richer, Renters Getting Poorer (Toronto: University ofToronto Centre for Urban and Community Studies) Re-search Bulletin No. 2
IHLANFELDT, K. R. 1999 ‘The geography of economic and social op-portunity in Metropolitan Areas’ in Governance and Oppor-tunity in Metropolitan America, ed A. Altshuler (Washing-ton, DC: National Academic Press) 213–252
JARGOWSKY, P. 1997 Poverty and Place: Ghettos, Barrios, and theAmerican City (New York: Russell Sage)
—. 2003 Stunning Progress, Hidden Problems: The DramaticDecline of Concentrated Poverty in the 1990s (Washington,DC: Centre on Urban and Metropolitan Policy, Brookings In-stitution)
JOHNSTON, R., FORREST, J., and POULSEN, M. 2002 ‘Are there ethnic en-claves/ghettos in English cities?’ Urban Studies 39(4), 591–618
JOHNSTON, R., POULSEN, M., and FORREST, J. 2003 ‘And did the wallscome tumbling down? Ethnic residential segregation in fourU.S. metropolitan areas 1980–2000’ Urban Geography 24(7),560–581
KAZEMIPUR, A., and HALLI, S. S. 2000 The New Poverty in Canada: Eth-nic Groups and Ghetto Neighbourhoods (Toronto: Thomp-son Educational Publishing)
KINGSLEY, G. T., and PETTIT, K. L. S. 2003 Concentrated Poverty: AChange in Course (Washington, DC: Urban Institute Re-search Paper)
KRAHN, H., DERWING, T., MULDER, M., and WILKINSON, L. 2000 ‘Educatedand underemployed: refugee integration into the Canadianlabour market’ Journal of International Migration and Inte-gration 1(1), 59–84
LEY, D., and SMITH, H. 2000 ‘Relations between deprivation andimmigrant groups in large Canadian cities’ Urban Studies37(1), 37–62
LI, P. 2003 ‘Initial earnings and catch-up capacity of immigrants’Canadian Public Policy 29(3), 319–337
LIN, J. 1998 ‘Globalization and the revalorizing of ethnic placesin immigration gateway cities’ Urban Affairs Review 34(2),313–339
LOGAN, J., ALBA, R., and ZHANG, W. 2002 ‘Immigrant enclaves and eth-nic communities in New York and Los Angeles’ AmericanSociological Review 67(2), 299–322
MARCUSE, P. 1997 ‘The enclave, the citadel, and the ghetto: whathas changed in the post-Fordist U.S. city?’ Urban AffairsReview 33(2), 228–264
MASSEY, D., and DENTON, N. 1993 American Apartheid: Segregationand the Making of the Underclass (Cambridge, MA: HarvardUniversity Press)
MOORE, E. G., and PACEY, M. A. 2003 ‘Changing income inequality andimmigration in Canada, 1980–1995’ Canadian Public Policy29(1), 33–51
MOORE, E. G., and SKABURSKIS, A. 2004 ‘Canada’s increasing housingaffordability burdens’ Housing Studies 19(3), 395–413
MORISSETTE, R., and DROLET, M. 2000 To What Extent Are CanadiansExposed to Low-Income? (Ottawa: Statistics Canada Analyt-ical Studies Research Paper Series) Cat. 11F0019MIE – No.1
MURDIE, R. A. 1994a ‘Blacks in near-ghettos? Black visible minoritypopulation in Metropolitan Toronto public housing units’Housing Studies 9(4), 435–457
—. 1994b. ‘Social polarization and public housing in Canada:A case study of the Metropolitan Toronto HousingAuthority’ in The Changing Canadian Metropolis: A Pub-lic Policy Perspective, ed F. Frisken (Toronto: Institute forGovernmental Studies Press) 293–340
The Canadian Geographer / Le Geographe canadien 50, no 3 (2006)
Ghettos in Canada’s cities? 297
MYLES, J., and HOU, F. 2004 ‘Changing colours: spatial assimilationand new racial minority immigrants’ Canadian Journal ofSociology 29(1), 29–58
ONG, A. 1999 Flexible Citizenship: The Cultural Logics ofTransnationality (Durham, NC: Duke University Press)
OREOPOULOS, P. 2002 Do Neighbourhoods Influence Long-TermLabour Market Success? A Comparison of Adults Who GrewUp in Different Public Housing Projects (Ottawa: Statis-tics Canada Analytical Studies Research Paper Series) Cat.11F0019MIE – No. 185
PATTILLO, M. 2003 ‘Extending the boundaries and definition of theghetto’ Ethnic and Racial Studies 26(6), 1046–1057
PEACH, C. 1996 ‘Does Britain have ghettos?’ Transactions of theInstitute of British Geographers 21(2), 216–235
PENDAKUR, K., and PENDAKUR, R. 2002 ‘Colour my world: have earn-ings gaps for Canadian-born ethnic minorities changed overtime?’ Canadian Public Policy 28(4), 489–521
PETERS, E. 2001 ‘Geographies of Aboriginal peoples in Canada’The Canadian Geographer/Le Geographe Canadien 45(1),138–144
—. 2005 ‘Indigeneity and marginalisation: planning for andwith urban aboriginal communities in Canada’ Progress inPlanning 63(4), 327–404
PHILPOTT, T. L. 1978 The Slum and the Ghetto: Neighbourhood De-terioration and Middle Class Reform, Chicago 1880–1930(New York: Oxford University Press)
PICOT, G., and HOU, F. 2003 The Rise in Low-Income Rates AmongImmigrants in Canada (Ottawa: Statistics Canada Analyti-cal Studies Research Paper Series) Cat. 11F0019MIE – No.198
PICOT, G., MORISSETTE, R., and MYLES, J. 2003 Low-Income Intensity dur-ing the 1990s: The Role of Economic Growth, EmploymentEarnings and Social Transfers (Ottawa: Statistics CanadaAnalytical Studies Research Paper Series) Cat. 11F0019MIE –No. 172
POULSEN, M., JOHNSTON, R., and FORREST, J. 2001 ‘Intraurban eth-nic enclaves: introducing a knowledge-based classificationmethod’ Environment and Planning A33(10), 2071–2082
QADEER, M. A. 2005 ‘Ethnic segregation in a multicultural city’ inDesegregating the City: Ghettos, Enclaves and Inequality, edD. P. Varady (Albany, NY: State University of New YorkPress) 49–61
RAY, B. 1994 ‘Immigrant settlement and housing in metropolitanToronto’ The Canadian Geographer/Le Geographe Cana-dien 38(3), 262–265
RAY, B., HALSETH, G., and JOHNSON, B. 1997 ‘The changing ‘face’ of thesuburbs: issues of ethnicity and residential change in sub-urban Vancouver’ International Journal of Urban and Re-gional Research 21(1), 75–99
RAY, B., and MOORE, E. 1991 ‘Access to home ownership amongimmigrant groups in Canada’ Canadian Review of Sociologyand Anthropology 28(1), 1–29
ROSEMAN, C. C., LAUX, H. D., and THIEME, G. ed 1996 EthniCity: GeographicPerspectives on Ethnic Change in Modern Cities (Lanham:Rowman and Littlefield)
ROSS, N., HOULE, C., DUNN, J., and AYE, M. 2004 ‘Dimensions and dynam-ics of residential segregation by income in urban Canada,1991–1996’ The Canadian Geographer/Le Geographe Cana-dien 44(4), 433–445
SCHELLENBERG, G. 2004 Immigrants in Canada’s Census Metropoli-tan Areas (Ottawa: Statistics Canada Analytical Studies Re-search Paper Series) Cat. 89613MIE – No. 003
SIMMONS, J., and BOURNE, L. S. 2003 The Canadian Urban System,1971–2001: Responses to a Changing World (Toronto: Uni-versity of Toronto Centre for Urban and Community Stud-ies) Research Paper no. 200
SMOLICZ, J. J. 1995 ‘The emergence of Australia as a multiculturalnation: an international perspective’ Journal of InterculturalStudies 16(1), 3–24
STATISTICS CANADA. 2003 Canada’s Ethnocultural Portrait: TheChanging Mosaic (Ottawa: Statistics Canada Census Anal-ysis Series) Cat. 96F0030XIE2001008
TEIXEIRA, C. 2001 ‘Community resources and opportunities in eth-nic economies: a case study of Portuguese and black en-trepreneurs in Toronto’ Urban Studies 38(11), 2055–2078
TORONTO STAR. 2006 ‘So many guns, so few solutions’ TorontoStar Jan 19, P. 04
TOWNSHEND, I., and WALKER, R. 2002 ‘The structure of income residen-tial segregation in Canadian metropolitan areas’ CanadianJournal of Regional Science 25(1), 25–52
UNITED WAY OF GREATER TORONTO. 2004 Poverty by Postal Code: TheGeography of Neighbourhood Poverty, 1981–2001 (Toronto:United Way of Greater Toronto)
WALKS, R. A. 2001 ‘The social ecology of the post-fordist/globalcity? Economic restructuring and socio-spatial polarisationin the Toronto urban region’ Urban Studies 38(3), 407–447
WALTON-ROBERTS, M. 2003 ‘Transnational geographies: Indian immi-gration to Canada’ The Canadian Geographer/Le GeographeCanadien 47(3), 235–250
WHITE, M. J., FONG, E., and CAI, Q. A. 2003 ‘The segregation of Asian-origin groups in the United States and Canada’ Social Sci-ence Research 32(1), 148–167
WHITE, M. J., KIM, A. H., and GLICK, J. E. 2005 ‘Mapping social distance—Ethnic residential segregation in a multiethnic metro’ Soci-ological Methods and Research 34(2), 173–203
WILSON, W. J. 1987 The Truly Disadvantaged: The Inner City,the Underclass, and Public Policy (Chicago: University ofChicago Press)
The Canadian Geographer / Le Geographe canadien 50, no 3 (2006)