getting control alex scott · getting control alex scott. ... flakiness elongation surface crushed...
TRANSCRIPT


Getting ControlAlex Scott

Lecture Overview
�A look at some of the issues which in the
day to day operation influence crusher
performance
�A look at some possible problems, trouble
shooting tips and improvements.
Our journey
� A look at material properties and their influence on equipment
performance
� A look at the machine factors influencing equipment performance
� A look at some negative factors reducing equipment performance.
� A look at some take home messages which might improve
performance.

Raw MaterialSpecies of rock
� IGNEOUS
�Surface - Fine grained Basalt
�Intrusive - Medium grained
�Deep - Coarse grained
Diabase
Gabbro

Raw MaterialSpecies of rock
� METAMORPHIC
ROCK TRANSFORMED IN THE EARTH´S CRUST DUE TO INCREASED
PRESSURE AND TEMPRATURE
Limestone MarbleLimestone
Granite
Marble
Gneiss

Raw MaterialSpecies of rock
� SEDIMENTARY
Take Home Message
The grain structure of
the raw material has an
influence on the final influence on the final
shape of the finished
product and the power
and/or pressure pulled
by the crusher

Sandvik Test MethodsImpact Work index, Wi
Impact Work
Index (WI)
Description of the
Crushability
< 10 Very soft
10 – 14 Soft
14 – 18 Medium
18 – 22 TOUGH
22 – 26 Very TOUGH
> 26 ExtremelyTOUGH
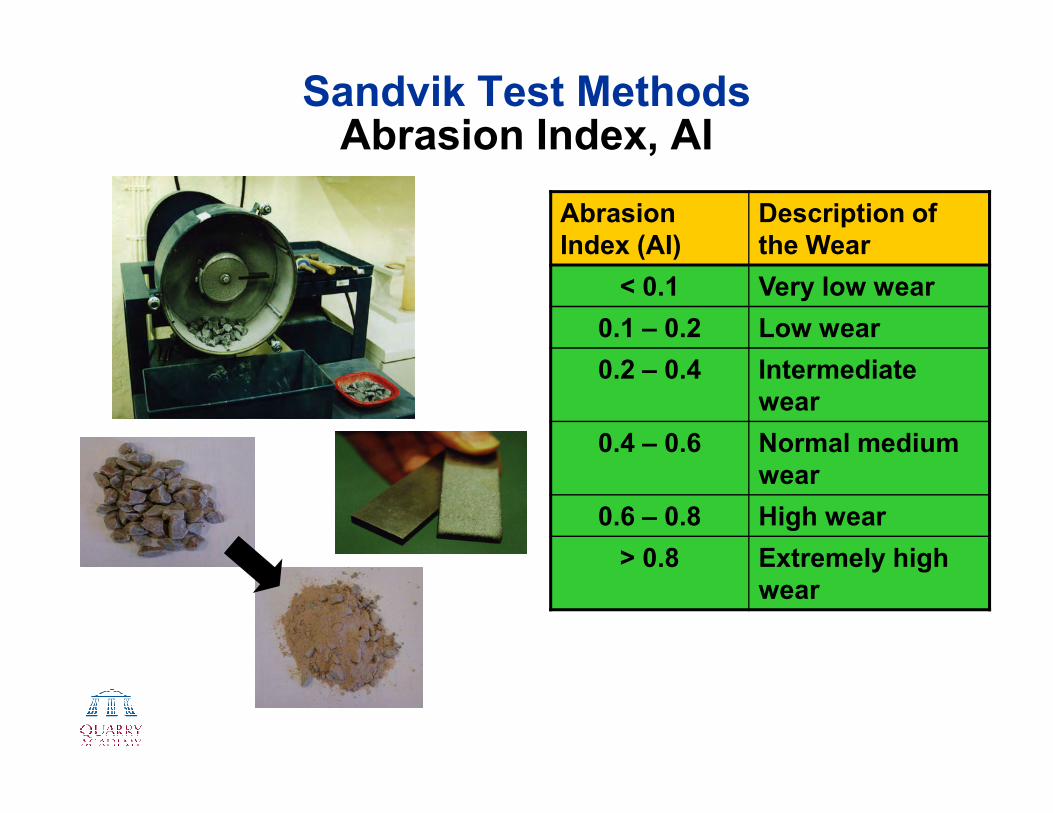
Sandvik Test MethodsAbrasion Index, AI
Abrasion
Index (AI)
Description of
the Wear
< 0.1 Very low wear
0.1 – 0.2 Low wear
0.2 – 0.4 Intermediate
wearwear
0.4 – 0.6 Normal medium
wear
0.6 – 0.8 High wear
> 0.8 Extremely high
wear

Sandvik Test MethodsRawmaterial Properties
Material WI AI Compressive strength (lbs/in2)
Amphibolites 16 0.4 29000 - 43500
Andesite 16 0.5 24650 - 43500
Basalt 20 0.25 43500 - 58000
Diabase 18 0.28 36250 - 50750
Dolomite 12 < 0.02 7250 - 21750
Diorite 19 0.4 24650 - 43500
Gabbro 21 0.4 29000 - 50750
Greywacke 18 0.3 21750 - 43500

Sandvik Test MethodsRawmaterial Properties
Material WI AI Compressive strength (lbs/in2)
Gneiss 16 0.48 29000 - 43500
Granite 16 0.46 29000 - 45000
Limestone 11 < 0.01 11600 - 26100
Marble 12 < 0.02 14500 - 29000
Quartzite 16 0.75 21750 - 43500
Sandstone 10 0.75 4350 - 21750
Iron ore (Hematite) 11 0.5 14500 - 29000
Iron ore (Magnetite) 8 0.2 7250 - 21750

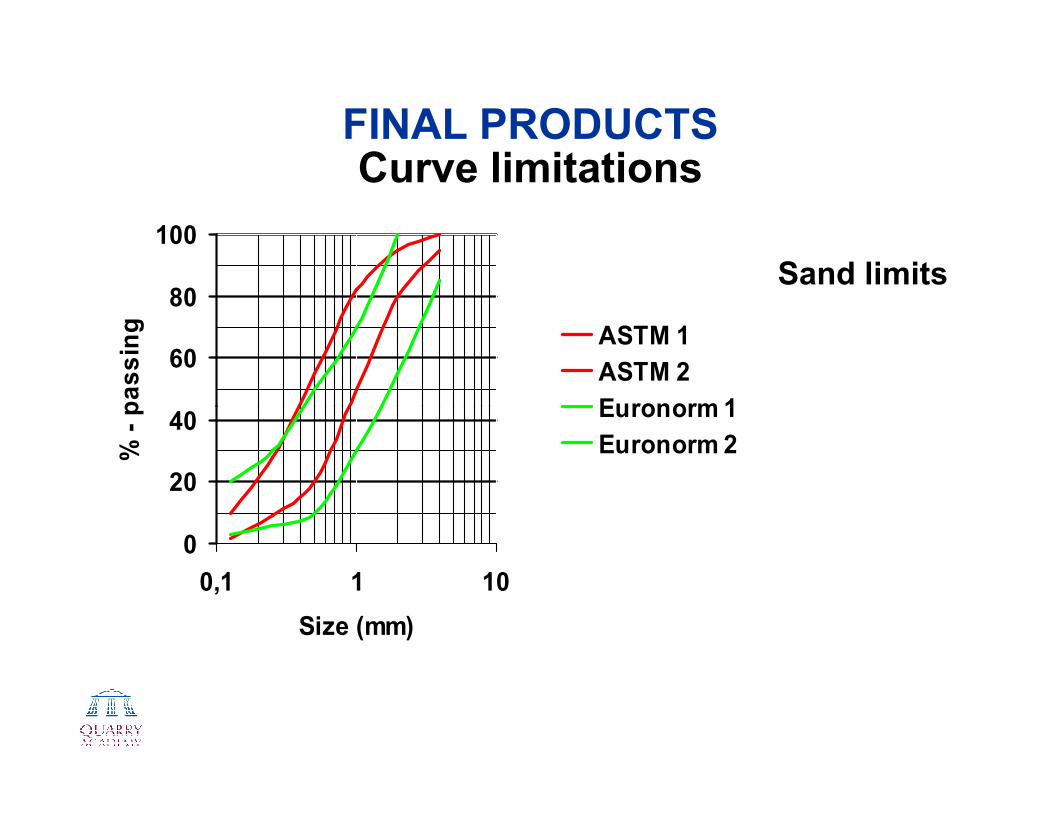
FINAL PRODUCTS
� Size
� Fraction Limits
� Misplaced
Particles
� Size
DistributionDistribution
� Shape
� Flakiness
� Elongation
� Surface
� Crushed
Surface

FINAL PRODUCTSMisplaced particles
Misplaced Particles
10/15
� Oversize: 10 %
� Undersize: 15 %
Fraction 1” x 2”:
ASTM D 448-86,1988
Fraction 1” x 2”:
1” 2”
OversizeUndersize
40
60
80
100
% -
pa
ss
ing ASTM 1
ASTM 2
Euronorm 1
Sand limits
FINAL PRODUCTSCurve limitations
0
20
40
0,1 1 10
Size (mm)
% -
pa
ss
ing
Euronorm 1
Euronorm 2

FINAL PRODUCTSParticle shape
� Flakiness (length/thickness)� Elongation (length/width)� Flat (thickness/width) Length
ASTM D 4791
Width
Thickness

PARTICLE SHAPE� ASTM
� Flat (W/T ratio)
� Elongated (W/L ratio)
� Ratio varies 1:2, 1:3, 1:4, 1:5
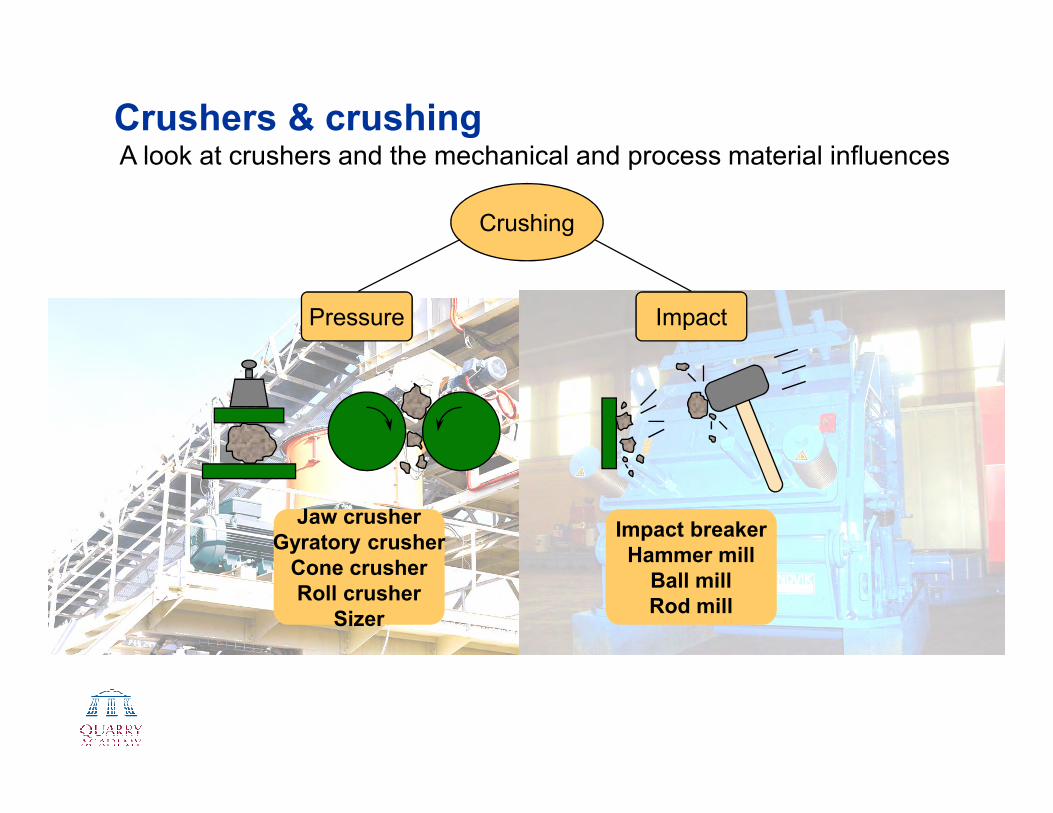
Crushing
Pressure Impact
Crushers & crushingA look at crushers and the mechanical and process material influences
Jaw crusher
Gyratory crusher
Cone crusher
Roll crusher
Sizer
Impact breaker
Hammer mill
Ball mill
Rod mill

CompressionBreakage
Stone on stoneStone on metal
Complex loading
More cubical particles
Simple loading
More angular particles

Cone crusher Operation
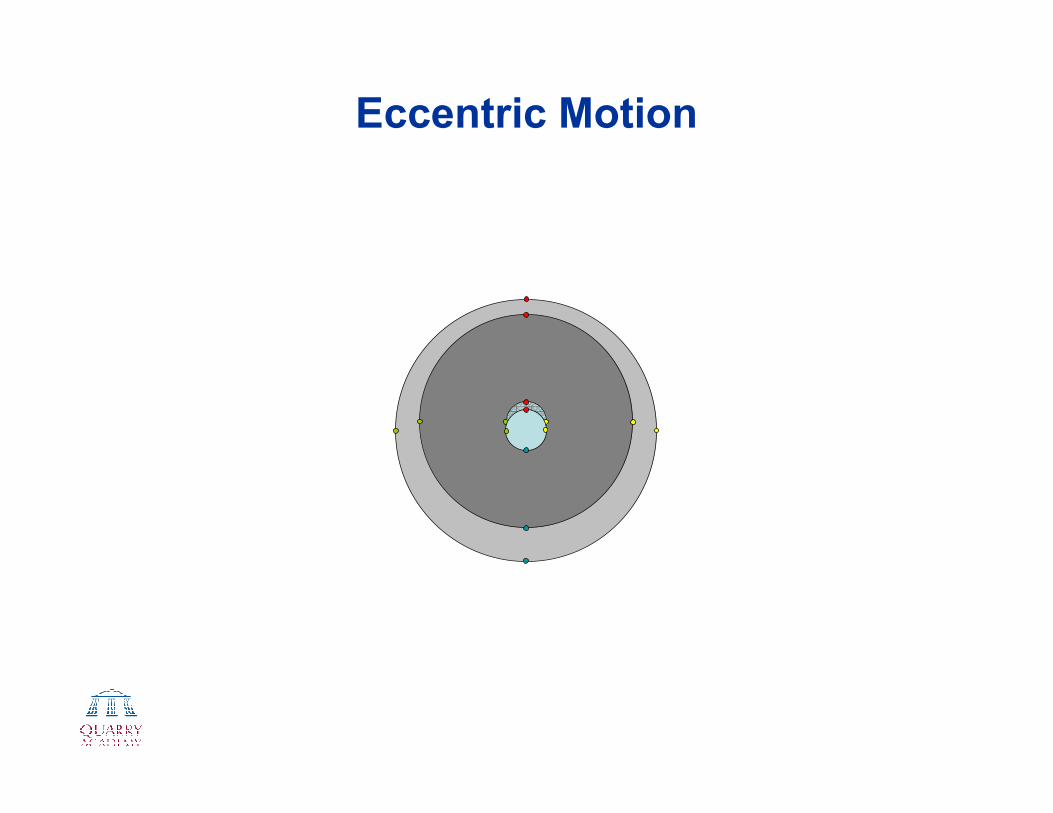
Eccentric Motion
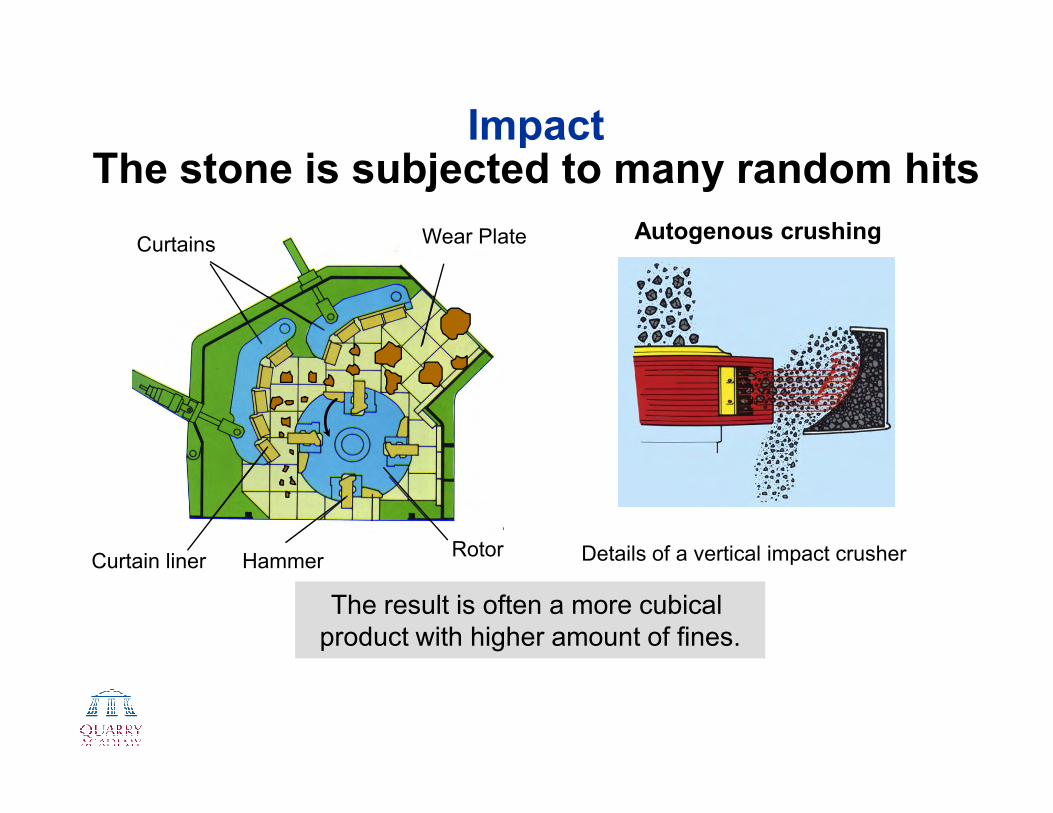
ImpactThe stone is subjected to many random hits
Curtains Wear Plate Autogenous crushing
Curtain liner HammerRotor
The result is often a more cubical
product with higher amount of fines.
Details of a vertical impact crusher
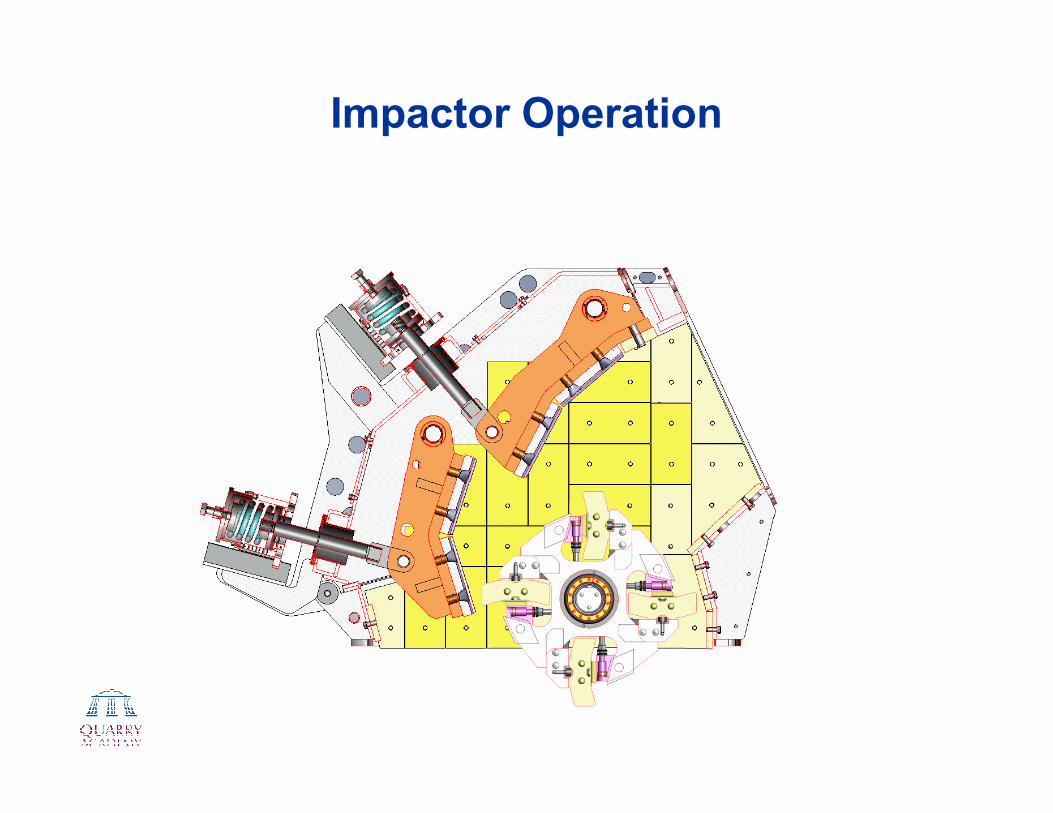
Impactor Operation

VSI How It Works
Rotor Only Feed

VSI How It Works
Rotor And Bi-Flow Feed
What do we really know about crushing?
� What are the major influences?
� From material factors?
� From equipment/mechanical factors?
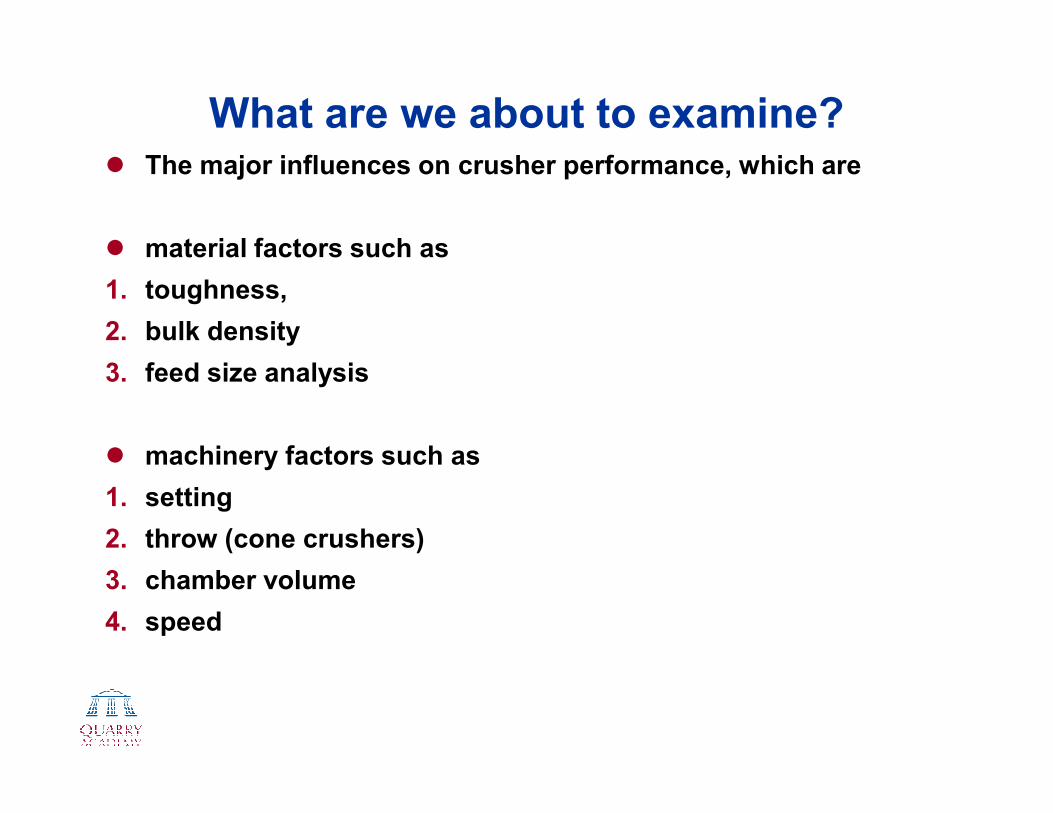
What are we about to examine?� The major influences on crusher performance, which are
� material factors such as
1. toughness,
2. bulk density
3. feed size analysis
� machinery factors such as
1. setting
2. throw (cone crushers)
3. chamber volume
4. speed
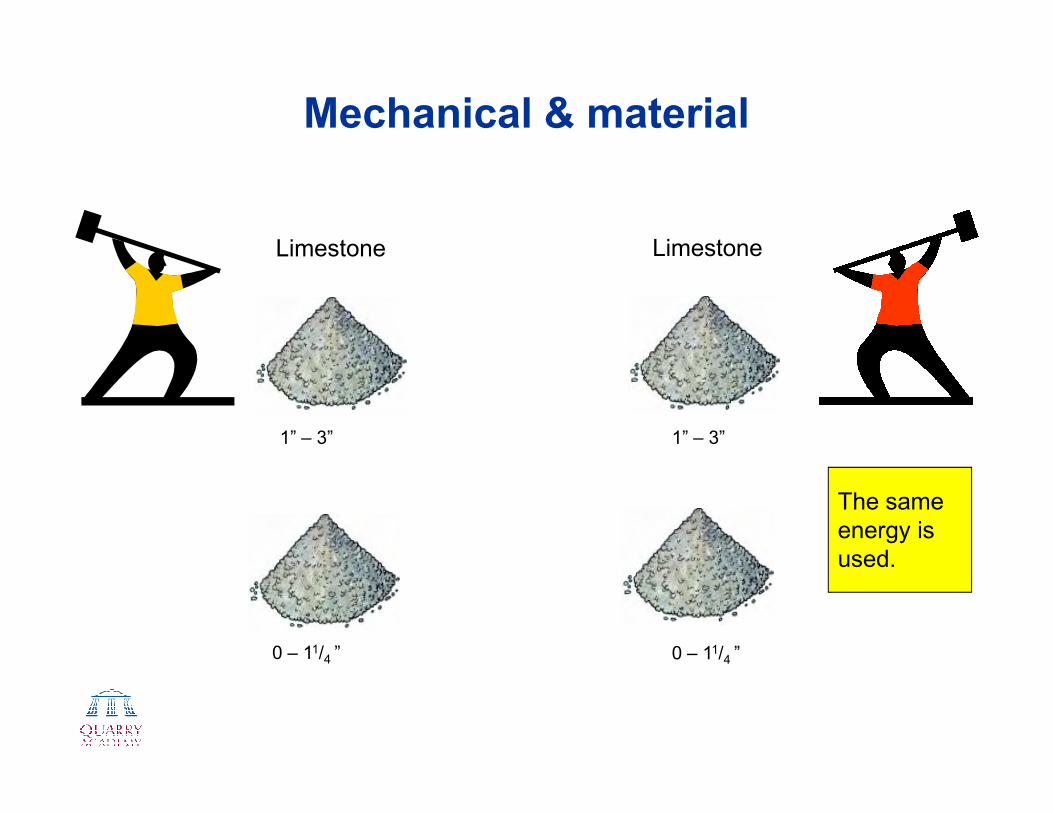
Mechanical & material
Limestone Limestone
1” – 3”
0 – 11/4 ”
The same
energy is
used.
1” – 3”
0 – 11/4 ”
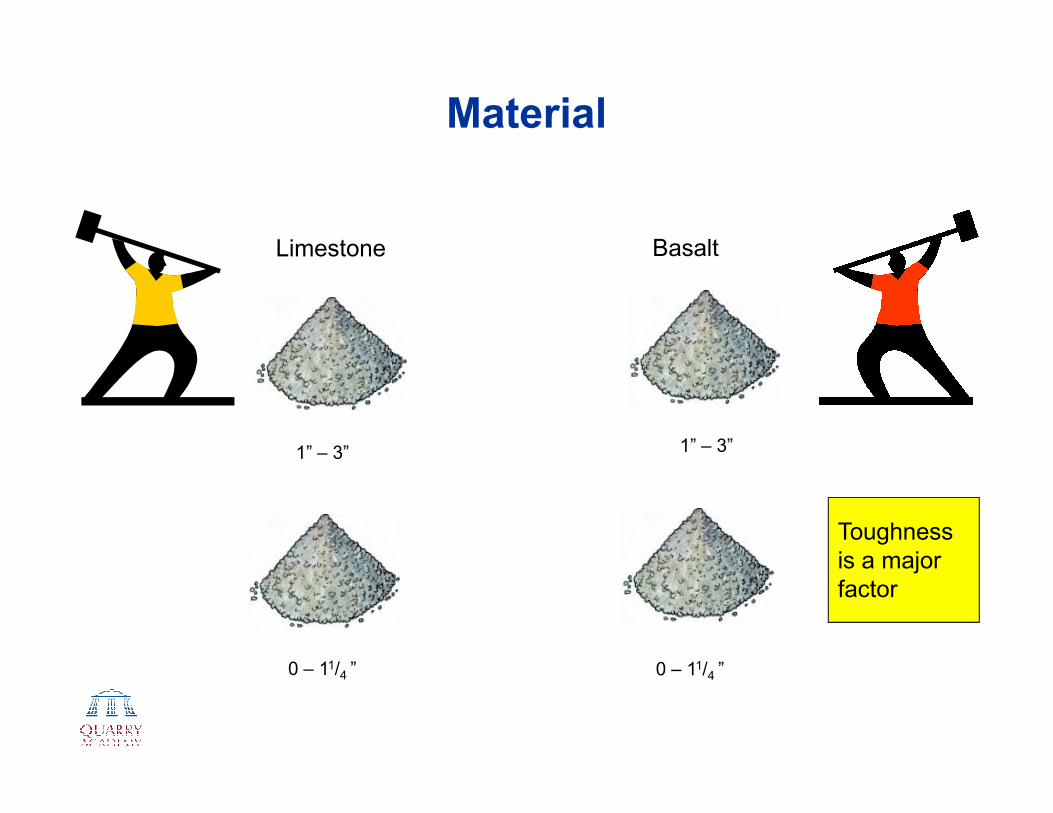
Material
Limestone Basalt
Toughness
is a major
factor
1” – 3” 1” – 3”
0 – 11/4 ” 0 – 11/4 ”

Mechanical
Limestone Limestone
Volume by
throw,chamber
profile or
material bulk
density & feed
grading are
factors
1” – 3” 1” – 3”
0 – 11/4 ” 0 – 11/4 ”

Mechanical
Basalt Basalt
1”- 5”
Reduction
ratio-CSS
is a factor
1” – 3”
0 – 11/4 ”0 – 11/4 ”

Basic Crushing and Screening ConceptsReduction Ratio (1)
80
80
P
F=Reduction Ratio
crusher
product
feed material
percentage passing
F80 = (80 % of feed mtrl)
P80 = (80 % of the product) percentage passing
P80 = 5/8”
F80= 16”

Basic Crushing ConceptsReduction Ratio
Typical reduction:
Jaw crusher 2-3
Gyratory crusher 3-4
Cone crusher 3-5
Impact crusher (VSI) 4-6
Impact crusher (HSI) 7-10
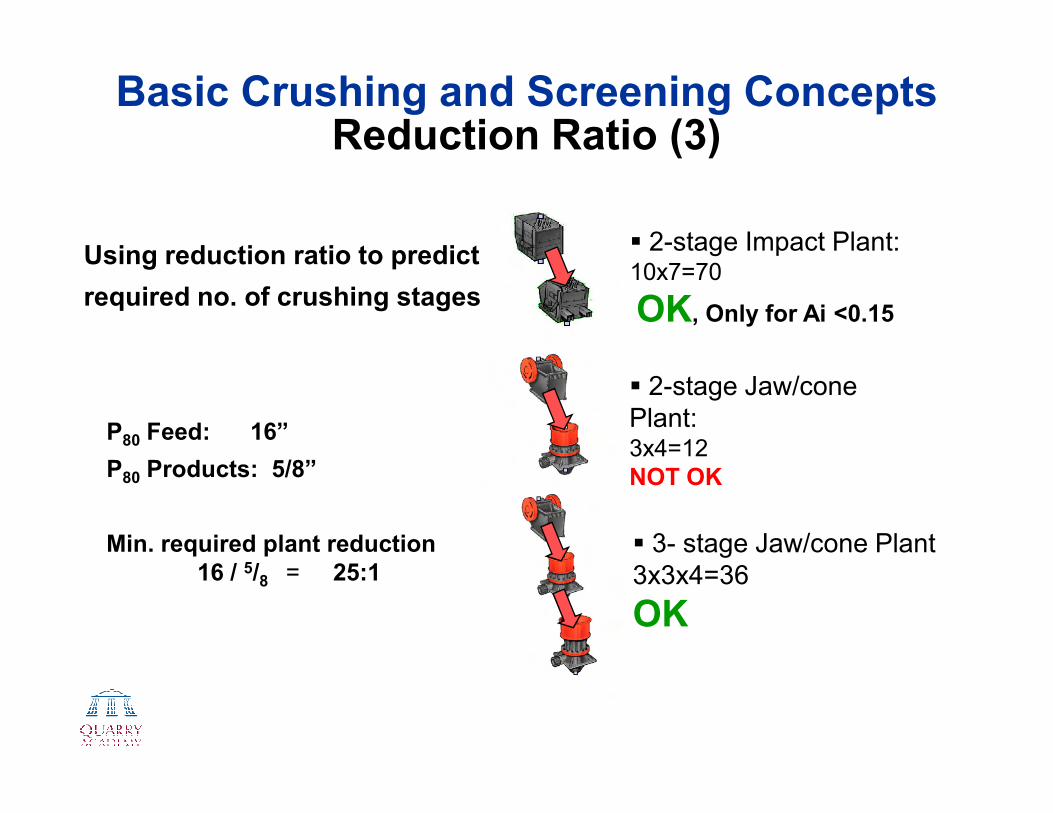
Basic Crushing and Screening ConceptsReduction Ratio (3)
Using reduction ratio to predict
required no. of crushing stages
� 2-stage Impact Plant:10x7=70
OK, Only for Ai <0.15
� 2-stage Jaw/cone
Plant:P80 Feed: 16”
P80 Products: 5/8”
Min. required plant reduction
16 / 5/8 = 25:1
Plant:3x4=12
NOT OK
� 3- stage Jaw/cone Plant
3x3x4=36
OK
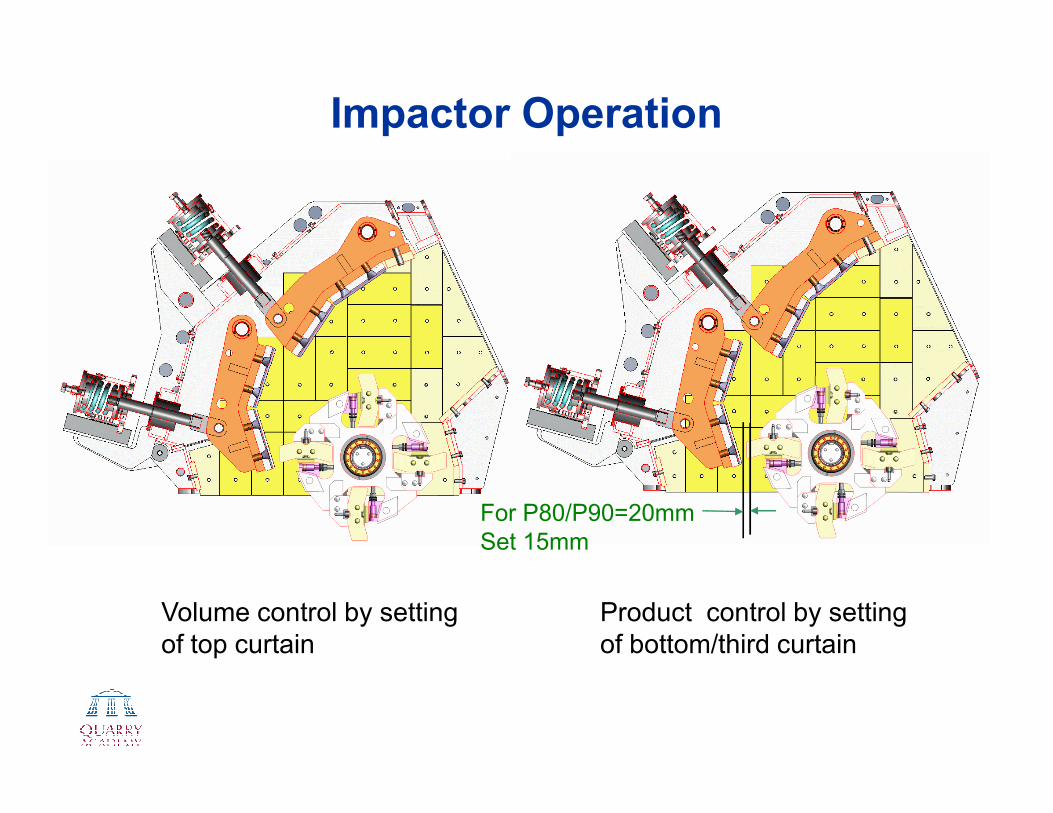
Impactor Operation
Volume control by setting
of top curtain
Product control by setting
of bottom/third curtain
For P80/P90=20mm
Set 15mm

The crushing chamber in a cone crusher is the most important part
All other parts in the crusher are ”only” there to hold the
chamber in place or to create movement of the mantle.

Why so many chambers?
All crushing starts with
the chamber!

Why different chambers?
� Maximum energy
utilisation.
� Avoid load peaks� Avoid load peaks
� Prevent uneven
wear

Each eccentric revolution means a crushing stage
m
N
µ
N
Travel
length
Eccentric throw
mg
Nlength

Influence of speed
There are several crushing stages in the chamber
When the falling stone is caught,
it is trapped and to some degree
pushed upwards.

Influence of speed
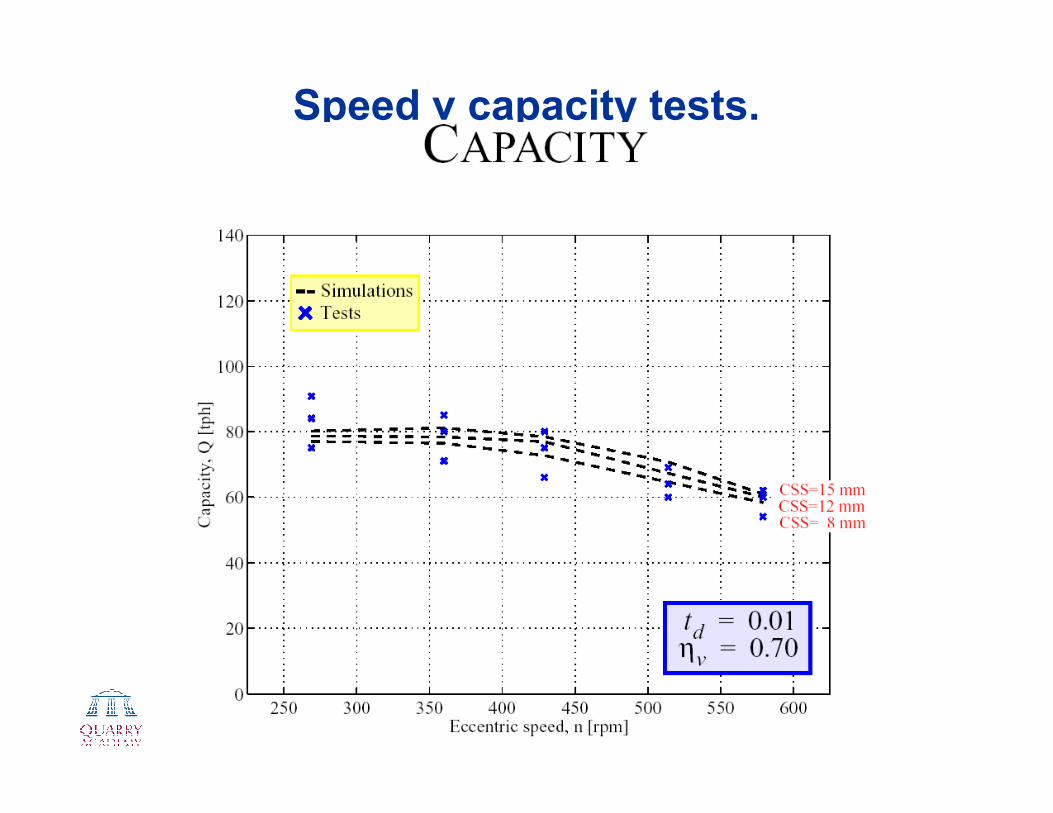
Speed v capacity tests.
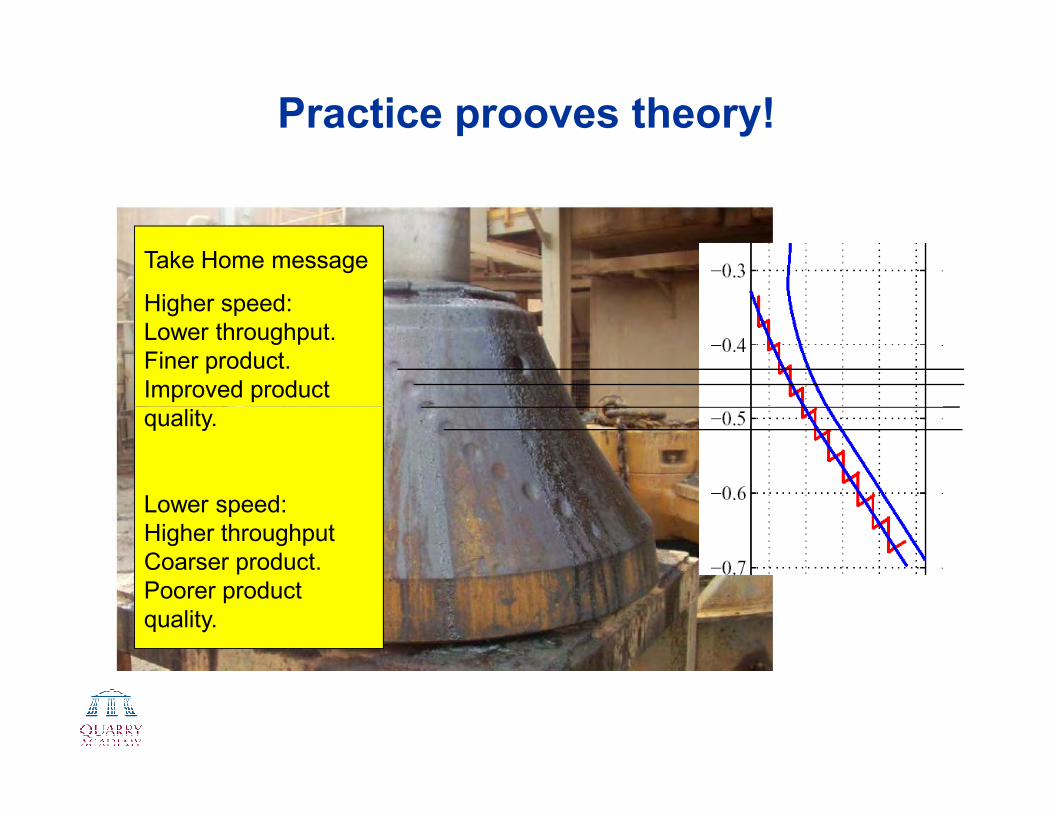
Practice prooves theory!
Take Home message
Higher speed:
Lower throughput.
Finer product.
Improved product
quality. quality.
Lower speed:
Higher throughput
Coarser product.
Poorer product
quality.
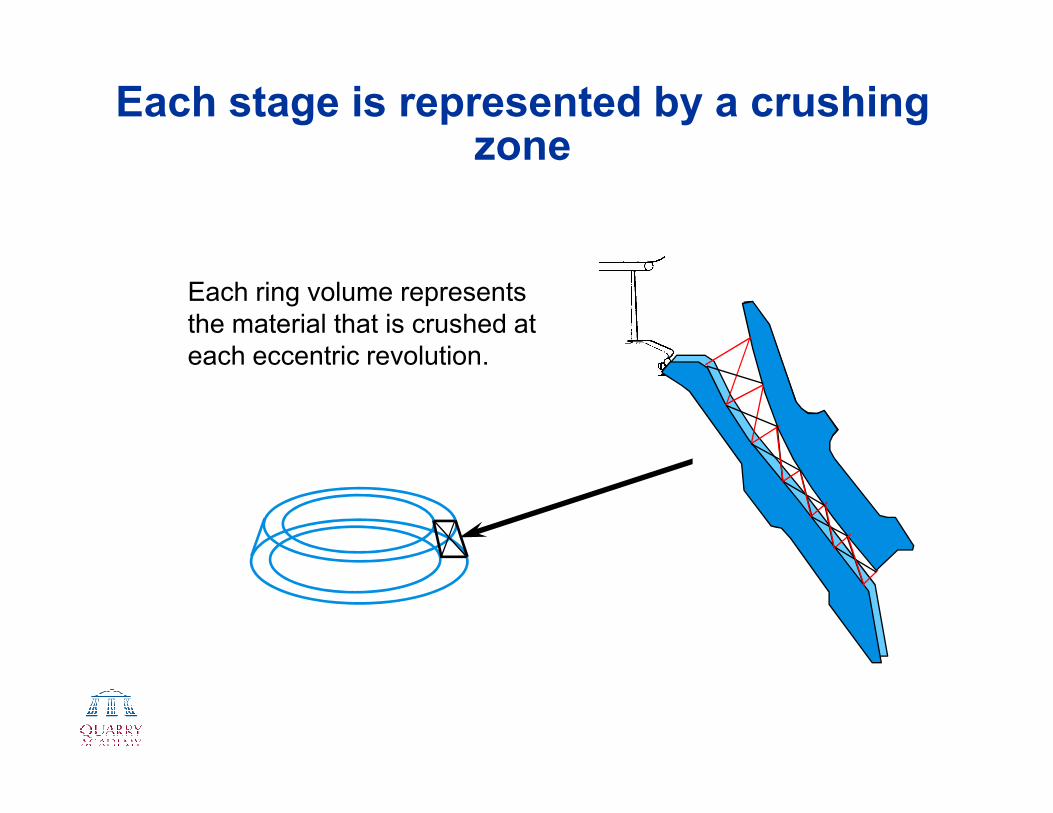
Each stage is represented by a crushing zone
Each ring volume represents
the material that is crushed at
each eccentric revolution.

The zone with the smallest volume determines the capacity
The
capacity is
Choke zone
capacity is
volumetric

Reduced C.S.S.: Increased net capacity
40
60
80
100
120
140
Capacity (t/h)
Total
0-11 mm
0
20
0 10 20 30
CSS (mm)
Capacity (t/h)
Small volume reduction in feed zone small total capacity reduction
Much smaller volume in discharge zone high size reduction ratio
Note: Capacity - C.S.S. relation is approx. linear

Reduced C.S.S.: Consequence map
C.S.S. reduction
Smaller volume in the crushing chamber
Risk of packingLower capacityHigher pressure
Higher energy consumption
Improved shape
Finer product
Higher net capacity
More power
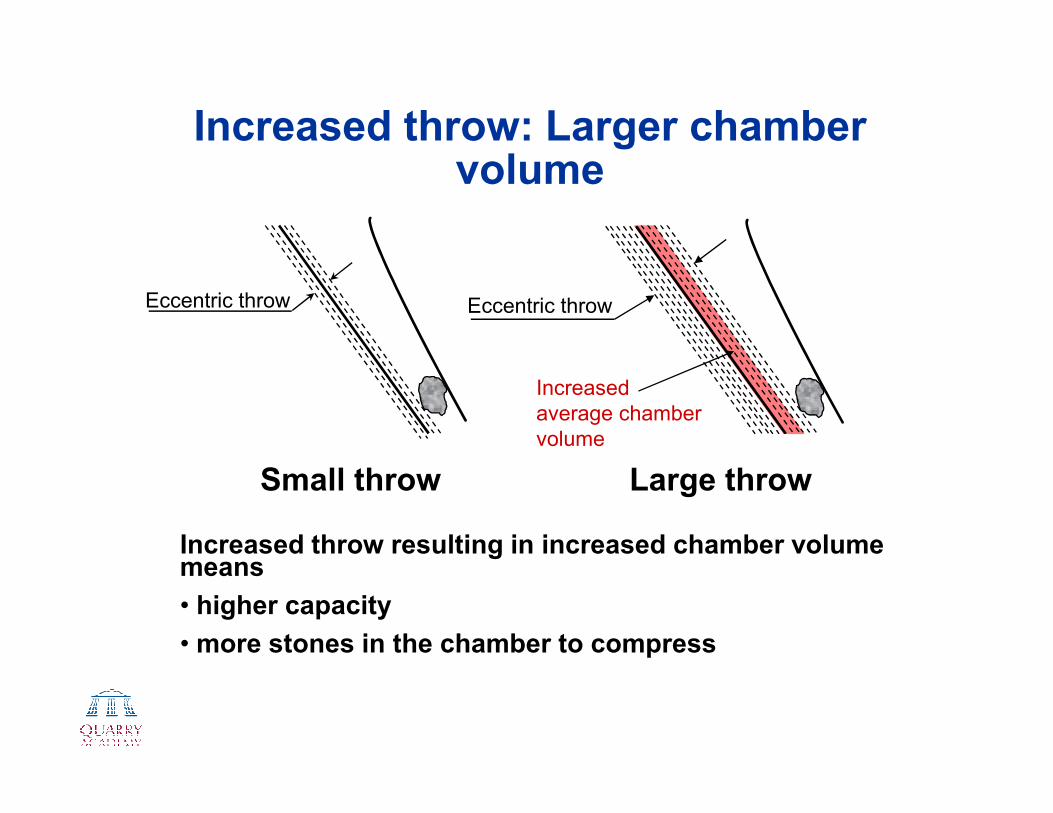
Increased throw: Larger chamber volume
Eccentric throw
Increased
average chamber
Eccentric throw
Small throw
average chamber
volume
Large throw
Increased throw resulting in increased chamber volume means
• higher capacity
• more stones in the chamber to compress
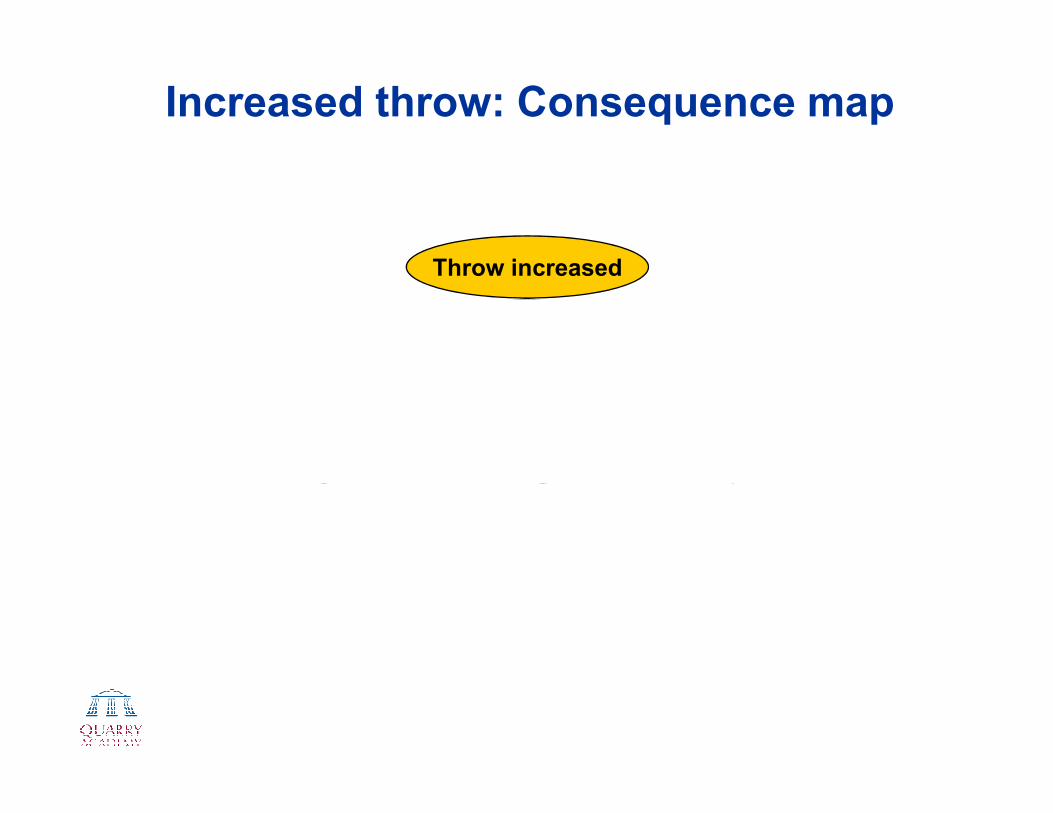
Increased throw: Consequence map
Throw increased
Larger
average settingHigher flow Higher torque
Increased
compression
More crushing
stone-against-stone
Packing riskHigher capacity More power needed
Higher power
consumption
Improved shapeHigher net capacity

Relation between power and pressure
Packing
Fine crushing
Hyd
rau
lic p
ressu
reMax
permitted
Coarse crushingHyd
rau
lic p
ressu
re
Power Max
permitted

What happens if the feed size changes ?
Smaller
feed size
Capacity up
Finer product
Better shape
Density (t/m3)
Bulk density increases -
higher risk of packing as
feed becomes finer.
1,9
1,8
1,7
1,6
1,5
1,4
0-32 mm
4-32 mm
8-32 mm
12-32 mm
16-32 mm
0-11,2 mm
4-11,2 mm
8-11,2 mm
Density (t/m3)
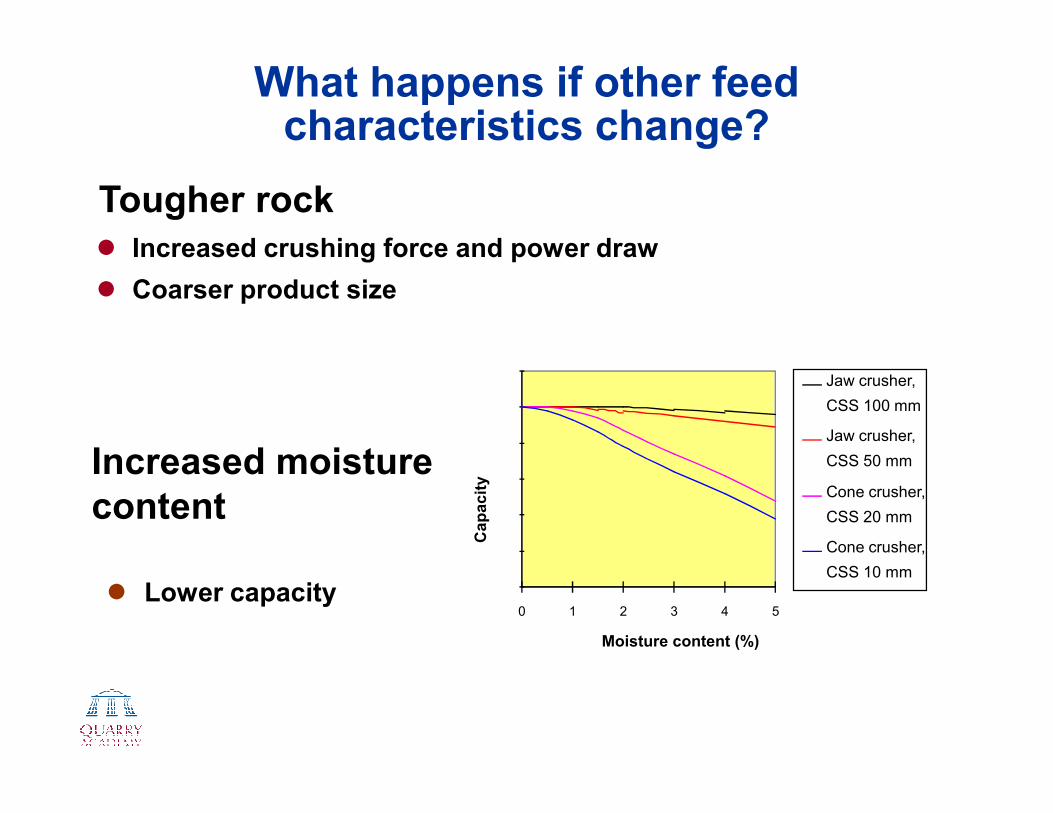
What happens if other feed characteristics change?
� Increased crushing force and power draw
� Coarser product size
Tougher rock
1
1,2
Jaw crusher,
CSS 100 mm
Increased moisture
content
0
0,2
0,4
0,6
0,8
1
0 1 2 3 4 5
Moisture content (%)
Ca
pa
cit
y
CSS 100 mm
Jaw crusher,
CSS 50 mm
Cone crusher,
CSS 20 mm
Cone crusher,
CSS 10 mm
� Lower capacity

What happens if other feed characteristics change ?
Higher density Higher capacity
More cubical
Rounder shape Faster flow Higher capacity
Improved feed particle shape

Cone CrushersProduct Quality
30
40
50
60
70
80
90
100
%-Passing
Feed
H3800 F
� Good Flexibility
� Higher crushing forces
� Good shape in the 5-80 mm range
� Uniform reduction ratio
0
10
20
30
0,1 1 10 100Aperture (mm)
�Good shape product area

Impactors – HSI and VSI Product quality
30
40
50
60
70
80
90
100
%-Passing
Feed
RP108
� Better shape
� Good shape in the +40 micron range
� Uneven Reduction
� Limited topsize capacity
� High fines production
0
10
20
30
0,1 1 10 100
Aperture (mm)
�Good shape product area

Crushing General
Take Home Messages
1. Do you have the optimum chamber fitted to your crusher
2. Where available, do you have the optimum throw
1&2 are volumetric issues and may well determine the utilisation of the
crusher ---remember all crushers work best when continuously choke
fed
3. Do you have the crusher setting optimised.
4. Is the feed condition correct—have you removed the risk of packing
5. Do you have the optimum speed

Operating principlesThe crushing result is difficult to
predict
Cham
ber size
Cham
ber design
Eccentric speed
Eccentric throw
Setting (CSS)
Feed m
aterial strength
Feed size
Feed shape
Feed m
oisture content
Input parameters
Cham
ber size
Cham
ber design
Eccentric speed
Eccentric throw
Setting (CSS)
Feed m
aterial strength
Feed size
Feed shape
Feed m
oisture content
Capacity X X X X X X X
Power consumption X X X X X X X X X
Crushing force X X X X X X X X X
Product size X X X X X X X X X
Product shape X X X X X X X
Product strength X X X X X X
Crushing
result
X = Interdependency

Influencing factorsTake Home Message
All crushers have a volumetric and a mechanical limit.
Toughness of material, feed material grading analysis ,volume
and reduction ratio all play their part in the ability of the crusher
to perform the duty over an acceptable lifecycle.to perform the duty over an acceptable lifecycle.
If any combination of these factors overstress the mechanical
capability of the crusher it will be necessary to reduce the
influence of another.
EG -The demand for greater throughput at the expense of
reduction.

Conclusions
� the work done in a crusher is dependant on
� material factors such as
1. toughness,
2. bulk density
3. feed size analysis
Take Home Message
There are so many variables that to
maximise performance it is
necessary to understand how these
� machinery factors such as
1. setting
2. throw
3. chamber volume
4. speed
necessary to understand how these
factors and any consequent wear
affect the end result.
This can only be done by in-process
testing.
Problems
Some areas of concern which destroy
good operation with cone crushers

Reaction Force F1 Crushing Force
FF1+F2
F3α
Cone crusher
Pressure Reflects Crushing Force
Reaction Force F2
Reaction Force F3
Area of Piston: A
Hydroset pressure
pF
A
F a
A= =
⋅3 cos
i.e. proportional to F

Reaction to uneven, segregated feed
Crushing Force
FF1+F2
F3
Crushing ForceF4+F5
F6
F
Throughout every
revolution both power
F4 +F5 > F1+F2
F3 > F6
As wear becomes uneven
the power and pressure
F1 F4
F2 F5 revolution both power
and pressure will
fluctuate considerably,
causing extreme cyclic
stress on machine
component parts. This
will require the setting to
be run wider than
necessary
the power and pressure
fluctuation will become
exaggerated, the setting
more difficult to control and
the product grading and
quality will deteriorate.
Zero reaction at any point during the revolution
will suggest a portion of the chamber is empty
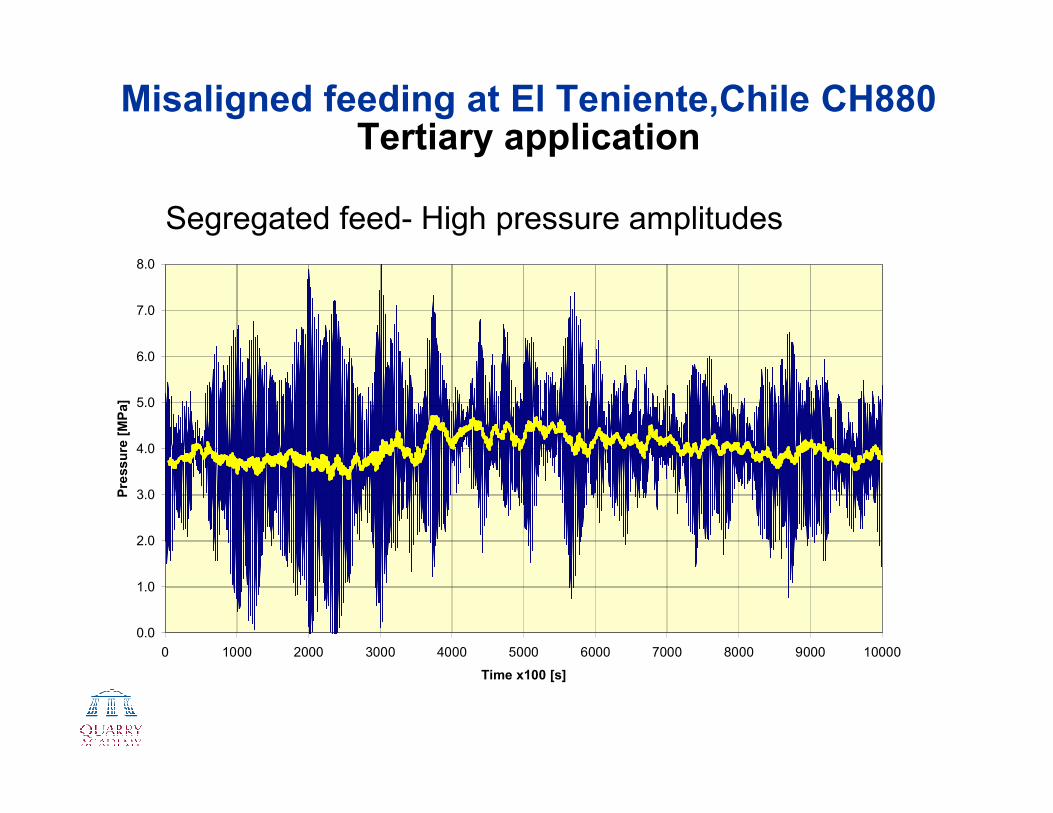
Misaligned feeding at El Teniente,Chile CH880 Tertiary application
Misaligned Feed
5.0
6.0
7.0
8.0
Pre
ss
ure
[M
Pa]
Segregated feed- High pressure amplitudes
0.0
1.0
2.0
3.0
4.0
5.0
0 1000 2000 3000 4000 5000 6000 7000 8000 9000 10000
Time x100 [s]
Pre
ss
ure
[M
Pa]

Improved segregation
Aligned feed
5.0
6.0
7.0
8.0
Pre
ss
ure
[M
Pa
]
Unsegregated feed- Low pressure amplitudes
0.0
1.0
2.0
3.0
4.0
5.0
0 1000 2000 3000 4000 5000 6000 7000 8000 9000 10000
Time x100 [s]
Pre
ss
ure
[M
Pa
]

Effects of vertical crushing force
Vertical force taken by single
hydraulic cylinderVertical force taken by cylinders
used to hold topshell to bottomshell

What are the negative effects?
� High power and pressure will cause the crusher to be run at wider than necessary settings resulting in coarser product producing higher recirculating loads with increased conveying, wear and crushing costs.
� Occasionally the necessity for increased crushing will demand increased capital investment.
� Segregated and poorly distributed feeds will cause the crusher liners to wear unevenly,again with deteriorating performance and associated costs.
� This applies also to poorly fed HSI crushers where hammer wear and curtain liner wear is biased to one side.

What are the negative effects?
� Product will become coarser and cubicity, often in critical products, will deteriorate. What cost??
� Segregation and uneven wear will cause reduction in liner life through premature exchange. What cost??
� Segregation and uneven wear will cause reduction in mechanical component life, sometimes leading to traumatic failure and the costs of unplanned stoppages.
� THE CUMMULATIVE EFFECT ----- CONSIDERABLE COST TO THE OPERATION.

Poor feeds-Inclined belt conveyorsA common feed method, but unless considerable care is taken,possibly the most unsatisfactory method of feeding cone crushers.
� Material is segregated by the “tamping” action of the idler sets as material passes over.
� Belt speed.
1. Material leaving the end pulley follows a parabola. The path depends on the speed of the belt.
2. Coarse material, with greater mass, will tend to travel further than finer 2. Coarse material, with greater mass, will tend to travel further than finer material.
3. This segregation will become more pronounced the greater the differential size and the higher the conveyor speed.
� Belt width. Improvement in materials and restrictions on capital investment have possibly created a trend towards narrower but higher speed belts. These not only segregate but lack the capability to distribute sufficiently.
� Discharge height.

www.quarryacademy.com