gestão de energia energy audits
DESCRIPTION
Gestão de Energia Energy audits. Carlos A. Santos Silva Professor Associado Convidado Cátedra WS – Energia Departamento de Física [email protected]. Outlook. Energy Audit Energy Services Energy Efficiency Measures Measurement and Verification. Energy Audit. - PowerPoint PPT PresentationTRANSCRIPT

Gestão de EnergiaEnergy audits
Carlos A. Santos SilvaProfessor Associado Convidado
Cátedra WS – EnergiaDepartamento de Física

Outlook
• Energy Audit• Energy Services• Energy Efficiency Measures• Measurement and Verification

3
ENERGY AUDIT

Overall objectives
• Detailed analysis of the energy use in a certain equipment, activity,
installation , building, campus:
– Where energy is used
– When energy is used
– How energy is used
• Through an audit it is possible to:
– identify/model the required energy services
– Design a solution to improve the energy use and supply
• Equipment replacement, process change, user behaviour change

Energy Audit Phases
• Preparing and Planning
• Facility inspection
• Field Work
• Data analysis
• Energy audit reporting
• Energy Action Plan

Action Plan
• An action plan is a strategy plan to increase
the energy efficiency of the facility
– It describes the solutions
– It describes the efficiency objectives
– It describes the implementation plan
• This plan results from the energy audit

7
PREPARATION AND PLANNING

Tasks
• Collect data regarding energy use
– Energy bills (3 or more years if available)
• Collect data regarding building envelope and equipment's
– Location and weather data
– Building description (blueprints, bill of materials, etc.)
– Characteristics of the main equipment's
– Functional organization
• Preliminary data analysis
– Find any awkward result

Preliminary visit
• Visit together with the facility manager to see
how the facility operates
• Collect missing data (if available)
• Observe the building envelope
• Identify “low-hanging fruit” savings

10
FACILITY CHARACTERIZATION
Objective
• Detailed analysis of the collected data– Evaluate energy consumption baseline (normalize
climate data)– Prepare energy balance– Identify energy services
• Characterize equipment's performance

Main Equipments• Heating and cooling
– Hot water and steam boilers– Chillers and cooling towers– Ait treatment units– Ventilation units– Pumps and pipes– Air conditioning units– Air conditioning controllers
• Hot Water– Tankers
• Lighting– Lights– Ballasts– Controllers

Other Equipments
• Elevators and other mechanical transportation systems
• Specific equipment's of the building– Monitors in hospitals, TVs in restaurants
• Refrigeration equipment's in kitchens , laundries, pools
• Energy generation systems (solar, co-generation)• The efficiency of every heat generation system
should be verified

Field Work Plan
• With the collected data and the characterization of the facility, prepare the field work:– The list of equipments that will be measured– The list of equipments that needs to be used for
measurement– The measuring procedure (one point measure,
long data collection)– Interviews to be done to complete information

15
FIELD WORK

Main activities
• Measure energy consumption of main sectors/equipments
– Productive systems, hot water, heating and ventilation
– Identify lack of maintenance
• Verify electric installations
• Verify HVAC and lighting controllers
• Continuous monitoring or main consumption points of energy to obtain load
diagrams
– One day
– One week

Complementary activities
• Complementary measurements to collect information – Room temperatures– Room luminance
• Characterize schedule of main equipments (interviews, observations)
• Characterize the envelope in detail and how users interact with it (interviews, observations)
• Characterize utilization patterns

Audit Equipment
Thermometer Thermo-hygrometer Lux meter Current Clamp
Network analysersThermography

19
DATA ANALYSIS

Objectives
• Disaggregation of energy consumption by energy services
– Complete energy balance
• Develop load diagrams
– Daily, weekly and if possible annual evolution
• Evaluate energy indicators, specific consumptions
– Deviation form disaggregation and indicators should provide
hints regarding energy efficiency measures

Activities
• Evaluate efficiency of the equipments and installations and
estimate savings from equipment replacement, process change
or behaviour change or installation of generation equipments
• Evaluate technical feasibility of doing equipment replacement,
process change of behaviour change
• Due the economic evaluation of implementing such measures
• Determine facility energy class

Energy balance
• The energy balance disaggregation should be in an annual
basis
– Consider average consumption of the last 2/ 3 years, suing
information from energy bills
– Consider the information gathered in the audit
• Equipment's use schedule
• Equipment's characterization
• Equipment's measurements
• Simulation (software)

Simulation
• Objective is to obtain the energy consumption considering the utilization, the equipments, the envelope
• The model should be adjusted to the field measurements
• The calibrated simulation will enable:– Testing different energy efficiency measures

Energy bills
• Evaluate the average consumption across the year– With more than one year, the influence of
weather of activity may be filtered• Verify correctness of tariffs• Evolution of used power– Impact of equipments or activity change

25
AUDIT REPORT & ACTION PLAN

Objective
• Describe the energy demand of the installation and the costs
• Describe the equipment status
• Identify energy efficiency measures, the investment and its potential payback
– Substitution or retrofit of equipment
– Use of more efficient controllers
– Installation of energy management systems
– Introduction of renewable resources generation
• Identify upcoming changes in regulations that may impact on the current energy
use

Action Plan
• From the different measures proposed in the energy audit, identify an implementation plan– Investment plan– Schedule• Low cost measures should be the first to be
implemented• The return of investment period should be the indicator
used to prioritize the measures in the plan• This should be done closely with the energy manager
and the board

Gestão de EnergiaEnergy services
Carlos A. Santos SilvaProfessor Associado Convidado
Cátedra WS – EnergiaDepartamento de Física

Outlook• Space Heating and Cooling
– Thermal balance– Heat transfer– Internal gains– Solar gains– Climate– Comfort– Insulation
• Hot water• Cooking• Food Conservation• Lighting• Entertainment• Work• House keeping• Communication

30
SPACE HEATING (AND COOLING)

Thermal Balance (1)
• Applying the 1st law of thermodynamics– Balance between all the
gains and losses• Solar (S) • Internal(I)• Conduction, convection and
radiation through envelope (T)• Air mass balance/ventilation
(V)

Thermal balance (2)Internal gains Solar gains Ventilation Envelope
Winter + + - -
Summer + + -/+ -/+
(-) Losses (+) Gains

Thermal balance – closed system (3)
• 1st law of thermodynamics– Internal energy variation• Mass includes air, walls, furniture, etc…
– Heat• Transfer through windows, walls, et…• Generation and absorption
– Occupants– Appliances (work consumption)
∆𝑈=𝑄−𝑊∆𝑈=𝑚𝐶𝑣∆𝑇
𝑄=𝑄𝑖𝑛−𝑄𝑜𝑢𝑡
𝑄𝑔𝑒𝑟
=
(𝑄𝑔𝑒𝑟 ≅−𝑊 )

Thermal balance – open system (4)
• 1st law of thermodynamics– Ventilation– Air leakages (infiltrations)
-
-
-

Heat transfer gains
• Conduction• Convection• Radiation
�̇�=𝑘𝐴𝑇1−𝑇 2
𝐿�̇�=h𝐴 (𝑇 1−𝑇2 )
�̇�=𝜀𝜎 𝐴 (𝑇14−𝑇 24 )

I)
• Electric appliances– Computers • Heat generation in power sources, processor
– Lighting• Radiation and convection
– Occupants• Radiation, convection, latent heat (water vapour)
We do not consider here the heat generation from radiators, fireplaces, AC

Energy generated by occupants
Solar gains
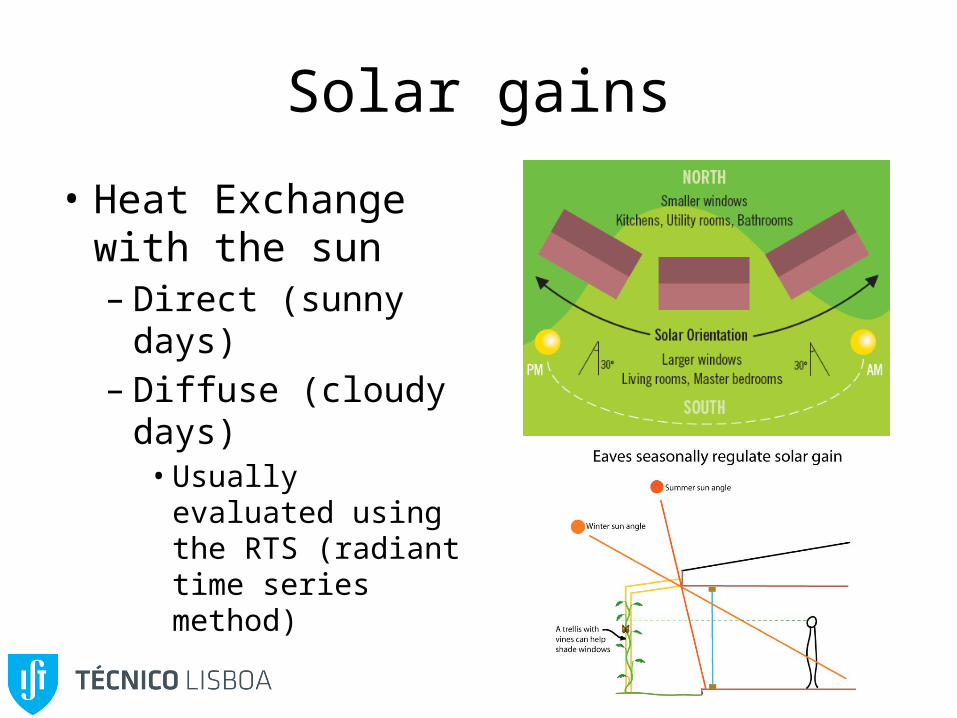
• Heat Exchange with the sun– Direct (sunny days)– Diffuse (cloudy days)• Usually evaluated
using the RTS (radiant time series method)
Air exchanges and leakages
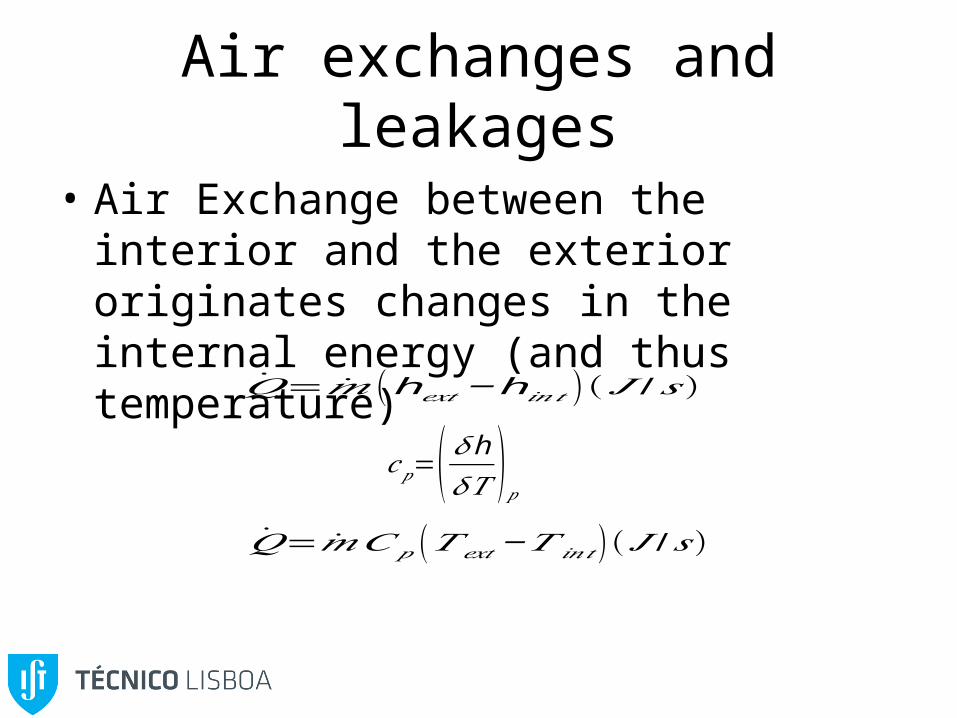
• Air Exchange between the interior and the exterior originates changes in the internal energy (and thus temperature)
�̇�=�̇� (h𝑒𝑥𝑡−h𝑖𝑛𝑡 )( 𝐽 /𝑠 )
�̇�=�̇�𝐶𝑝 (𝑇𝑒𝑥𝑡−𝑇 𝑖𝑛𝑡 ) ( 𝐽 /𝑠)
𝑐𝑝=( 𝛿 h𝛿𝑇 )𝑝

40
Dynamic simulation
• It allows to evaluate all heat exchanges and calculates heating and cooling needs
Open Studio
Design Builder

41
THE INFLUENCE OF CLIMATE

Degree Days• Simple and direct method (though incomplete) to
characterize the climate of a certain region
– It measures the product between the number of days and the
number of degrees that the interior temperature is lower
(heating) or higher (cooling) than a certain comfort temperature
• Heating degree days (HDD)
• Cooling degree days (CDD)
𝐻𝐷𝐷 (𝑇 𝑐𝑜𝑛𝑓 )= 124∑𝑖=1
8760
𝑚𝑎𝑥 (𝑇𝑐𝑜𝑛𝑓 −𝑇 𝑒𝑥𝑡 ,𝑖 ,0 )𝐶𝐷𝐷 (𝑇𝑐𝑜𝑛𝑓 )= 124∑𝑖=1
8760
𝑚𝑎𝑥 (𝑇 𝑒𝑥𝑡 ,𝑖−𝑇 𝑐𝑜𝑛𝑓 ,0 )

43
HDD and CDD in Europe

44
THERMAL COMFORT

Comfort temperature
“mind state that expresses satisfaction about the thermal environment”
• Human comfort depends on the ability to control the body temperature between 36 and 37ºC
• It depends on the balance between heat exchange– It is not only about air temperature
• It depends on the humidity (evaporation/transpiration)– It depends on the activity, clothes, etc…

Comfort conditions
• Temperature: 20 to 27ºC• Relative humidity: 30 to 60%

47
INSULATION

Thermal and air leakage insulation

Thermal bridges
• It describes the disruption of the thermal insulation due to the existence of a material with high conductivity
• They can represent up to 20% losses

Green roofs and facades
• Adds width (L) with a fairly good insulation – k: 0.18 a 0.41 W/mK– Concrete roof k=1.4 W/mK
• Has impact on radiation and convection through latent heat

51
HOT WATER

Hot Water
• Water used for– Showers– Washing (dishes, clothes, house cleaning)
• Important Variables• Litters of water• Final temperature (Hot)• Initial temperature (Cold)
• Energy∆𝑈=𝑚𝐶𝑝∆𝑇
Water usage
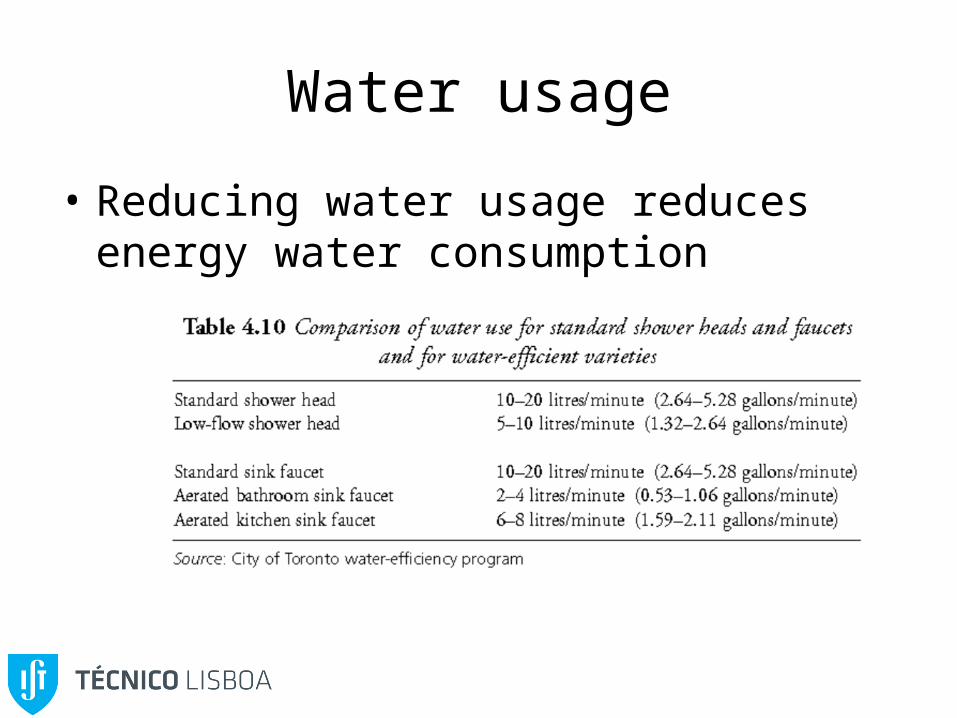
• Reducing water usage reduces energy water consumption

Water Temperature
• The Final Temperature has two conflicting constraints
– Skin scalding (5s at 60ºC)
– Bacterial Contamination (e.g. Legionella)
• The European Guidelines for Control and Prevention of Travel Associated
Legionnaires’ Disease recommend that hot water should be stored at 60
°C (140 °F) and distributed such that a temperature of at least 50 °C (122 °F) and
preferably 55 °C (131 °F) is achieved within one minute at points of use
• The Initial Temperature
– Depends on the ambient temperature
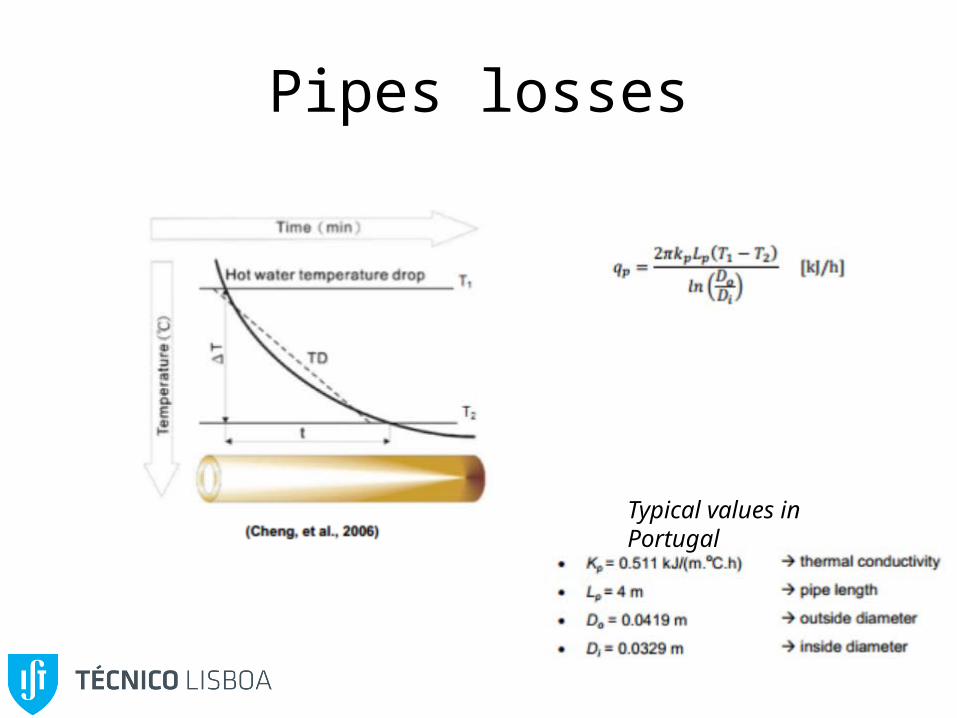
Pipes losses
Typical values in Portugal

56
LIGHTING

The importance of lighting
• The way we “feel” in a certain environment depends on the light

Transparent vs. Opaque spaces
• Glazed facades gives spaces a lighter appearance– Daylight availability (+)– Heating by solar radiation (+)– Conduction exchanges (+)– Visual comfort problems (-)

Light design (natural + artificial)
• Light impacts directly on – Visual Comfort– Productivity– Energy Consumption
• These objectives are sometimes conflicting
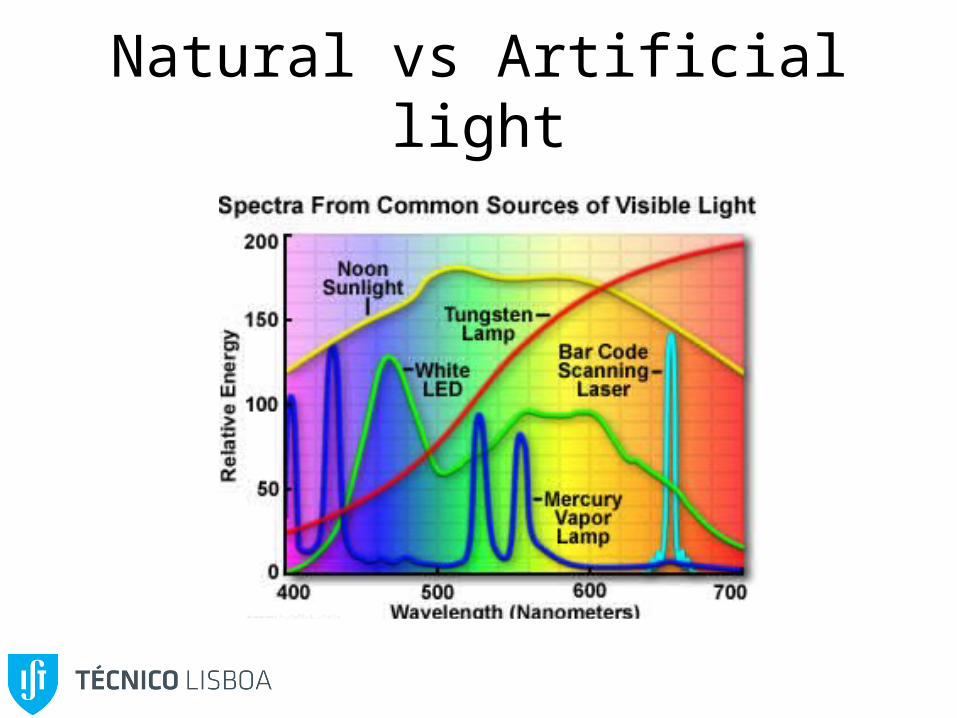
Natural vs Artificial light

Measuring “Light”
• Luminous Flux – quantity of light emitted by a luminous source in all possible directions (lm)
• Luminous Efficacy – Ration between the luminous flux and the power of the source (lm/W)
• Luminous intensity – Luminous flux per unit of solid angle (cd)
• Illuminance – ration of luminous flux by the area of incidence (lux=lm/m2)
• Luminance – ration between luminous intensity emitted in a given direction and the apparent area of the luminous

Visual Comfort
• Visual comfort is a subjective impression related to quantity, distribution and quality of light.
• Visual comfort is reached when objects can be seen clearly, without tiredness and in a pleasantly colored environment– The level of illumination of the visual task;– The luminous distribution in the space (light repartition,
luminance ratio and embarrassingly shading);– The sight towards outside;– The colour rendering and the colour of the light source;– The absence of glare.

Illuminance
• Type of space
• Activity

Glare
• Visual conditions in which there is excessive contrast or an inappropriate distribution of light sources that disturbs the observer or limits the ability to distinguish details and objects (CIE)
• Difficulty to see in the presence of bright light (natural or artificial)– caused by a significant ratio of luminance between the
task and the glare source. – Depends on the angle between the task and the glare
source and eye adaptation

General characteristics of artificial light

Artificial light efficiency

Artificial light colour

Luminaire cleaning

69
ELECTRIC SERVICES

Electric Power
• Not all the power is useful

Power in AC (P=UI)• Inductance and capacitance elements cause
energy flow changes (AC)– Capacitance introduces a 90º lead between
current and voltage– Inductance introduces a 90º lag between current
and voltage
RC RL
R
C L

Electricity bill (low voltage)

Electricity bill (medium voltage)

Food Conservation

75
Refrigerator Labelling

Working
• Personal computer– CPU • awake 120 W• asleep = 30 W
– Monitor • awake 150 W• asleep = 30 W
– Laptop = 50 W

Working (2)
• Printers– Inkjet
– Laser
• Scanner
• Copy
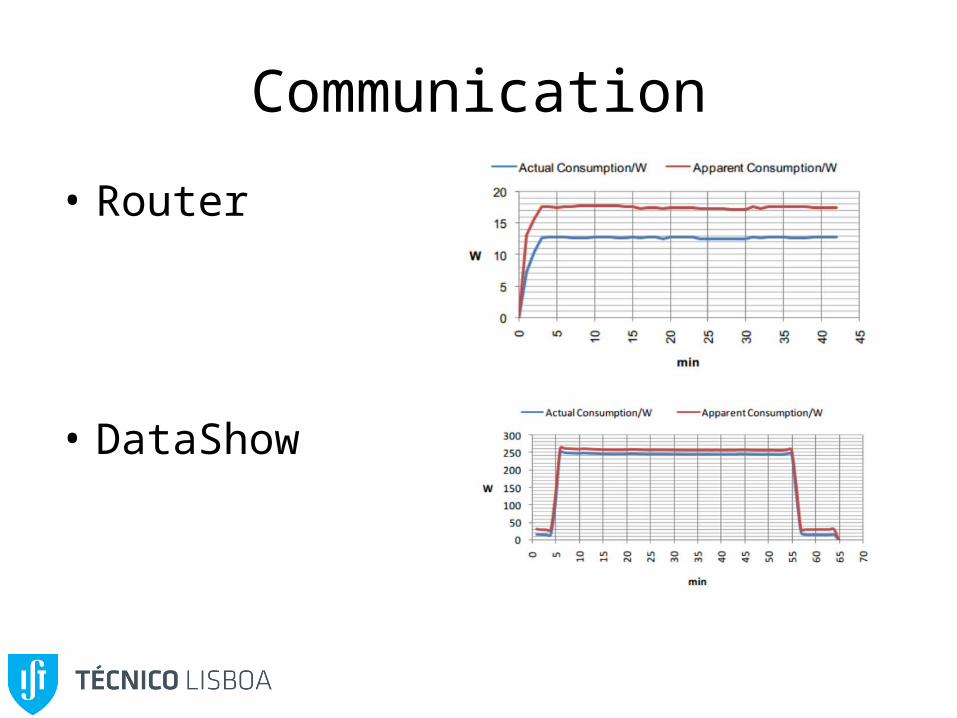
Communication
• Router
• DataShow

Gestão de EnergiaEnergy efficient measures
Carlos A. Santos SilvaProfessor Associado Convidado
Cátedra WS – EnergiaDepartamento de Física

Gestão de EnergiaMeasure and Verification
Carlos A. Santos SilvaProfessor Associado Convidado
Cátedra WS – EnergiaDepartamento de Física

Outlook
• Measure & Verification• IPMVP– Introduction– Definitions– Framework

83
MEASURE AND VERIFICATION

Definition
• Process to quantify the savings associated with the
implementation of energy efficiency measures
– Measures energy, not the cost
– It is necessary to evaluate economic savings
– It is based in the application of a methodology
• International Performance Measurement and Verification Protocol (IPMVP)
• ASHRAE Guideline 14:Measurement of Energy and Demand Savings
• eeMeasure

IPMVP application

Energy Conservation Measure (ECM)
• An activity or set of activities designed to increase the energy efficiency of a facility, system or
piece of equipment.
– ECMs may also conserve energy without changing efficiency.
• Several ECM's may be carried out in a facility at one time, each with a different thrust.
• An ECM may involve one or more of:
– physical changes to facility equipment,
– revisions to operating and maintenance procedures,
– software changes,
– or new means of training or managing users of the space or operations and maintenance staff.
• An ECM may be applied as a retrofit to an existing system or facility, or as a modification to a
design before construction of a new system or facility.

Savings
• The reduction in energy use or cost.
– Physical savings may be expressed as avoided energy use or
normalized savings
– Monetary savings may be expressed analogously as “cost
avoidance” or “normalized cost savings”
• Savings, as used in IPMVP, are not the simple difference
between baseline and reporting period utility bills or
metered quantities.

Normalized Savings
• The reduction in energy use or cost that occurred in the reporting period, relative
to what would have occurred if the facility had been equipped and operated as it
was in the baseline period but under a normal set of conditions.
• These normal conditions may be a long term average, or those of any other chosen
period of time, other than the reporting period.
• Normal conditions may also be set as those prevailing during the baseline period,
especially if they were used as the basis for predicting savings.
• If conditions are those of the reporting period, the term avoided energy use or just
savings, is used instead of normalized savings.

Estimate
• A process of determining a parameter used in a savings calculation through
methods other than measuring it in the baseline and reporting periods.
• These methods may range from:
– arbitrary assumptions
– engineering estimates derived from manufacturer’s rating of equipment
performance.
– Equipment performance tests that are not made in the place where they are used
during the reporting period are estimates, for purposes of adherence with IPMVP.

Baseline Period
• The period of time chosen to represent operation of the facility or
system before implementation of an ECM.
• This period may be as short as the time required for an instantaneous
measurement of a constant quantity, or long enough to reflect one full
operating cycle of a system or facility with variable operations.
– Baseline Energy: The energy use occurring during the baseline period without
adjustments
– Adjusted-baseline energy: The energy use of the baseline period, adjusted to a
different set of operating conditions.

Reporting Period
• The period of time following implementation of an ECM when savings reports
adhere to IPMVP.
• This period may be :
– as short as the time for an instantaneous measurement of a constant quantity;
– long enough to reflect all normal operating modes of a system or facility with variable
operations;
– the length of the financial payback period for an investment;
– the duration of a performance measurement period under an energy performance
contract;
– or indefinite.

Adjustments
• Routine Adjustments: The calculations shown in the M&V Plan to account for changes in
selected independent variables within the measurement boundary since the baseline period.
– Independent Variable: A parameter that is expected to change regularly and have a measurable impact
on the energy use of a system or facility.
• Non-Routine Adjustments: The individually engineered calculations to account for changes in
static factors within the measurement boundary since the baseline period.
– When non-routine adjustments are applied to the baseline energy they are sometimes called just
“baseline adjustments”
• Baseline Adjustments: The non-routine adjustments arising during the reporting period from
changes in any energy governing characteristic of the facility within the measurement boundary,
except the named independent variables used for routine adjustments.

Measurement Boundary
• A notional boundary drawn around equipment and/or
systems to segregate those which are relevant to
savings determination from those which are not.
• All energy uses of equipment or systems within the
measurement boundary must be measured or
estimated, whether the energy uses are within the
boundary or not

94
IPMVP FRAMEWORK

Savings
Savings = Baseline-Period Use / Demand – Reporting-Period Use / Demand ± Routine Adjustments ± Non-Routine Adjustments

M&V Design
• Define a M&V plan (duration, accuracy) according to the available
budget and needs
• Gather relevant energy and operating data from the baseline
period and record them in away that can be accessed in the future
• After the ECM is installed, ensure it has the potential to perform
and achieve savings by conducting operational verification
• Compute and report savings