geotechnical testing journal
TRANSCRIPT

GeotechnicalTesting JournalSenthil Ganesan,1 Matthew Kuo,2 and Malcolm Bolton1
DOI: 10.1520/GTJ20130008
Influences on Pipeline InterfaceFriction Measured in DirectShear Tests
VOL. 37 / NO. 1 / JANUARY 2014

Senthil Ganesan,1 Matthew Kuo,2 and Malcolm Bolton1
Influences on Pipeline Interface FrictionMeasured in Direct Shear Tests
Reference
Ganesan, Senthil, Kuo, Matthew, and Bolton, Malcolm, “Influences on Pipeline Interface Friction Measured
in Direct Shear Tests,” Geotechnical Testing Journal, Vol. 37, No. 1, 2014, pp. 1–13, doi:10.1520/
GTJ20130008. ISSN 0149-6115
ABSTRACT
This paper presents the design and use of an interface direct shear testing device called the
Cam-shear apparatus. This device permits the testing of very soft marine clays against
pipeline interface material, and can be utilised to determine the interface friction value and
the soil strength. The results from a series of interface and soil–soil tests using reconstituted,
reconsolidated marine clays are presented. The Cam-shear device is shown to be a useful
tool for pipeline design, particularly where very low normal stress levels are required, with
stresses ranging from 1 to 4.5 kPa presented herein. The results demonstrate that the peak
interface friction value is influenced by the preconsolidation pressure (overconsolidation
ratio), the rate of shearing (governed by the drainage condition) and the interface
roughness (rough or smooth). The rate at which peak strength reduces is strongly
dependent on both the rate of shearing and the interface roughness.
Keywords
marine clay, sediment, laboratory tests, shear, interface, pipelines
Introduction
Characterisation of interface shear behaviour for deepwater hot oil pipelines requires site-specific
testing of soil samples. These pipelines are often permitted to self-embed into the seabed sedi-
ments without prior trenching or burial, although recent observations highlight the potential for
remoulding of surface sediments during the pipe laying process (White et al. 2012). During opera-
tion, hot oil passes through the initially cold pipe causing hundreds of thermal expansion and con-
traction cycles. Expansion in the axial direction may result in movements of several metres,
causing lateral buckling of five to twenty pipe diameters (Bruton et al. 2007; White and Cheuk
2008) equivalent to many metres on each occasion. One design approach for these unburied
Manuscript received January 8, 2013;
accepted for publication September 26,
2013; published online October 30, 2013.
1
Cambridge Univ., Cambridge, CB2 1PZ,
UK
2
Cambridge Univ., Cambridge, CB2 1PZ,
UK (Corresponding author).
Copyright VC 2014 by ASTM International, 100 Barr Harbor Drive, PO Box C700, West Conshohocken, PA 19428-2959. 1
Geotechnical Testing Journal
doi:10.1520/GTJ20130008 / Vol. 37 / No. 1 / JANUARY 2014 / available online at www.astm.org

pipelines is “controlled buckling,” where designers attempt to
limit lateral bucking to safe levels over the lifetime of the pipe-
line. Control of lateral movements is reliant on the short and
long term resistance to pipeline relative movement provided by
the soil in the axial direction in the adjacent anchor zones that
feed pipe into the buckle. Resistance is quantified using the
peak and residual shear strengths both of the soil, and the soil–-
pipeline interface. However, it is the axial soil–pipeline coeffi-
cient of friction (l) that is more difficult to quantify.
A recent study using a long-pipe setup to investigate axial
pipe–soil interaction on sediments from West Africa (White
et al. 2011) highlighted the importance of obtaining an
improved understanding of the complicated interplay between
speed of sliding, pipeline interface roughness, and soil stress
state. To better understand the potential variability of l subject
to these factors, the use of a shearing device capable of testing
very soft clays at different shearing speeds and against interfaces
of various roughnesses, all at very low effective confining pres-
sures, is required. This paper presents the results of a series of
tests using an interface shear apparatus called the “Cam-shear,”
which is capable of these determinations. This paper describes its
use with reconstituted clays, including disturbed samples from
offshore west Africa, which were taken through an overconsolida-
tion cycle in the laboratory to achieve soil strengths representative
of the ocean bed. The use of remoulded clay permits improved
repeatability and limits the difficulties in interpreting complex
data obtained when testing highly structured natural sediments.
EXISTING SHEARING DEVICES
Only a limited number of commonly-available laboratory devi-
ces are capable of assessing the soil-structure interface of off-
shore pipelines on soft marine clays. These devices include the
ring shear and tilt table apparatus. A number of studies have
considered the use of these devices, particularly for analysis of
residual strengths, as summarised in Table 1. Early investigations
focused on the internal strength of reconstituted soils rather
than interfaces, as outlined below.
Lupini et al. (1981) considered the drained residual strength
of clay and clay–sand mixtures during testing of samples with a
ring-shear device and identified the presence of three main
shearing behaviours: turbulent, transitional, and sliding. These
phases were found to be dependent on particle shape and angu-
larity, which controls the inter-particle friction.
Skempton (1985) considered the residual strength of clay–
sand mixtures present in landslides, and compared their behav-
iour to tests reported by Lupini et al. (1981). Lemos and
Vaughan (2000) undertook interface shear tests with ring shear
and conventional direct-shear boxes. Interfaces of varying
roughness were used to investigate the influence of interface
roughness on interface shear strength. It was concluded that
samples with a high clay content produced residual interface
strengths that were independent of the interface roughness, and
comparable with soil–soil residual strengths.
Stark and Contreras (1996) and Stark and Eid (1993,1994)
describe the use of a modified Bromhead ring shear apparatus
to complete the undrained and drained shear strength testing of
a large number of clays and shales. Both peak (Stark and Con-
treras, 1996) and residual (Stark and Eid, 1994) strengths were
analysed. Applied normal stresses were relatively large (between
60 and 850 kPa) and related to the application of terrestrial
landslides and dam failures.
Najjar et al. (2007) describes the design and use of a tilt-
table test device to measure the drained residual shear strength
of pipeline-clay interfaces subject to low (1.7 to 5.8 kPa) normal
stresses. The clay is reconstituted, smeared over the model
interface, loaded by a deadweight, and is then permitted to
TABLE 1 Summary of existing interface shearing devices.
Shearing device Sample condition Interface Stress level (kPa) Comments / Limitations Reference
Ring shear Remoulded Rough and smooth 20 to 60 - Only remoulded samplescan be tested due to nature ofsample preparation - Appara-tus internal friction limits theminimum achievable stress
Colliat et al. (2011)
Remoulded Rough (coarse sand blasting)and smooth (glass)
50 to 400 Lemos and Vaughan(2000)
Remoulded Rough and smooth 10 to 50 Fugro (2010)
Tilt table Remoulded Smeared 5 to 30 - Only remoulded samplescan be tested due to nature ofsample preparation - Thestress distribution on the
interface varies depending onthe angle of the table - Shear-ing displacement is limited to
size of table
Pederson et al. (2003)
Low stressshearbox (UWA)
Remoulded Rough and smooth > 2.5 kPa - Only remoulded sampleshave been tested - Shearing
displacement is limited to sizeof interface material
White et al. (2012),Hill et al. (2012)
Geotechnical Testing Journal2

drain, coming into a normally consolidated condition before
being tilted so that the deadweight creates shear stress. Due to
the limitations of the method utilised to mobilise the failure
mechanism, each shearing episode was only permitted to travel
13mm, which was repeated to achieve a cumulative total shear-
ing distance of about 100mm. A range of interface materials
were used with estimated roughnesses of 10 and 50lm.
Colliat et al. (2011) present a large data-set of ring-shear
test results relating to the interface strength of soft clays against
rusty steel (“rough”) and coated (“smooth”) interfaces. These
tests were undertaken at normal stress levels applicable to the
design of suction caissons; therefore at levels higher than those
experienced by self-embedded pipelines.
As shown in Table 1, there are a number of limitations in-
herent to these devices. Key limitations include the inability to
test natural core samples, high internal friction values, and diffi-
culties in maintaining constant normal stresses at the sheared
interface. Neither the ring-shear nor the tilt table device can
therefore fully satisfy the requirements of an interface shearing
device for low effective stress pipeline testing, which is required
to consider the following items:
• testing of both natural and remoulded samples,• testing samples at very low stress levels consistent with
applied design stresses,• unrestricted shearing on soil–coating interfaces,• measurement of both peak and “residual” strengths,• shearing at a broad range of rates, and• shearing on a range of interface roughnesses.
The lateral resistance to pipeline movement involves shear-
ing internally on a sub-horizontal surface beneath a soil berm
pushed upwards as the pipe translates (White and Cheuk 2008).
Since soft sediments are expected to be anisotropic, an ideal test
would shear soil internally on a horizontal plane. Axial resist-
ance additionally requires soil-interface shearing.
More recently, direct shear testing devices have been modi-
fied to create a machine that is able to cover some of the above
points (e.g. White et al. 2012). Limitations, however, still exist,
such as the ability to achieve “residual” strengths (see Table 1).
White et al. (2012) presents data using a modified shear box
permitting testing at low stress levels, albeit through a shearing
distance of only 10mm. Reversal of shearing direction is also
possible with the modified shear box; although, it is clear this
testing procedure results in a significant variation in vertical dis-
placement during each cycle of shearing.
The Cam-shear device described in this paper is another
machine that attempts to deliver all the facilities listed above.
The strength data that emerges can be described in terms of
total stresses, with internal soil strength s* and interface
strength s. Parameters with respect to effective stresses are diffi-
cult to validate since the excess pore pressure at an interface can
only be measured through the filter ceramic of an embedded
transducer, and this may not be representative of the value
induced by the interface material under test. In the work that
follows, this philosophical difficulty is avoided by quoting the
ratio of shear strength on the plane of interest to the pre-
existing normal effective stress, achieved after a substantial
period of pre-consolidation. In that way, apparent friction coef-
ficients l* for internal soil shearing, and l for soil-interface
shearing can be quoted. These are analogous to consolidated-
undrained soil strength parameters, although in this case the
degree of drainage during shearing will depend on the test
duration.
Cam-Shear Device
TESTING PROCEDURE
The Cam-shear device is a direct shear apparatus with negligible
friction in the system, which allows test conditions to approxi-
mate the stress levels experienced by soils under pipelines. It
was originally developed for the shearing of granulated bones at
low stress levels by Dunlop et al. (2000). It was then modified to
allow the simulation of axial pipe–soil interaction behaviour
through the dragging of a clay sample exhibiting low undrained
shear strength over a flat sheet of pipe coating material such as
polypropylene or polyethylene (Haustermans 2002).
The key advantages of the Cam-shear device over existing
interface testing devices are its simplicity and ease of application
to axial pipeline behaviour, including shearing rates and pipe-
line stresses. The Cam-shear device comprises a split-plane
shear box with an open base and an actuator, as shown in a
schematic diagram and photographs of the whole device (Fig. 1).
The shear box consists of two 100 by 100mm blocks of polytet-
rafluoroethylene (PTFE), each 20mm thick, with a central cir-
cular bore of 75mm diameter to house the soil sample.
Additional shear boxes can be specifically made for the testing
of natural core samples that have a different diameter than
those considered in this paper.
PTFE is used to minimise the inherent friction in the sys-
tem. The weight of the sliding portion is only 0.583 kg (equiva-
lent to a normal stress on the shear plane of 0.51 kPa) and the
coefficient of friction between PTFE and smooth polypropylene
is approximately 0.1. The sliding friction of an empty box is
therefore equivalent to an inferred shear stress of approximately
0.1 kPa over the test area. The interface shear strength of the
soil is measured by dragging the shear box, containing the clay
sample, over a flat sheet of interface material. The Cam-shear
arrangement also allows the consolidation of the sample against
the interface material and therefore represents a simplified
arrangement representing a pipeline coating interface moving
above a sample of clay. If the coefficient of side friction between
PTFE and clay is also taken as 0.1, the average vertical stress on
the interface would be reduced by 10 %. It follows that the mag-
nitude of the soil-interface friction coefficient would be
GANESAN ET AL. ON CAM-SHEAR DEVICE FOR PIPELINE INTERFACE TESTING 3

underestimated by 0.01. The vertical effective stress at the inter-
face is created by the self-weight of the tested sample and the
applied vertical load. At the soil–soil shear plane, the vertical
effective stress is slightly smaller, corresponding to half the self-
weight of the tested sample and the applied pipeline load. These
small adjustments can easily be allowed for.
The internal shear strength of the clay sample s* can also
be measured by removing the locking pins and splitting the
shear box at its mid-depth (see Fig. 1). The top of the box is
moved relative to the bottom to impose shear failure in the soil.
Normal stress corresponding to the pipe weight is either applied
by steel discs bearing on top of the soil sample or by a hanging
loading frame. Drainage layers are inserted between the loading
platen and the clay (at the top of the sample) to allow water to
escape during consolidation and shearing.
A linear push–pull device (actuator) is used to apply rela-
tive displacement between the stationary interface material and
the moving clay sample in the shear box, and also to shear the
clay sample after splitting the box. A 30V DC motor coupled
with a tachometer drives the actuator through a lead screw, as
seen in Fig. 1. Both load-controlled and speed-controlled testing
can be undertaken; although in the series of tests undertaken
herein, only speed-controlled testing is used. The device is used
in this work to run tests at speeds from 5 to 0.005mm/s. A total
stroke length of 190mm can be achieved.
The interface shear strength and the internal soil shear
strength are measured by a 50N load cell (Novatech Z250,
push–pull type) coupling the shear box and the actuator. The
horizontal displacement and the associated shearing rate are
measured using a draw wire potentiometer mounted on the ac-
tuator. A linear variable displacement transducer (LVDT) mon-
itors the vertical displacement in the soil specimen during
sample consolidation. This LVDT was removed prior to con-
ducting shear tests due to the very large magnitude of lateral
displacement.
SAMPLE PREPARATION
The Cam-shear apparatus is designed to accept natural samples
extruded from core tubes. However, the tests reported below
utilised reconstituted, reconsolidated natural marine sediments
from deep water locations off the west coast of Africa. Each
bulk sample of test material was reconstituted at a moisture
content of 1.3 to 1.5 times the liquid limit. The samples were
homogenized by thorough mixing for about 30min, and were
kept under a gauge partial vacuum pressure of 25 kPa for about
20min to remove entrained air bubbles.
FIG. 1
Schematic diagram of the Cam-shear shear
box showing the main features and
photograph of Cam-shear test setup.
Geotechnical Testing Journal4
According to site investigation data obtained at the same site
as the grab sample used in this test programme, the used sedi-
ment has a clay fraction (particles< 2lm) of 60 %. The plastic
and liquid limits are, respectively, 60 and 160 % (from the fall
cone test). The in situ bulk unit weight of the sediment is
13.1 kN/m3 at the natural moisture content of about 180 %. The
soil sample was reconstituted with saline water (salinity 35mg/l).
The coefficient of consolidation of the reconstituted clay sample
was approximately 0.04 mm2/s from one-dimensional swelling
tests corresponding to unloading from 6 kPa to 0.5 kPa.
ONE-DIMENSIONAL CONSOLIDATION
The samples were over-consolidated to match undrained shear
strength profiles obtained during in situ T-bar tests at the off-
shore sites. A maximum consolidation pressure of either 8 or
14 kPa was chosen for these clays.
To enable one-dimensional consolidation, the shear box
was placed on the interface material (polypropylene), and the
gap around the outside base of the box was sealed with a silicon
sealant (marketed under the trade name Geocel Aquaria) so as
to be water-tight at the interface. The sealant could be peeled
off without affecting the interface material. A layer of filter pa-
per, a porous disc, and geotextile was placed between the load-
ing platen and the clay sample to permit single upward
drainage. The consolidation pressure was applied by weights
suspended on a hanger. Consolidation periods were typically
between 1.5 and 2 days. Settlement was measured using an
LVDT resting on the upper surface of the PTFE drainage disc
and logged using a mobile data-logger using the commercial
software, Dasylab.
SWELLING AND RECOMPRESSION
After normal consolidation was complete (as indicated by meas-
urements of the vertical settlement), the sample was permitted
to swell back under a normal vertical stress of 0.5 kPa for at least
one third of the normal consolidation time. This swelling was
followed by recompression under a vertical stress equivalent to
the simulated pipe contact pressure for approximately the same
period again—one third of normal consolidation time.
After consolidation, the silicon seal between the shear box
and the interface material was carefully peeled off. The pipeline
interface surface was kept submerged in a water tray during
shearing to prevent the sample from drying out and to produce
a more representative testing environment.
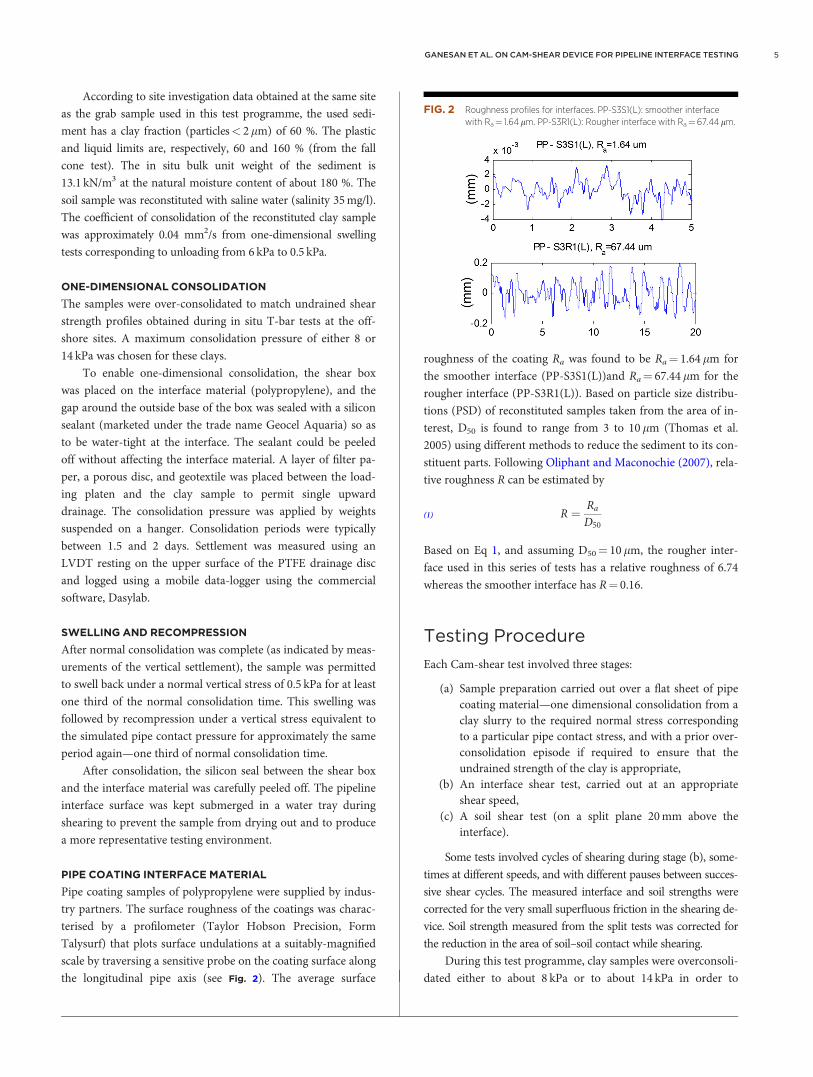
PIPE COATING INTERFACE MATERIAL
Pipe coating samples of polypropylene were supplied by indus-
try partners. The surface roughness of the coatings was charac-
terised by a profilometer (Taylor Hobson Precision, Form
Talysurf) that plots surface undulations at a suitably-magnified
scale by traversing a sensitive probe on the coating surface along
the longitudinal pipe axis (see Fig. 2). The average surface
roughness of the coating Ra was found to be Ra¼ 1.64lm for
the smoother interface (PP-S3S1(L))and Ra¼ 67.44lm for the
rougher interface (PP-S3R1(L)). Based on particle size distribu-
tions (PSD) of reconstituted samples taken from the area of in-
terest, D50 is found to range from 3 to 10lm (Thomas et al.
2005) using different methods to reduce the sediment to its con-
stituent parts. Following Oliphant and Maconochie (2007), rela-
tive roughness R can be estimated by
R ¼ Ra
D50(1)
Based on Eq 1, and assuming D50¼ 10lm, the rougher inter-
face used in this series of tests has a relative roughness of 6.74
whereas the smoother interface has R¼ 0.16.
Testing Procedure
Each Cam-shear test involved three stages:
(a) Sample preparation carried out over a flat sheet of pipecoating material—one dimensional consolidation from aclay slurry to the required normal stress correspondingto a particular pipe contact stress, and with a prior over-consolidation episode if required to ensure that theundrained strength of the clay is appropriate,
(b) An interface shear test, carried out at an appropriateshear speed,
(c) A soil shear test (on a split plane 20mm above theinterface).
Some tests involved cycles of shearing during stage (b), some-
times at different speeds, and with different pauses between succes-
sive shear cycles. The measured interface and soil strengths were
corrected for the very small superfluous friction in the shearing de-
vice. Soil strength measured from the split tests was corrected for
the reduction in the area of soil–soil contact while shearing.
During this test programme, clay samples were overconsoli-
dated either to about 8 kPa or to about 14 kPa in order to
FIG. 2 Roughness profiles for interfaces. PP-S3S1(L): smoother interface
with Ra¼ 1.64 lm. PP-S3R1(L): Rougher interface with Ra¼ 67.44 lm.
GANESAN ET AL. ON CAM-SHEAR DEVICE FOR PIPELINE INTERFACE TESTING 5

provide higher undrained shear strengths corresponding to
those typically found immediately below mudline in field tests
offshore west Africa.
The factors varied during the Cam-shear testing were:
(1) Preconsolidation pressure rc: either 14 or 8 kPa,(2) normal stress r during shearing: between 1and 4.5 kPa,(3) surface roughness Ra of the coating material:¼ 1.64lm
or 67.44 lm,(4) surface condition: dry, smeared with clay, smeared with
clay and submerged,(5) speed V: 0.5, 0.05, or 0.001mm/s,(6) pause period prior to shear reversal (various lengths).
Influence of Shearing Speed
It is recognised that the rate of shearing can strongly influence
test data, which may elicit a fully drained, partially-drained, or
undrained soil response. Shearing of soils is associated with the
simultaneous build-up of excess pore pressure (positive or nega-
tive), and dissipation as the pore water tries to reach pore pres-
sure equilibrium. This is a transient phenomenon, and is
primarily governed by the drainage and compressibility charac-
teristics of the soil, the length of drainage path to the bounda-
ries, and the duration of loading. In a direct shear test running
at constant speed, the duration of the test is simply the maxi-
mum displacement divided by the shear speed. This has led
authors to associate the degree of drainage in a shear test with
the velocity of sliding, although it is obviously the case that a
given soil sample tested in a Cam-shear box at 0.01mm/s over a
displacement of 100mm (and therefore with a duration of
2.78 h) should be much closer to displaying the drained residual
strength of the soil than would a conventional shear box tested
over 10mm at the same speed (for a duration of 17min).
Furthermore, it is not even clear whether excess pore pres-
sures develop solely as a function of the applied stresses, in
which case they should reach their maximum values relatively
early in the shear process, or whether pore pressures continue
to develop with shear displacement, due to disturbance or dam-
age to the soil microstructure, even though the applied stresses
remain almost constant. It is recognised, for example, that the
cyclic application of a constant amplitude of shear stress causes
granular materials to generate excess pore pressures cycle by
cycle, compensating for the tendency for cyclic compaction
(Martin et al. 1975). It might be argued that the disturbance
caused by a succession of projections from a rough sliding inter-
face might have a similar effect on clays.
Moreover, soil mechanics literature also accepts that strain
rate influences stiffness and strength. Kulhawy and Mayne
(1990) show data from 26 clays that register an average increase
in undrained strength of 10 % per factor 10 on time. This
phenomenon has been modelled (Lin and Wang 1998; Kuhn
and Mitchell 1993) as a thermally activated rate process, the
consequence of suppressed creep irrespective of excess pore
pressures.
Without conducting additional investigations, it is impossi-
ble to know which of these mechanisms may be responsible for
some particular macroscopic behaviour observed in direct shear.
All that can be required of this test equipment is that it simulates
field conditions and leaves open the possibility of deeper inquiries
into the origins of any observed behaviour. Accordingly, test
results should at least include information regarding test speed
and duration in relation to an estimate of the time required for
transient flow. Evidence of an increase in strength with rate of
testing even for samples that should each be undrained would
suggest that creep-related rate effects were also in evidence.
TEST DURATION IN RELATION TO TRANSIENT FLOW
Gibson and Henkel (1954) have derived an expression for nor-
mally consolidated clays using Biot (1941), relating the time tmto mobilise peak strength in a direct shear box test and the cor-
responding degree of dissipation of excess pore pressure Um
during that mobilisation
tm ¼H2
2 1� Umð Þcv(2)
where:
cv¼ the coefficient of one-dimensional consolidation, and
H¼ the drainage distance.
Their theory considers that pore pressures are simultane-
ously created and dissipated during time, tm, and then dissipate
away for t> tm. Figure 3 illustrates this in relation to typical
data of shear stress versus displacement, marking peak strength
smax mobilised at time tm with the final strength send recorded
at the end of the test at time tend. The selection of tm in cases
where no peak is observed requires some judgment concerning
the likely point after which further excess pore generation may
be negligible. This judgment goes beyond the analysis of Gibson
and Henkel (1954) because soil being sheared in a general state
FIG. 3 Nomenclature for characteristic values of strength, displacement and
time.
Geotechnical Testing Journal6

of overconsolidation may develop either positive or negative
excess pore pressures, so that continuing drainage may lead ei-
ther to an increased or decreased shear strength.
Applying Eq 2 to the state of drainage at peak strength
mobilisation, we may say that a “drained” peak strength would
require Um� 0.9 so that tm� 5H2/cv, whereas an “undrained”
peak strength would be recorded if Um¼ 0 so that tm� 0.5H2/cv.
In the following period, t> tm, it will be considered suffi-
cient to apply Terzaghi’s standard consolidation theory with an
assumed dissipation time (t – 0.5tm). We may then say that a
“drained” strength at the end of the test would require
Uend� 0.9 so that (tend – 0.5tm)� 0.8H2/cv, whereas an
“undrained” strength would ultimately be recorded if Uend � 0
so that (tend – 0.5tm)� 0.08H2/cv.
There are some additional considerations required in the
use of the Gibson and Henkel solution to interpret the Cam-
shear data to be reported here. Firstly, it is assumed that excess
pore pressures are created throughout the sample thickness, and
not just in the vicinity of any shear rupture band that may
form. More localised pre pressures would lead to faster consoli-
dation. Secondly, the Gibson and Henkel solution is based on
the assumption that the split plane is symmetric to the drainage
boundaries. In the Cam-shear setup, the split plane was asym-
metric to drainage boundaries with drainage only permitted at
the top. This was taken into account by using the shortest drain-
age length of 10mm for the parameter H in Eq 2 applicable to
soil–soil tests. The direct shear box testing against an interface
is similarly assumed to generate uniform pore pressures that
dissipate upwards, so that drainage distance H in Eq 2 is taken
to be equal to 30 mm in soil-interface tests, which is the approx-
imate thickness of clay in the box. Finally, since the samples
were over-consolidated, the coefficient of consolidation cv for
soil swelling was used rather than for virgin compression.
Depending on the behaviour observed during shearing,
judgments can be made as to whether tests were completed in a
drained, partially-drained, or undrained manner, as indicated in
the following section. The interface shear strength s and soil
strength s*, both at the peak (maximum) value and at the end
of a test (after approximately 60 to 120mm shear displacement
of interface sliding, and about 12mm of split-plane shearing),
have been identified as shown schematically in Fig. 3, where the
shear strength is given as s followed by a subscript defining the
phase of the test. Some tests showed a monotonic increase in re-
sistance to the end of the test whereas others showed a softening
response after the peak.
Interpretation of Direct Shear
Test Results
The lack of secure knowledge regarding the degree of drainage
of excess pore pressures in direct shear tests has always been
regarded as a serious drawback. However, some attempt must
be made to overcome this problem in the case of Direct Simple
Shear (DSS) tests, and interface shear data where direct shear is
the most economical way of conducting tests. A method of
interpretation will be recommended below based on the pre-
cepts of Critical State Soil Mechanics (CSSM), Schofield and
Wroth (1968).
It is well-known that overconsolidated clays have a curved
strength envelope on a Mohr–Coulomb diagram. A CSSM view
of these peak strengths is that they arise from interlocking of
the basic soil grains, which have to dilate before they are free to
shear (Schofield 2006). Expressed in terms of direct shear
stresses, the normalised Cam Clay yield surface is given as Eq 3.
FIG 4 Schematic diagram showing the definition of peak shear strength
values obtained from the Cam-shear apparatus using the Cam clay
model.
GANESAN ET AL. ON CAM-SHEAR DEVICE FOR PIPELINE INTERFACE TESTING 7

s�max
r00¼ l�critln
r0cr00
� �¼ l�(3)
where:
l*¼ the variable friction coefficient, and
l*crit¼ the constant critical state friction coefficient.
The stress paths taken by the soil to reach its ultimate state
may not be known, if pore pressures are not measured. Never-
theless, if the initial vertical effective stress r00 following vertical
consolidation is known, and if it is accepted that within the
yield surface the behaviour is elastic, then the yield strength, sy,
can be determined (see Fig. 4) path A to Y, regardless of
whether the test is undertaken in a drained or undrained man-
ner. Once yielded, the soil may follow the idealised paths shown
by Y–D for drained shearing or Y–U for undrained shearing (at
constant volume). In any case, the predicted maximum shear
strength, smax, developed in a DSS test starting on the “dry” side
of the critical state line (i.e. r00 < r0c=2:7) will be the yield
stress, sy, or perhaps slightly higher in an undrained test. There
is, therefore, some theoretical underpinning for the presentation
of soil strength data in the form s*max versus r00 � r0c.
Soil–Soil Test Results
DETERMINATION OF DRAINAGE CONDITION FOR
SOIL–SOIL TESTS
A typical shear strength-displacement plot for a test undertaken
at 0.05mm/s is shown in Fig. 5; Fig. 6 shows the shearing dis-
tance required to attain peak strength for tests completed at
0.05mm/s. Table 2 summarises the nature of soil response pre-
dicted at peak for the shearing rates utilised in this series of
tests. The maximum strength of the soil is generally mobilised
within 2.5mm of shearing displacement. Therefore, at the peak
shear strength, the test completed at 0.001mm/s exhibits
partially-drained conditions. Both faster tests (0.05 and 0.5mm/s)
will experience undrained conditions. At the end of the test
corresponding to a shear displacement of 12mm, the two faster
shear speeds exhibit partially-drained conditions whereas the
slow test at 0.001mm/s now corresponds to a drained strength.
INFLUENCE OF OCR AND SHEAR RATE
Figure 7 presents the variation in soil shear strength for different
shear speeds at two preconsolidation pressures r0c (8 and
14 kPa). It is observed that for each r0c, an increase in shear
speed results in an increase in measured shear strength.
Although tests undertaken at 0.5 and 0.05mm/s were deter-
mined in Table 2 to represent undrained shearing, there is a dis-
tinct difference in shear strength. This could be attributed to a
rate effect (suppressed creep) increasing the strength of the
“fast” test. The curves shown in this figure correspond to Cam–
clay yield surfaces fitted to the data corresponding to the arith-
metic average of critical state coefficient of friction l*crit found
by applying Eq 3 to each data point.
There is clear evidence of preconsolidation pressure influ-
encing the drained strength. In other words, it might be
FIG. 5
Example plot showing soil strength plotted against shearing
displacement.
FIG. 6 Summary of shear displacement to attain soil peak strength.
Geotechnical Testing Journal8

reasonable to suppose that a greater undrained strength at any
given depth in situ may indicate a higher preconsolidation pres-
sure and a correspondingly higher drained strength (which
could equally be expressed as a higher friction factor). Recalling
that friction coefficient is the gradient of a line drawn to any
given data point from the origin, it is also clear that for clay of a
given preconsolidation pressure, the peak friction factor reduces
with increasing initial effective stress normal to the shear plane.
The data of Fig. 7 is replotted in Fig. 8 on axes of s*max
(maximum shear strength) and r00, both normalised by r0c. The
significance of shear speed is now easier to assess. It can be seen
in Fig. 8 that the chosen yield surface, with l*¼ 1.0, approxi-
mately satisfies the data of reconstituted clay tested at a shear
speed of 0.05mm/s. Faster tests provided higher strengths, and
slower tests gave lower strengths, as might be expected for clays
showing rate effects.
Plots of friction coefficient versus the logarithm of overcon-
solidation ratio (OCR¼ r0v,max/r0v,o) provide a succinct normal-
isation. Figure 9 shows that the peak soil–soil shear strength
expressed as a friction coefficient l*max varies linearly with log-
OCR, and confirms that the data of tests preconsolidated to dif-
ferent stresses do merge in accordance with Eq 3. It is also
observed, however, that the gradient of these lines is a function
of shear speed; in contrast with the expectation of Eq 3 that the
gradient would simply be the critical state friction coefficient,
regarded by Schofield and Wroth (1968) as a constant. It should
be noted that no data was acquired for the range 1<OCR< 2.
There are strong grounds for accepting that the normalised
undrained strength su,max/r0v,o : smax/r0v,o : l*max following
the notation used in this paper, can be taken as 0.5 for these
West African clays (plasticity index PI � 100 %) when normally
consolidated, i.e., for OCR¼ 1, following the empirical expres-
sion given as Eq 4 Skempton (1954).
sumax
r0v;nc¼ 0:11þ 0:37PI(4)
A cut-off has accordingly been placed at this ordinate in Fig. 9.
If the initial effective stress in the clay at the pipe invert was less
than 1 kPa, and if a preconsolidation of at least 14 kPa is
required to explain the in situ undrained strength, it should fol-
low that the OCR of this clay would exceed 14. The origin of
this apparent overconsolidation in situ was discussed by Kuo
and Bolton (2013).
Interface Tests
Figure 10 presents results of reversing shear tests at a speed of
0.5mm/s conducted both on rough and smooth interfaces.
These plots show that for both interface types, the strength at
the end of pass 1 (see Fig. 10) has dropped significantly below
the peak strength. In the case of the rough interface, after a
shearing distance of 100mm, the strength had fallen to close to
TABLE 2 Drainage conditions in typical soil–soil shear tests.
Consol.coeff.cv mm2/s
DrainagelengthH mm
Displace. tos*max
Xm mm
Displace. ats*end
Xend mm
Rate ofshearingV mm/s
Um
1� 0:5H2
cvtm
Predictedpeak soilresponse Uend
Predictedend soilresponse
0.04 10 2.5 12 “slow” 0.001 0.5 Partially drained 1 Drained
“medium” 0.050 0 Undrained 0.36 Partially drained
“fast” 0.500 0 Undrained 0.12 Nearly undrained
FIG. 8 Cam-shear data of remoulded, reconstituted West African clay
plotted on normalised axes of shear strength and vertical effective
stress.
FIG. 7 Variation in shear strength when sheared at different rates for r0c¼ 8
and 14 kPa.
GANESAN ET AL. ON CAM-SHEAR DEVICE FOR PIPELINE INTERFACE TESTING 9

zero. Shearing in the reverse direction (pass 2) and then again
in the forward direction (pass 3) results in the strength recover-
ing and levelling at about 2 kPa. The smooth interface generates
an end of test strength of between 1 and 2 kPa. Although end-
of-test interface strengths appear to be similar, the rate of
strength decay is observed to be significantly different. The
smooth interface rapidly falls to almost 50 % of peak strength
within 5mm of displacement whereas the rough interface
requires approximately 20 mm for the peak strength to fall by
the same amount. This indicates that the micromechanical
processes of shearing are different for the two interfaces. Figure
11 presents a summary of the shearing distance required to
attain 50 % of the peak strength, plotted for various test condi-
tions. This shows that an interface shearing device must be able
to shear at least 30mm in one direction if it is to capture the fall
from peak strength.
Figure 12 shows a marked difference in interface resistance
behaviour between tests completed at 0.001 and 0.05mm/s.
Both testes were undertaken on samples with a normal stress of
4.5 kPa and an initial OCR of 3. The fast test exhibits a sharp
peak in resistance, which reduces dramatically to a constant re-
sidual resistance. The slower test exhibits a smaller peak with a
small drop in resistance, and remains relatively constant with
shear displacement. This difference in behaviour is likely to be
caused by differing drainage conditions during shearing, as dis-
cussed below.
FIG. 10 Plots of “fast” shear test (0.5 mm/s) showing interface strength
plotted against shearing displacement. Upper test data: rough
interface; lower test data: smooth interface.
FIG. 9 Peak apparent internal friction coefficient l*max versus initial plotted
on semi-log axes.
FIG. 11 Influence of interface roughness on shearing distance required to
reach 50 % of smax.
FIG. 12 Comparison of rough interface strength profiles when shearing at
slow (0.001 mm/s) and fast (0.5 mm/s) speeds.
Geotechnical Testing Journal10

DRAINAGE CONDITION OF INTERFACE TESTS
Table 3 summarises the drainage conditions expected at the end
of interface tests, corresponding to a shear displacement of
approximately 100mm. It can be seen that drained conditions
are predicted at the slow shear speed of 0.001mm/s, whereas
partially drained and nearly undrained conditions should
remain for the medium and fast tests, respectively. Thus, the
test curves shown in Fig. 12 correspond to drained (0.001mm/s)
and nearly undrained (0.5mm/s) tests.
PEAK INTERFACE SHEAR STRENGTH
Plots of peak interface friction lmax are given in Figs. 13 and 14 for
rough and smooth pipe coatings, respectively; trend lines are
included. Shearing against a rough interface clearly shows lmax
progressively reducing with reduction in shearing rate; comparable
to that observed for soil–soil shear tests. The tests completed on
the smooth interface again follow this trend, but less conclusively.
Although the degree of drainage will increase as the shear speed
reduces from 0.5 through to 0.005mm/s, it has been proposed in
Fig. 4 that this may not strongly influence the peak strength. An
interpretation emphasising shear rate effects may be preferred. Just
as with the soil–soil tests, the data for interfaces suggests that if
Eq 3 is invoked, then l0crit should increase with shear rate.
END OF PASS INTERFACE SHEAR STRENGTH
Figure 15 presents the interface shear strength at the end of the
first pass plotted against the peak interface shear strength for
both rough and smooth interfaces prepared in different ways.
When a pipeline has consolidated its bed, its subsequent shear
displacements are such that the interface always slides over con-
solidated clay. The inevitable consequence of using direct shear
tests is that, following consolidation, the shear displacement
begins to overlap the clay onto clean interface material. This
discrepancy may partly be accounted for by smearing the inter-
face ahead of the shear box with clay, and if drying is to be pre-
vented, by submerging the smeared surface. Figure 15 presents a
variety of such data, but no clear trends emerge regarding sur-
face preparation.
TABLE 3 Drainage conditions in typical soil-interface shear tests.
Consol.coeff.cv mm2/s
DrainagelengthH mm
Displace.at sendXend mm
Rate ofshearingV mm/s Uend
Predictedend soilresponse
0.04 30 100 “slow” 0.001 1 Drained
“medium” 0.050 0.36 Partially drained
“fast” 0.500 0.12 Nearly undrained
FIG. 13 Peak apparent friction coefficient lmax on a rough interface, versus
initial OCR plotted on semi-log axes.
FIG. 14 Peak apparent friction coefficient lmax sliding on a smooth interface,
versus initial OCR plotted on semi-log axes.
FIG. 15 End of pass 1 interface shear strength plotted against peak interface
shear strength.
GANESAN ET AL. ON CAM-SHEAR DEVICE FOR PIPELINE INTERFACE TESTING 11

Notwithstanding the scatter, it is seen that slow “drained”
tests feature the smallest drop from peak to residual strength, if
it is accepted that enough displacement has occurred for the
strength at the end of the pass to be treated as residual. The
greater the speed of shearing is, the larger the drop from peak
to residual strength. Approximate bands of data recovered at
various speeds are shown in the figure. It is striking that the re-
sidual strength data in Fig. 15 suggest that positive pore pres-
sures induced in an undrained zone of disturbance will dissipate
if sufficient drainage time is permitted. On the other hand, the
peak strength data in Figs. 13 and 14 for the interfaces, and Fig. 9
for the internal soil shear strength, show exactly the opposite
effect, suggesting that negative pore pressures developed in
undrained shearing can dissipate with time and permit a reduc-
tion in peak strength. The mechanism underlying the apparent
development of positive pore pressures within overconsolidated
clays subject to large and rapid shear displacements, especially
on rough interfaces, is worthy of further investigation.
Conclusions
The Cam-shear apparatus permits offshore soil samples recov-
ered from site to be fitted inside a shear box in the form of
PTFE blocks, and sheared under very low normal stresses. The
whole box can be slid over a sheet of interface material, or it can
be split to find the adjacent soil shear strength. The Cam-shear
device is capable of measuring a soil shear strength of 1 kPa
within 0.05 kPa. Tests have been reported here on reconstituted
samples, in an effort to discover trends linking the peak and re-
sidual interface strengths of a West African clay with speed, dis-
tance, and duration of shearing, the overconsolidation ratio of
the clay, and the interface roughness.
The drainage condition experienced by the sheared soil
samples is highly dependent on the rate of shearing. A discus-
sion on a method for estimating the drainage condition at both
peak and end-of-test stages is presented. This method utilises
the Gibson and Henkel approach to determine the drainage
condition at peak strength and then assumes the applicability of
Terzaghi’s standard consolidation theory to determine the
drainage condition at the end of the test. Based on the soil–soil
shear tests completed in this study, it was found that at a shear
rate of 0.001mm/s, peak strengths were obtained in partially
drained conditions, occurring at a shear displacement of less
than 3mm. Both 0.05 and 0.5mm/s shear speeds should have
generated undrained peak soil–soil strengths. A shearing dis-
tance of 12mm corresponding to the end of the soil–soil test
was sufficient to generate drained strengths at 0.001mm/s and
partially drained conditions for tests undertaken at 0.05 and
0.5mm/s. Estimates of the degree of drainage were also made
for interface shear tests. Because the displacements to reach
peak strength tended to be smaller, and the drainage distances
were longer, the degree of consolidation at peak strength was
smaller than in the soil–soil tests. Because the interface tests
ultimately displaced further, the proportional consolidation at
the end of the tests was, however, greater.
The shear rate and OCR are each observed to influence the
peak strength, with faster rates and higher OCR conditions cor-
responding to higher peak strengths both for soil–soil tests and
interface tests. This is consistent with the anticipated induction
at peak strength of negative excess pore pressures in undrained
tests on overconsolidated clays. Plotting the peak interface fric-
tion coefficient against log OCR resulted in linear correlations
consistent with the predictions of Critical State Soil Mechanics,
but with a gradient increasing with shear speed. It was demon-
strated theoretically that degree of drainage should have a negli-
gible influence on peak strength if overconsolidated clay
remains elastic up yield, so the shear speed effects may be more
related to the suppression of creep, as described by rate process
theory.
Fast tests continued to show a fall from peak strength
throughout the shearing process whereas slow tests tended to
plateau after an initial small peak in strength. Analysis of the
shearing displacement required to reach 50 % of peak strength
in fast tests showed that rough interfaces require 30mm in
monotonic shear, whereas smooth interfaces required less than
10 mm. The Cam-shear apparatus appeared to be capable of
providing sufficient monotonic displacement for the estimation
of residual strength values; however, there may be a concern
regarding the unrepresentative surface conditions encountered
at large displacements. Furthermore, the prior conditioning of
the interface (wet, smeared, or dry) was shown not to signifi-
cantly influence the measured shear strengths.
The residual (end of test) interface friction coefficient
showed a strong reduction with increasing shear speed, the op-
posite trend to that of the peak strength. This suggests that posi-
tive excess pore pressures can be generated continuously inside
the localising shear zone that forms following the development
of peak strength. Further research could usefully be conducted
to explain this behaviour, notwithstanding the semantic and ex-
perimental difficulties of defining and measuring representative
pore pressures on shearing surfaces.
ACKNOWLEDGMENTS
The writers would like to acknowledge the support of the Safe-
buck JIP participants (ABS, Acergy (Subsea 7), BOEM/MMS,
BP, Bureau Veritas, Chevron, ConocoPhillips, DNV, ExxonMo-
bil, Fugro, JFE, Petrobras, Saipem, Shell, Statoil, Technip, Tena-
ris, Total and Woodside); the JIP within which the presented
work was undertaken.
References
Biot, M. A., 1941, “General Theory of Three-Dimensional Con-solidation,” J. Appl. Phys., Vol. 12, No. 2, pp. 155–164.
Geotechnical Testing Journal12

Bruton, D. A. S., Carr, M., and White, D. J., 2007, “The Influ-ence of Pipe-Soil Interaction on Lateral Buckling and Walk-ing of Pipelines: The SAFEBUCK JIP,” Proceedings of the 6thInternational Conference on Offshore Site Investigation andGeotechnics, London, UK, Sept 11–13, pp. 133–148.
Colliat, J. L., Dendani, H., Puech, A., and Nauroy, J.-F., 2011,“Gulf of Guinea Deepwater Sediments: Geotechnical Proper-ties, Design Issues and Installation Experiences,” Proceedingsof the 2nd International Symposium On Frontiers in OffshoreGeotechnics (ISFOG-II), Perth, Australia, Nov 8–10, 2010,pp. 59–86.
Dunlop, D. G., Brewster, N. T., Madabhushi, S. P. G., Usmani,A. S., Pankaj, P., and Howie, C. R., 2000, “MechanicalStrength of Impaction Bone Grafting—The Effect of Wash-ing the Graft,” J. Bone Jt. Surg., Vol. 85, pp. 639–646.
Fugro GeoConsulting Ltd., 2010, Technical Reports, (unpublished).Gibson, R. E., and Henkel, D. J., 1954, “Influence of Duration of
Tests at Constant Rate of Strain on Measured “Drained”Strength,” Geotechnique, Vol. 4, No. 1, pp. 6–15.
Haustermans, L. A. G., 2002, “Effect of Coating on Resistance toMovement of Pipelines on Clay Seabed,” MPhil thesis, Uni-versity of Cambridge, Cambridge, UK.
Hil, A. J., White, D. W., Bruton, D. A. S., Langford, T., Meyer,V., Jewell, R., and Ballard, J.-C., 2012, “A New Frameworkfor Axial Pipe–Soil Resistance, Illustrated by a Range of Ma-rine Clay Datasets,” Proceedings of 7th SUT Offshore SiteInvestigation and Geotechnics International Conference,London, UK, Sept. 12–14, pp. 367–377.
Kuhn, M. R., and Mitchell, J. K., 1993, “New Perspectives on SoilCreep,” ASCE J. Geotech. Eng., Vol. 119, No. 3, pp. 507–524.
Kulhawy, F. H., and Mayne, P. W., 1990, “Manual on Estimat-ing Soil Properties for Foundation Design,” EPRI EL-6800,Cornell University, Ithaca, New York.
Kuo, M. Y.-H., and Bolton, M. D., 2013, “The Nature and Ori-gin of Deep Ocean Clay Crust From the Gulf of Guinea,”Geotechnique, Vol. 63, No. 6, pp.500–509.
Lemos, L. J. L., and Vaughan, P. R., 2000, “Clay-Interface ShearResistance,” Geotechnique, Vol. 50, No. 1, pp. 55–64.
Lin, H., and Wang, C., 1998, “Stress-Strain-Time Function ofClay,” J. Geotech. Geoenviron. Eng., Vol. 124, No. 4, pp.289–296.
Lupini, J. F., Skinner, A. E., and Vaughan, P. R., 1981, “TheDrained Residual Strength of Cohesive Soils,” Geotechnique,Vol. 31, No. 2, pp. 181–213.
Martin, G. R., Liam Finn, W. D., and Bolton, H. S., 1975,“Fundementals of Liquefaction Under Cyclic Loading,” J.Geotech. Geoenviron. Eng., Vol. 101, No. 5, pp. 423–438.
Najjar, S. S., Gilbert, R. B., Liedtke, E., McCarron, B., and Young,A. G., 2007, “Residual Shear Strength for Interfaces Between
Pipelines and Clays at Low Effective Normal Stresses,” ASCEJ. Geotech. Eng., Vol. 133, No. 6, pp. 695–706.
Oliphant, J., and Maconochie, A., 2007, “The Axial Resistanceof Buried and Unburied Pipelines,” Proceedings of SUT Off-shore Site Investigation and Geotechnics International Con-ference, London, UK, Sept 11–13.
Pederson, R. C., Olson, R. E., and Rauch, A. F., 2003, “Shearand Interface Strength of Clay at Very Low Effective Stress,”Geotech. Test. J., Vol. 261, pp. 71–78.
Schofield, A. N., 2006, “Interlocking, and Peak and DesignStrengths, Letter to the Editor,” Geotechnique, Vol. 56, No.5., pp. 357–358.
Schofield, A., and Wroth, C. P., 1968, Critical State SoilMechanics, McGraw-Hill, New York.
Skempton, A., 1954, “Discussion of the Structure of InorganicSoil,” ASCE J. Soil Mech. Found. Div., Vol. 80, pp. 19–22.
Skempton, A. W., 1985, “Residual Strength of Clays in Land-slides, Folded Strata and the Laboratory,” Geotechnique, Vol.35, No. 1, pp. 3–18.
Stark, T. D. and Contreras, I. A., 1996, “Constant Volume RingShear Apparatus,” ASTM Geotech. Test. J., Vol. 19, No. 1,pp. 3–11.
Stark, T. D., and Eid, H. T., 1993, “Modified Bromhead RingShear Apparatus,” ASTM Geotech. Test. J., Vol. 16, No. 1,pp. 100–107.
Stark, T. D., and Eid, H. T., 1994, “Drained Residual Strength ofCohesive Soils,” ASCE J. Geotech. Eng., Vol. 120, No. 5, pp.856–871.
Thomas, F., Rebours, B., Nauroy, J.-F., and Meunier, J., 2005,Mineralogical Characteristics of the Gulf of Guinea Deep WaterSediments, Proceedings of the International Symposium onFrontiers in Offshore Geotechnics (IS-FOG 2005), Perth, WA,Australia, Sept 19–21, M. Cassidy and S. Gourvenec, Eds.,Taylor & Francis.
White, D., Campbell, M. E., Boylan, N., and Bransby, M. F.,2012, “A New Framework for Axial Pipe-Soil InteractionIllustrated by Shear Box Tests on Carbonate Soils,” Proceed-ings of the 7th International Conference of the Society forUnderwater Technology, London, UK, Sept 12–13, Vol. 1,pp. 379–387.
White, D. J., and Cheuk, J. C. Y., 2008, “Modelling the Soil Re-sistance on Seabed Pipelines During Large Cycles of LateralMovement,”Mar. Struct., Vol. 21, No. 1, pp. 59–79.
White, D., Ganesan, S. A., Bolton, M. D., Bruton, D. A. S., Bal-lard, J.-C., and Langford, T., 2011, “SAFEBUCK JIP: Obser-vations From Model Testing of Axial Pipe-Soil Interactionon Soft Natural Clays,” Proceedings of the Offshore Technol-ogy Conference (OTC), Paper No. OTC 21249, Houston, TX,May 2–5.
GANESAN ET AL. ON CAM-SHEAR DEVICE FOR PIPELINE INTERFACE TESTING 13