georgia: neighbourhood sme financing · this report is based on a survey of the intermediaries...
TRANSCRIPT

Georgia Neighbourhood SME financing
February 2016


1
Neighbourhood SME financing: Georgia
February 2016

Neighbourhood SME financing: Georgia
© European Investment Bank, February 2016 2
Lead author
Luca Gattini, Economist, European Investment Bank Tamar Baiashvili, Economist, European Investment Bank and National Bank of Georgia
Economics editor
Debora Revoltella, Director, Economics Department, European Investment Bank
Editorial, linguistic and statistical support
Polyxeni Kanelliadou, European Investment Bank
This report is based on a survey of the financial intermediaries conducted by the Economics Department of the European Investment Bank. Information about the market context draws on the EIB/EBRD/WB Enterprise Survey and the World Bank’s Doing Business as well as national sources. About the Economics Department of the EIB
The mission of the EIB Economics Department is to provide economic analyses and studies to support the Bank in its operations and in its positioning, strategy and policy. The Department, a team of 35 economists and assistants, is headed by Debora Revoltella, Director of Economics.
Disclaimer
The views expressed in this document are those of the authors and do not necessarily reflect the position of the EIB.

Neighbourhood SME financing: Georgia
© European Investment Bank, February 2016 3
Contents 1 SUMMARY ..................................................................................................................................................... 4
1.1 ECONOMIC AND FINANCIAL SITUATION ............................................................................................... 4 1.2 ASSESSMENT OF THE FINANCIAL SECTOR ............................................................................................. 4 1.3 GAPS IN SME FINANCE .......................................................................................................................... 5
2 THE MACROECONOMIC ENVIRONMENT ...................................................................................................... 6 2.1 ECONOMIC DEVELOPMENT AND GROWTH .......................................................................................... 6 2.2 MONETARY POLICY AND INFLATION ..................................................................................................... 6 2.3 EXTERNAL SECTOR ................................................................................................................................ 7 2.4 FISCAL SITUATION ................................................................................................................................. 8 2.5 AGRICULTURE SECTOR .......................................................................................................................... 8
3 FINANCIAL SECTOR OVERVIEW ................................................................................................................... 10 3.1 BANKING SECTOR ................................................................................................................................ 10
3.1.1 STRUCTURE ................................................................................................................................. 10 3.1.2 PERFORMANCE ........................................................................................................................... 10 3.1.3 TRADE FINANCE .......................................................................................................................... 12 3.1.4 REGULATION............................................................................................................................... 12
3.2 MICROFINANCE SECTOR ..................................................................................................................... 13 3.2.1 STRUCTURE AND PERFORMANCE .............................................................................................. 13
3.3 OTHER FINANCIAL INSTITUTIONS ....................................................................................................... 14 3.3.1 INSURANCE COMPANIES ............................................................................................................ 14 3.3.2 CREDIT UNIONS .......................................................................................................................... 14
4 THE SME SEGMENT ..................................................................................................................................... 15 4.1 THE SME SEGMENT OVERVIEW........................................................................................................... 15
4.1.1 SME PERFORMANCE ................................................................................................................... 16 4.1.2 ACCESS TO FINANCE ................................................................................................................... 17 4.1.3 THE INSTITUTIONAL AND LEGAL ENVIRONMENT ....................................................................... 18
5 FINANCIAL INTERMEDIARIES IN SME FINANCING ....................................................................................... 20 5.1 BANKS .................................................................................................................................................. 20 5.2 MICROFINANCE INSTITUTIONS ........................................................................................................... 26 5.3 LEASING ............................................................................................................................................... 27
6 SUMMARY: GAPS IN FINANCING ................................................................................................................ 28 6.1 GAPS IN THE AVAILABILITY OF FINANCIAL PRODUCTS........................................................................ 28 6.2 CONSTRAINTS ON THE GROWTH OF SME FINANCE ............................................................................ 28
REFERENCES:......................................................................................................................................................... 30 ANNEX I ECONOMIC DATA ................................................................................................................................... 31 ANNEX II PRUDENTIAL RATIOS FOR BANKS AND KEY BANKING REGULATIONS ................................................... 32

Neighbourhood SME financing: Georgia
© European Investment Bank, February 2016 4
1 Summary
1.1 Economic and Financial Situation • Georgia is a lower middle income country in the South Caucasus with GDP per capita at around
USD 7,653 on purchasing power parity basis. In 2014 economic growth stood at 4.8%. Economic performance is exposed to regional tensions and adverse economic developments in partner countries.
• Georgia consistently runs a negative current account balance driven primarily by a trade deficit. The current account deficit moderated from 12.7% in 2011 to 9.8% in 2014. The deficit is financed through substantial FDI and some portfolio investments.
• Fiscal consolidation process has been undergoing, with budget deficit decreasing to 2.6% of GDP in 2013 from a peak of 9.2% in 2009. However, in 2014 the budget deficit increased to 3.2% due to government’s commitment to increase social expenditures, budgeted capital investments and lower fiscal revenues. Georgia’s government debt stands at 35.6% of GDP.
• Small and medium sized enterprises (SMEs) are an vital part of the economy. SMEs are concentrated in the real estate, trade, agriculture and manufacturing sectors.
• Business environment considerably improved in Georgia during the past decade, providing increased growth opportunities for small and medium enterprises. Based on a peer country analysis and looking at international rankings, Georgia scores well above other countries in the region and relatively high at the global level.
• In recent years, the government has taken a more proactive stance to support private sector development, with various financial and consultancy programs. For example, the Entrepreneurship Development Agency (Enterprise Georgia) was established in March 2014 under the Ministry of Economy and Sustainable Development and aims at facilitating private sector development, particularly the SMEs segment. SMEs in agricultural sector are also supported.
1.2 Assessment of the Financial Sector • Georgia’s financial system is dominated by commercial banks, accounting for about 93% of
sectoral assets. The system comprises 19 banks and has a high level of concentration, with the two largest banks accounting for about 60% of the banking sector assets.
• Financial intermediation remains relatively low but increased rapidly over the last couple of years, with total bank assets reaching almost 80% of GDP and a loan to GDP ratio of about 48%.
• Despite the recent slowdown in economic activity and weaker credit growth, the banking sector continues to be well capitalized and soundly managed. Sector-wide capital adequacy ratio stands at 19% (in Basel standards), higher than the regulatory minimum of 12%. The NPL ratio, defined according to the international standards (loans in arrears over 90 days), stands at 3.4%. It is one of the lowest among peer countries.
• The Georgian banking sector remains exposed to exchange rate risk through unhedged borrowers. While more than 65% of deposits and loans are in FX (USD), over 90% of foreign currency borrowers rely on income in local currency.
• Funding of the banking system is diversified. While saving rate in Georgia is quite low, which results in low deposits-to-GDP ratio (around 42%), banks are quite efficient in mobilizing funding from foreign sources.
• Non-bank sector accounts for a modest share in the financial system. The microfinance sector is the largest non-bank segment. It accounts for 5% of financial system assets and it includes 72 microfinance institutions.

Neighbourhood SME financing: Georgia
© European Investment Bank, February 2016 5
1.3 Gaps in SME finance • The analysis shows that despite favourable business environment, access to finance remains a
constraint for companies, particularly SMEs. They rely heavily on internal funds and retained earnings. Banks are the major sources of external financing for SMEs, mainly in the form of loans. Non-bank finance and capital markets are under-developed and the utilization of financial instruments other than credit is limited.
• Loans in foreign currency are more accessible compared to local currency. Loans in local currency are limited, especially on long-term maturities. This is detected as the most severe constraint among the bank-specific factors. This originates from the banks’ funding structure which particularly lacks long-term local currency funding.
• Low level of financial literacy is constraining SMEs in making better use of financial products other than loans.
• Trade finance market is not developed and trade finance instruments are mainly employed by larger companies mostly in the form of credits, letters of credit and guarantees.
• Private equity and venture capital are practically non-existent. Securing financing at early stages represents a severe problem. Also the market size of the leasing sector is very small and subsidiaries of commercial banks are the main players.
• Very few banks make use of credit guarantee schemes to mitigate risks on SMEs exposures. Costs and pricing are described as key limiting factors. All banks indicate some degree of difficulty for SMEs to post the necessary collateral and provide business plans and transparent accounts. Broader use of risk-mitigating instruments by intermediaries could facilitate SME credit accessibility.
• In addition, lack of innovation and need for infrastructural upgrades is also an issue. Capacity and quality upgrading both in exporting and non-exporting SMEs would enable firms to benefit more from DCFTA opportunities.
• Technical assistance and advisory services for SMEs could increase their bankability through enhanced financial literacy and improved capacity in business planning and management processes.

Neighbourhood SME financing: Georgia
© European Investment Bank, February 2016 6
2 The Macroeconomic Environment
2.1 Economic development and growth After the “Rose Revolution” in 2003, and over the period of 2004-2008, far-reaching reforms resulted in an average annual real GDP growth rate of 10.5%. The financial crisis of 2008-2009, combined with the military conflict with Russia, weakened economic performance. GDP per capita remains low, at around USD 7,653 on purchasing power parity (PPP) basis in 2014. Georgia’s exposure to recent regional tensions and adverse economic developments in partner countries transmitted to the economy through weaker external demand, decreased remittances and low tourism revenues. These elements contributed to an increase in the volatility of the economic performance. Annual GDP growth fell from an average of 6.6% y-o-y in 2010-2012 to 4.8% in 2014 (see figure 1). The main driver behind the recent slowdown is the external sector. After a strong performance in 2013, net exports made a negative contribution to GDP in 2014 and are expected to remain negative in 2015. On the other hand, accommodative monetary policy and a fiscal stimulus supported consumption and domestic investment in 2014. The low oil prices environment partly compensates for the unfavourable spillovers from the external sector. In the first half of 2015 GDP grew by 2.6 year-on-year compared to the same period of 2014. For 2015 as a whole, real GDP growth is projected to exceed 2% with agriculture and construction sectors contributing the most. In 2014 the largest sectors in the economy were trade (17.4%), manufacturing (10.6%), public administration (9.9%), agriculture (9.2%) and transport (7.7%) (see figure 2). Figure 1. Dynamics of Gross Domestic Product Figure 2. Gross Domestic Product by Sectors, 2014
Source: National Statistics Office of Georgia
2.2 Monetary policy and inflation The monetary policy of the National Bank of Georgia (NBG) is conducted under an inflation targeting regime. The NBG targeted an annual inflation rate of 6% for 2014 and 5% for 2015, with intentions to decrease the target to 4% in 2017. The long run objective is a consumer price index (CPI) growth rate of 3%. The high level of dollarization is one of the main impediments to an efficient monetary policy transmission. The level of deposit dollarization in Georgia is around 65%. Since 2011, the Central Bank refinancing rate has been cut to 3.75% from an 8% peak. In February 2014, the Monetary Policy Committee increased the policy rate to 4% as the economy was recovering and inflation was expected to pick up. However, geopolitical tensions in the region posed down-side risks to the outlook. Therefore, the NBG maintained the policy rate unchanged throughout the year. In 2015 the NBG continued exiting its accommodative monetary policy stance and the policy rate has been gradually increased to 6.0% by September 2015. These decisions reflected on increase in inflation expectations and higher intermediate costs. The latter was a direct consequence of the currency depreciation. Inflation has been volatile over the past five years, with a high of 11.2% observed in 2010 and deflation of -1.4% in 2012. Inflation remained below the NBG’s medium-term target of 6% during

Neighbourhood SME financing: Georgia
© European Investment Bank, February 2016 7
2013-2014 due to declining food and fuel prices. Furthermore, weak economic activity put downward pressure on the CPI growth rate. However, from the second half of 2014 the pressure on the exchange rate strengthened. As of end-June 2015, GEL has depreciated by 27% against USD y-o-y. As a consequence, the burden of FX debt servicing has increased, thus pushing up intermediate costs. In August 2015 inflation grew by 5.4% y-o-y, slightly exceeding the 5% inflation target of the NBG. Further changes in the base rate will depend on expected inflation, economic growth and volatility in the global and regional environment.
2.3 External sector Georgia consistently runs a negative current account balance. This has been driven primarily by a trade deficit (see figure 3). In 2006 Russia placed a trade embargo on wine and agricultural product imports from Georgia. Russia accounted for 70% of Georgia’s wine exports, and the ban had a considerable effect on the country’s economy and on the increase in the current account deficit. However, exporters managed to expand gradually to other markets. The ban was lifted on wine and mineral water in February 2013. Overall, lower trade deficit due to higher exports contributed to reduce considerably the current account deficit in 2013 (-5.7% of GDP). However the deficit started to widen again in 2014, amid weak external demand, and stood at 9.7% in 2014. In Q1:2015 the current account deficit reached 14.1% of GDP, owing to an even higher trade deficit. The deficit is financed through substantial FDI and some portfolio investments. The latter, generally, are a potential source of instability more than the former because are primarily attached to short term deposits of non-residents profiting from relatively high interest rates. Non-resident deposits have been showing increasing trends over the past years. It is worth mentioning that these deposits are fairly distributed across creditor countries and mostly composed of term deposits, thus reducing the risk of rapid outflows. All in all, the net external debt to GDP ratio stood at 58% in 2014.
In general, Georgia’s liberal investment environment and equal rights for local and foreign investors make it an attractive destination for FDIs, with most of the inflows coming from EU countries (50% of total FDI). FDI increased considerably in the pre-war lead up, growing at compound annual growth rate of 56% between 2003 and 2008, and peaking in
2007 at EUR 2.0 bn1. This growth was particularly linked to two large pipeline projects and privatization processes. The post-war period has seen a drop in FDI, until started to recover again. In 2014, FDI reached EUR 1.8 billion, with the largest share of the funds going to the transportation & communication sector (25% of total FDI). Other sectors that benefit considerably from FDI include the construction (18.0% of total FDI), manufacturing (12% of total FDI) and energy (11% of total FDI) sectors. Financial sector accounted of 7% of total FDI. SMEs in particular have benefited from FDI through various financial intermediaries frequently financed via international lenders. Owing to strong foreign inflows and sound macroeconomic policies, Georgia was able to accumulate substantial amount of reserves during the past 10 years. However reserves have declined due to foreign debt servicing and FX interventions during 2014 and first half of 2015. The level of official reserve assets was USD 2.4 bn. at end-May 2015.
1 Source: GeoStat
Figure 3. Components of Current Account
Source: National Bank of Georgia

Neighbourhood SME financing: Georgia
© European Investment Bank, February 2016 8
Last but not least, the signature of the Deep and Comprehensive Free Trade Area (DCFTA) agreement (June 2014), which is part of the Association Agreement between the EU and Georgia, offers medium-term economic benefits. It improves access to the EU market. This increases opportunities for exporters given the size of EU economies. Furthermore it supports FDI inflows as a result of improvements in Georgia’s economic governance and institutional capacity in recent years. The DCFTA incorporates elements that should encourage improvements in the rule of law and in effective governance, as well as furthering the transition towards a well-functioning market economy, through the removal of tariff and non-tariff barriers. The government has shown a rather consistent drive in promoting efforts directed to strengthen the country’s institutional framework. Ultimately this should lead to an improvement in the external position via a reduction of the structural current account deficit and via a strengthening of the long-term sustainability of external finance sources.
2.4 Fiscal situation The latest amendment to the Georgian constitution caps public expenditure, budget deficit and outstanding government debt at 30%, 3% and 60% of GDP respectively starting in 2014, in line with the convergence criteria of the Eurozone. The budget has been going through a consolidation process, decreasing to 2.6% of GDP in 2013 from a peak of 9.2% in 2009. However, in 2014 the budget deficit increased to 3.2% due to government’s commitment to increased social expenditures, budgeted capital investments and lower fiscal revenues. Georgia’s government debt stood at 35.6% of GDP at year-end 2014 or 128% of government revenues and was mostly foreign-currency-denominated (mostly SDR). Given the high share of foreign currency denominate debt (about 80%), the exchange rate depreciation is putting upward pressure on general government debt and it is expected to exceed 40% in 2015. Interest payments relative to revenue are low (roughly 3% of the government’s total revenue), reflecting the prevalence of loans granted by international institutions on relatively favourable terms. The maturity of the external debt is particularly long, with an average weighted maturity of around 22 years and an average weighted interest rate of about 1.9% (given high share of concessional debt). Debt dynamics are expected to remain manageable, however further fluctuations are possible.
2.5 Agriculture sector Agriculture has been a traditional sector for Georgia over the years. It accounts for a good share of country’s output - 9.2% of 2014 GDP - and it contributes to roughly 50% of total employment. Despite the high share of employment in agriculture sector, the output contribution is much smaller. This is a symptom of the rather low productivity of the sector. The agricultural sector represents also a high share of total country’s exports. In 2014 the agrifood sector accounted for 29% of total exports or USD 826 mln. The main export products were nuts, wine, mineral waters and alcohol spirits. Georgia is among the world top five producers of hazelnuts, along with Turkey, Italy, USA and Azerbaijan (FAO 2012). The DCFTA agreement will support trade liberalization process and encourage trade in agricultural products between the involved parties. According to the agreement, all the tariffs and duties will be removed on agricultural products. The agreement also calls for reforms to bring the quality of Georgian agricultural products in line with EU standards through improving safety and hygiene measures. Access to finance is a key challenge for the sector. Availability of foreign investment is limited. The share of agricultural sector FDI is modest (around 1% of total). The private sector is the main source of financing, mainly through commercial banks and microfinance institutions. At the end-2014 the outstanding stock of agricultural sector portfolio in commercial banks was Gel 596 mln or 4.6% of

Neighbourhood SME financing: Georgia
© European Investment Bank, February 2016 9
total. Agriculture and forestry sector accounts for a considerable share of microfinancing industry. According to end-2014 data2, the outstanding portfolio was Gel 188 mln or 22% of total portfolio of microfinance sector. This share has been rather stable during past two years.
2 National Bank of Georgia. Annual Report 2014.

Neighbourhood SME financing: Georgia
© European Investment Bank, February 2016 10
3 Financial Sector Overview3
3.1 Banking Sector
3.1.1 Structure Commercial banks dominate the financial system in Georgia. These banks hold the majority of sector’s assets and loan portfolios. As of May 2015, the financial system comprises 19 banks, holding 92.6% of total assets (see figure 4). The number of banks has been stable, in the range of 19-21, during past seven years. The latest entrants into the Georgian banking sector are Pasha Bank, a subsidiary of an Azeri bank, and FINCA Bank, a subsidiary of FINCA Microfinance Cooperatief U.A. Pasha Bank received its license in January 2013, followed by FINCA Bank in August 2013. Of the country’s 19 banks, 18 are foreign controlled including three which are branches of foreign institutions. The only Georgian owned bank is Progress Bank, a Tier 3 bank holding 0.1% of total banking sector assets. There are no state-owned banks, as they were all privatized in the immediate post-Soviet era. As of end-2014, approximately 87% of Georgian banking sector assets (with 84% participation in capital) is owned by non-residents. Ownership by foreign public sector is approximately 4%. Several banks have investments in other financial sector entities. However, such subsidiary businesses represent only an insignificant share of the total banking sector assets and are deducted from regulatory capital. Participation in non-profile activities in nonfinancial industries is restricted for banks. Georgia’s banking sector is rather concentrated, with two banks dominating the sector. As of March 2015, Bank of Georgia (BoG) holds 34% and TBC Bank holds 25.5% of total banking sector assets. Both banks have benefited substantially from foreign support (including IFI funding) over the past decade, allowing them to grow substantially. BoG is listed on the London Stock Exchange since 2012 and is owned by a broadly diversified investor community. TBC is mainly owned by four IFIs (IFC, EBRD, FMO, DEG), but its Georgian founders still maintain considerable shares and influence. In 2014, TBC joined the London Stock Exchange listing. Tier 2 players include Liberty Bank (6.7% of sector assets), Bank Republic (5.7%), ProCredit Bank (5.0%), and VTB Georgia (5.0%). Among the tier 3 banks, the most active players are Cartu Bank, BasisBank and KorStandard Bank. Banking sector concentration has been declining since 2012 but increased in 2015 due to the acquisitions and declining number of banks (from 21 to 19 in 2015). The banking sector Herfindahl-Hirschman indices (HHI) based on assets, loans and deposits (around 0.21 in May 2015) indicate a high level of concentration, nevertheless the competition in banking sector remains high. This is reflected into several dimensions, inter alia: decreasing lending rates and continuous pressures on margins, high marketing costs, high qualified staff cost, legal cases driven by head-hunting, number of branches, ATMs and POS terminals within same spots, almost non-existence of syndicated loans.
3.1.2 Performance Capital Adequacy: Overall Georgian banks are very well capitalized, with a sector-wide total CAR of 19.4% (in Basel standards) in May 2015. The capital adequacy level was high over the past years. All
3 Primary source of financial sector data is the National Bank of Georgia
Figure 4. Asset Distribution in the Financial Sector, May 2015
Source: National Bank of Georgia

Neighbourhood SME financing: Georgia
© European Investment Bank, February 2016 11
measures of capital adequacy are quite high compared to the NBG’s minimum of 12%. A transition process from Basel I to Basel II/III framework for capital adequacy was implemented throughout 2014 and 2015. The changes are reflected on the capital adequacy ratios. Profitability: Profitability of the banking sector has been strong but quite volatile over the past seven years, with key indicators varying widely. ROAA and ROAE were negative in 2009 and rather
low in 2012 (see figure 5). The positive, but low, results were largely due to an increase in loan loss reserves (because of several idiosyncratic factors) and a slowdown of loan portfolio growth. Banks regained higher profitability levels in 2013 and 2014 benefiting from high interest rate margins, strong loan growth, and increased efficiencies. However, the
profit margins decreased in 2015. This has been linked to a decrease in spreads, whereby interest rates on loans have been declining at a faster pace compared to deposit rates. Moreover noninterest revenues had seen a weak growth and liquid assets compressed returns (i.e. lower interbank rates and returns on government/NBG securities). These factors have been partially offset by an increase in banking efficiency via improved economies of scale (pre-provisioning cost to income ratio has been declining) and by an expansion of the asset base. Liquidity conditions: The sector’s loan to deposit ratio has remained consistently above 100% (2014: 112%, May 2015: 118%). This indicates that Georgian banks’ are partially leveraged and their business model depends on net borrowings, especially from IFIs and commercial lenders, mostly foreign entities. However the banking sector has been gradually deleveraging since 2007. Loan growth has been rather robust, but also deposit growth and banking penetration increased – thus fuelling a more rebalancing of banks funding toward domestic sources. Meanwhile, liquid assets to total assets were high over the last five years hovering between 22% and 30%. Likewise, liquid assets covered more than 35% of short term liabilities (primarily deposits). However there has been a slight deterioration since the last quarter of 2014 due to higher local currency liquidity and exchange rate depreciation. Credit Risk: After suffering some decrease in asset quality during the financial crisis, Georgian banks have seen an improvement in portfolio quality. The NPLs ratio halved in 2014 compared to 2009 levels. The decline in NPLs was the result of strong credit growth, write-offs, and loan restructuring. In general, NPLs are higher in foreign currency loans. The non-performing loan4 ratio, which takes into account collateral coverage, borrower capitalization, and various qualitative factors, stood at 7.8% in May 2015, with a 0.2 percentage point increase compared to 2014. NPL ratios increased slightly in 2014, reflecting primarily the slowdown of the economy and exchange rate depreciation pressures. However, given that NBG uses a rather conservative approach, NPLs calculated with the IMF methodology stood at 3.4%. The NPL ratio, defined according to the international standards (loans in arrears over 90 days), is one of the lowest among the peer countries.
4 Five categories of Loans are possible in Georgia: Standard, Watch, Sub-standard, Doubtful and Loss. The last three categories belong to NPL group.
Figure 5. Profitability Indicators
Source: National Bank of Georgia

Neighbourhood SME financing: Georgia
© European Investment Bank, February 2016 12
Market and Other Risk: Georgian banking sector remains exposed to exchange rate risk through unhedged borrowers as most bank assets and liabilities continue to be denominated in USD rather than the local currency (GEL): approximately 60% of total loans are in foreign currency (less than 50% for individuals). The NBG puts a very high risk weighting on FX-denominated loans -175% (i.e. 100% to cover credit risk and 75% to cover currency risk). However, banks continue to lend primarily in USD because of their funding sources. There are very few hedging mechanisms available, with the most mentioned one being a Dutch currency exchange fund, TCX. The cost of this mechanism, however, is very high and does not allow to generate reasonable and appealing market pricing for the various banking products. The high dollarization of the banking system is a challenge for the Georgian banking sector and financial stability. While roughly 65% of deposits and loans are in FX (USD), over 90% of foreign currency borrowers rely on income in local currency. This generates unhedged exposures which trigger financial instability in times of sustained currency fluctuations.
3.1.3 Trade Finance Georgia is a small open economy. International trade plays an important role in the country’s economic activity. In 2014, exports of goods and services amounted to 43% of GDP while imports were 60% of GDP. With deepening of external trade over the years and stronger integration with international markets, development of trade finance (TF) market is important to further increase access to finance for importers and exporters. Currently the trade finance market is underdeveloped. Georgian commercial banks serve both as issuing and confirming bank in TF transactions.
The main trading partners are CIS and EU countries, accounting for 30% and 26% of the total trade in goods respectively in 2014. EU has the highest share in imports – 28% (CIS – 25%). On the export side, more than half of the goods are directed to CIS (51%), while exports to EU account for 22% of the total. The top five trading partner countries for Georgia are Turkey with 17.2% share in total merchandise trade, Azerbaijan - 10.3%, Russia – 7.4%, China – 7.2% and Ukraine – 6.0% (see figure 6). Top export commodities for Georgia are: ferro-
alloys, copper, nuts and wine of fresh grapes, motor cars (re-export), while imports is dominated by petroleum and petroleum oils, petroleum gases and medicaments. The DCFTA arrangement should strengthen further economic ties of Georgia with the EU and facilitate trade. In April 2015 the government of Georgia launched the initiative to create Export Promotion Agency to increase country’s export potential. The cooperation agreement was signed with SACE, the Italian Export Promotion Agency.
3.1.4 Regulation The Georgian banking sector is regulated by the independent National Bank of Georgia (NBG). The financial sector emerged from the 2008/2009 relatively unscathed partly as a result of the countercyclical monetary and supervision policies of NBG and the emergency liquidity support which it provided5. In July 2015 the Georgian parliament passed a bill that would take away from NBG its supervisory functions over banks. The proposed law would transfer banking supervision to a separate agency. The new agency would be in charge of monitoring and oversight of the banking sector and other
5 Source : HTTP://WWW.IMF.ORG/EXTERNAL/PUBS/FT/SURVEY/SO/2010/INT010510A.HTM
Figure 6. Top 10 Trading Partner Countries, 2014
Source: National Statistics Office of Georgia

Neighbourhood SME financing: Georgia
© European Investment Bank, February 2016 13
financial institutions. President Giorgi Margvelashvili has vetoed the bill but was overruled by a majority vote of the Parliament and eventually he signed it in September 2015. The new Financial Supervision Agency was set up as a legal entity of public law at the National Bank. However, two opposition political parties appealed the amendments to the Constitutional Court of Georgia. The court has temporarily suspended responsibilities of the newly set-up agency until the court decision is made and the NBG continues performing its supervisory functions. Currently banks are transitioning process from Basel I to Basel II-III and are required to comply with both regulations. However throughout 2015-2017, the requirements of Basel I regulation will be gradually phased out. Moreover, all investments in subsidiaries must be subtracted from regulatory capital, as opposed to only investments in financial subsidiaries under Basel I. as for market risks, a higher risk weight is assigned to FX-denominated loans (175%, 100% of which is ascribed to credit risk and 75% to currency risk). Reserve requirements are set more for monetary than prudential purposes, and are higher on foreign currency deposits and other short-term foreign currency borrowings (15%), compared to local currency obligations (10%). This policy is one of the many NBG policies aimed at promoting de-dollarization. In addition, reserve requirements are also differentiated based on their remaining maturity. Borrowed funds in domestic currency, with a remaining maturity of over one year, and over two years in a foreign currency, are exempt from reserve requirements. The reserve requirement applied to foreign currency liabilities with a remaining maturity of 1-2 years is 5%.
3.2 Microfinance Sector
3.2.1 Structure and performance Georgian financial system includes 72 microfinance institutions, accounting for about 5% (Gel 1.3 bn) of total financial sector assets as of May 2015. Aside few larger players, the market share of most individual institutions is very small. The volume of assets has been increasing sharply over the recent past, reaching a 36% y-o-y growth in 2014. Growing assets and loan portfolio has been accompanied by high profitability even if market interest rates lowered over the same period of time (see figure 7). In 2014, ROA amounted to 8.3%, while ROE was at 33.7%. The profitability has been driven by the prevailing high interest rates (approx. 30-35% for uncollateralized loans). Microfinance institutions are able to attract an increasing number of customers given the more relaxed procedures and the focus on niche and very small clients underserved by the commercial banks. The NBG is responsible for supervision of microfinance institutions by registering them, revoking their licence, auditing them and imposing sanctions. Operations of microfinance organizations and the conduct of their activities are regulated by the Law of Georgia on Microfinance Organizations, which was enforced in 2006. Microfinance institutions are authorized to engage in the following activities: extend loans; invest in state and public securities; provide money transfers; operate as an insurance agent; provide consultation services in microcredit; receive loans; provide operations as micro leasing, factoring, foreign exchange, etc. However, a microfinance organization shall not receive a deposit from either individuals or legal entities.
Figure 7. Profitability Ratios for Microfinance Institutions
Source: National Bank of Georgia, Annual Report (2014)
Neighbourhood SME financing: Georgia
© European Investment Bank, February 2016 14
The minimum paid-in share capital may not be less than Gel 250,000. The microfinance institutions face a limitation on the total allowed maximum amount of a microcredit extended to a single borrower. This limit is set at Gel 50,000. This constraint, along with the inability to receive deposits, limits the growth of larger microfinance institutions. At the same time, it pushes microfinance institutions to transform into banks once a given critical mass of assets is reached. For example, in 2013, the Microfinance Organization FINCA Georgia, a subsidiary of FINCA Microfinance Cooperatief U.A. and second largest player on the Georgian microfinance market, acquired a commercial bank licence and became FINCA Bank. This transformation enables the institution to offer its customers wider financial services (e.g. accept deposit, offer larger loans amounts, etc.).
3.3 Other financial institutions
3.3.1 Insurance companies There are 14 insurance companies registered in Georgia, accounting approximately for 2.1% of total financial sector assets (May-2015). They provide both life and non-life insurance products. The ownership structure is quite diversified, with some companies entirely owned by non-resident shareholders, while others are entirely represented by resident investments or combination of both. As of end-March 2015, assets of insurance companies, worth Gel 525 mln, were mainly composed of direct insurance operations (share of 29%), reinsurers' share in technical provisions (20%) and credits from other credit institutions (16%). Supervision of insurance sector went through a number of changes since its establishment in 1997. Initially the supervisory set up envisaged an independent state body. In 2007, it stopped functioning as an independent body and the Financial Monitoring Service took up the regulatory functions until it was combined with the NBG in 2009. In 2013 the Organic Law of Georgia on NBG was amended, spinning off the insurance supervision. This has been assigned to an independent national regulatory body accountable to the Government. The public health insurance program commenced in 2009 - covering only part of the population - and also included certain investment commitments in the healthcare sector on behalf of insurance companies. In addition, insurance companies carried out supplementary large-scale investments in the healthcare sector. This effort resulted in a considerable financial burden for the companies involved. Today, the insurance sector continues to administer state health insurance program which was extended in 2013 to cover the country’s uninsured population.
3.3.2 Credit unions Georgian financial sector is represented by 15 credit unions, accounting for a mere share of around 0.04% of total financial sector assets as of May, 2015. Credit unions are primarily set up to serve the financial needs of the rural population. They are not profit oriented and provide financial services – accept deposits and disburse loans – only to their members. They can also engage in investment activities as defined by the Law. Around 64% of credit union assets are composed of net loans, while liabilities are dominated by term deposits, accounting for 63% of total liabilities and capital, while demand deposits are quite small (share of 2% in total liabilities and capital) (Q1 2015). Almost 95% of total deposits in credit unions are in the amount above Gel 2500. Supervision of credit unions falls under the responsibility of the NBG. They are regulated according to the Law of Georgia on Non-bank Depository Institutions – Credit Unions and a number of the NBG decrees. Minimum share capital of the credit union is defined in the amount of Gel 50 multiplied by the number of members. Minimum volume of the credit unions’ total capital shall be no less than 12% of assets staring from the second year of operations.

Neighbourhood SME financing: Georgia
© European Investment Bank, February 2016 15
4 The SME Segment
4.1 The SME segment overview SME definitions differ from institution to institution in Georgia. Therefore the compilation of statistics on SMEs comparable across sectors and establishments represents a challenging task. The National Statistics Office of Georgia classifies enterprises as small or medium-sized if the number of employees does not exceed 100 and the average annual turnover is up to Gel 1.5 mln. For taxation purposes, the status of a small business may be granted to a natural person whose gross income from economic activity during a calendar year does not exceed Gel 100 000. As for the financial sector, measures for defining businesses by size are quite diverse among the several market players, some utilise total exposure to the client, turnover measures, annual sales or combination of them. The Economics Department of the European Investment Bank has recently conducted a Bank Lending Survey among the main financial institutions in the Georgian market. The survey collected information on lending conditions, availability of different financial products and credit extensions to corporates, particularly to SMEs. The survey included questions related to recent credit developments, demand and supply factors that affect credit growth, availability of various financial instruments, breakdown of loan portfolio by sectors/maturity/purpose, and perception of credit conditions. The respondents provided information according to their definition of SMEs. Six respondents were chosen from the financial intermediaries in Georgia (5 commercial banks and one microfinance institution). The survey covered 75% of banking sector assets and approximately 65% of banking sector SME portfolio. Some of the key results of the survey are reported in this section and in the following sections of the report. Small and medium sized enterprises (SMEs) dominate Georgian business sector in terms of number of registered companies, however the relative production and turnover figures are much lower. According the National Statistics Office6 the SME segment accounted for 17% of total private sector turnover and 18% of total production in Q1 2015. To the contrary, SMEs account for 39% of total business sector employment. Average salaries for employees in SMEs are lower than average salaries of employees in large businesses. As of Q1 2015, average monthly salary in a small business entity was less than half of the compensation in large enterprises, while average monthly earnings in medium enterprises amounted to 68% of large companies.
The services sector accounts for large part of the small and medium-sized enterprises. Looking at the sectoral breakdown, SMEs are more involved in production processes in real estate, trade and manufacturing sectors (see figure 8). Most of the SMEs business is oriented toward the local market. A small share of SMEs is involved in direct export activities. Inter alia, small volumes of production make it more costly for SMEs to explore export opportunities and expand in foreign markets. In addition, the share of firms with internationally recognized quality certification is relatively low.
6 Official business sector statistics does not cover following sectors: financial intermediation; public administration; household production activities intended for own use; retail trade on markets and fairs.
Figure 8. SME Production by Sectors, Q1:2015
Source: National Statistics Office

Neighbourhood SME financing: Georgia
© European Investment Bank, February 2016 16
4.1.1 SME performance Total production in the SMEs segment has been expanding during the past decade (with the exception of 2008 and 2014), reaching Gel 4.5 bn in 2014. The sector’s performance was remarkable between 2009 and 2011 when the growth rates of SME production exceeded those of large enterprises. Since 2012 the production growth in the SMEs segment has slowed down. It turned even slightly negative in 2014, reflecting overall adverse macroeconomic and geopolitical developments. Lower activity has translated into lower demand for loans. As indicated by half of the respondents to a recently conducted EIB Bank lending survey, the demand for bank loans has somewhat decreased during the past 12 month. Results from BEEPS8 help gauge the main obstacles in doing business as perceived by SMEs (see figure 9). The most prominent obstacles were political instability, access to finance and tax rates. The survey was conducted in 2012 and the timing of the survey may have led to an overrating of certain results. For example, the high score on political instability has been most likely influenced by idiosyncratic factors. During 2012-2013, when the surveys were conducted, the country was going through a democratic process of change in government. As a result of elections in 2012, the main ruling party – United National Movement (after being in power for about eight years) was defeated by the opponent – Georgian Dream coalition. Many companies and businesses chose a wait-and-see approach during this period due to an increased uncertainty on how the change in power would have unfolded. As a consequence political instability should be interpreted as a transitory element which cleared up after the smooth transition of powers. To the contrary access to finance can be considered a key obstacle. In addition, SMEs also report tax rates as a substantial obstacle to their activities. However, the amendments to the tax code introduced the possibility of having special tax rates. As a result micro business9 became exempt from income tax and small enterprises10 were given special tax rates – 3% or 5% instead of the general 20% rate. The institutional and legal environment remains rather favourable. According to the Transparency International’s corruption perception index, Georgia ranked 50 in 2014 out of 174 countries, placing it ahead other peer countries (Armenia - 94, Azerbaijan - 126, Ukraine - 142, Moldova - 103). SMEs in Georgia can also benefit from more efficient process of obtaining licences compared to other countries in region or other lower middle income economies. In addition, no obstacles were reported due to theft, robbery, vandalism and arson in World Bank Enterprise Surveys. The level of innovation in the SMEs segment is low in Georgia. According to the BEEPS, around 11% of SMEs undertakes innovative decisions in Georgia. This result is slightly below the average among peer countries in the region. The support for innovative approaches and new technologies is essential to boost productivity and growth, especially for SMEs. To encourage innovation and
7 The perception of political instability is rather overrated as during 2012-2013 overall uncertainty in the country was elevated due to pre- and post- election periods and the process of change in power. 8 These results are derived from an in-house analysis of the World Bank/EBRD The Business Environment and Enterprise Performance Survey (BEEPS) database, whereby SMEs are defined as companies with less than 100 employees. 9 No hired labour and annual gross income less than Gel 30 thsd (with some exceptions) 10 Annual gross income less than Gel 100 thsd
Figure 9. Main Obstacles of the Business Environment 7
Source: BEEPS Survey

Neighbourhood SME financing: Georgia
© European Investment Bank, February 2016 17
technological development, also in the SMEs segment, ‘Georgia’s Innovation and Technology Agency’ was created in 2014.
4.1.2 Access to finance Access to finance is one of the major constraints for SME activities in Georgia. For example, over 95% of small and medium firms use banking services in the form of checking or saving accounts. Nevertheless, only 30% of small firms and 41% of medium firms take advantage of bank loans or lines of credit11. Approximately, one fifth of SMEs find access to financing as a major or very severe obstacle to business operations (see figure 10). These results are comparable with other countries in ENCA12 region. In addition as this segment is predominantly domestically owned, the access to foreign equity or borrowing is difficult. Last but not least, the availability of funding, particularly in local currency, is essential for the SME segment development. The results of the BEEPS survey are in line with other global assessments. For example, the Global Competitiveness Report 2015-2016 ranks access to finance as the second most problematic factor for doing business in Georgia (inadequately educated workforce is number one problem), followed by inadequate supply of infrastructure.
Small and medium enterprises that are credit constrained (either discouraged from applying or rejected) reach 40% of the SMEs needing a credit line in Georgia. However, this measure is even higher for the whole ENCA region (exceeding 60%). Among the reasons for being credit constrained, unfavourable interest rates scores as high as 70%, followed by complex procedures (16%)13. It should be noted that a decrease in interest rates for SME segment has been notable during the past 5 years, albeit levels remain rather high. As of May 2015, the average interest rate on SME portfolio is around 13%, while it slightly exceeds 10% for corporates. The currency mismatch between assets and liabilities in the SMEs balance sheet is another important factor constraining the capabilities of SMEs to take up credit. About 75% (end-2014)14 of the SME loans are in foreign currency, mostly in US dollars, however, their FX proceedings are minimal. Therefore, the exchange rate depreciation – occurring since late 2014 - is having a negative balance sheet effect for unhedged borrowers and is deteriorating their leverage. In addition, it is discouraging potential borrowers to demand for credit lines. On the other hand, bank capability to generate local currency funding is limited. Therefore, the unavailability of Gel financing is rather a structural issue hampering SME segment development rather than a temporary consequence of currency fluctuations. In addition, loans in local currency are generally offered at a higher rate, thus making FX loans seem more attractive.
11 BEEPS country report 12 Includes countries: Armenia, Azerbaijan, Georgia, Moldova, Ukraine. 13 BEEPS 14 National Bank of Georgia
Figure 10. SME Access to Finance Seen as an Obstacle
Source: BEEPS Survey

Neighbourhood SME financing: Georgia
© European Investment Bank, February 2016 18
The SMEs rely heavily on internal sources of funding and retained earnings. For example over 70% of investments in fixed assets and 80% of working capital are financed with internal resources. It is comparable with the ENCA region average. Bank products are the second largest source to finance fixed assets and working capital in Georgia. Georgian SMEs make slightly better use of bank financing and also equity than regional peer countries (see Figure 11 and 12). Figure 11. Sources of SME Financing – Fixed Assets Figure 12. Sources of SME Financing –Working
Capital
Source: BEEPS Survey
4.1.3 The institutional and legal environment Georgia has favourable business environment, ranking above other countries in the region. Georgia ranked 15th in the World Bank Doing Business 2015 report out of 189 economies (see figure 16). Georgia’s ranking is supported by leading performance in terms of starting a business; registering property; dealing with property rights. These factors make it easier for SMEs to start their business activities. However, Georgia scores lower in terms of resolving insolvency, ranking only 122nd. Establishing more robust bankruptcy legal system by improving insolvency framework and debt recovery could facilitate access to finance and support the survival of more efficient enterprises. According to the World Bank Doing Business 2015 indicators, Georgia ranks 7 out of 189 economies on the ease of getting credit, indicating that the country’s local regulations and institutions (credit information system, legal rights) support lending and borrowing processes. The ranking indicates a more favourable environment compared to neighbouring countries and the ENCA region (see figure 13). A number of measures implemented during the recent past enhanced the possibilities of an easier access to credit. In detail, central collateral registry was created with an electronic database accessible online; the civil code was amended to expand the range of assets which can be pledged as collateral; a new law was introduced on personal data protection.
Georgia has a well-established private credit bureau system that distributes full information, including on-time repayment patterns and outstanding loan amounts, and new regulations guarantee borrowers’ right to inspect their own data. The credit bureau coverage reaches 57% of adults. The system allows banks to get credit information in a timely manner and reduce risks related to asymmetric information. SMEs in Georgia can benefit from
the easy process of property registration. With only one procedure and one day needed. It costs about 0.1% of the property value to get the property registered (ranking 1st). This contributes to the
Figure 13. Doing Business 2015 Rankings
Source: World Bank Doing Business 2015

Neighbourhood SME financing: Georgia
© European Investment Bank, February 2016 19
emergence of a formal property rights system, thus facilitating property’s acceptance as collateral. This matter is important as the share of collateralized loans for SMEs is high, with over 90% of firms indicating that were required to provide collateral, mostly in the form of real estate. In general, banks prefer immovable property as collateral rather than movable property. Despite this favourable legal basis, access to financing remains a constraint for enterprises, particularly SMEs. In recent years the government has taken a more proactive stance to support SMEs. The social-economic development strategy “Georgia 2020” also draws on the issues of SME financing, especially at the start-up stage. It also highlights the need to support development of non-bank intermediaries. To facilitate private sector development, and in particular SME segment, through financial and technical assistance schemes, the Entrepreneurship Development Agency was established in March 2014 under the Ministry of Economy and Sustainable Development. The program “Produce in Georgia” was launched in 2014 to encourage domestic industry/agriculture production and increase productivity and competitiveness of SMEs through financial and technical assistance targeted to the establishment of a new enterprise or to the upgrade of an existing one. The financial scheme includes a mix of interest rate co-financing and partial collateral guarantees for new establishments whilst only co-financing interest rates on leasing products. Loan size can range between USD 150,000 and USD 2,000,000 with minimum 80% of loan allocated to the purchase of property, plant and equipment. Alongside financial assistance, the program also includes consultancy support. One of the recently launched (spring 2015) programs is oriented on micro and small enterprises in regions (financial support + consulting) to support creation of new businesses. To support the agriculture sector development in Georgia, the Agricultural Projects Management Agency (APMA) was created in 2012. It covers programs to stimulate micro and SME production in the regions. For example, starting from March 2013, “Preferential agro credit program” was launched. It provides small and medium farmers credits through banks with preferential terms and also offers some leasing products. The agency also implements projects under “Produce in Georgia” program. Furthermore, the government is currently developing a fully-fledged SMEs strategy. Its implementation is expected in 2016.

Neighbourhood SME financing: Georgia
© European Investment Bank, February 2016 20
5 Financial Intermediaries in SME Financing
5.1 Banks Products
Commercial banks dominate the Georgian financial sector. They account for more than 90% of sectoral assets. Banks provide services across the whole country, with branches and service centres covering most of the territory (excluding occupied regions). Many regions that do not have access to branches are served by mobile branches (minivans).
Demand for commercial bank products is high given their more favourable terms compared to other financial institutions (e.g. microfinance institutions). However commercial banks apply more conservative and bureaucratic approaches. Most widely used instruments are loans, given their greater availability and simple characteristics. Almost all the banks provide loans to SMEs in both domestic and foreign currencies (see figure 14). Fewer banks offer trade finance products.
As for the leasing segment, it is largely undeveloped due to both supply and demand side factors. The lack of demand due to low awareness demotivates banks to expand in this segment (see section 5.3 on Leasing). The private equity market is almost non-existent, with very few financial institutions offering it. Moreover, start-up companies (even with the collateral) barely receive financing from banks. Most banks require at least three months of operational experience for the company to be eligible for a loan. Commercial banks provide loans to SMEs either on a short-term basis, mostly for working capital, or long-term. Loans are offered both in local currency and foreign currency, however, availability of local currency loans is very limited, especially with longer maturities (see figure 15). Two-thirds of EIB respondent banks claim that local currency loans with maturity over 1 year is seldom available to SMEs. Foreign currency loans are widely available across maturities. Average loan maturity has been increasing over the past years, especially for local currency loans. However, the latter still remains below the average maturity of FX loans as large share of investment expenditures are financed through foreign currency loans. This reflects the structure of bank funding which embeds a structural lack of long-term resources in local currency. About 62%15 of outstanding loans of banks have a maturity above 1 year. For the SME segment, less than 15 percent16 of loans are short-term (<1year), mainly for working capital. However, even longer-term loans (>1 year) are more concentrated at the lower end of the maturity spectrum, with average maturities being below
15 NBG 16 EIB Enterprise Lending Survey
Figure 14. Products Offered by Banks (% of Banks)
Source: EIB Bank Lending Survey
Figure 15. Availability of Loans to SMEs by Currency and maturity
Source: EIB Bank Lending Survey
Neighbourhood SME financing: Georgia
© European Investment Bank, February 2016 21
three years. According to 2013 BEEPS survey data, small and medium firms indicated that original duration of their recent credit on average was about 32 months. Long term loans in local currency can be obtained at floating interest rates or fixed. The introduction of floating rates loans allowed banks to increase the availability of local currency funding and decrease the interest rates charged. However, the share of such loans remains low. For the SME segment, floating interest rate loans account for about 5% of the total. Trade finance: Currently the trade finance market is underdeveloped. Some TF instruments are available on the market, but they are employed more by larger importers and exporters. Georgian commercial banks serve both as issuing and confirming bank in TF transactions. However, there is no officially reported statistics available for this segment17. Banks consider some TF instruments to be available on the market. However, the TF market potential is not exploited due to a lack of potential clients’ awareness. In Georgia documentary trade finance is mostly dominated by credit, letters of credit and guarantees. The amount of loans employed for import-export activities are high. However, some banks involved in this segment does not account separately for the import/export loans. Large corporates are more active in using trade finance instruments as they have better understanding of this market. While SME access to these products are rather limited. Currently most of the trade finance instruments are short-term. The maximum maturity can be extended up to three years. Banks have been able to extend the maturity to three years for only few transactions and very few counterparts involved in trade finance. Therefore, three year maturity certainly does not reflect the average maturity in the market (below 2 years). As a consequence, granting financing lines up to three years provides a significant enhancement over the average available on the market. As for pricing differential between local currency and USD/EUR financing (in cash), it can be as large as 5-6%. Potential: Currently trade finance market in Georgia faces constraints both from demand and supply
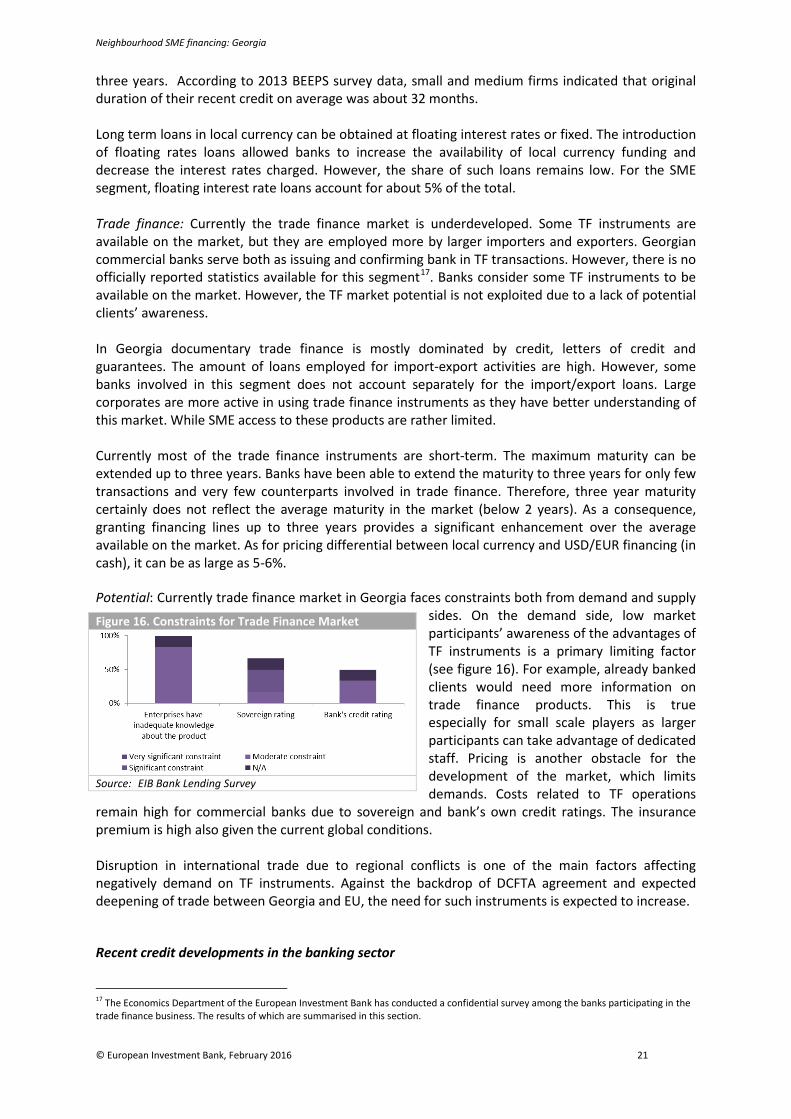
sides. On the demand side, low market participants’ awareness of the advantages of TF instruments is a primary limiting factor (see figure 16). For example, already banked clients would need more information on trade finance products. This is true especially for small scale players as larger participants can take advantage of dedicated staff. Pricing is another obstacle for the development of the market, which limits demands. Costs related to TF operations
remain high for commercial banks due to sovereign and bank’s own credit ratings. The insurance premium is high also given the current global conditions. Disruption in international trade due to regional conflicts is one of the main factors affecting negatively demand on TF instruments. Against the backdrop of DCFTA agreement and expected deepening of trade between Georgia and EU, the need for such instruments is expected to increase. Recent credit developments in the banking sector
17 The Economics Department of the European Investment Bank has conducted a confidential survey among the banks participating in the trade finance business. The results of which are summarised in this section.
Figure 16. Constraints for Trade Finance Market
Source: EIB Bank Lending Survey

Neighbourhood SME financing: Georgia
© European Investment Bank, February 2016 22
On average, banking sector activity has been expanding between 2010 and 2015. After a temporary slowdown in credit growth from the second half of 2012 for about a year due to the pre- and post-election periods’ uncertainty and weak domestic demand, credit growth started to accelerate again towards the end of 2013. This acceleration was also supported by the introduction of variable interest rate loans denominated in national currency. However, their share in net loans is still small (16% - end of 2014). The growth of portfolio has been moderate throughout 2014, reaching 18.6% by the end of the year (excluding the exchange rate effect). Credit activity remained reasonable in the first quarter of 2015 and then significantly slowed down since April. Local currency portfolio has registered higher growth rates as demand for FX loans was low. In general, GEL-denominated loans are much more expensive than FX loans, with average interest hovering around 18.8% (May 2015). In addition the average maturity structure of local currency loans is shorter, normally less than two years. Local currency business loans with floating interest rate have also been increasing and they are less than one third of total business loans. Commercial banks’ SME portfolio has increased substantially after the financial crisis of 2008, especially in 2010, as banks were more reluctant to disburse loans to large clients due to elevated credit risk of corporate borrowers. After 2010, along with fast economic recovery, banks returned to corporate and retail clients. The respondents participating in EIB Bank Lending Survey reported SME portfolio growth of around 26% in 2014 (see figure 17).
Overall, total bank loans reach 48% of GDP (end of Q2:2015). Retail loans are the largest segment, accounting for around 40% of the overall portfolio. Corporate and SME loans make up about 37% and 23% respectively. As for the sectoral distribution, total non-retail loans are led by services and trade-related industries, accounting for about one third of total portfolio (approx. half of non-retail segment) (see figure 19). Agriculture sector accounts for another 4.5% of total loans (see figure 17). Similarly, SME loan portfolio is dominated by services and trade sectors, cumulatively accounting for more than half of the portfolio (see figure 18).
Figure 17. Loan Portfolio Growth in 2014, y-o-y Figure 18. SME Portfolio by Sectors, 2014
Source: EIB Bank Lending Survey Note: Bank responses were weighted by SME portfolio size Source: EIB Bank Lending Survey

Neighbourhood SME financing: Georgia
© European Investment Bank, February 2016 23
Quality of SMEs portfolios: At the end-2014 the share of non-performing loans in the SME portfolio was at 4.2% as opposed to 8.0% for corporates (see figure 20). However, the large share of unhedged SME borrowers hides a latent exchange rate risk, also taking into account the increased exchange rate volatility of regional currencies and specifically the recent depreciation of the GEL18. Consequently, the currency induced credit risks are increasing as depreciation is translating into higher costs of servicing FX loans. This may endanger the future quality of the aggregate banking assets because only one fourth of SME portfolio is denominated in domestic currency (see figure 21), while SMEs earnings are predominantly in domestic currency. As a result demand for local currency loans is high, particularly in the SMEs segment. However, intermediaries have limited availability of long term Gel funding. As a result, demand for local currency loans remains greatly unmet.
Factors affecting credit growth
Several factors are affecting SME loan growth. The results of the EIB Bank lending survey indicate that credit growth has been affected by both demand and supply factors. In detail, 50% of respondents report that demand for the credit is a constraining factor to the expansion of SME
18 As of June 2015, the nominal exchange rate of GEL against the USD has depreciated by 27% y-o-y.
Figure 19. NON-RETAIL LOANS BY ECONOMIC SECTORS, % OF TOTAL LOANS, 2014
Source: National Bank of Georgia
Figure 20. Credit Quality by Segments, 2014 Figure 21. Currency Structure of Loans, 2014
Source: National Bank of Georgia, Annual Report 2014

Neighbourhood SME financing: Georgia
© European Investment Bank, February 2016 24
credit portfolio whilst another 50% report a combination of demand and supply-side factors. Existence of demand-related issues is confirmed by the BEEPS survey, indicating that a large number of SMEs get discouraged and abstain from applying from credit. However SMEs stress that it is mainly due to unfavourable rates and complex procedures. Looking in detail at macro-environment and customer related factors, credit to SMEs is mostly constrained by local macroeconomic conditions, lack of acceptable collateral and lack of creditworthy customers (Figure 24). Local macroeconomic conditions impact credit extensions to SMEs as well as to larger corporates. EIB survey revealed that firm-related factors, such as capacity to prepare business plans or loan application, are also an obstacle to securing financing.
Collateral requirements: Real estate is the main asset demanded as collateral in loan extensions (see figure 22). This restricts the collateral base available to companies, especially for SMEs which primarily own movable property. This especially holds for borrowers in rural areas. From a regulatory perspective, banks have limits on exposure to uncollateralized loans - 25% of total
portfolio. However, banks normally do not reach this ceiling. This implies that banks are more risk adverse than the regulator. By doing so, they are limiting even further the total supply of credit which would be otherwise allowed within the boundaries of the regulatory framework. In general, this is partially justified by the fact that often SMEs do not have audited financial statements (not legally required). Therefore collateral serves as a buffer to tap the uncertainty surrounding clients’ cash flows. This is also a problem for mid-caps, albeit to a lesser extent. This result is also reflected in the EIB Bank Lending Survey whereby banks stress that they require material collateral from SMEs mostly in the form of real estate. Currently there are no national credit guarantee schemes. Some partial collateral guarantees are provided under the “Produce in Georgia” program for certain individual loans. Some banks have accessed international credit guarantee schemes (e.g. USAID). Further expansion of credit guarantee schemes for SMEs could reduce information asymmetry problems and assist sound SMEs with limited collateral. Bank-related issues. Among the bank-specific factors constraining credit growth, the lack of local currency funding is the most severe (see next section for more details). 80% of respondents report it as a very significant and/or significant constraint (Figure 23). High interest rates on loans are another important factor. Last but least, low profitability is another moderate constraint reported by the banks (80%). This is related to the inner nature of the clients served. In other words, average SME loan size is smaller than average corporate loan size. However, SME loans still require dedicated personnel and comparable hours of labour, especially for those small firms located in rural areas, thus compressing unit profits.
Figure 22. Collateral Requirements for SMEs
Source: BEEPS Survey
Figure 23. Bank Specific Factors Limiting Credit Supply

Neighbourhood SME financing: Georgia
© European Investment Bank, February 2016 25
The EIB Bank Lending Survey indicates that in 20% of the cases respondent banks ‘often’ decline loan application, while for another 20% of respondents loans are rejected on rare occasions (Figure 25)19. These results suggest that a self-selection process partially occurs before applying for loans. This is in line with BEEPS Enterprise Survey results. These show that a large number of firms get discourage even before applying for a loan. Funding of banks
Funding of the banking system is diversified. While saving rate in Georgia is quite low, which results in low deposits-to-GDP ratio (around 42%), banks are quite efficient in mobilizing funding from foreign sources. In aggregate, funding from foreign sources accounts for about one third of total funding. This includes: IFIs (30%), related/subsidiary financial institutions (13%) and other private sources (57%) (2014).
19 EIB Bank Lending Survey
Source: EIB Bank Lending Survey
Figure 24. Macro-environment and Customer-related Issues Limiting Credit Supply
Source: EIB Bank Lending Survey
Figure 25. SME Loan Application Rejection Rates
Source: EIB Bank Lending Survey
Figure 26. Liability and Capital of Commercial Banks

Neighbourhood SME financing: Georgia
© European Investment Bank, February 2016 26
Commercial banks are primarily funded by non-bank deposits, which made up 55% of total banking sector liabilities (including equities) as of May 2015 (see figure 26). Deposits are an affordable source of funding for banks, with average rates on USD-denominated deposits at 4.9% and in GEL at 7.2% (May 2015). Deposit interest rates have been decreasing over the past years, especially USD denominated.
Deposits in GEL are the main source of financing domestic currency loans. However, only about 35% of deposits are denominated in domestic currency and they are rather short-term. More than 65% of local currency deposits are either current accounts or demand deposits and only about 12% of total deposits have a maturity over 1 year. The shortage of long-term domestic currency funding significantly holds back the credit growth for enterprises, especially for the SME segment (see figure 23). Georgian authorities have been undertaking measures to address the dollarization problem and support the availability of long-term local currency funds on the market. In 2014 a new initiative has been implemented to provide the banking sector with the possibility to transform available short-term liquidity into longer term maturity. Under this scheme, the government issued treasury bonds with the value of GEL 173 million and the proceeds were allocated on term deposits with commercial banks in order to encourage long term GEL lending by banks. Additional placements of government papers with total value of GEL 100 million were carried out in January-February 2015. Furthermore, in 2014, the EBRD issued Georgian lari bonds (GEL 50 mln), becoming the first-ever bond issued by an international financial institution in GEL and also representing the first floating rate note on the domestic market. This placement was followed by IFC and ADB in 2015. As of end-June 2015, the stock of IFI bonds issued in Gel stand at Gel 205 mln.
5.2 Microfinance institutions Microfinance sector development is crucial to support SME activities in the country. Access to finance in Georgia is also limited by relatively weak non-bank intermediaries. As of end-May 2015, there were 72 microfinance organizations (MFIs) registered in Georgia. Despite the high number of players, the microfinance market is rather concentrated and dominated by very few institutions. The number of MFIs has grown considerably since end-2008, when only 27 institutions were registered. The microfinance segment accounts for about 5% of total financial sector assets. During 2014, total assets of the MFI sector increased by 36% y-o-y. Compared to end-2011 this sector has expanded 2.5 times. The total loan portfolio of microfinance sector amounted to Gel 1.1 bn at the end of Q2 2015, as opposed to Gel 14.9 bn portfolio of the banking sector. Net loans make up approximately 77% of total assets. The microfinance sector portfolio is dominated by three sectors: trade and services (share of 20%, end-2014), agriculture and forestry (22%, end-2014) and retail loans (50%, end-2014). Agriculture remains as one of the main segments of MFI activity. Funding
Source: National Bank of Georgia

Neighbourhood SME financing: Georgia
© European Investment Bank, February 2016 27
Borrowed funds represent the main source (68% on average) of financing for MFI activities. Since MFIs are not allowed to accept deposits, they have to rely on external sources of funding. The growth of assets has been supported by the funds mobilized both from non-resident financial institutions/legal entities and individuals. It is worth to note that international investors with substantial microfinance experience, like Triodos, AccessHolding and responsAbility, are present on the market. Market participants have also access to funding sources from IFIs. However, of the relatively small size of the majority of the players constraints their ability to attract international investors’ funding. Foreign currency resources are available, but local currency funding is scarce.
5.3 Leasing The leasing industry remains underdeveloped in Georgia. A poor legislative framework for the sector undermined its development over the recent past. The market is mainly represented by subsidiaries of commercial banks and few local companies. The total volume of leasing transactions reached Gel 100 mln, with SME share slightly over 10%20. In the BEEPS survey, less than 5% of SMEs report to be leasing fixed asset, below the share recorded in other ENCA countries. The leasing sector is especially important for SMEs to finance fixed assets, because it does not require additional collateral and repayment structure is more flexible than plain vanilla loans. Additional benefits of leasing products are related to tax advantages. For example lease payments are fully deductible. This decreases the taxable profit, while in the case of a loan only interest payments are deducted as cost. Given the small size of the leasing sector in Georgia, international investors’ interest remains low and limits the availability of funds. On the demand side, limited awareness of leasing products represents a constraint.
20 From the interview of leasing market representative.

Neighbourhood SME financing: Georgia
© European Investment Bank, February 2016 28
6 Summary: Gaps in Financing
6.1 Gaps in the availability of financial products: • Credit is widely available. However SMEs have better access to short term working capital
loans than long term investment finance. As a result, the number of SMEs that are credit constrained is high and many are discouraged from applying for loans due to unfavourable rates and relatively high collateral requirements. All in all, SMEs financing needs are still unmet. Therefore, SMEs rely heavily on internal funds and retained earnings.
• Banks are the main source of external funding to SMEs. They finance SMEs mostly in the form of loans. Non-bank finance and capital markets are under-developed and utilization of instruments other than credit is limited.
• Availability of local currency loans is very limited, especially with longer maturities. • It is easier for SME to access finance in foreign currency than local currency. • SMEs in agricultural sector have limited access to external financing. • Trade finance market is not developed. Some trade finance instruments are available and
benefits from the support of IFI credit enhancement programs. However they are utilised primarily by larger companies. TF instruments commercialised on the market are mostly credits, letters of credit and guarantees.
• The leasing industry remains underdeveloped in Georgia. The market is mainly represented by subsidiaries of commercial banks and few local companies.
• Very few banks have made use of credit guarantee schemes, developed by international financial institutions. However needs and demand for this product is detected to be growing.
• Private equity and venture capital are practically non-existent. Securing financing at early stages represents a severe problem.
6.2 Constraints on the growth of SME finance • Both demand and supply factors constrain the expansion of SME credit portfolio. • Funding constraints vary across banks. Banks generally have good access to foreign currency
funding both from domestic and external sources; but the local deposit base is a constraint on lending in local currency. Among the bank-specific factors constraining credit growth, the most severe is the lack of local currency funding. As a result, about 75% of SME loans are in foreign currency, mostly in US dollars. Therefore, SMEs with FX loans incur additional costs both in times of depreciation and/or heightened volatility of exchange rates.
• Higher interest rates for the SME segment discourage borrowing. • Low banking sector profitability is also a factor moderately limiting banks to be more
aggressive in extending credit to SMEs • SME risk is an important constraint for the intermediaries. All banks indicate some degree of
difficulty for SMEs to post the necessary collateral, provide appropriate business plans and transparent accounts.
• SME risk is to some degree mitigated by the business environment. Georgia has a favourable business environment, scoring well above other countries in the region. For example, Georgia performs well against peer countries in terms of requirements to starting a business; registering property; dealing with property rights. Perception of corruption is also low. These conditions make it easier for SMEs to start business activities. The legal and institutional framework to get credit is assessed to be favourable. Despite this positive landscape, our analysis shows that access to financing remains a constraint for enterprises, particularly SMEs.
• From macro and customer-related factors, local macroeconomic conditions, lack of acceptable collateral and lack of creditworthy customers are described to be primary factors preventing banks to extend more credit. Real estate is the main collateral demanded by

Neighbourhood SME financing: Georgia
© European Investment Bank, February 2016 29
banks. On the other hand, other assets, such as inventory or equipment, are frequently considered too risky. This restricts the collateral base available to companies, especially to SMEs, because their ownership rates in the real estate sector is rather low. To the contrary SMEs primarily own movable property.
• Lack of innovation and need for infrastructural upgrades is another issue. SME sector is a large employer. However its production share in total economy is relatively low. Capacity and quality upgrading both in exporting and non-exporting SMEs would enable firms to get more benefit from DCFTA opportunities.
• Moreover, the analysis shows that - in addition to the need of increased access to financial resources - technical assistance for SMEs is of high importance. Particularly, advisory support related to business planning and reporting standards would support further expansion of the segment and also assist in securing financing.

Neighbourhood SME financing: Georgia
© European Investment Bank, February 2016 30
References: Presented analysis is based on a number of national, international and internal sources of data and information:
• Enterprise Lending Survey conducted by the European Investment Bank • International Monetary Fund reports and databases • Ministry of Economy and Sustainable Development of Georgia • National Bank of Georgia (NBG) statistics and reports • National Statistics office of Georgia (Geostat) • OECD Eastern Partner Countries SME Policy Index 2012 • World Bank/EBRD The Business Environment and Enterprise Performance Survey (BEEPS)
database and country reports; internal analysis of BEEPS database • World Bank Doing Business Indicators

Neighbourhood SME financing: Georgia
© European Investment Bank, February 2016 31
Annex I Economic Data
2010 2011 2012 2013 2014 2010-2014 Average 2015 (Est)
4.4 4.5 4.5 4.5 4.5 4.5 4.51.2 0.7 0.6 -0.3 -0.3 0.4 -0.3
16.3 15.1 15.0 14.6 -- 15.2 --
6.2 7.2 6.4 3.3 4.7 5.6 2.0-- -- -- -- -- -- --
2,623.4 3,229.8 3,523.4 3,599.7 3,699.1 3,335.1 3,087.211.6 14.4 15.8 16.1 16.5 14.9 13.819.3 22.5 24.8 21.9 21.9 22.1 22.5
-- -- -- -- -- -- --
-4.8 -0.9 -0.8 -1.2 -1.8 -1.9 -3.133.7 29.8 30.0 32.2 35.1 32.1 42.465.8 61.5 66.9 65.4 65.0 64.9 78.6
-- -- -- -- -- -- --
7.1 8.5 -0.9 -0.5 3.1 3.5 3.028.5 29.2 30.2 36.6 38.3 32.6 43.831.8 32.7 34.4 39.8 -- 34.7 --1.8 1.7 1.7 1.7 1.8 1.7 2.2
-- -- -- -- -- -- ---- -- -- -- -- -- --
-6.7 5.4 2.1 -0.7 -6.1 -1.2 -26.3
-10.2 -12.8 -11.7 -5.7 -9.6 -10.0 -11.510.2 10.7 11.2 12.1 -- 11.0 --
-- -- -- -- -- -- ---- -- -- -- -- -- --
87.7 91.0 95.9 102.3 102.9 96.0 106.00.0 0.0 0.0 0.0 -- 0.0 --
28.0 29.1 31.0 28.8 -- 29.2 --18.5 19.4 14.9 20.8 -- 18.4 --
100.0 109.3 111.3 107.6 106.8 107.0 --112.6 110.3 113.6 111.0 111.5 111.8 109.9
15 7 235 43 13 38 122-- 33Employing Workers
Getting CreditProtecting InvestorsPaying TaxesTrading Across Borders
BALANCE OF PAYMENTS ACCOUNTS
54.50 69.38
(1) GDP : Gross Domestic Product(2) GNDY : Gross National Disposable Income = GDP + Net Income + Net Current transfers from abroad(3) CPI : Consumer Price Index - (4) FDI : Foreign Direct Investment(5) Trade openness = 100 * (exports + imports of goods and services) / GDP.(6) Market share in the world market = percentage of merchandise exports in total world imports.(7) REER: The real effective exchange rate. A decrease in REER represents an increase in competitiveness (real depreciation).(8) Terms of trade = export prices / import prices of goods and services.Source: IMF, WTO, European Commission (DG Trade), World Bank.
GEORGIA - ECONOMIC DATA
Ease of Doing Business RankStarting a BusinessDealing with Licenses
Enforcing ContractsRegistering PropertyResolving Insolvency
NATIONAL ACCOUNTS
SOCIAL INDICATORS
MONETARY ACCOUNTS
Current Account Balance, % GDP
Rule of Law
CPI (3) Inflation, %Broad Money, % GDPCredit to Private Sector, % GDPNominal Exchange rate (Nat cur/USD)
Foreign Exchange Reserves, months of importsTrade Openness (5)
Market Share in the World Market, % world imports (6)
Governance Indicators 2014 (Percentile Rank)
66.51
Control of Corruption
73.68
Voice and Accountability
Stability/No Violence
30.81 53.55
Government Effectiveness
Regulatory Quality
EIB's Internal
Doing Business 2015 (ranking 1=best; 189=worst)
Source: World BankSOVEREIGN RATINGS
Voice and Accountability: the extent to which citizens of a country participate in the selection of governments. Stability and Absence of Violence: the likelihood that the government will be destabilized/overthrown by unconstitutional and/or violent means.Government Effectiveness: the quality of public service provision and of the bureaucracy as well as the government's commitment to policies.Regulatory Quality: the incidence of market-unfriendly policies, as well as burdens imposed by excessive regulation. Rule of Law: the incidence of crime, the effectiveness and predictability of the judiciary, and the enforceability of contracts. Control of Corruption: the extent of corruption, conventionally defined as the exercise of public power for private gain.Source: World Bank.
Population (in millions)Population Growth (%)Unemployment rate (%)
Real GDP (1) growth rate, %
Moody's Fitch
Exports to EU-27 as Share of Total Exports (%)Real Effective Exchange Rate (2000=100)(7)
Terms of trade of goods and services (8)
Imports from EU-27 as Share of Total Imports (%)
GNDY (2), % GDPGDP per capita, US$GDP in Bn US$
Debt Service Ratio,% of expt. goods,services & incomeExternal Debt, % GDP
Gross Investment, % GDPGross National Savings, % GNDY
General Govt Balance, % GDPGross General Govt Debt, % GDP
FISCAL ACCOUNTS
Ba3 / Positive Ba3 / Stable Ba3 / Stable -- / --
Nominal Exchange rate (Nat cur/EUR)Appreciation (%) against the EURAppreciation (%) against the USD
Net FDI (4), % GDPWorkers' Remittances, inflows, % GDP
Standard & Poor's

Neighbourhood SME financing: Georgia
© European Investment Bank, February 2016 32
Annex II Prudential ratios for banks and key banking regulations Ratio Criteria Regulatory capital (in Georgian Lari) ≥ 12.0 million Investments (as a % of shareholders’ equity) Equity investments Equity investments and net value of fixed assets
≤ 50.0% ≤ 70.0%
Credit risk concentration (as a % of regulatory capital) Lending to insiders
Individual Aggregate
Lending to non-insiders
Single borrower Group of interrelated borrowers
Large loans Unsecured loans (as a % of loan portfolio)
≤ 5.0% ≤ 25.0% ≤ 15.0% ≤ 25.0% ≤ 200.0% ≤ 25.0%
Liquidity (as a % of liabilities) Liquid assets (liquid assets to short term liabilities)
≥ 30.0%
Total open foreign currency position (as a % of regulatory capital)
≤ 20.0%
Key banking regulations: Category Brief description
Financial reporting standards Under the Law on Activities of Commercial Banks, 21 banks are required to publish consolidated IFRS statements in addition to quarterly bank-only accounts per NBG standards
Corporate governance standards The Law on Activities of Commercial Banks lays out corporate governance standards, such as the general meeting of shareholders, supervisory council, directorate and audit committee
Ownership restrictions The Law on Activities of Commercial Banks places some restrictions on ownership, such as limits on the percent of shares held without NBG approval
Capital adequacy standards Currently banks are in the transition process and are required to comply with both regulations based on Basel I (DecreeN18/04 of February 12, 2015 of the Governor of the NBG on approving “the Regulation on Capital Adequacy Requirements for Commercial Banks”) and Basel II-III (Decree N100/04 of October 28, 2013 of the Governor of the NBG on approving “the Regulation on Capital Adequacy Requirements for Commercial Banks”). However, starting 2015, the requirements of Basel I regulation are gradually phased out.
Minimum capital requirements The May 23, 2006 legal act, On Approving the Regulation on Defining Minimum Capital Requirements for Commercial Banks22 sets the minimum amount of regulatory capital at GEL 12.0 million (apprx EUR 4.5 million)
Definition of NPL The Regulation on Assets Classification and the Creation and Use of Reserves for Losses by Commercial Banks defines non-performing loans (NPL) as the sum of loans classified by the bank as watch, substandard, doubtful, and loss.23 The definitions are based on quantitative and qualitative criteria such as collateral coverage, borrower capitalization, and risk-based judgment of the bank or NBG. As for the quantitative criteria, a loan is classified as “watch” as soon as it falls into arrears; however, the terms “overdue” or “past due” are reserved for loans in arrears for more than 30 days. The other NPL categories relate to this definition of “past due”, i.e. the number of days indicated as quantitative classification trigger needs to be added on top of the first 30 days past due. A partially secured or unsecured loan is classified as “substandard” after 30 days; “doubtful” after 90 days; and “loss” after more than 150 days. Fully secured loans have an additional 30 days before being classified as “substandard” or “doubtful”. Many loans are classified as non-performing even without overdue days due to other financial and non-financial factors affecting the credit quality. However, all
21 Source: Law of Georgia on the Activities of Commercial Banks. WWW.NBG.GE/UPLOADS/LEGALACTS/NBGLOW/NEW/LAW_OF_GEORGIA_ON_ACTIVITIES_OF_COMMERCIAL_BANKSENG.PDF 22 Source: HTTP://WWW.NBG.GE/UPLOADS/LEGALACTS/SUPERVISION/NBG1.4.4.2DEFINING_MINIMUM_CAPITALENG.PDF 23 Source: NBG (May 2006). Regulation on Transparency of Financial Condition, Art. 5.k. HTTP://WWW.NBG.GE/UPLOADS/LEGALACTS/SUPERVISION/NBG1.4.4.2REGULATION_ON_TRANSPARENCYENG.PDF

Neighbourhood SME financing: Georgia
© European Investment Bank, February 2016 33
loans with overdue of more than 90 days must be classified as non-performing.
Loan classification and provisioning policy
The Regulation on Assets Classification and the Creation and Use of Reserves for Losses by Commercial Banks (December 2000) lays out loan classification standards24
Deposit insurance None
Reserve requirements The Regulation on Assets Classification and the Creation and Use of Reserves for Losses by Commercial Banks (December 2000) lays out reserve requirements by loan classification. Under this legal act, all standard loans require a general provision of 2% of the unpaid portion of the loan, watch loans 10%, substandard 30%, doubtful 50% and loss 100%
Related party transactions The Law on Activities of Commercial Banks states the NBG’s prudential norms, limiting related party transactions.
24 HTTP://WWW.NBG.GE/UPLOADS/LEGALACTS/SUPERVISION/NBG1.4.5.1REGULATION_ON_ASSETSENG.PDF


Economics DepartmentU [email protected]/economics
Information Desk3 +352 4379-220005 +352 4379-62000U [email protected]
European Investment Bank98-100, boulevard Konrad AdenauerL-2950 Luxembourg3 +352 4379-15 +352 437704www.eib.org
© EIB 04/2016 EN © EIB GraphicTeam