geophysicalcorner - chopra · pdf file · 2017-11-03we start in figure 3 by...
TRANSCRIPT
EXPLORER
22 OCTOBER 2016 WWW.AAPG.ORG
Geometric attributes such as coherence and curvature are commonly used for
mapping faults, joints and large fractures, or fault damage zones. There are several curvature attributes that are available to a seismic interpreter, but the two most popular attributes are the most-positive and most-negative curvature.
They are not only intuitively easy to understand, but they provide more continuous maps of faults and fractures. There is another attribute, called Euler curvature, which has useful applications when calculated for 3-D seismic volumes. We had described this attribute and some of its applications in our Geophysical Corner article published in the December 2011 issue of the EXPLORER. We revisit it in this issue and describe how an interpreter can determine the fault or fracture lineaments in different orientations in more detail, by putting them together in a 3-D viewer.
Such a display can provide convenient interpretation of the lineaments of interest.
Determining Euler Curvature
Euler curvature is determined from the most-positive and most-negative curvature magnitudes as well as their strikes. Because the reflector dip magnitude and azimuth can vary considerably across a 3-D seismic survey, it is more useful to equally sample azimuths of Euler curvature on a horizontal x-y plane and project the lines onto the local dipping plane of the reflector. In this way, Euler curvature can be calculated in any desired azimuth across a 3-D seismic volume to enhance the definition of specific lineaments. Such enhanced lineaments along specific azimuths can be brought together for interpreting azimuth-dependent structure for convenient interpretation.
We describe here the application of Euler curvature to a 3-D seismic volume from the Montney-Dawson area of northeastern British Columbia, Canada. The data volume displayed is close to 500 square kilometers.
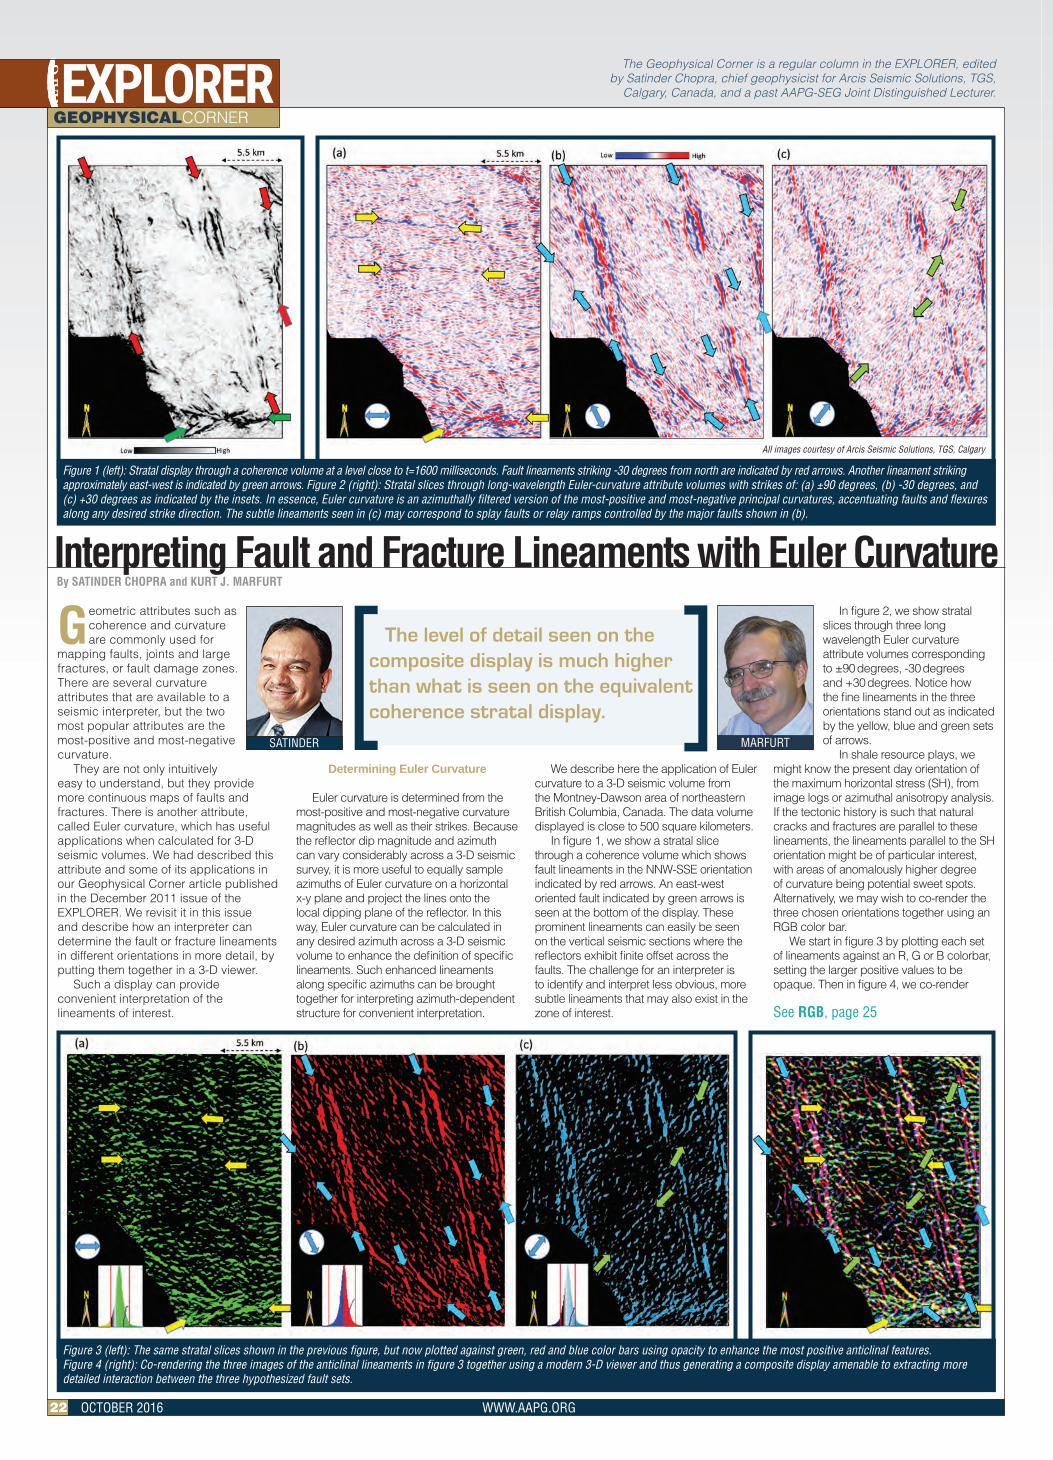
In figure 1, we show a stratal slice through a coherence volume which shows fault lineaments in the NNW-SSE orientation indicated by red arrows. An east-west oriented fault indicated by green arrows is seen at the bottom of the display. These prominent lineaments can easily be seen on the vertical seismic sections where the reflectors exhibit finite offset across the faults. The challenge for an interpreter is to identify and interpret less obvious, more subtle lineaments that may also exist in the zone of interest.
In figure 2, we show stratal slices through three long wavelength Euler curvature attribute volumes corresponding to ±90 degrees, -30 degrees and +30 degrees. Notice how the fine lineaments in the three orientations stand out as indicated by the yellow, blue and green sets of arrows.
In shale resource plays, we might know the present day orientation of the maximum horizontal stress (SH), from image logs or azimuthal anisotropy analysis. If the tectonic history is such that natural cracks and fractures are parallel to these lineaments, the lineaments parallel to the SH orientation might be of particular interest, with areas of anomalously higher degree of curvature being potential sweet spots. Alternatively, we may wish to co-render the three chosen orientations together using an RGB color bar.
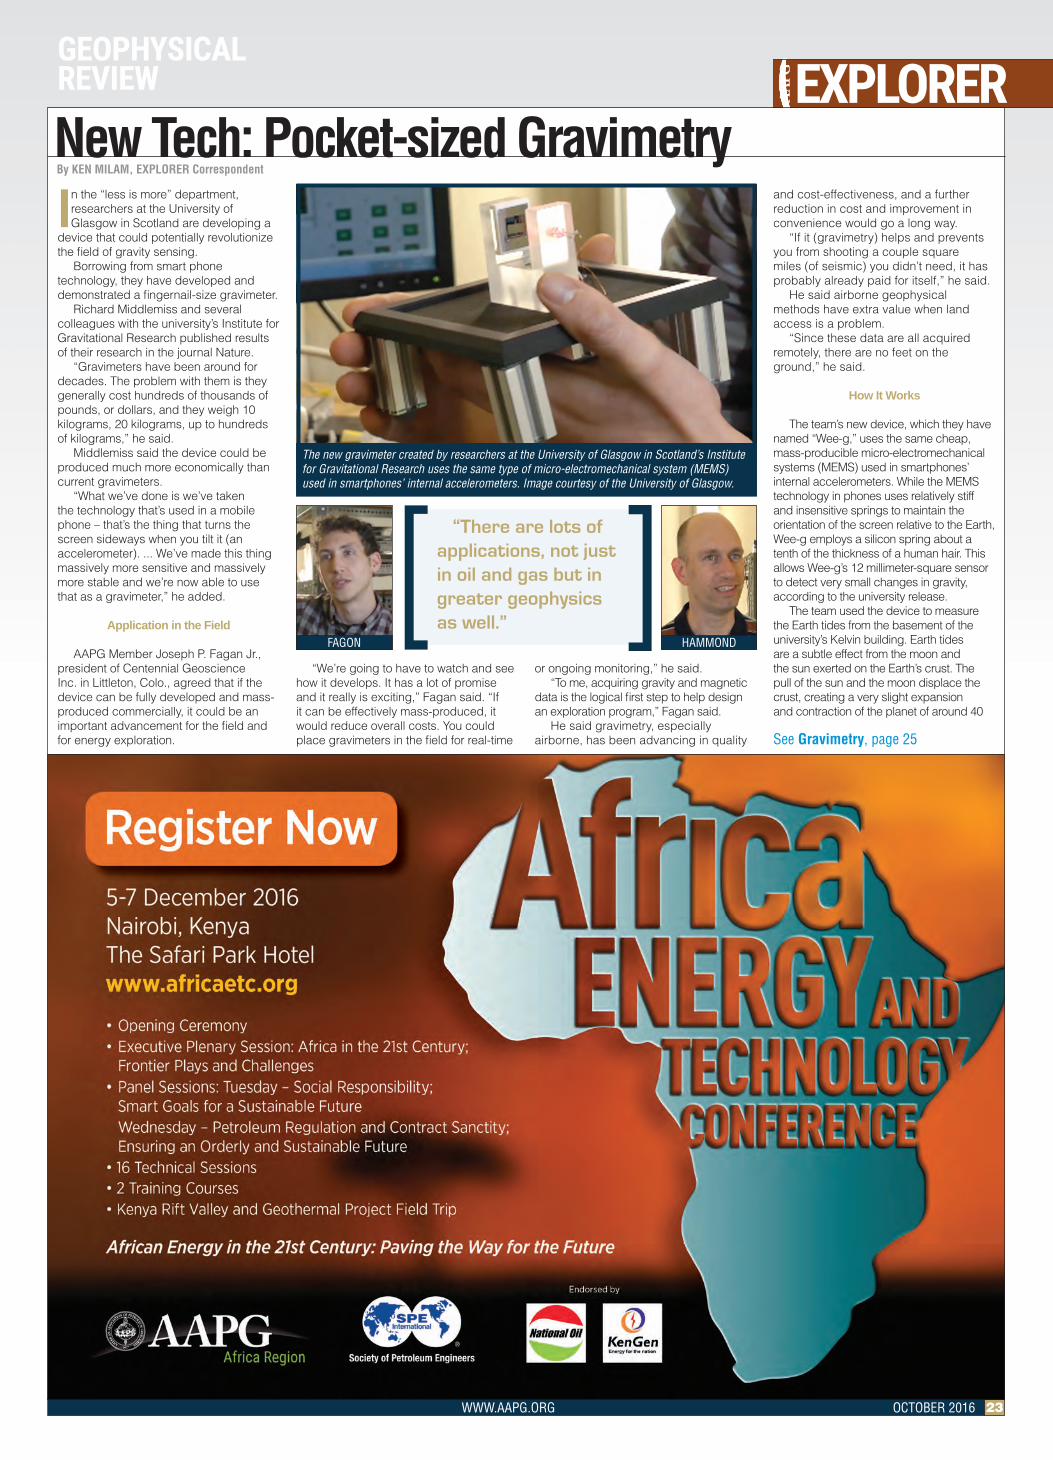
We start in figure 3 by plotting each set of lineaments against an R, G or B colorbar, setting the larger positive values to be opaque. Then in figure 4, we co-render
Interpreting Fault and Fracture Lineaments with Euler CurvatureBy SATINDER CHOPRA and KURT J. MARFURT
SATINDER
The level of detail seen on the composite display is much higher than what is seen on the equivalent coherence stratal display.
Figure 1 (left): Stratal display through a coherence volume at a level close to t=1600 milliseconds. Fault lineaments striking -30 degrees from north are indicated by red arrows. Another lineament striking approximately east-west is indicated by green arrows. Figure 2 (right): Stratal slices through long-wavelength Euler-curvature attribute volumes with strikes of: (a) ±90 degrees, (b) -30 degrees, and (c) +30 degrees as indicated by the insets. In essence, Euler curvature is an azimuthally filtered version of the most-positive and most-negative principal curvatures, accentuating faults and flexures along any desired strike direction. The subtle lineaments seen in (c) may correspond to splay faults or relay ramps controlled by the major faults shown in (b).
Figure 3 (left): The same stratal slices shown in the previous figure, but now plotted against green, red and blue color bars using opacity to enhance the most positive anticlinal features.Figure 4 (right): Co-rendering the three images of the anticlinal lineaments in figure 3 together using a modern 3-D viewer and thus generating a composite display amenable to extracting more detailed interaction between the three hypothesized fault sets.
MARFURT
The Geophysical Corner is a regular column in the EXPLORER, edited by Satinder Chopra, chief geophysicist for Arcis Seismic Solutions, TGS,
Calgary, Canada, and a past AAPG-SEG Joint Distinguished Lecturer.
See RGB, page 25
GEOPHYSICALCORNER
All images courtesy of Arcis Seismic Solutions, TGS, Calgary
23 WWW.AAPG.ORG OCTOBER 2016
EXPLORER
In the “less is more” department, researchers at the University of Glasgow in Scotland are developing a
device that could potentially revolutionize the field of gravity sensing.
Borrowing from smart phone technology, they have developed and demonstrated a fingernail-size gravimeter.
Richard Middlemiss and several colleagues with the university’s Institute for Gravitational Research published results of their research in the journal Nature.
“Gravimeters have been around for decades. The problem with them is they generally cost hundreds of thousands of pounds, or dollars, and they weigh 10 kilograms, 20 kilograms, up to hundreds of kilograms,” he said.
Middlemiss said the device could be produced much more economically than current gravimeters.
“What we’ve done is we’ve taken the technology that’s used in a mobile phone – that’s the thing that turns the screen sideways when you tilt it (an accelerometer). ... We’ve made this thing massively more sensitive and massively more stable and we’re now able to use that as a gravimeter,” he added.
Application in the Field
AAPG Member Joseph P. Fagan Jr., president of Centennial Geoscience Inc. in Littleton, Colo., agreed that if the device can be fully developed and mass-produced commercially, it could be an important advancement for the field and for energy exploration.
“We’re going to have to watch and see how it develops. It has a lot of promise and it really is exciting,” Fagan said. “If it can be effectively mass-produced, it would reduce overall costs. You could place gravimeters in the field for real-time
or ongoing monitoring,” he said.“To me, acquiring gravity and magnetic
data is the logical first step to help design an exploration program,” Fagan said.
He said gravimetry, especially airborne, has been advancing in quality
and cost-effectiveness, and a further reduction in cost and improvement in convenience would go a long way.
“If it (gravimetry) helps and prevents you from shooting a couple square miles (of seismic) you didn’t need, it has probably already paid for itself,” he said.
He said airborne geophysical methods have extra value when land access is a problem.
“Since these data are all acquired remotely, there are no feet on the ground,” he said.
How It Works
The team’s new device, which they have named “Wee-g,” uses the same cheap, mass-producible micro-electromechanical systems (MEMS) used in smartphones’ internal accelerometers. While the MEMS technology in phones uses relatively stiff and insensitive springs to maintain the orientation of the screen relative to the Earth, Wee-g employs a silicon spring about a tenth of the thickness of a human hair. This allows Wee-g’s 12 millimeter-square sensor to detect very small changes in gravity, according to the university release.
The team used the device to measure the Earth tides from the basement of the university’s Kelvin building. Earth tides are a subtle effect from the moon and the sun exerted on the Earth’s crust. The pull of the sun and the moon displace the crust, creating a very slight expansion and contraction of the planet of around 40
New Tech: Pocket-sized Gravimetry By KEN MILAM, EXPLORER Correspondent
The new gravimeter created by researchers at the University of Glasgow in Scotland’s Institute for Gravitational Research uses the same type of micro-electromechanical system (MEMS) used in smartphones’ internal accelerometers. Image courtesy of the University of Glasgow.
See Gravimetry, page 25
FAGON
“There are lots of applications, not just in oil and gas but in greater geophysics as well.”
HAMMOND
GEOPHYSICALREVIEW

25 WWW.AAPG.ORG OCTOBER 2016
EXPLORER
these three images by simply adding the R, G and B components of the images in figure 3. In this way each lineament is assigned a specific color, while areas of crossing lineaments combine to form intermediate colors using the well understood RGB color model.
This image provides a composite of all the lineament orientations and is very useful in terms of the more detail that it provides for interpretation.
Conclusions
The level of detail seen on the composite display is much higher
than what is seen on the equivalent coherence stratal display. We find merit in putting Euler curvature lineaments together in a 3-D viewer for their convenient interpretation.
The next step would be to calibrate these seismic attribute based lineaments with lineaments interpreted from image logs. One challenge for doing this is usually the scarcity of the latter data. We do emphasize the importance of image logs in such confirmatory exercises.
We appreciate the help extended by Thang Ha and Fangyu Li, students at the University of Oklahoma, in fixing the image shown in figure 4. EX
PLORER
(Editor’s note: Kurt Marfurt is an AAPG Member and professor of geophysics at the University of Oklahoma.)
RGB from page 22
Gravimetry from page 23
centimeters.“The Earth tides are a well-established
phenomenon, which we’re able to accurately predict using mathematical models,” said Giles Hammond of the university’s School of Physics and Astronomy, one of the co-authors of the paper.
“One of the factors which separates gravimeters from simple accelerometers is stability, allowing users to monitor variations in gravity over the course of several days or weeks. We used our Wee-g system to monitor the Earth tides under Glasgow over the course of several days, and our results aligned perfectly with the variations in gravity that the model had predicted,” Hammond continued.
“The significance of this is two-fold: firstly, we’ve shown that a MEMS device can maintain its stability over a long period of time, and secondly, that a device which could easily be built using existing mass-production technology can act as a very accurate gravimeter,” Hammond added.
“Wee-g opens up the possibility of making gravity measurement a much more realistic proposition for all kinds of industries,” said Middlemiss. “Gravity surveys for geophysical exploration could be carried out with drones instead of planes and networks of MEMS gravimeters could be placed around volcanoes to monitor the intrusion of magma that occurs before an eruption – acting as an early warning system.”
The detector, built at the university’s James Watt Nanofabrication Centre, is a collaboration between the School of Physics and Astronomy (Institute for Gravitational Research) and the School of Engineering (Electrical and Nanoscale). The work is one of the first research outcomes from QuantIC, the UK’s “centre of excellence for research, development and innovation in quantum enhanced imaging,” which was established in late 2014.
“What’s going on here is we’re taking our fundamental core research and we’re actually translating it into applications that can be taken up by industry,” said Hammond.
“In this particular application, the industries involved might be oil and gas prospecting, defense security or industries interested in environmental monitoring,” noted Hammond.
Fagan said he agreed the research is promising.
“There are lots of applications, not just in oil and gas but in greater geophysics as well,” he said. EX
PLORER
The Knowledge Management Challenge will be held Nov. 16-17 in Abu Dhabi, United Arab
Emirates. The event will highlight the best practices and lessons learned in the field of knowledge management.
Due to the imminent “Great Crew Change,” in which experienced professionals are expected to retire in large numbers over the next few years, knowledge management is a strong emphasis throughout the industry.
The main concern is that key knowledge could be lost during this change and that young professionals will be challenged to learn and advance faster than they’re ready, before they have the opportunity to fully absorb that crucial knowledge and experience.
The event will share current information about knowledge management, how to address the expected challenges, case studies from the region, justification of the impact of initiatives and new technologies that are expected to impact the field in the future.
Leading experts in the field will speak during the event and a forum will be held that will provide the opportunity for discussion to share ideas. Posters are welcome for display during the event and registration is now open at the website below.
For more information about the Knowledge Management Challenge, visit http://aapg.to/yw94l. EX
PLORER
Event to Address the ‘Great Crew Change’