geometallurgical model of a copper sulphide mine for long ... · geometallurgical model of a copper...
TRANSCRIPT

IntroductionGood investment decisions are based onreliable decision-making tools. In the geomet-allurgical field, decision-making tools arecommonly models designed to predict ore oroperational characteristics such as dilution,particle size, throughput, recovery, etc. Theresults lead to better design, investment, andoperational decisions. Geometallurgical modelscan generate the information necessary tomake better design evaluations in order tosupport business plans. The Batu Hijauthroughput model (Wirfiyata and McCaffery,2011) is a good example of how geometal-lurgical models can be applied to optimize theproduction plan and to improve the plantcircuit. The changes made led to a throughputrisk reduction of approximately 5%.
Geometallurgical models can be developedusing physical kinetic methods or statisticalmodels. An example of a physical kineticmodel is the geometallurgical modelling of theCollahuasi flotation circuit (Suazo et al.,2010), in which the flotation rate constant wasmodelled by using the collision-attachment-
detachment approach. The variables were gasdispersion properties, flotation feed particlesize distribution, and operational andequipment parameters. Another example of theuse of physical kinetic models to predictrecoveries in flotation is the calculation ofinduction times, i.e., the time required forthinning and rupture of the water film betweenparticles and bubbles (Danoucaras et al.,2013). Adopting the microkinetics modellingapproach and using induction time, it waspossible to obtain similar results to the actualrecovery of galena in four different sizeclasses.
Physical kinetic models are difficult toimplement and update timeously, and in suchcases statistical models can be developedbased upon different kinds of operational data,such as mineralogy, hardness, particle size,hydrodynamic characteristics, and alteration.Here, it is important to note that input datamay come from two sources: laboratory data orplant operational data. In the first case, thereare more uncertainties related to the scale-upprocess (Ralston et al., 2007) than foroperational-related data.
In the current study, Chuquicamata plantoperational data on mill feed grades, orehardness, particle size, mineralogy, pH, andreagents, representing several months ofoperation, was collected to predict recovery atthe plant.
As stated by Coward et al. (2009) thevariables that have the most impact on theprocesses of mining and treatment must beidentified to determine those that need to bemeasured. Geometallurgical models need to bewell specified. In the current study, a recent
Geometallurgical model of a coppersulphide mine for long-term planningby G. Compan*, E. Pizarro†, and A. Videla*
SynopsisOne of the main problems related to mining investment decisions is the useof accurate prediction models. Metallurgical recovery is a major source ofvariability, and in this regard, the Chuquicamata processing plant recoverywas modelled as a function of geomining-metallurgical data and orecharacteristics obtained from a historical database. In particular, the data-set gathered contains information related to feed grades, ore hardness,particle size, mineralogy, pH, and flotation reagents. A systemic approachwas applied to fit a multivariate regression model representing the copperrecovery in the plant. The systemic approach consists of an initialprojection of the characteristic grinding product size (P80), based uponenergy consumption at the particle size reduction step, followed by aflotation recovery model. The model allows for an improvement in theinvestment decision process by predicting performance and risk. The finalgeometallurgical model uses eight operational variables and is asignificant improvement over conventional prediction models. A validationwas performed using a recent data-set, and this showed a high correlationcoefficient with a low mean absolute error, which reveals that the geomet-allurgical model is able to predict, with acceptable accuracy, the actualcopper recovery in the plant.
Keywordsgeometallurgical modelling, multivariate regression, recovery prediction.
* Mining Engineering Department, PontificiaUniversidad Católica de Chile, Chile.
† Applied Technology Director, ChuquicamataUnderground Mining Project, CODELCO.
© The Southern African Institute of Mining andMetallurgy, 2015. ISSN 2225-6253. Paper receivedDec. 2014 and revised paper received Feb. 2015.
549The Journal of The Southern African Institute of Mining and Metallurgy VOLUME 115 JUNE 2015 ▲

Geometallurgical model of a copper sulphide mine for long-term planning
technique that allows selection of variables based on the F-test was used to select the best regression variables set. Theuse of a correct set of variables made it possible to formulatean accurate prediction using as little information as possible.As shown by Berry (2009), reliable geological data input andcorrect interpretation include two-thirds of all the problemsexperienced as a consequence of using geometallurgicalmodels.
Recovery is one of the most important variables for amining project, and defines the performance of the mineralconcentration process. In economic terms, the income of aconcentrator can be calculated in a simple form as follows:
E = P · g · T · R [1]
where P is the net price of the valuable metal, which isusually defined by the market; g is the ore feed grade, whichis defined as the result of the cut-off grade policy applied bythe mine plan; and T is the mill plant throughput, whichshould be fulfilled to achieve a fixed production capacity.Finally, the recovery is an intrinsic variable of the concen-tration process and it can be managed in long-term planningby operative decisions.
It is well known that accurate forecasting of recovery isimportant due to its significance for the economic viability ofa project and because it is a variable of major impact onprocessing plant results. A good recovery prediction modelmakes it possible to take mitigation and control actions toguarantee a minimum return on investment. Differentapproaches have been taken in modelling recovery. It iscommon to use variables related only to the flotation cell(Nakhaei et al., 2012; Danoucaras et al., 2013; Hatton andHatfield, 2012), although a systemic approach which islinked to grinding and flotation models could yield betterresults (Bulled and McInnes, 2005).
HypothesisThe aim of this study is to model ore recovery as a functionof operational data and ore characteristics obtained from anhistorical database at the Chuquicamata A2 plant with the
idea of contributing to long-term management decisions andplanning mitigation initiatives in the event of majordeviations in plant performance. The data-set gathered wasmodified using a multiplier factor for confidentialitypurposes.
In this study, a multivariate regression method wasapplied to develop a recovery model based on knownoperational variables.
A general form for a regression model is as follows:
[2]where yi is the variable to be modelled, βj is a set of constantparameters, and xij are the regressors or explanatoryvariables for j going from 0 to n. Each variable in the data-setwas normalized for easier interpretation of the constantparameters as shown in Equation [3]:
[3]
where xi represents the average of the variable along thehistorical set of data. Therefore, a higher constant value βjmeans higher significance of the variable xi in the regression.
Chuquicamata plant descriptionThe Chuquicamata copper mine is owned and operated byCODELCO, a Chilean state-owned company since 1976. It islocated in the northern part of Chile, near Calama, 215 kmnortheast of Antofagasta. Chuquicamata produces coppercathodes from concentrate obtained at three different plantfacilities named A0, A1, and A2, each with different processtechnologies, depending upon the time they were built. Asimplified process flow chart is shown in Figure 1
The A0 plant was built in 1952. It operates a conven-tional milling circuit designed to process 74 kt/d. It consistsof 13 grinding circuits in parallel, each having one rod mill(10×14 ft, 597 kW) and two ball mills (10×12 ft, 597 kW).The A1 mill was built in 1983. It is designed to process 38kt/d and operates three parallel grinding circuits, each having
▲
550 JUNE 2015 VOLUME 115 The Journal of The Southern African Institute of Mining and Metallurgy
Figure 1 – Chuquicamata plant flow sheet
one rod mill (13.5×18 ft, 1305 kW) and one ball mill(16.5×21 ft, 2610 kW). Finally, the A2 mill, built in 1989,operates two parallel SAG lines, each with one SAG mill(32×15 ft, 8203 kW) and two ball mills (18×26 ft, 3729 kW).Additionally, the A2 mill plant has another smaller grindingline with two ball mills (13×18 ft, 1305 kW).
Each grinding circuit is followed by a rougher frothflotation circuit. The rougher concentrate from the three millsgoes through a single cleaner, scavenger, re-cleaner, and re-scavenger circuit that produces a copper-molybdenumconcentrate. The concentrate is then transported to a selectivemolybdenum concentration plant, where separate copper andmolybdenum concentrates are ultimately obtained.
Plant operational data analysis The historical data-set contains information related to feedgrades, hardness, particle size, mineralogy, pH, and reagentdosages for froth flotation. The data-set consists of 29variables controlled daily between January and October 2013.Table I shows each variable under study.
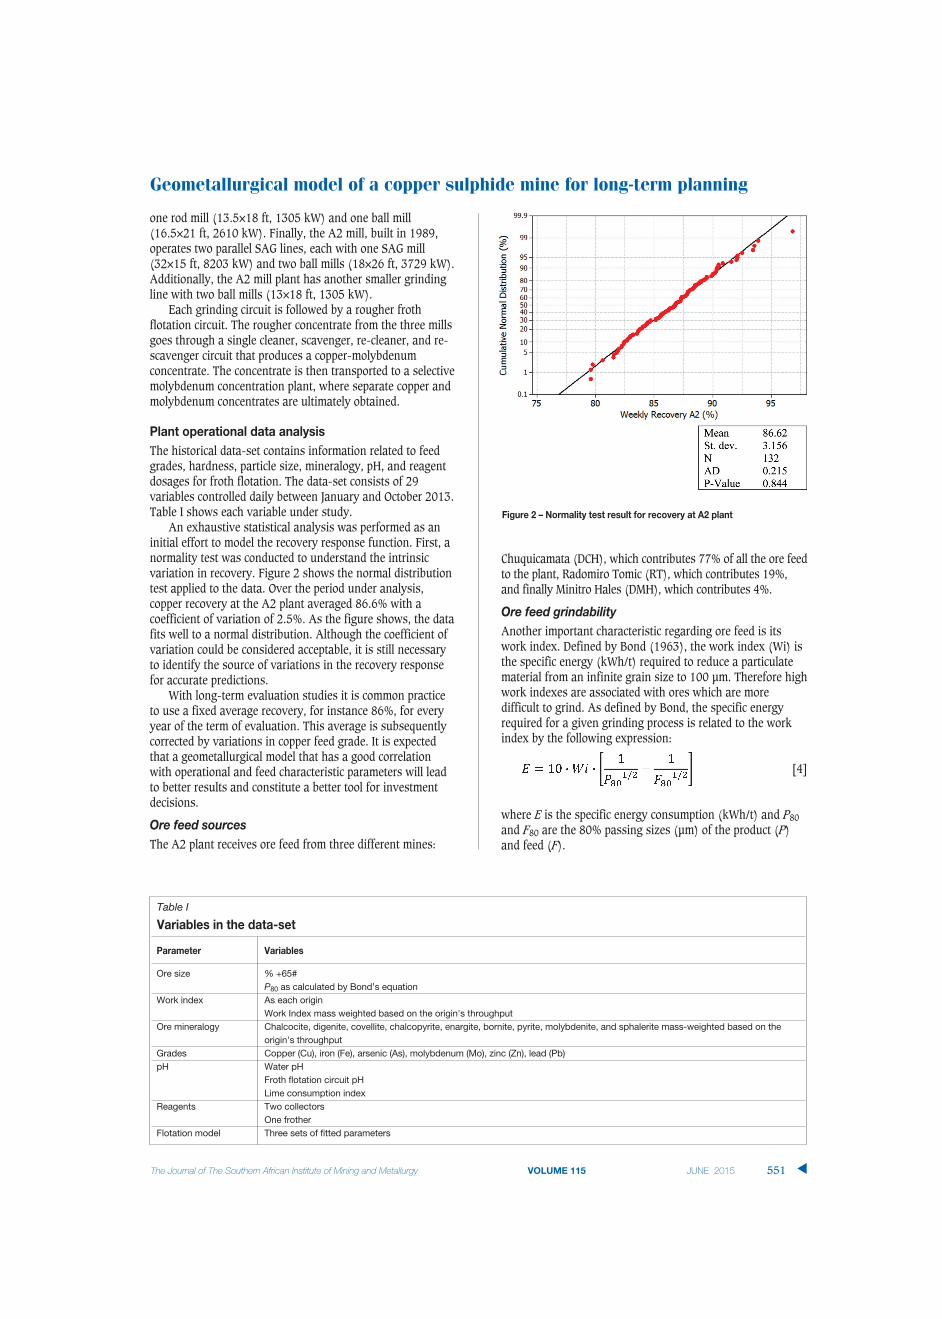
An exhaustive statistical analysis was performed as aninitial effort to model the recovery response function. First, anormality test was conducted to understand the intrinsicvariation in recovery. Figure 2 shows the normal distributiontest applied to the data. Over the period under analysis,copper recovery at the A2 plant averaged 86.6% with acoefficient of variation of 2.5%. As the figure shows, the datafits well to a normal distribution. Although the coefficient ofvariation could be considered acceptable, it is still necessaryto identify the source of variations in the recovery responsefor accurate predictions.
With long-term evaluation studies it is common practiceto use a fixed average recovery, for instance 86%, for everyyear of the term of evaluation. This average is subsequentlycorrected by variations in copper feed grade. It is expectedthat a geometallurgical model that has a good correlationwith operational and feed characteristic parameters will leadto better results and constitute a better tool for investmentdecisions.
Ore feed sourcesThe A2 plant receives ore feed from three different mines:
Chuquicamata (DCH), which contributes 77% of all the ore feedto the plant, Radomiro Tomic (RT), which contributes 19%,and finally Minitro Hales (DMH), which contributes 4%.
Ore feed grindability Another important characteristic regarding ore feed is itswork index. Defined by Bond (1963), the work index (Wi) isthe specific energy (kWh/t) required to reduce a particulatematerial from an infinite grain size to 100 μm. Therefore highwork indexes are associated with ores which are moredifficult to grind. As defined by Bond, the specific energyrequired for a given grinding process is related to the workindex by the following expression:
[4]
where E is the specific energy consumption (kWh/t) and P80and F80 are the 80% passing sizes (μm) of the product (P)and feed (F).
Geometallurgical model of a copper sulphide mine for long-term planning
551The Journal of The Southern African Institute of Mining and Metallurgy VOLUME 115 JUNE 2015 ▲
Table I
Variables in the data-set
Parameter Variables
Ore size % +65#
P80 as calculated by Bond’s equation
Work index As each origin
Work Index mass weighted based on the origin's throughput
Ore mineralogy Chalcocite, digenite, covellite, chalcopyrite, enargite, bornite, pyrite, molybdenite, and sphalerite mass-weighted based on the
origin's throughput
Grades Copper (Cu), iron (Fe), arsenic (As), molybdenum (Mo), zinc (Zn), lead (Pb)
pH Water pH
Froth flotation circuit pH
Lime consumption index
Reagents Two collectors
One frother
Flotation model Three sets of fitted parameters
Figure 2 – Normality test result for recovery at A2 plant

Geometallurgical model of a copper sulphide mine for long-term planning
An analysis of the data-set revealed that the work indexat the DCH mine is greater than that observed at RT andDMH. The DCH ore has an average work index of 14.3kWh/t, whereas the work indexes for the RT and DMH oresare 12.8 kWh/t and 12.5 kWh/t respectively. Thesedifferences indicate, as result of applying Equation [4], that itwould not be possible to achieve the same throughput for thesame P80 for the different ores from DCH, DMH, and RT. Infact, an increment in the proportion of DCH ore feed will leadto an increment in the grinding product size P80.
Ore feed mineralogyThe mineralogy of the ore feed differs depending on itsorigin. The main mineral species in the mill feed werechalcocite (Cu2S), digenite (Cu9S5), covellite (CuS),chalcopyrite (CuFeS2), enargite (Cu3AsS4), bornite (Cu5FeS4),pyrite (FeS2), molybdenite (MoS2) and sphalerite (ZnS).Copper feed grades were measured by atomic absorptionanalysis. Each feed sample was assayed for copper (Cu), iron(Fe), arsenic (As), molybdenum (Mo), zinc (Zn), and lead(Pb). Results are summarized in Table II and Table III.
As can be seen, chalcopyrite and pyrite are the mostimportant species in the DCH feed ore. The presence of pyritecould cause recovery problems, because pyrite competes withchalcopyrite for recovery by the collector during frothflotation. Chalcocite is an important species in the RT andDMH ores, and enargite is also significant in the DMH ore.
Table III shows the distribution of feed grades. As shown,the copper grade in the DMH ore is significantly higher thanin the DCH and RT ores. Another important difference is the
arsenic grade, which is very high in the DMH ore, 100 ppmon average, or more than 30 times that in the RT ore andthree times higher than in the DCH ore. The most importantissues concerning arsenic are the smelting penalties incurredand the environmental issues, given that arsenic is adangerous contaminant and must be disposed of properly.
Predicting recovery in long-term mine plans with oreblends from several sources is a complex task, usuallyleading to non-linear behaviour. Because of this, a geometal-lurgical model can be a useful tool for planning purposes ifinteractions, both positive and negative, between variablesare well captured and nonlinear relationships are recognizedat an early stage.
The systemic approachA systemic approach was applied to develop a multivariateregression model representing the copper recovery in theChuquicamata plant. The systemic approach consisted ofreducing all unit operations to a two-step sequential process,grinding and concentration (Figure 4). In this study, aprojection of the average P80 has been done based upon energyconsumption in the grinding step, and the resulting particlefeed size is the input for the froth flotation recovery model.
Geometallurgical multivariate regression modelAs stated previously, the aim of this study is to generate ageometallurgical model for copper recovery in the A2 plant.The data-set collected from Chuquicamata was used toestablish a relationship between the most significantvariables controlling the operational performance of the plant.
▲
552 JUNE 2015 VOLUME 115 The Journal of The Southern African Institute of Mining and Metallurgy
Table III
Feed grades according to source
DCH RT DMH
Average in feed Coeff. var. (%) Average in feed Coeff. var. (%) Average in feed Coeff. var. (%)
Cu (%) 0.87 16.65 0.68 7.98 1.88 13.82
Fe (%) 2.16 45.20 1.09 15.90 2.39 17.63
As (ppm) 28.20 50.76 3.13 5.06 100.46 30.78
Mo (ppm) 32.90 19.76 10.24 28.33 10.37 95.02
Zn (ppm) 48.19 45.33 11.69 10.97 63.74 50.98
Pb (ppm) 8.92 38.38 1.41 61.15 36.43 22.31
Table II
Mineralogy of feed according to source
DCH RT DMH
Copper content Average in feed Coeff. var. Average in feed Coeff. var. Average in feed Coeff. var. (%) (%) (%) (%) (%) (%) (%)
Chalcocite 79.85 0.12 45 0.54 25 0.72 47
Digenite 78 0.19 15 0.00 316 0.01 181
Covellite 66.5 0.21 19 0.12 45 0.02 101
Chalcopyrite 34.65 0.62 18 0.26 23 0.12 61
Enargite 48.4 0.09 69 0.00 316 0.69 76
Bornite 63.3 0.15 24 0.14 70 0.07 117
Pyrite 0 0.78 16 0.26 30 1.41 29
Molybdenite 0 0.05 21 - - - -
Sphalerite 0 0.06 55 - - - -
Others - 97.74 - 98.67 - 96.96 -

The main variables controlling copper recovery wereselected using a technique based on the Fisher test (F-test).This approach is different from other commonly-usedtechniques based on simple correlations between variablesand redundancy (Boisvert et al., 2013). The method consistsof adding or removing variables from the model, andcalculating iteratively an F-statistic and p-value for eachvariable in the model. The p-value is the probability ofobtaining a test statistic result at least as extreme or as closeto the one that was actually observed, assuming that the nullhypothesis is true. If the model contains j variables, then forany variable Xr the F-statistic is defined as follows:
[5]
where n is the number of observations, SSE(j−Xr) is thesquared error for the model that does not contain Xr, SSEj isthe squared error, and MSEj is the mean squared error for themodel that contains Xr.
If the p-value calculated for any variable in the model isgreater than a defined significance level (α), then the variableis removed. After that, if there are no more variables with ap-value to be removed, the method continues trying to add avariable on the basis of its F-statistic and p-value. If the p-value corresponding to the F-statistic for any variable not inthe model is smaller than a significance value α, then thevariable is added. The entire process is then repeated in aniterative procedure. The method ends when there are no morevariables to be removed or added (Montgomery and Runger,2002).
Analysis of variables used in the regression data-setChuquicamata has historically used a method to projectrecovery as a relationship between recovery and copper feedgrade as described by the following equation:
[6]
where K is the recovery obtained at infinite residence time inthe flotation circuit, T is a constant parameter, and θ is thecopper grade in the tailings. Using a regression technique, theequation can be fitted to the historical data. Results areshown in Table IV.
This model has a small statistical significance, with an R2
of only 7.11% over the historical database under analysis,which indicates a poor copper recovery prediction.
In order to develop a model for the recovery in the A2plant, the previously mentioned variable selectionmethodology was applied to the overall data-set. Results ofthe variable selection method for the data-set collected areshown in Table V.
Column 2 of Table V shows the correlation constant βj ofeach component. The laboratory flotation model representsthe application of Equation [6], Wi DMH is the work index ofthe DMH mill feed ore, constant is β0 in the model as definedin Equation [2], Cp is the chalcopyrite grade of the ore feed,P80 is the mill plant product size, Fe is the iron grade of themill feed, Dg is the digenite, CuS is the soluble gopper grade,and Mo is the molybdenite present in the ore feed.
This regression model (Table V) achieves a coefficient ofdetermination (R2) of 56.6%. Although these resultsrepresent a significant improvement with respect to thestandard method, they were not completely satisfactory,therefore a second-degree polynomial fit was attempted byadding second-degree terms for each of the variables. The
Geometallurgical model of a copper sulphide mine for long-term planning
The Journal of The Southern African Institute of Mining and Metallurgy VOLUME 115 JUNE 2015 553 ▲
Figure 3 – The systemic approach sequence
Table V
First regression model results
Variable Constant P-value
Lab. flotation model 123 0.000
Wi DMH -28 0.051
Constant -13.24
Cp 6.5 0.000
P80 6.5 0.143
Fe -4.1 0.007
Dg -2.82 0.004
CuS -2.76 0.000
Mo 1.37 0.027
Table IV
Parameters for copper recovery prediction modelas described by Equation [6]
K 87.694
θ 0.216
T 0.108

Geometallurgical model of a copper sulphide mine for long-term planning
final set of variables selected for the model were iron (Fe)and copper sulphide (CuS) feed grades, molybdenite (Mo),chalcopyrite (Cp), digenite (Dg) grades, the work index of theore from DMH (WiDMH), and product size (P80). Table VIshows the coefficients for this new regression model.
The final model has a correlation coefficient of 75.6% andcoefficient of determination (R2) of 57.2%. Table VII shows asummary of the statistics for the model.
Results and discussionThe final response function for copper recovery, based on theavailable information collected in the A2 mill plant, is asfollows:
[7]
Figure 4 shows a Q-Q plot of the measured copperrecovery vs the predicted recovery during the period underanalysis. The confidence interval is 97.5%. The actualhistorical recovery is compared with the fitted model in Figure 5.
The statistical analysis shows that recovery is moresensitive for specific variables. These variables are copperfeed grade (Cu), iron feed grade (Fe), and the work index ofthe DMH ore. This implies that for long-term projections,better control over these variables will have a beneficialimpact on the recovery projections and control variability.
Each variable in the model has a constant coefficient thatshows its impact on the copper recovery projection. Asexpected, the significant plant variables affect the recovery inthe same way that empirical evidence does. Four variablesbehave as expected: copper, chalcopyrite, the work index ofDMH, and soluble copper. The first two have a positiveimpact. As empirical evidence shows, when copper grade
▲
554 JUNE 2015 VOLUME 115 The Journal of The Southern African Institute of Mining and Metallurgy
Table VII
Final model statisticsCorrelation coefficient 75.61%
Coefficient of determination (R2) 57.17%
Adjusted R2 52.64%
Standard error 3.25
Mean absolute error 2.43%
Table VI
Final regression model results
Variable Constant P-value
Lab. flotation model 356.286 0.000
Constant -264.744 0.002
(WiDMH)2 -15.008 0.035
Fe 12.244 0.287
Fe2 -6.699 0.165
P802 4.036 0.098
Cp2 2.937 0.000
CuS -2.876 0.000
Dg2 -0.923 0.033
Mo2 0.599 0.028
Figure 4 – Q-Q plot for real copper recovery vs fitted model
Figure 5 – Historical series for real copper recovery vs fitted model

increases, copper recovery also increases. The presence ofchalcopyrite has the same effect as copper grade, because inporphyry copper deposits such as DCH, RT, and DMH,chalcopyrite is one of the minerals that increases the coppergrade of the ore. On the other hand, the work index of the orefrom DMH mine and soluble copper both have a negative, orinverse, impact on copper recovery. The work index affectsthe liberation, so when the work index increases it becomesmore difficult to liberate copper-bearing minerals from theore, therefore recovery decreases. Soluble copper grade hasan expected adverse effect on flotation recovery, becausesoluble copper ore does not float under sulphide copperflotation conditions.
There are two variables which have unexpectedbehaviour: P80 and digenite. P80 has a positive impact on theestimated recovery, and digenite a negative one. Bothbehaviours are the opposite to what is expected from theempirical evidence. It is known that when P80 increasescopper liberation decreases, therefore recovery shoulddecrease. The model shows the opposite behaviour, whichcould imply that the mill plant operates at the lower boundaryof optimal grinding size. Digenite also has an unexpectedimpact on copper recovery, and further investigation of thisphenomenon is needed.
In addition there is one variable, Fe, which is presented inthe regression model in first and second degrees. Thisvariable has the expected overall effect of reducing coppergrade recovery when Fe is increased in the ore feed.
The final model shows a great advantage compared withusing an average fixed value to project recovery in medium-and long-term studies with a variable ore feed. If a fixedvalue of 86% for recovery were used to predict copperrecovery in the period under analysis, as shown in Figure 6,the mean absolute error would have been 3.9%. The finalmodel gives a mean absolute error in the same period of only2.4%, which represents a significant 1.5% improvement inrecovery.
ValidationThe recovery regression model was validated using monthlyplant data between January and July 2014. The modelprediction shows a correlation coefficient of 89.7% and amean absolute error of 2.75%. Results of the validation areshown in Table VIII and Figure 7.
The low mean absolute error and high correlationcoefficient obtained indicate that the developed model is ableto predict, within an acceptable range, the real copperrecovery in the plant.
The developed geometallurgical model is a significantimprovement compared to the current fixed value used forcopper recovery. Also, the regression equation shows that itis able to capture with confidence any variation in the feedore characteristics.
ConclusionsThe results presented show that is possible to improve, withan acceptable certainty, recovery estimations for a concen-tration process based on operating and ore characteristicsdata. The database used included information relating to feedgrades, ore hardness, particle size, mineralogy, pH, andreagent mix for froth flotation. The final regression modelused only copper, iron, and soluble copper feed grades,molybdenite, chalcopyrite, digenite, the work index of the orefrom DMH, and P80.
Geometallurgical model of a copper sulphide mine for long-term planning
The Journal of The Southern African Institute of Mining and Metallurgy VOLUME 115 JUNE 2015 555 ▲
Table VIII
Validation statisticsCorrelation coefficient 89.73%
Coefficient of determination (R2) 80.51%
Standard error 0.29
Mean absolute error 2.75%
Figure 6 – Historical series for real copper recovery and average fixed value

Geometallurgical model of a copper sulphide mine for long-term planning
A methodology based on a systemic approach and anadequate selection of variables was used to adjust amultivariate regression model that represented the copperrecovery. The best model found used 8 out of 32 variablescollected in the database. The model fit achieved a correlationcoefficient of 75.6% with a mean absolute error of 2.4%,which is acceptable for medium-term projections purposes.
Model validation was performed for the developedregression model. Results show a correlation coefficient of89.7% and a mean absolute error of 2.75% between the realobservations and the predicted values. These high correlationand low error values indicate that the model has the ability topredict recovery variability with an acceptable confidence,which shows the model is an improvement compared to theuse of a fixed value. This improved forecasting capacityassists investment decisions and would allow optimization ofproduction plans, due to its ability to identify low- and high-risk options. The usefulness of these improvements inforecasting capacities, evaluating risks, and defining riskvalues for mitigation control will be the focus of aforthcoming study.
The model variables impact the recovery as expected, withthe exception of P80 and digenite. Further study is needed toelucidate the unexpected behaviour of these variables onrecovery.
References
BERRY, M. 2009. Better decision-making from mine to market by betterassessment of geological uncertainty. AusIMM Project EvaluationConference, Melbourne, Vic., 21-22 April 2009. Publication Series no3/2009. Australasian Institute of Mining and Metallurgy, Carlton,Australia. pp. 15–19.
BOISVERT, J., ROSSI, M., and EHRIG, K. 2013. Geometallurgical modeling atOlympic Dam Mine, South Australia. Mathematical Geosciences, vol. 45.pp. 901–925.
BOND, F.C. 1963. Metal wear in crushing and grinding. 54th Annual Meeting ofthe American Institute of Chemical Engineers, Houston, TX. AIChE, NewYork.
BULLED, D. and MCINNES, C. 2005. Flotation plant design and productionplanning through geometallurgical modelling. Centenary of FlotationSymposium, Brisbane. Australasian Institute of Mining and Metallurgy.pp. 809–814.
COWARD, S., VAAN, J., DUNHAM, S., and STEWART, M. 2009. The primary-responseframework for geometallurgical variables. Seventh International MiningGeology Conference, Perth: Australia. Australasian Institute of Mining andMetallurgy. pp. 109–113.
DANOUCARAS, A.N., VIANNA, S.M., and NGUYEN, A.V. 2013. A modeling approachusing back-calculated induction times to predict recoveries in flotation.International Journal of Mineral Processing, vol. 124. pp. 102–108.
HATTON, D.R. and HATFIELD, D.P. 2012. A probabilistic equation for flotationsimulation. Minerals Engineering, vol. 36–38. pp. 300–302.
MONTGOMERY, D.C. and RUNGER, G.C. 2002. Multiple linear regression. AppliedStatistics and Probability for Engineers. Wiley, New York. pp. 411–467.
NAKHAEI, F., MOSAVI, M.R., SAM, A., and VAGHEI, Y. 2012. Recovery and gradeaccurate prediction of pilot plant flotation column concentrate: neuralnetwork and statistical techniques. International Journal of MineralProcessing, vol. 110–111. pp. 140–154.
RALSTON, J., FORNASIERO, D., GRANO, S., DUAN, J., and AKROYD, T. 2007. Reducinguncertainty in mineral flotation – flotation rate constant prediction forparticles in an operating plant ore. Mineral Processing, vol. 84. pp. 89–98.
SUAZO, C.J., KRACHT, W., and ALRUIZ, O.M. 2010. Geometallurgical modelling ofthe Collahuasi flotation circuit. Minerals Engineering, vol. 23, no. 2. pp. 137–142.
WIRFIYATA, F. and MCCAFFERY, K. 2011. Applied geo-metallurgical characteri-sation for life of mine throughput prediction at Batu Hijau. FifthInternational Conference on Autogenous and Semiautogenous GrindingTechnology, Vancouver, Canada, 25–29 September 2011. CanadianInstitute of Mining, Metallurgy and Petroleum. ◆
▲
556 JUNE 2015 VOLUME 115 The Journal of The Southern African Institute of Mining and Metallurgy
Figure 7 – Validation results for the developed model