geology & geophysics in oil exploration
DESCRIPTION
TRANSCRIPT
2010
Mahmoud Sroor
Geology & Geophysics in Oil Exploration
Geology & Geophysics in Oil Exploration
2 Geology & Geophysics in Oil Exploration Mahmoud Sroor
Contents
Introduction………………………………………………………..3
Chapter 1: Sedimentary Rocks …………………………………....4
Chapter 2: Depositional Environments ……………………………14
Chapter 3: Structural Geology …………………………………….18
Chapter 4: Petroleum Geology …………………………………....27
Chapter 5: Seismic Survey …………………………………….….32
Chapter 6: Seismic Data Processing ………………………………38
Chapter 7: Seismic Data Interpretation ……………………………45
Chapter 8: Well Logging & Mud Logging ………………………..53
By:
Geophysicist: Mahmoud Ahmed Sroor Mob: 002-0129990480
E‐mail: [email protected]
Geology & Geophysics in Oil Exploration
3 Geology & Geophysics in Oil Exploration Mahmoud Sroor
Introduction
Contouring: Process at which we make matching between points which have the same values on map to estimate certain feature (ex: thickness, Depth)
Gridding: Process at which we divide area into smaller cells (Software is doing grid to make a contour)
Grid Cell: The smallest unit in the grid with certain dimension
Cell dimension: The dimension of the cell in the grid
Grid dimension: Dimension which bound the grid
Gridding Algorithm: Mathematical method done by software used to calculate values of the grids (ex: Triangle method)
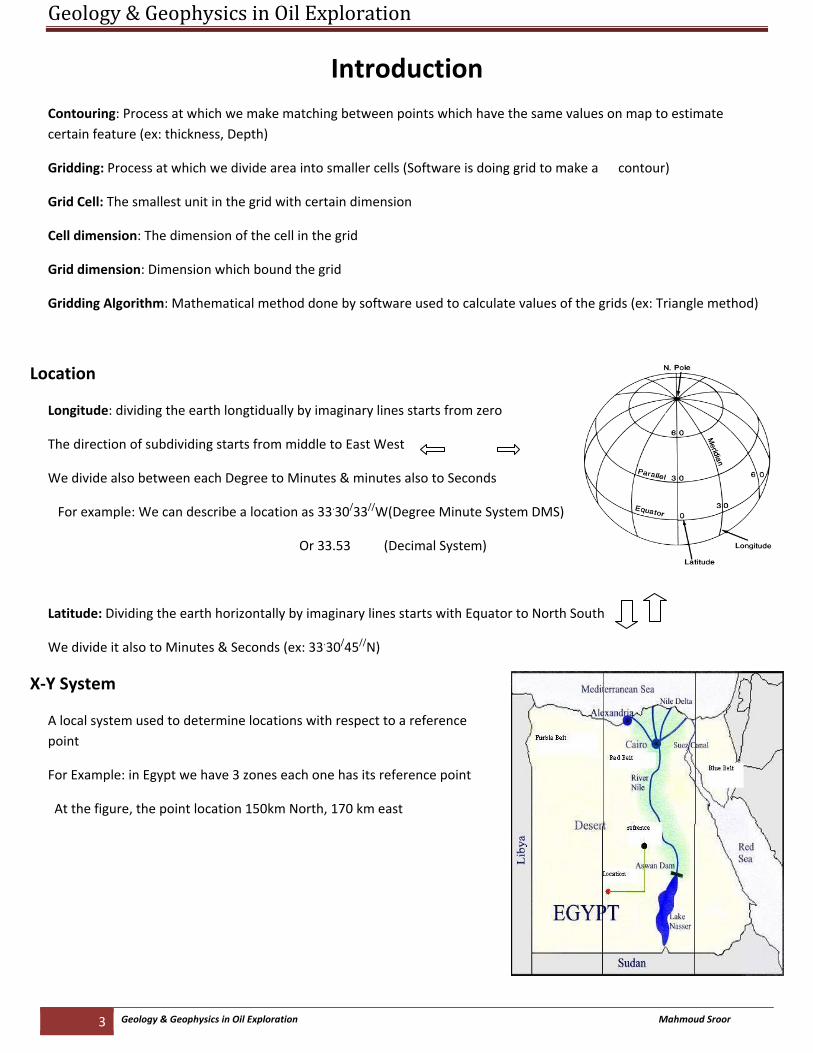
Location
Longitude: dividing the earth longtidually by imaginary lines starts from zero
The direction of subdividing starts from middle to East West
We divide also between each Degree to Minutes & minutes also to Seconds
For example: We can describe a location as 33.30/33//W(Degree Minute System DMS)
Or 33.53 (Decimal System)
Latitude: Dividing the earth horizontally by imaginary lines starts with Equator to North South
We divide it also to Minutes & Seconds (ex: 33.30/45//N)
X‐Y System
A local system used to determine locations with respect to a reference point
For Example: in Egypt we have 3 zones each one has its reference point
At the figure, the point location 150km North, 170 km east
Geology & Geophysics in Oil Exploration
4 Geology & Geophysics in Oil Exploration Mahmoud Sroor
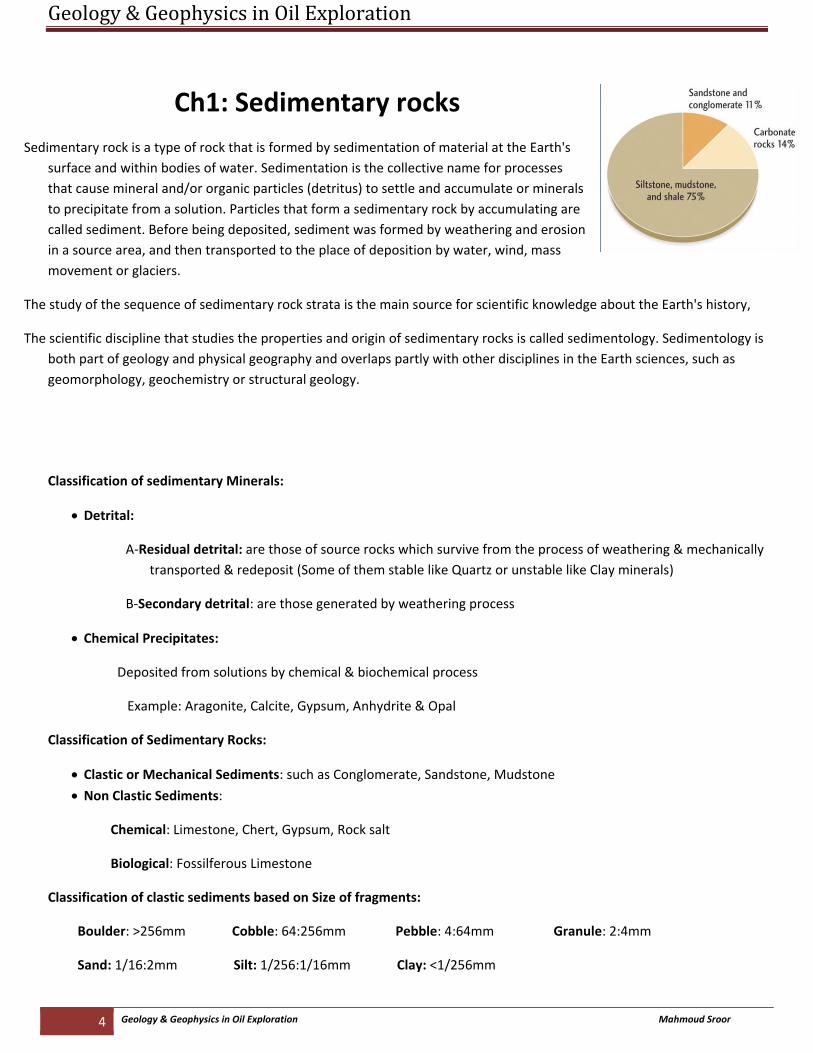
Ch1: Sedimentary rocks Sedimentary rock is a type of rock that is formed by sedimentation of material at the Earth's
surface and within bodies of water. Sedimentation is the collective name for processes that cause mineral and/or organic particles (detritus) to settle and accumulate or minerals to precipitate from a solution. Particles that form a sedimentary rock by accumulating are called sediment. Before being deposited, sediment was formed by weathering and erosion in a source area, and then transported to the place of deposition by water, wind, mass movement or glaciers.
The study of the sequence of sedimentary rock strata is the main source for scientific knowledge about the Earth's history,
The scientific discipline that studies the properties and origin of sedimentary rocks is called sedimentology. Sedimentology is both part of geology and physical geography and overlaps partly with other disciplines in the Earth sciences, such as geomorphology, geochemistry or structural geology.
Classification of sedimentary Minerals:
• Detrital:
A‐Residual detrital: are those of source rocks which survive from the process of weathering & mechanically transported & redeposit (Some of them stable like Quartz or unstable like Clay minerals)
B‐Secondary detrital: are those generated by weathering process
• Chemical Precipitates:
Deposited from solutions by chemical & biochemical process
Example: Aragonite, Calcite, Gypsum, Anhydrite & Opal
Classification of Sedimentary Rocks:
• Clastic or Mechanical Sediments: such as Conglomerate, Sandstone, Mudstone
• Non Clastic Sediments:
Chemical: Limestone, Chert, Gypsum, Rock salt
Biological: Fossilferous Limestone
Classification of clastic sediments based on Size of fragments:
Boulder: >256mm Cobble: 64:256mm Pebble: 4:64mm Granule: 2:4mm
Sand: 1/16:2mm Silt: 1/256:1/16mm Clay: <1/256mm
Geology & Geophysics in Oil Exploration
5 Geology & Geophysics in Oil Exploration Mahmoud Sroor
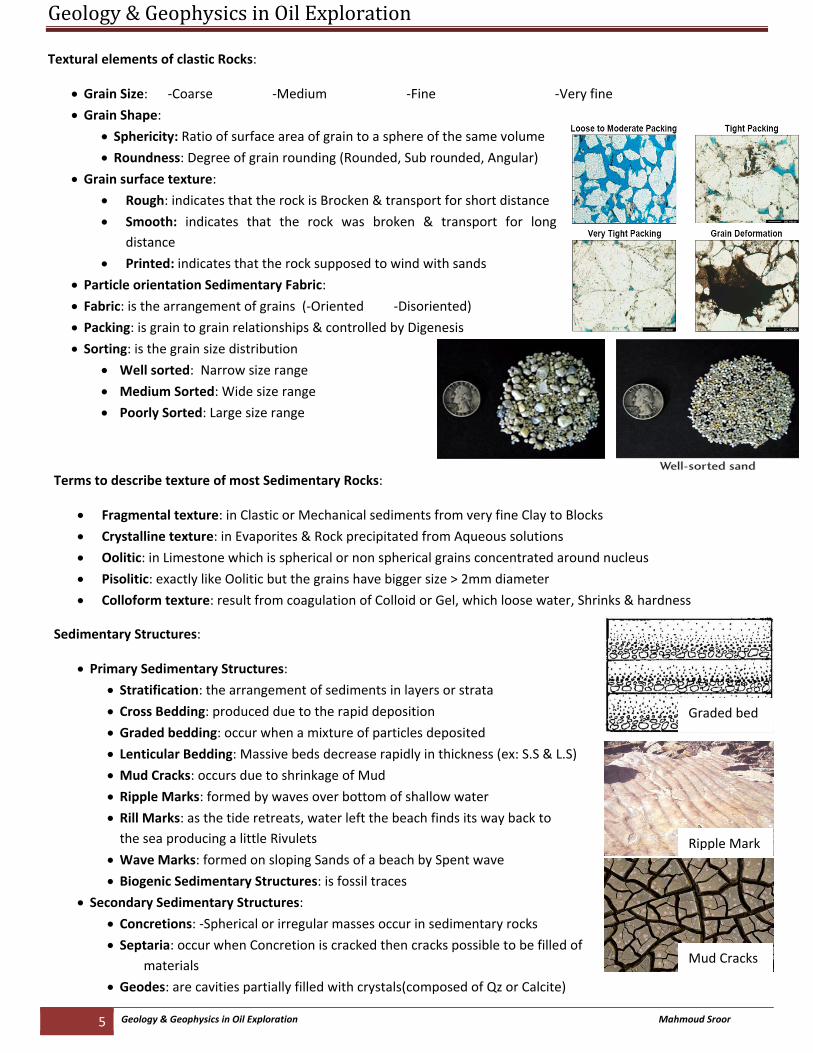
Textural elements of clastic Rocks:
• Grain Size: ‐Coarse ‐Medium ‐Fine ‐Very fine
• Grain Shape: • Sphericity: Ratio of surface area of grain to a sphere of the same volume
• Roundness: Degree of grain rounding (Rounded, Sub rounded, Angular) • Grain surface texture:
• Rough: indicates that the rock is Brocken & transport for short distance
• Smooth: indicates that the rock was broken & transport for long distance
• Printed: indicates that the rock supposed to wind with sands
• Particle orientation Sedimentary Fabric:
• Fabric: is the arrangement of grains (‐Oriented ‐Disoriented)
• Packing: is grain to grain relationships & controlled by Digenesis • Sorting: is the grain size distribution
• Well sorted: Narrow size range
• Medium Sorted: Wide size range
• Poorly Sorted: Large size range
Terms to describe texture of most Sedimentary Rocks:
• Fragmental texture: in Clastic or Mechanical sediments from very fine Clay to Blocks
• Crystalline texture: in Evaporites & Rock precipitated from Aqueous solutions
• Oolitic: in Limestone which is spherical or non spherical grains concentrated around nucleus
• Pisolitic: exactly like Oolitic but the grains have bigger size > 2mm diameter
• Colloform texture: result from coagulation of Colloid or Gel, which loose water, Shrinks & hardness
Sedimentary Structures:
• Primary Sedimentary Structures:
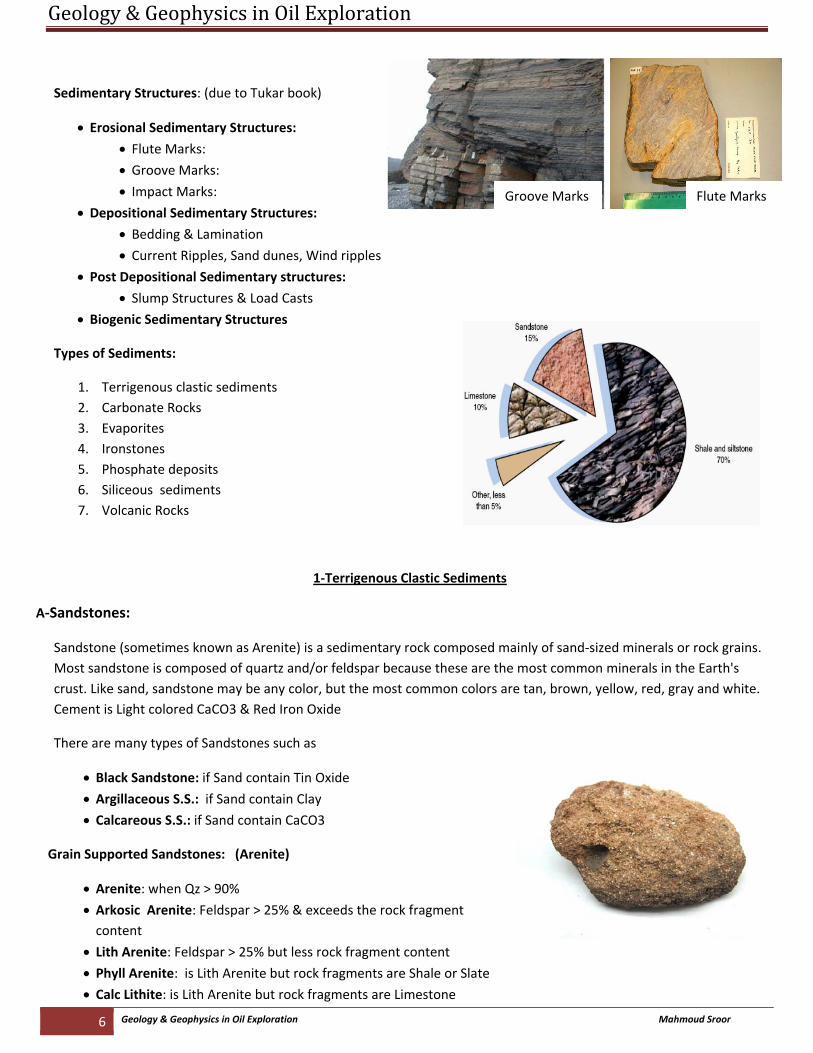
• Stratification: the arrangement of sediments in layers or strata
• Cross Bedding: produced due to the rapid deposition • Graded bedding: occur when a mixture of particles deposited
• Lenticular Bedding: Massive beds decrease rapidly in thickness (ex: S.S & L.S)
• Mud Cracks: occurs due to shrinkage of Mud
• Ripple Marks: formed by waves over bottom of shallow water
• Rill Marks: as the tide retreats, water left the beach finds its way back to the sea producing a little Rivulets
• Wave Marks: formed on sloping Sands of a beach by Spent wave
• Biogenic Sedimentary Structures: is fossil traces
• Secondary Sedimentary Structures:
• Concretions: ‐Spherical or irregular masses occur in sedimentary rocks
• Septaria: occur when Concretion is cracked then cracks possible to be filled of materials
• Geodes: are cavities partially filled with crystals(composed of Qz or Calcite)
Mud Cracks
Graded bed
Ripple Mark
Geology & Geophysics in Oil Exploration
6 Geology & Geophysics in Oil Exploration Mahmoud Sroor
Sedimentary Structures: (due to Tukar book)
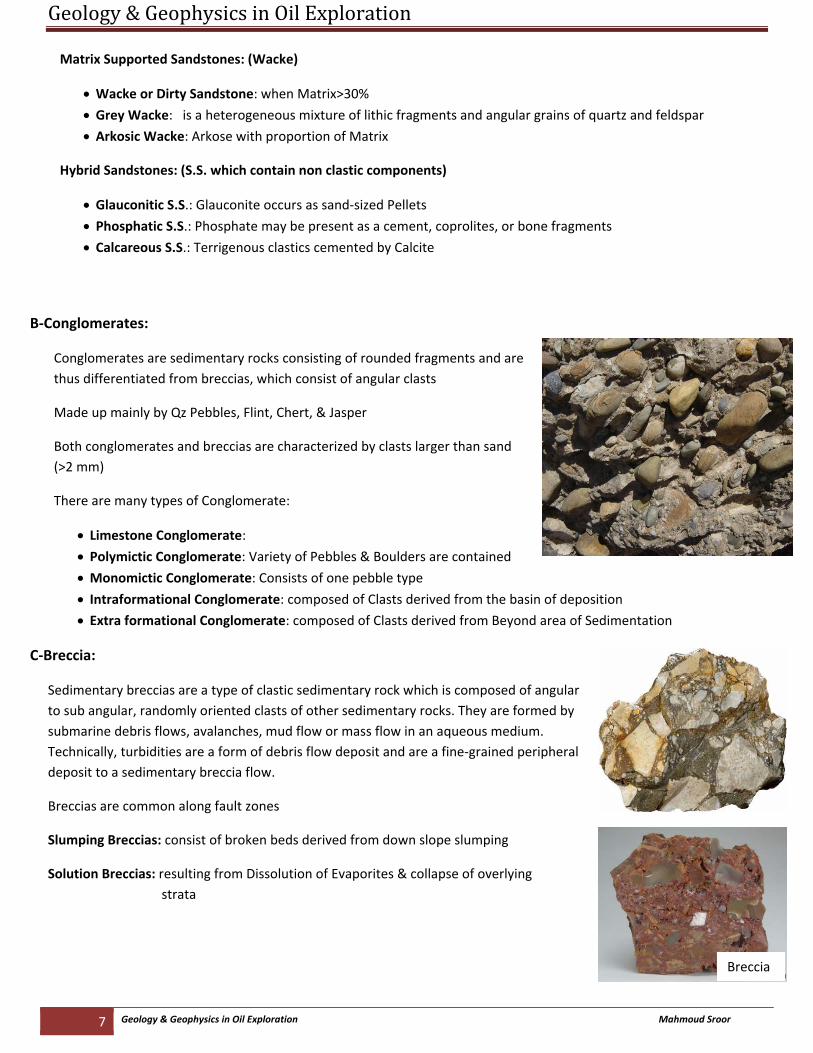
• Erosional Sedimentary Structures:
• Flute Marks:
• Groove Marks:
• Impact Marks:
• Depositional Sedimentary Structures:
• Bedding & Lamination
• Current Ripples, Sand dunes, Wind ripples
• Post Depositional Sedimentary structures:
• Slump Structures & Load Casts
• Biogenic Sedimentary Structures
Types of Sediments:
1. Terrigenous clastic sediments 2. Carbonate Rocks 3. Evaporites 4. Ironstones 5. Phosphate deposits 6. Siliceous sediments 7. Volcanic Rocks
1‐Terrigenous Clastic Sediments
A‐Sandstones:
Sandstone (sometimes known as Arenite) is a sedimentary rock composed mainly of sand‐sized minerals or rock grains. Most sandstone is composed of quartz and/or feldspar because these are the most common minerals in the Earth's crust. Like sand, sandstone may be any color, but the most common colors are tan, brown, yellow, red, gray and white. Cement is Light colored CaCO3 & Red Iron Oxide
There are many types of Sandstones such as
• Black Sandstone: if Sand contain Tin Oxide • Argillaceous S.S.: if Sand contain Clay • Calcareous S.S.: if Sand contain CaCO3
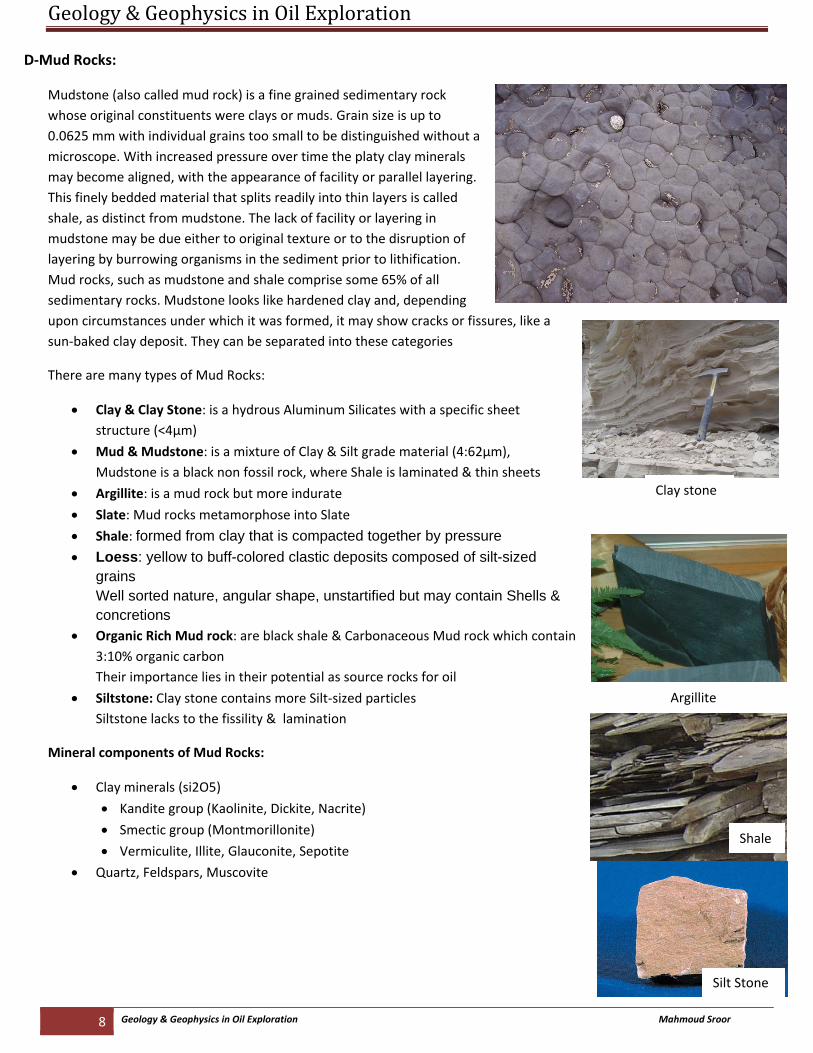
Grain Supported Sandstones: (Arenite)
• Arenite: when Qz > 90% • Arkosic Arenite: Feldspar > 25% & exceeds the rock fragment content
• Lith Arenite: Feldspar > 25% but less rock fragment content
• Phyll Arenite: is Lith Arenite but rock fragments are Shale or Slate
• Calc Lithite: is Lith Arenite but rock fragments are Limestone
Flute MarksGroove Marks
Geology & Geophysics in Oil Exploration
7 Geology & Geophysics in Oil Exploration Mahmoud Sroor
Matrix Supported Sandstones: (Wacke)
• Wacke or Dirty Sandstone: when Matrix>30%
• Grey Wacke: is a heterogeneous mixture of lithic fragments and angular grains of quartz and feldspar
• Arkosic Wacke: Arkose with proportion of Matrix
Hybrid Sandstones: (S.S. which contain non clastic components)
• Glauconitic S.S.: Glauconite occurs as sand‐sized Pellets • Phosphatic S.S.: Phosphate may be present as a cement, coprolites, or bone fragments
• Calcareous S.S.: Terrigenous clastics cemented by Calcite
B‐Conglomerates:
Conglomerates are sedimentary rocks consisting of rounded fragments and are thus differentiated from breccias, which consist of angular clasts
Made up mainly by Qz Pebbles, Flint, Chert, & Jasper
Both conglomerates and breccias are characterized by clasts larger than sand (>2 mm)
There are many types of Conglomerate:
• Limestone Conglomerate:
• Polymictic Conglomerate: Variety of Pebbles & Boulders are contained
• Monomictic Conglomerate: Consists of one pebble type
• Intraformational Conglomerate: composed of Clasts derived from the basin of deposition
• Extra formational Conglomerate: composed of Clasts derived from Beyond area of Sedimentation
C‐Breccia:
Sedimentary breccias are a type of clastic sedimentary rock which is composed of angular to sub angular, randomly oriented clasts of other sedimentary rocks. They are formed by submarine debris flows, avalanches, mud flow or mass flow in an aqueous medium. Technically, turbidities are a form of debris flow deposit and are a fine‐grained peripheral deposit to a sedimentary breccia flow.
Breccias are common along fault zones
Slumping Breccias: consist of broken beds derived from down slope slumping
Solution Breccias: resulting from Dissolution of Evaporites & collapse of overlying strata
Breccia
Geology & Geophysics in Oil Exploration
8 Geology & Geophysics in Oil Exploration Mahmoud Sroor
D‐Mud Rocks:
Mudstone (also called mud rock) is a fine grained sedimentary rock whose original constituents were clays or muds. Grain size is up to 0.0625 mm with individual grains too small to be distinguished without a microscope. With increased pressure over time the platy clay minerals may become aligned, with the appearance of facility or parallel layering. This finely bedded material that splits readily into thin layers is called shale, as distinct from mudstone. The lack of facility or layering in mudstone may be due either to original texture or to the disruption of layering by burrowing organisms in the sediment prior to lithification. Mud rocks, such as mudstone and shale comprise some 65% of all sedimentary rocks. Mudstone looks like hardened clay and, depending upon circumstances under which it was formed, it may show cracks or fissures, like a sun‐baked clay deposit. They can be separated into these categories
There are many types of Mud Rocks:
• Clay & Clay Stone: is a hydrous Aluminum Silicates with a specific sheet structure (<4µm)
• Mud & Mudstone: is a mixture of Clay & Silt grade material (4:62µm), Mudstone is a black non fossil rock, where Shale is laminated & thin sheets
• Argillite: is a mud rock but more indurate
• Slate: Mud rocks metamorphose into Slate
• Shale: formed from clay that is compacted together by pressure • Loess: yellow to buff-colored clastic deposits composed of silt-sized
grains Well sorted nature, angular shape, unstartified but may contain Shells & concretions
• Organic Rich Mud rock: are black shale & Carbonaceous Mud rock which contain 3:10% organic carbon Their importance lies in their potential as source rocks for oil
• Siltstone: Clay stone contains more Silt‐sized particles Siltstone lacks to the fissility & lamination
Mineral components of Mud Rocks:
• Clay minerals (si2O5)
• Kandite group (Kaolinite, Dickite, Nacrite)
• Smectic group (Montmorillonite)
• Vermiculite, Illite, Glauconite, Sepotite
• Quartz, Feldspars, Muscovite
Argillite
Shale
Clay stone
Silt Stone
Geology & Geophysics in Oil Exploration
9 Geology & Geophysics in Oil Exploration Mahmoud Sroor
2‐Carbonate Sediments
A‐Limestone
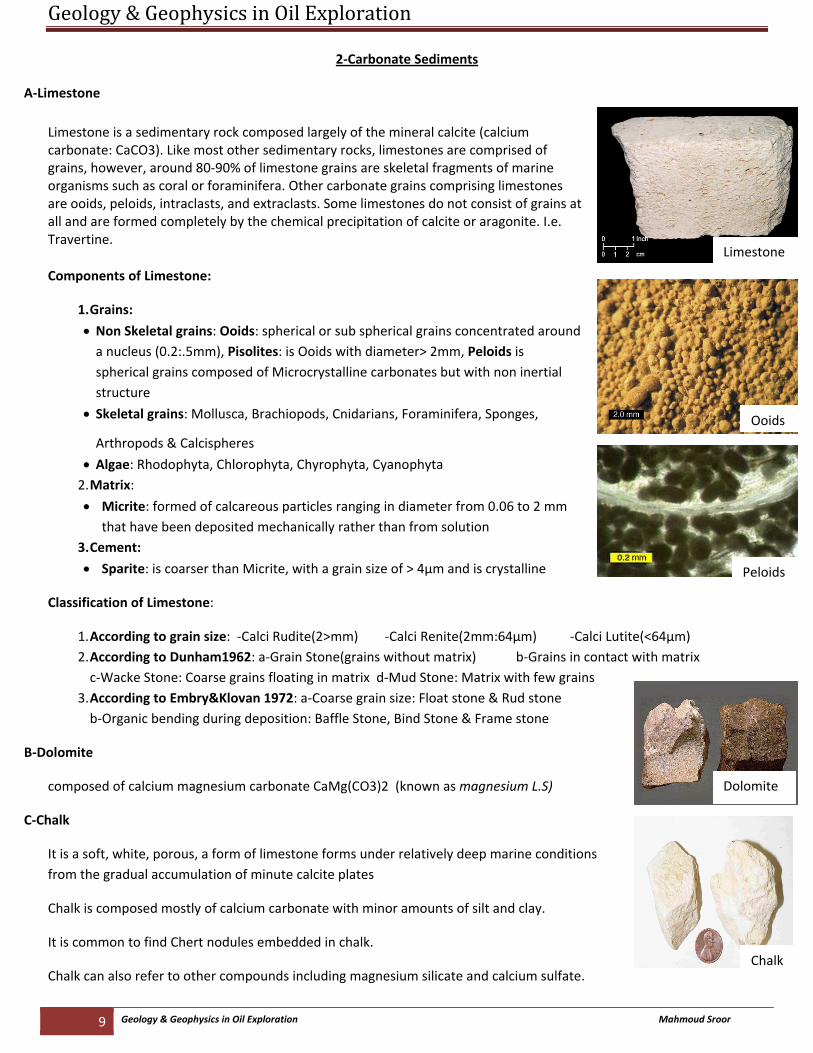
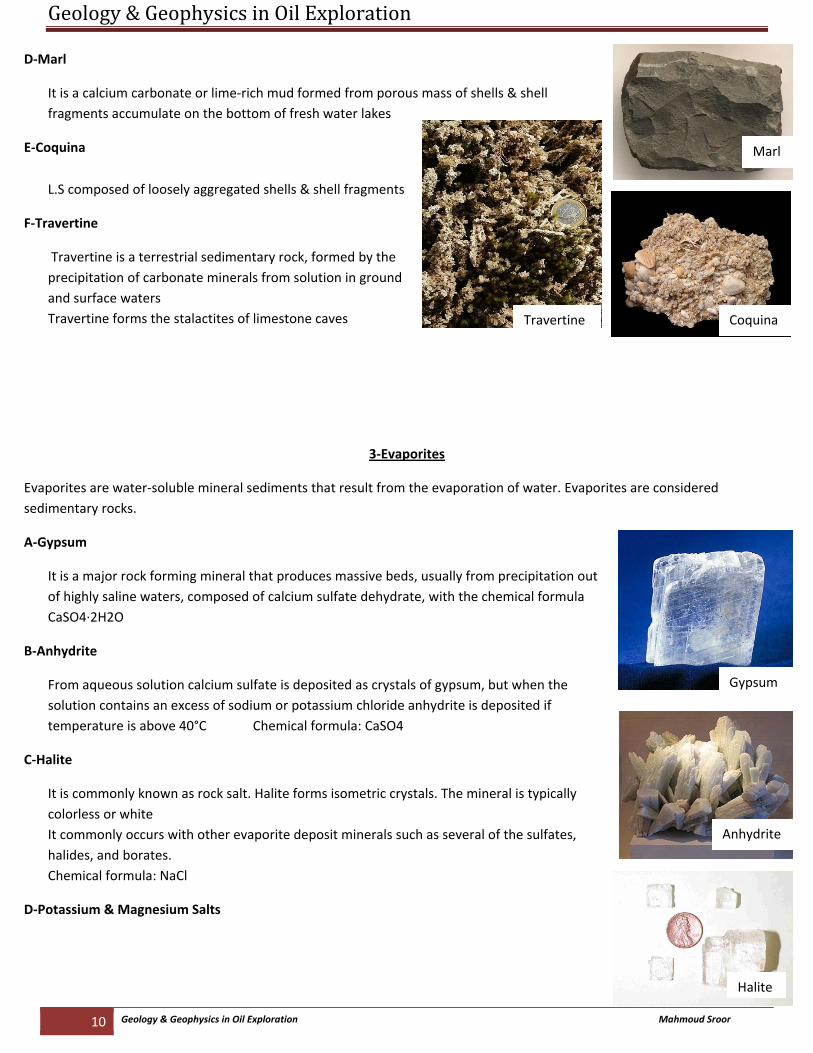
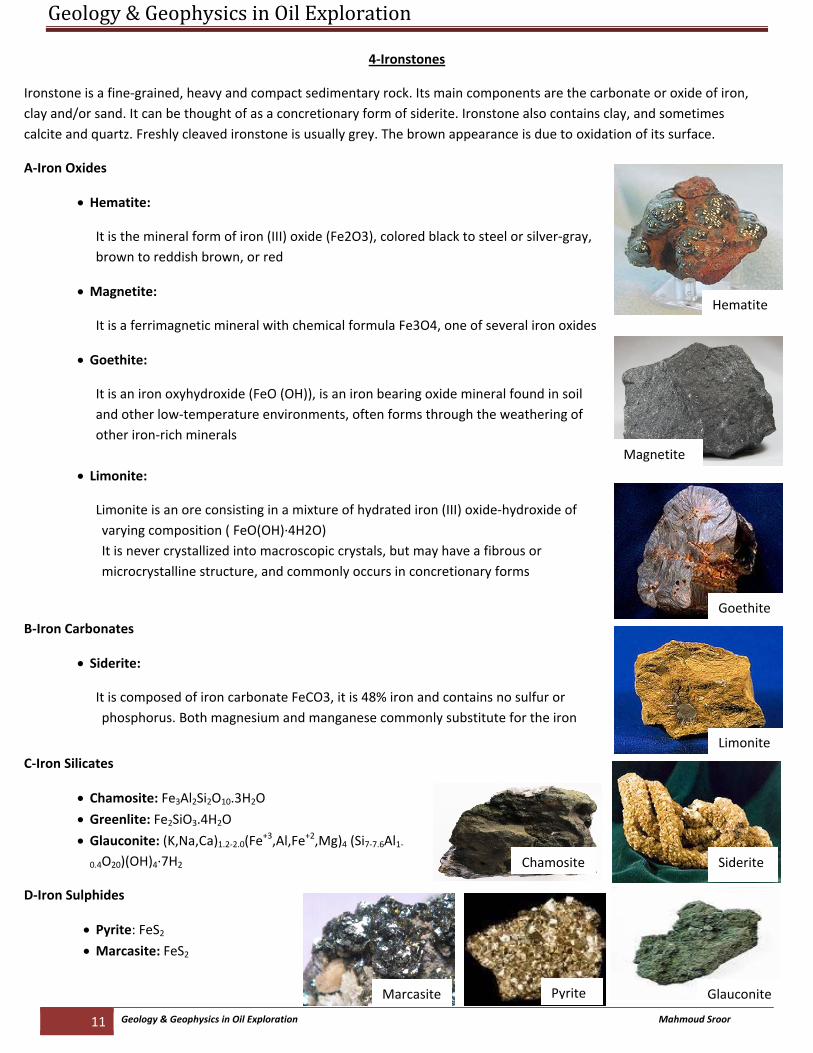
Limestone is a sedimentary rock composed largely of the mineral calcite (calcium carbonate: CaCO3). Like most other sedimentary rocks, limestones are comprised of grains, however, around 80‐90% of limestone grains are skeletal fragments of marine organisms such as coral or foraminifera. Other carbonate grains comprising limestones are ooids, peloids, intraclasts, and extraclasts. Some limestones do not consist of grains at all and are formed completely by the chemical precipitation of calcite or aragonite. I.e. Travertine.
Components of Limestone:
1. Grains: • Non Skeletal grains: Ooids: spherical or sub spherical grains concentrated around a nucleus (0.2:.5mm), Pisolites: is Ooids with diameter> 2mm, Peloids is spherical grains composed of Microcrystalline carbonates but with non inertial structure
• Skeletal grains: Mollusca, Brachiopods, Cnidarians, Foraminifera, Sponges,
Arthropods & Calcispheres
• Algae: Rhodophyta, Chlorophyta, Chyrophyta, Cyanophyta 2. Matrix:
• Micrite: formed of calcareous particles ranging in diameter from 0.06 to 2 mm that have been deposited mechanically rather than from solution
3. Cement:
• Sparite: is coarser than Micrite, with a grain size of > 4µm and is crystalline
Classification of Limestone:
1. According to grain size: ‐Calci Rudite(2>mm) ‐Calci Renite(2mm:64µm) ‐Calci Lutite(<64µm) 2. According to Dunham1962: a‐Grain Stone(grains without matrix) b‐Grains in contact with matrix c‐Wacke Stone: Coarse grains floating in matrix d‐Mud Stone: Matrix with few grains
3. According to Embry&Klovan 1972: a‐Coarse grain size: Float stone & Rud stone b‐Organic bending during deposition: Baffle Stone, Bind Stone & Frame stone
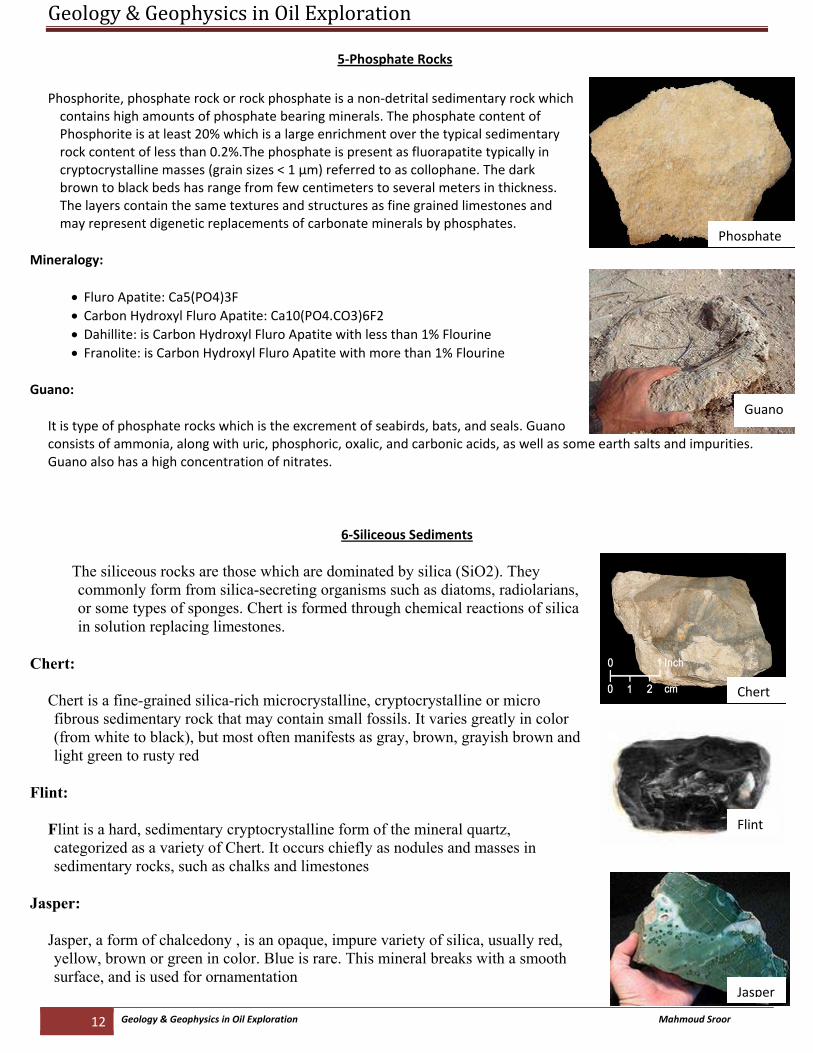
B‐Dolomite
composed of calcium magnesium carbonate CaMg(CO3)2 (known as magnesium L.S)
C‐Chalk
It is a soft, white, porous, a form of limestone forms under relatively deep marine conditions from the gradual accumulation of minute calcite plates
Chalk is composed mostly of calcium carbonate with minor amounts of silt and clay.
It is common to find Chert nodules embedded in chalk.
Chalk can also refer to other compounds including magnesium silicate and calcium sulfate.
Ooids
Peloids
Limestone
Dolomite
Chalk
Geology & Geophysics in Oil Exploration
10 Geology & Geophysics in Oil Exploration Mahmoud Sroor
D‐Marl
It is a calcium carbonate or lime‐rich mud formed from porous mass of shells & shell fragments accumulate on the bottom of fresh water lakes
E‐Coquina
L.S composed of loosely aggregated shells & shell fragments
F‐Travertine
Travertine is a terrestrial sedimentary rock, formed by the precipitation of carbonate minerals from solution in ground and surface waters Travertine forms the stalactites of limestone caves
3‐Evaporites
Evaporites are water‐soluble mineral sediments that result from the evaporation of water. Evaporites are considered sedimentary rocks.
A‐Gypsum
It is a major rock forming mineral that produces massive beds, usually from precipitation out of highly saline waters, composed of calcium sulfate dehydrate, with the chemical formula CaSO4∙2H2O
B‐Anhydrite
From aqueous solution calcium sulfate is deposited as crystals of gypsum, but when the solution contains an excess of sodium or potassium chloride anhydrite is deposited if temperature is above 40°C Chemical formula: CaSO4
C‐Halite
It is commonly known as rock salt. Halite forms isometric crystals. The mineral is typically colorless or white It commonly occurs with other evaporite deposit minerals such as several of the sulfates, halides, and borates. Chemical formula: NaCl
D‐Potassium & Magnesium Salts
Marl
Coquina Travertine
Gypsum
Anhydrite
Halite
Geology & Geophysics in Oil Exploration
11 Geology & Geophysics in Oil Exploration Mahmoud Sroor
4‐Ironstones
Ironstone is a fine‐grained, heavy and compact sedimentary rock. Its main components are the carbonate or oxide of iron, clay and/or sand. It can be thought of as a concretionary form of siderite. Ironstone also contains clay, and sometimes calcite and quartz. Freshly cleaved ironstone is usually grey. The brown appearance is due to oxidation of its surface.
A‐Iron Oxides
• Hematite:
It is the mineral form of iron (III) oxide (Fe2O3), colored black to steel or silver‐gray, brown to reddish brown, or red
• Magnetite:
It is a ferrimagnetic mineral with chemical formula Fe3O4, one of several iron oxides
• Goethite:
It is an iron oxyhydroxide (FeO (OH)), is an iron bearing oxide mineral found in soil and other low‐temperature environments, often forms through the weathering of other iron‐rich minerals
• Limonite:
Limonite is an ore consisting in a mixture of hydrated iron (III) oxide‐hydroxide of varying composition ( FeO(OH)∙4H2O) It is never crystallized into macroscopic crystals, but may have a fibrous or microcrystalline structure, and commonly occurs in concretionary forms
B‐Iron Carbonates
• Siderite:
It is composed of iron carbonate FeCO3, it is 48% iron and contains no sulfur or phosphorus. Both magnesium and manganese commonly substitute for the iron
C‐Iron Silicates
• Chamosite: Fe3Al2Si2O10.3H2O
• Greenlite: Fe2SiO3.4H2O
• Glauconite: (K,Na,Ca)1.2‐2.0(Fe+3,Al,Fe+2,Mg)4 (Si7‐7.6Al1‐0.4O20)(OH)4∙7H2
D‐Iron Sulphides
• Pyrite: FeS2 • Marcasite: FeS2
Hematite
Magnetite
Goethite
Limonite
Siderite
Glauconite
Chamosite
Pyrite Marcasite
Geology & Geophysics in Oil Exploration
12 Geology & Geophysics in Oil Exploration Mahmoud Sroor
5‐Phosphate Rocks
Phosphorite, phosphate rock or rock phosphate is a non‐detrital sedimentary rock which contains high amounts of phosphate bearing minerals. The phosphate content of Phosphorite is at least 20% which is a large enrichment over the typical sedimentary rock content of less than 0.2%.The phosphate is present as fluorapatite typically in cryptocrystalline masses (grain sizes < 1 μm) referred to as collophane. The dark brown to black beds has range from few centimeters to several meters in thickness. The layers contain the same textures and structures as fine grained limestones and may represent digenetic replacements of carbonate minerals by phosphates.
Mineralogy:
• Fluro Apatite: Ca5(PO4)3F • Carbon Hydroxyl Fluro Apatite: Ca10(PO4.CO3)6F2 • Dahillite: is Carbon Hydroxyl Fluro Apatite with less than 1% Flourine • Franolite: is Carbon Hydroxyl Fluro Apatite with more than 1% Flourine
Guano:
It is type of phosphate rocks which is the excrement of seabirds, bats, and seals. Guano consists of ammonia, along with uric, phosphoric, oxalic, and carbonic acids, as well as some earth salts and impurities. Guano also has a high concentration of nitrates.
6‐Siliceous Sediments
The siliceous rocks are those which are dominated by silica (SiO2). They commonly form from silica-secreting organisms such as diatoms, radiolarians, or some types of sponges. Chert is formed through chemical reactions of silica in solution replacing limestones.
Chert:
Chert is a fine-grained silica-rich microcrystalline, cryptocrystalline or micro fibrous sedimentary rock that may contain small fossils. It varies greatly in color (from white to black), but most often manifests as gray, brown, grayish brown and light green to rusty red
Flint:
Flint is a hard, sedimentary cryptocrystalline form of the mineral quartz, categorized as a variety of Chert. It occurs chiefly as nodules and masses in sedimentary rocks, such as chalks and limestones
Jasper:
Jasper, a form of chalcedony , is an opaque, impure variety of silica, usually red, yellow, brown or green in color. Blue is rare. This mineral breaks with a smooth surface, and is used for ornamentation
Phosphate
Guano
Chert
Jasper
Flint
Geology & Geophysics in Oil Exploration
13 Geology & Geophysics in Oil Exploration Mahmoud Sroor
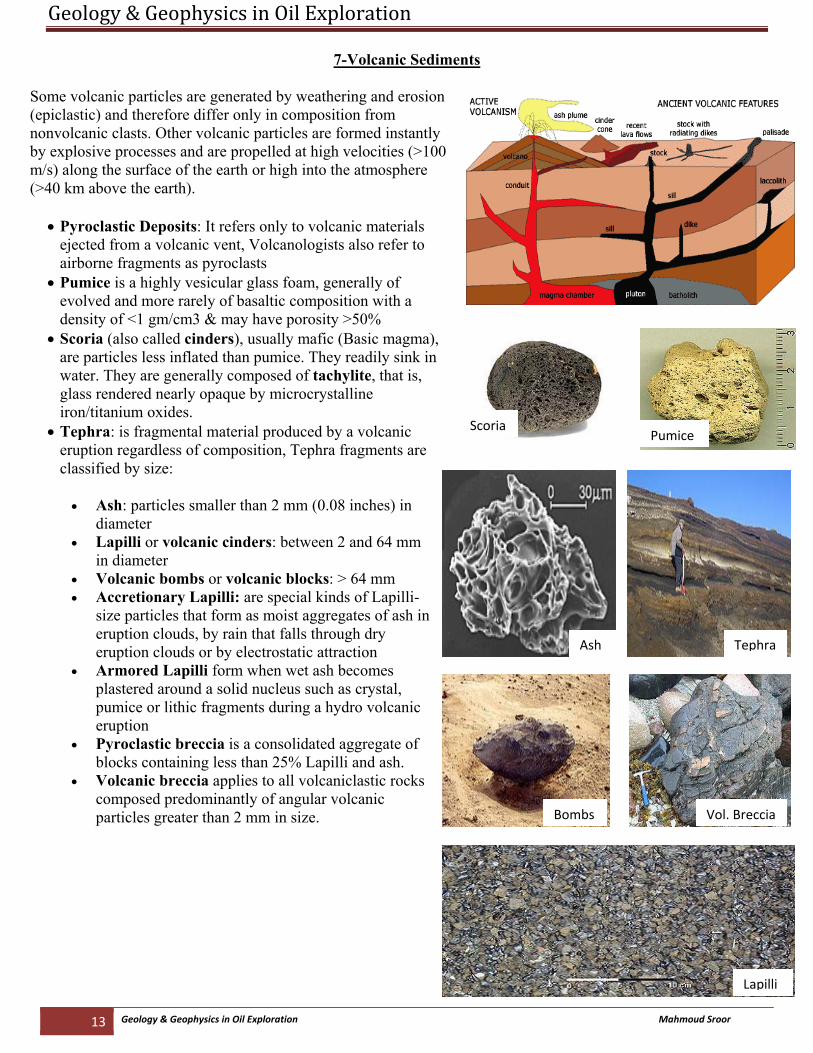
7-Volcanic Sediments
Some volcanic particles are generated by weathering and erosion (epiclastic) and therefore differ only in composition from nonvolcanic clasts. Other volcanic particles are formed instantly by explosive processes and are propelled at high velocities (>100 m/s) along the surface of the earth or high into the atmosphere (>40 km above the earth).
• Pyroclastic Deposits: It refers only to volcanic materials ejected from a volcanic vent, Volcanologists also refer to airborne fragments as pyroclasts
• Pumice is a highly vesicular glass foam, generally of evolved and more rarely of basaltic composition with a density of <1 gm/cm3 & may have porosity >50%
• Scoria (also called cinders), usually mafic (Basic magma), are particles less inflated than pumice. They readily sink in water. They are generally composed of tachylite, that is, glass rendered nearly opaque by microcrystalline iron/titanium oxides.
• Tephra: is fragmental material produced by a volcanic eruption regardless of composition, Tephra fragments are classified by size:
• Ash: particles smaller than 2 mm (0.08 inches) in diameter
• Lapilli or volcanic cinders: between 2 and 64 mm in diameter
• Volcanic bombs or volcanic blocks: > 64 mm • Accretionary Lapilli: are special kinds of Lapilli-
size particles that form as moist aggregates of ash in eruption clouds, by rain that falls through dry eruption clouds or by electrostatic attraction
• Armored Lapilli form when wet ash becomes plastered around a solid nucleus such as crystal, pumice or lithic fragments during a hydro volcanic eruption
• Pyroclastic breccia is a consolidated aggregate of blocks containing less than 25% Lapilli and ash.
• Volcanic breccia applies to all volcaniclastic rocks composed predominantly of angular volcanic particles greater than 2 mm in size.
PumiceScoria
TephraAsh
Vol. BrecciaBombs
Lapilli
Geology & Geophysics in Oil Exploration
14 Geology & Geophysics in Oil Exploration Mahmoud Sroor
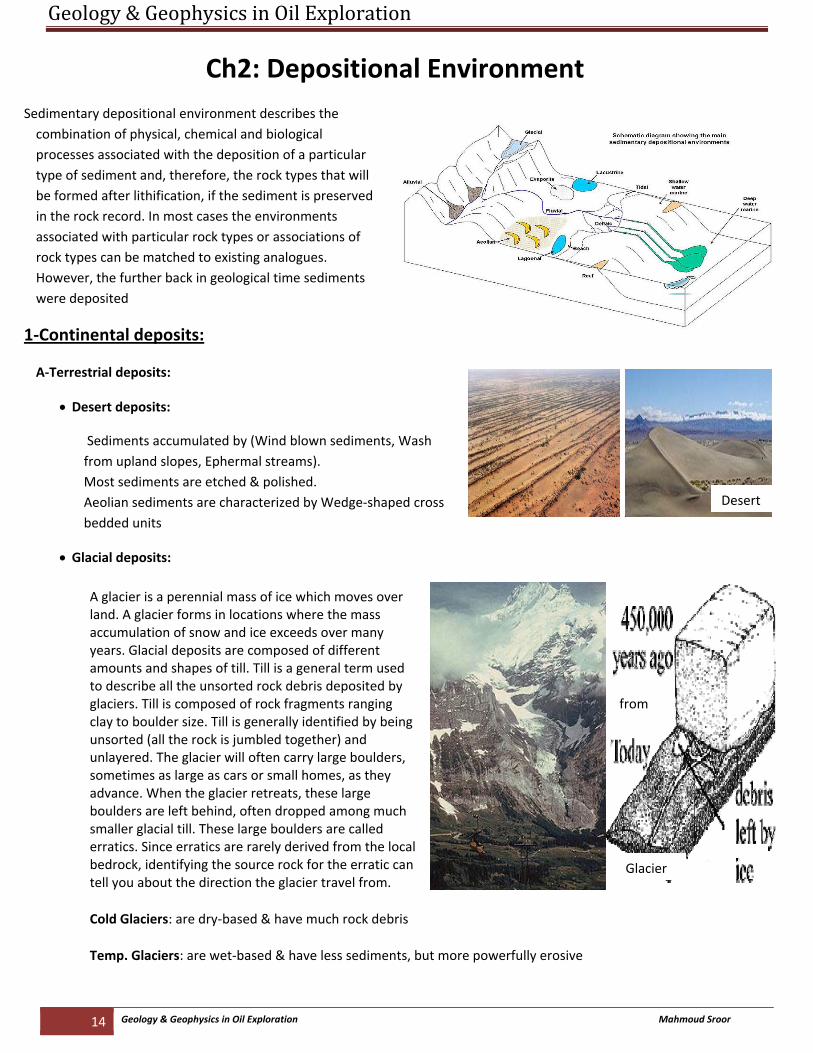
Ch2: Depositional Environment Sedimentary depositional environment describes the combination of physical, chemical and biological processes associated with the deposition of a particular type of sediment and, therefore, the rock types that will be formed after lithification, if the sediment is preserved in the rock record. In most cases the environments associated with particular rock types or associations of rock types can be matched to existing analogues. However, the further back in geological time sediments were deposited
1‐Continental deposits:
A‐Terrestrial deposits:
• Desert deposits:
Sediments accumulated by (Wind blown sediments, Wash from upland slopes, Ephermal streams). Most sediments are etched & polished. Aeolian sediments are characterized by Wedge‐shaped cross bedded units
• Glacial deposits:
A glacier is a perennial mass of ice which moves over land. A glacier forms in locations where the mass accumulation of snow and ice exceeds over many years. Glacial deposits are composed of different amounts and shapes of till. Till is a general term used to describe all the unsorted rock debris deposited by glaciers. Till is composed of rock fragments ranging from clay to boulder size. Till is generally identified by being unsorted (all the rock is jumbled together) and unlayered. The glacier will often carry large boulders, sometimes as large as cars or small homes, as they advance. When the glacier retreats, these large boulders are left behind, often dropped among much smaller glacial till. These large boulders are called erratics. Since erratics are rarely derived from the local bedrock, identifying the source rock for the erratic can tell you about the direction the glacier travel from.
Cold Glaciers: are dry‐based & have much rock debris
Temp. Glaciers: are wet‐based & have less sediments, but more powerfully erosive
Desert
Glacier
Geology & Geophysics in Oil Exploration
15 Geology & Geophysics in Oil Exploration Mahmoud Sroor
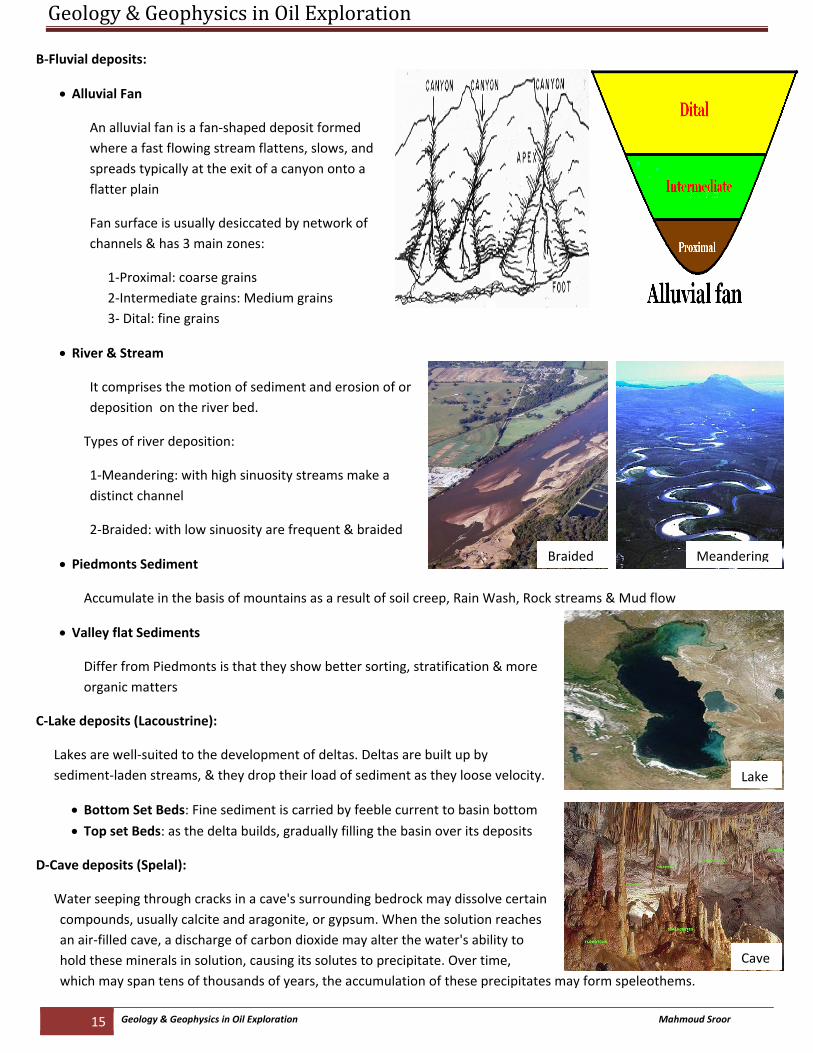
B‐Fluvial deposits:
• Alluvial Fan
An alluvial fan is a fan‐shaped deposit formed where a fast flowing stream flattens, slows, and spreads typically at the exit of a canyon onto a flatter plain
Fan surface is usually desiccated by network of channels & has 3 main zones:
1‐Proximal: coarse grains 2‐Intermediate grains: Medium grains 3‐ Dital: fine grains
• River & Stream
It comprises the motion of sediment and erosion of or deposition on the river bed.
Types of river deposition:
1‐Meandering: with high sinuosity streams make a distinct channel
2‐Braided: with low sinuosity are frequent & braided
• Piedmonts Sediment
Accumulate in the basis of mountains as a result of soil creep, Rain Wash, Rock streams & Mud flow
• Valley flat Sediments
Differ from Piedmonts is that they show better sorting, stratification & more organic matters
C‐Lake deposits (Lacoustrine):
Lakes are well‐suited to the development of deltas. Deltas are built up by sediment‐laden streams, & they drop their load of sediment as they loose velocity.
• Bottom Set Beds: Fine sediment is carried by feeble current to basin bottom
• Top set Beds: as the delta builds, gradually filling the basin over its deposits
D‐Cave deposits (Spelal):
Water seeping through cracks in a cave's surrounding bedrock may dissolve certain compounds, usually calcite and aragonite, or gypsum. When the solution reaches an air‐filled cave, a discharge of carbon dioxide may alter the water's ability to hold these minerals in solution, causing its solutes to precipitate. Over time, which may span tens of thousands of years, the accumulation of these precipitates may form speleothems.
Braided Meandering
Lake
Cave
Geology & Geophysics in Oil Exploration
16 Geology & Geophysics in Oil Exploration Mahmoud Sroor
2‐Transitional deposits
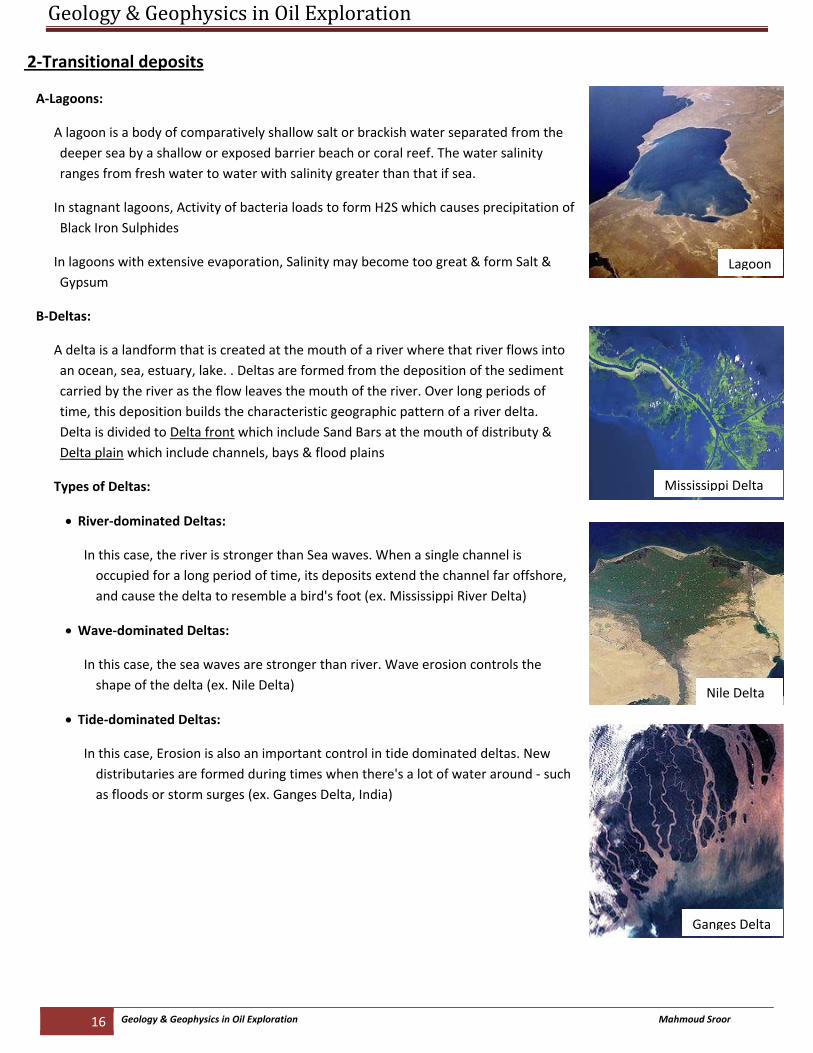
A‐Lagoons:
A lagoon is a body of comparatively shallow salt or brackish water separated from the deeper sea by a shallow or exposed barrier beach or coral reef. The water salinity ranges from fresh water to water with salinity greater than that if sea.
In stagnant lagoons, Activity of bacteria loads to form H2S which causes precipitation of Black Iron Sulphides
In lagoons with extensive evaporation, Salinity may become too great & form Salt & Gypsum
B‐Deltas:
A delta is a landform that is created at the mouth of a river where that river flows into an ocean, sea, estuary, lake. . Deltas are formed from the deposition of the sediment carried by the river as the flow leaves the mouth of the river. Over long periods of time, this deposition builds the characteristic geographic pattern of a river delta. Delta is divided to Delta front which include Sand Bars at the mouth of distributy & Delta plain which include channels, bays & flood plains
Types of Deltas:
• River‐dominated Deltas:
In this case, the river is stronger than Sea waves. When a single channel is occupied for a long period of time, its deposits extend the channel far offshore, and cause the delta to resemble a bird's foot (ex. Mississippi River Delta)
• Wave‐dominated Deltas:
In this case, the sea waves are stronger than river. Wave erosion controls the shape of the delta (ex. Nile Delta)
• Tide‐dominated Deltas:
In this case, Erosion is also an important control in tide dominated deltas. New distributaries are formed during times when there's a lot of water around ‐ such as floods or storm surges (ex. Ganges Delta, India)
Lagoon
Mississippi Delta
Nile Delta
Ganges Delta
Geology & Geophysics in Oil Exploration
17 Geology & Geophysics in Oil Exploration Mahmoud Sroor
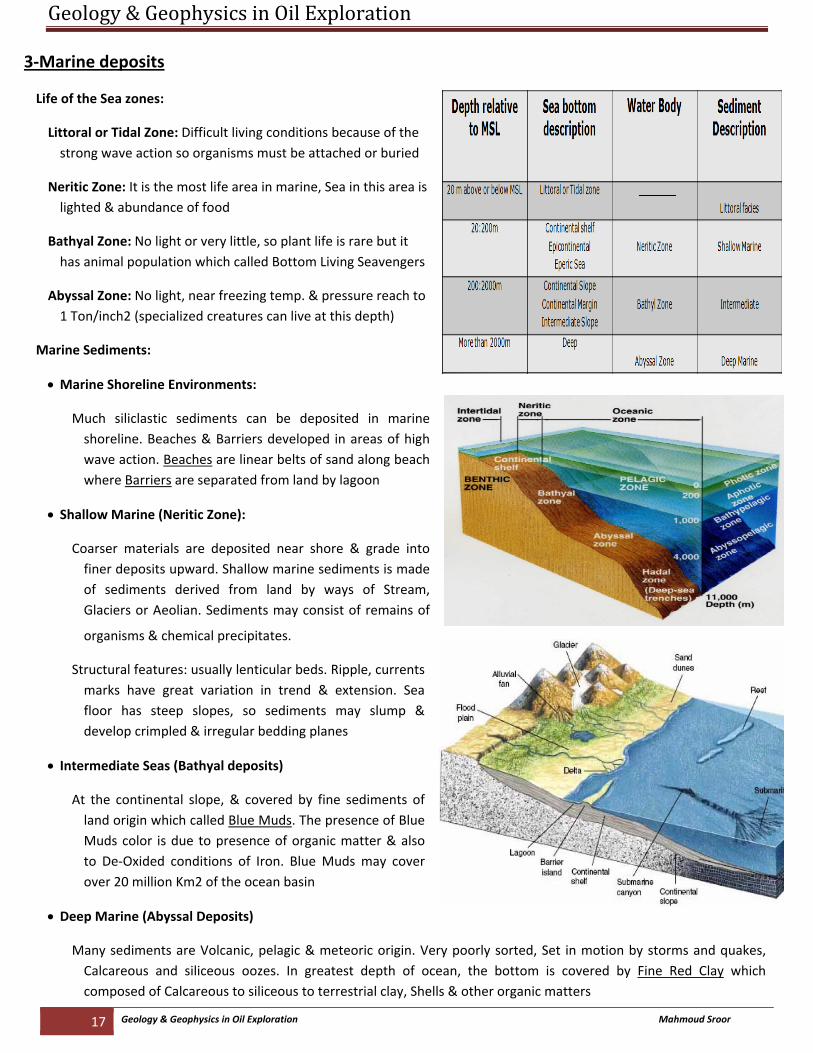
3‐Marine deposits
Life of the Sea zones:
Littoral or Tidal Zone: Difficult living conditions because of the strong wave action so organisms must be attached or buried
Neritic Zone: It is the most life area in marine, Sea in this area is lighted & abundance of food
Bathyal Zone: No light or very little, so plant life is rare but it has animal population which called Bottom Living Seavengers
Abyssal Zone: No light, near freezing temp. & pressure reach to 1 Ton/inch2 (specialized creatures can live at this depth)
Marine Sediments:
• Marine Shoreline Environments:
Much siliclastic sediments can be deposited in marine shoreline. Beaches & Barriers developed in areas of high wave action. Beaches are linear belts of sand along beach where Barriers are separated from land by lagoon
• Shallow Marine (Neritic Zone):
Coarser materials are deposited near shore & grade into finer deposits upward. Shallow marine sediments is made of sediments derived from land by ways of Stream, Glaciers or Aeolian. Sediments may consist of remains of
organisms & chemical precipitates.
Structural features: usually lenticular beds. Ripple, currents marks have great variation in trend & extension. Sea floor has steep slopes, so sediments may slump & develop crimpled & irregular bedding planes
• Intermediate Seas (Bathyal deposits)
At the continental slope, & covered by fine sediments of land origin which called Blue Muds. The presence of Blue Muds color is due to presence of organic matter & also to De‐Oxided conditions of Iron. Blue Muds may cover over 20 million Km2 of the ocean basin
• Deep Marine (Abyssal Deposits)
Many sediments are Volcanic, pelagic & meteoric origin. Very poorly sorted, Set in motion by storms and quakes, Calcareous and siliceous oozes. In greatest depth of ocean, the bottom is covered by Fine Red Clay which composed of Calcareous to siliceous to terrestrial clay, Shells & other organic matters
Geo
Structhisinfresimparetecgeocon
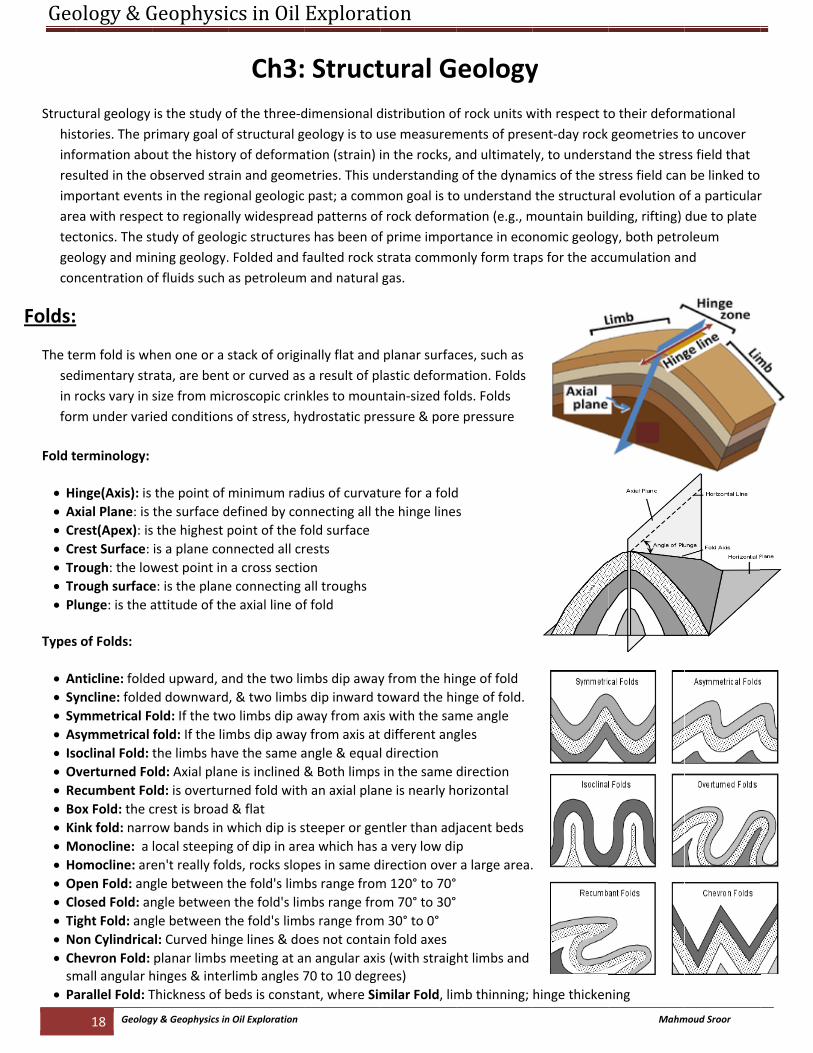
Folds:
The tesedin rfor
Fold t
• Hi• Ax• Cr• Cr• Tr• Tr• Pl
Types
• An• Sy• Sy• As• Is• Ov• Re• Bo• Ki• M• Ho• O• Cl• Ti• N• Chsm
• Pa
ology & G
18 Geolog
tural geology stories. The prormation abosulted in the oportant evenea with respectonics. The sology and minncentration o
erm fold is whdimentary strrocks vary in rm under vari
erminology:
inge(Axis): is xial Plane: is rest(Apex): isrest Surface: rough: the lowrough surfacelunge: is the a
s of Folds:
nticline: foldeyncline: foldeymmetrical Fsymmetrical oclinal Fold: verturned Foecumbent Foox Fold: the cink fold: narr
Monocline: a omocline: arepen Fold: anglosed Fold: anght Fold: angon Cylindricahevron Fold: mall angular harallel Fold: T
Geophysi
gy & Geophysics in
is the study orimary goal oout the historobserved strats in the regioct to regionatudy of geoloning geology.of fluids such
hen one or a srata, are bentsize from micied condition
the point of the surface ds the highest pis a plane conwest point in e: is the planeattitude of th
ed upward, aed downwardold: If the twfold: If the limthe limbs havold: Axial planold: is overturcrest is broadow bands in wlocal steepingen't really folgle between tngle betweengle between tal: Curved hinplanar limbs hinges & interThickness of b
cs in Oil
n Oil Exploration
Ch3:of the three‐dof structural gry of deformaain and geomonal geologiclly widespreaogic structure. Folded and fas petroleum
stack of origint or curved ascroscopic crins of stress, hy
minimum raddefined by conpoint of the fnnected all cra cross sectioe connecting e axial line of
nd the two lim, & two limbso limbs dip awmbs dip awayve the same ane is inclined &rned fold with & flat which dip is sg of dip in areds, rocks slopthe fold's limn the fold's limthe fold's limbnge lines & domeeting at arlimb angles 7beds is consta
Explorat
Structdimensional deology is to uation (strain) ietries. This u past; a commad patterns ofs has been offaulted rock sm and natural
nally flat and s a result of pnkles to mounydrostatic pre
dius of curvatnnecting all tfold surface rests on all troughs f fold
mbs dip aways dip inward tway from axiy from axis at angle & equal& Both limps h an axial plan
steeper or genea which has pes in same dbs range frommbs range frobs range fromoes not contan angular axi70 to 10 degrant, where Sim
tion
tural Gdistribution ouse measuremin the rocks, anderstandingmon goal is tof rock deformf prime imporstrata commogas.
planar surfaclastic deformntain‐sized foessure & pore
ture for a foldhe hinge line
y from the hintoward the his with the samdifferent angl direction in the same ne is nearly h
ntler than adja very low didirection overm 120° to 70°om 70° to 30°m 30° to 0° in fold axes s (with straigrees) milar Fold, lim
eologyf rock units wments of presand ultimatelg of the dynamo understand mation (e.g., mrtance in ecoonly form trap
ces, such as ation. Folds lds. Folds e pressure
d s
nge of fold inge of fold.me angle gles
direction orizontal
jacent beds p r a large area.
ht limbs and
mb thinning;
y with respect tsent‐day rock ly, to understmics of the stthe structura
mountain builnomic geologps for the acc
.
hinge thicken
Mahm
o their deformgeometries ttand the strestress field canal evolution oding, rifting) gy, both petrocumulation an
ning
moud Sroor
mational to uncover ss field that n be linked to of a particulardue to plate oleum nd
r
Geology & Geophysics in Oil Exploration
19 Geology & Geophysics in Oil Exploration Mahmoud Sroor
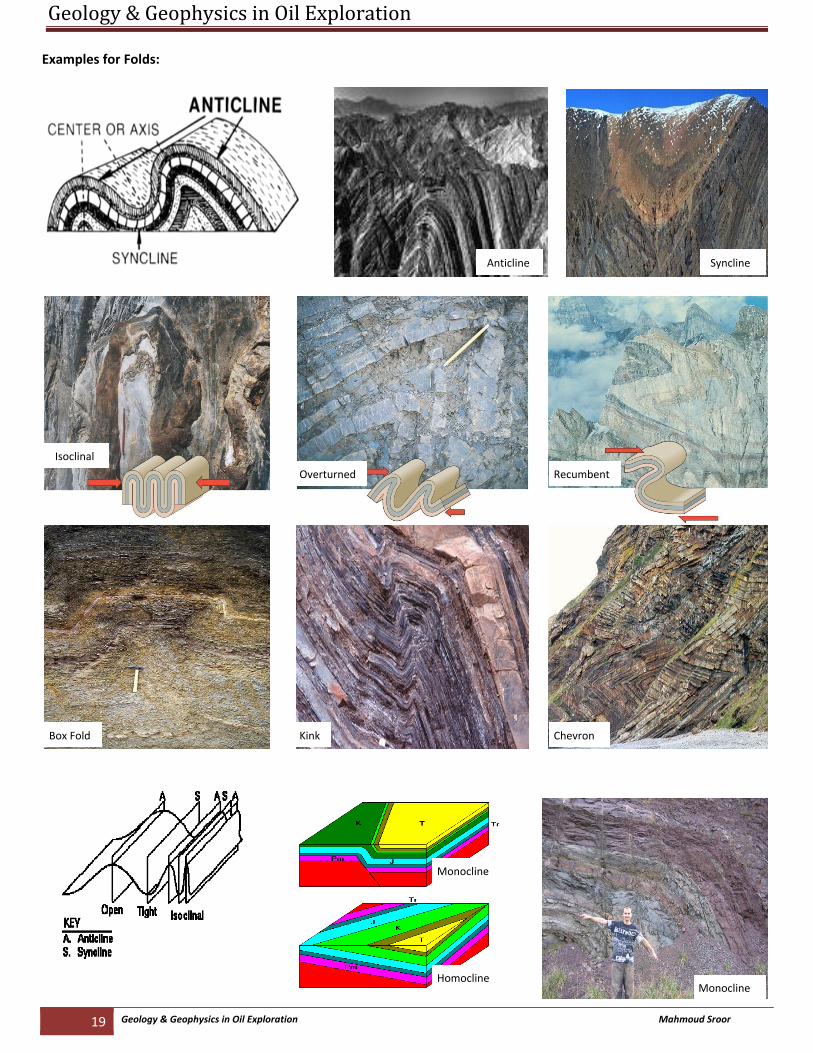
Examples for Folds:
SynclineAnticline
Isoclinal
Overturned Recumbent
Box Fold Kink Chevron
Monocline
HomoclineMonocline
Geology & Geophysics in Oil Exploration
20 Geology & Geophysics in Oil Exploration Mahmoud Sroor
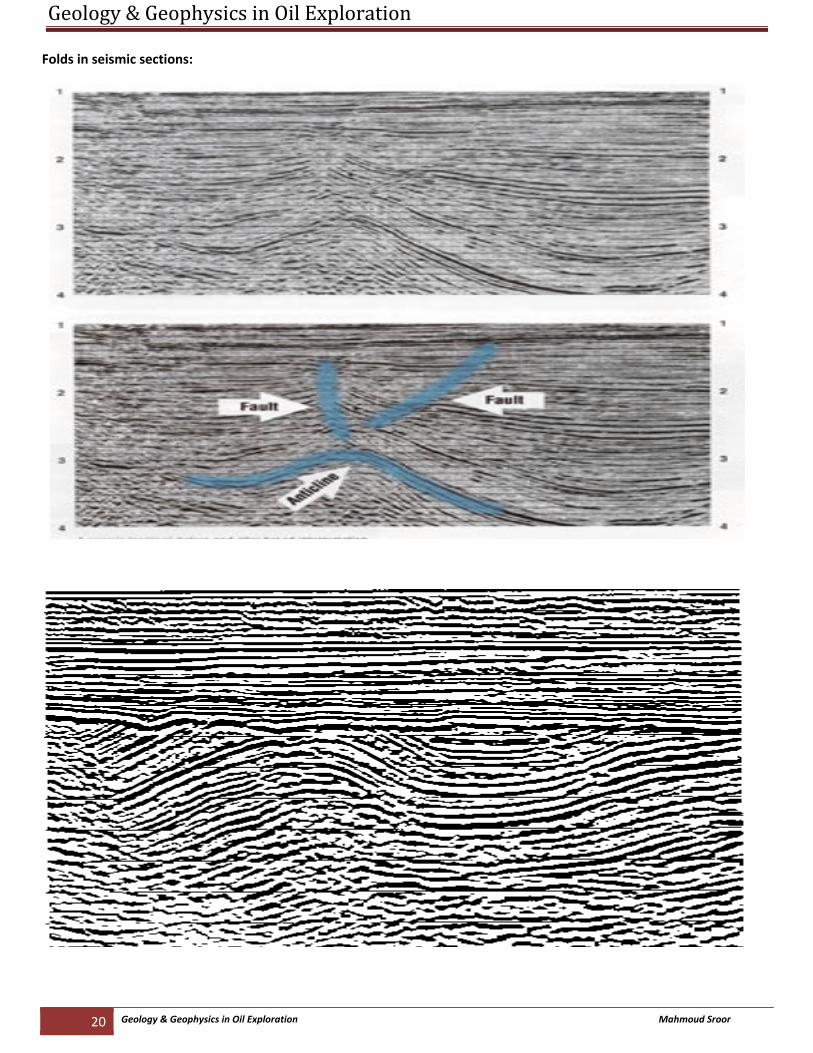
Folds in seismic sections:
Geology & Geophysics in Oil Exploration
21 Geology & Geophysics in Oil Exploration Mahmoud Sroor
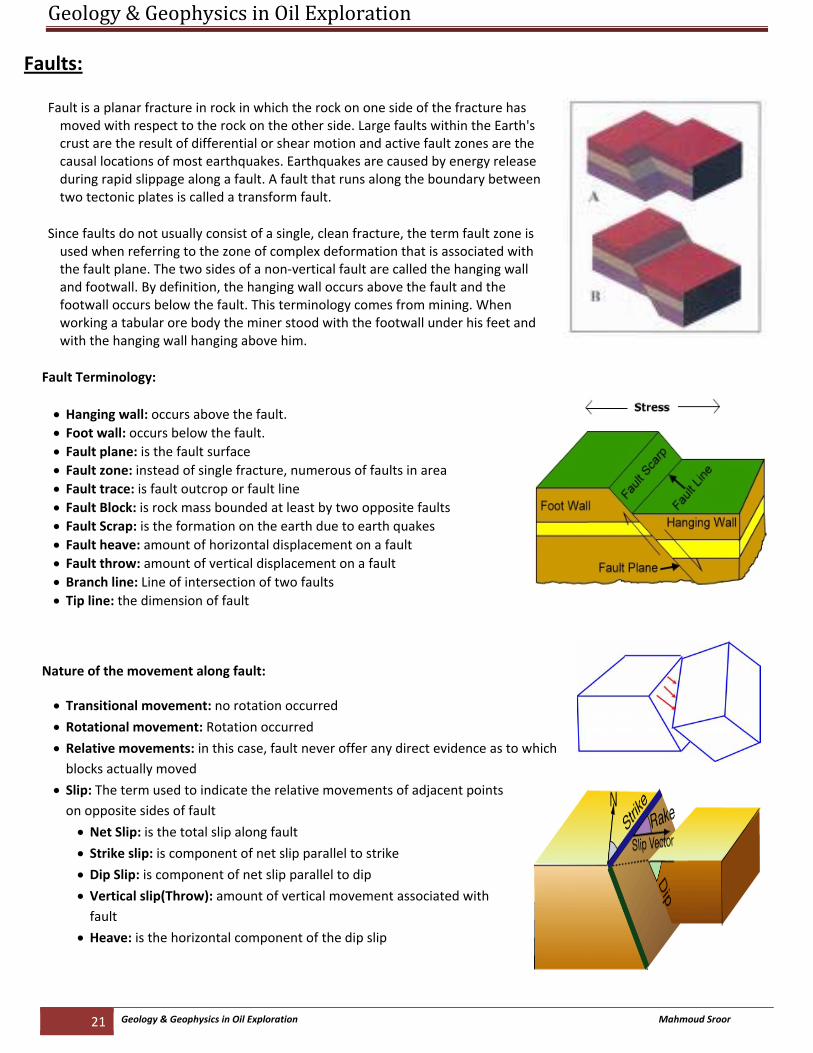
Faults:
Fault is a planar fracture in rock in which the rock on one side of the fracture has moved with respect to the rock on the other side. Large faults within the Earth's crust are the result of differential or shear motion and active fault zones are the causal locations of most earthquakes. Earthquakes are caused by energy release during rapid slippage along a fault. A fault that runs along the boundary between two tectonic plates is called a transform fault.
Since faults do not usually consist of a single, clean fracture, the term fault zone is used when referring to the zone of complex deformation that is associated with the fault plane. The two sides of a non‐vertical fault are called the hanging wall and footwall. By definition, the hanging wall occurs above the fault and the footwall occurs below the fault. This terminology comes from mining. When working a tabular ore body the miner stood with the footwall under his feet and with the hanging wall hanging above him.
Fault Terminology:
• Hanging wall: occurs above the fault. • Foot wall: occurs below the fault. • Fault plane: is the fault surface • Fault zone: instead of single fracture, numerous of faults in area • Fault trace: is fault outcrop or fault line • Fault Block: is rock mass bounded at least by two opposite faults • Fault Scrap: is the formation on the earth due to earth quakes • Fault heave: amount of horizontal displacement on a fault • Fault throw: amount of vertical displacement on a fault • Branch line: Line of intersection of two faults • Tip line: the dimension of fault
Nature of the movement along fault:
• Transitional movement: no rotation occurred
• Rotational movement: Rotation occurred
• Relative movements: in this case, fault never offer any direct evidence as to which blocks actually moved
• Slip: The term used to indicate the relative movements of adjacent points on opposite sides of fault
• Net Slip: is the total slip along fault • Strike slip: is component of net slip parallel to strike
• Dip Slip: is component of net slip parallel to dip
• Vertical slip(Throw): amount of vertical movement associated with fault
• Heave: is the horizontal component of the dip slip
Geology & Geophysics in Oil Exploration
22 Geology & Geophysics in Oil Exploration Mahmoud Sroor
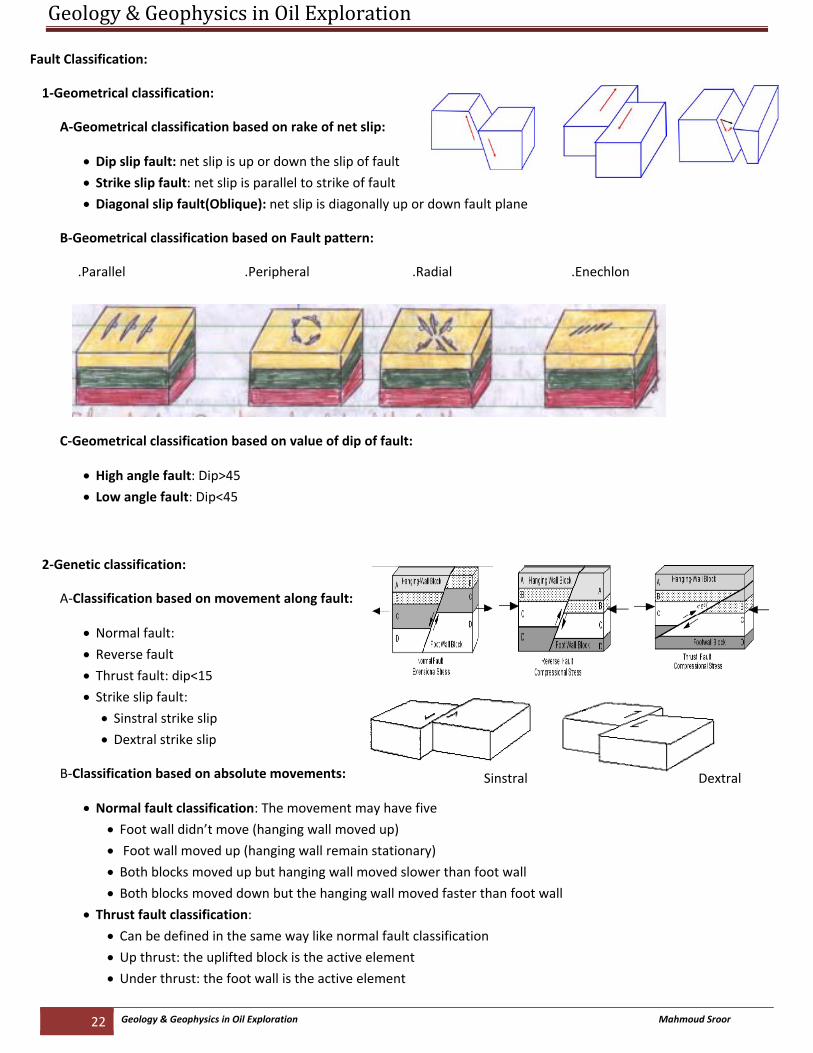
Fault Classification:
1‐Geometrical classification:
A‐Geometrical classification based on rake of net slip:
• Dip slip fault: net slip is up or down the slip of fault • Strike slip fault: net slip is parallel to strike of fault • Diagonal slip fault(Oblique): net slip is diagonally up or down fault plane
B‐Geometrical classification based on Fault pattern:
.Parallel .Peripheral .Radial .Enechlon
C‐Geometrical classification based on value of dip of fault:
• High angle fault: Dip>45 • Low angle fault: Dip<45
2‐Genetic classification:
A‐Classification based on movement along fault:
• Normal fault:
• Reverse fault • Thrust fault: dip<15 • Strike slip fault:
• Sinstral strike slip • Dextral strike slip
B‐Classification based on absolute movements:
• Normal fault classification: The movement may have five
• Foot wall didn’t move (hanging wall moved up)
• Foot wall moved up (hanging wall remain stationary)
• Both blocks moved up but hanging wall moved slower than foot wall
• Both blocks moved down but the hanging wall moved faster than foot wall
• Thrust fault classification: • Can be defined in the same way like normal fault classification
• Up thrust: the uplifted block is the active element
• Under thrust: the foot wall is the active element
Sinstral Dextral
Geology & Geophysics in Oil Exploration
23 Geology & Geophysics in Oil Exploration Mahmoud Sroor
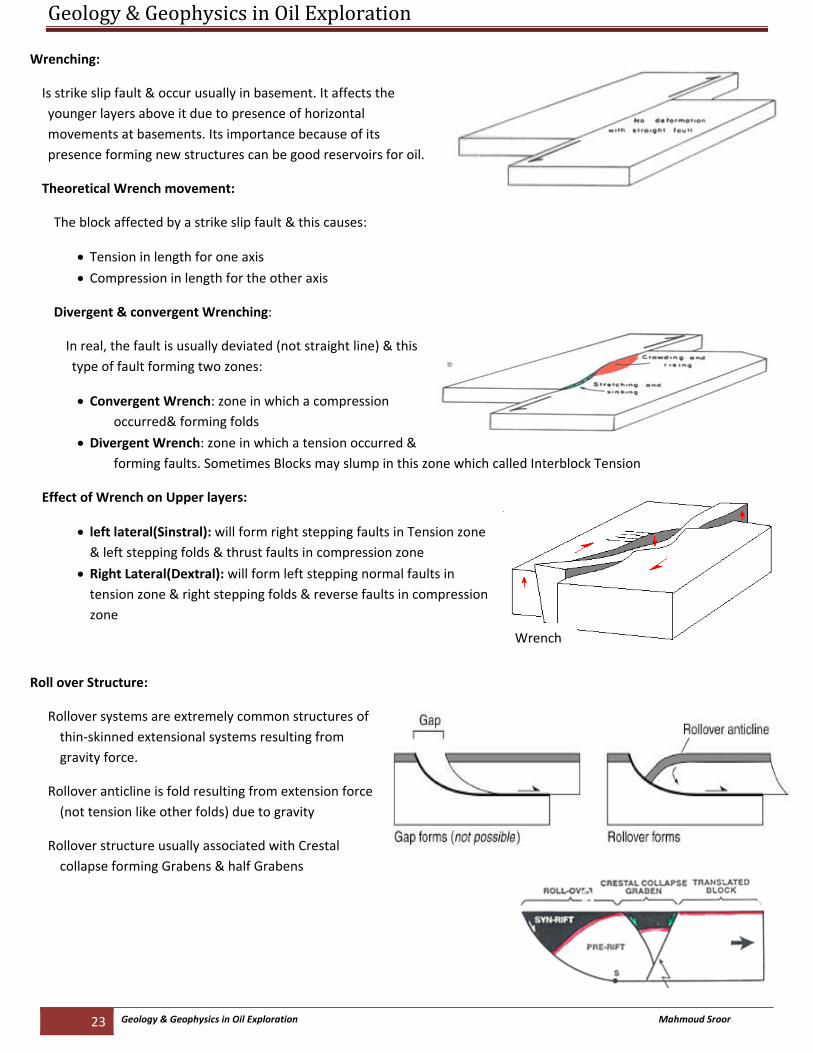
Wrenching:
Is strike slip fault & occur usually in basement. It affects the younger layers above it due to presence of horizontal movements at basements. Its importance because of its presence forming new structures can be good reservoirs for oil.
Theoretical Wrench movement:
The block affected by a strike slip fault & this causes:
• Tension in length for one axis • Compression in length for the other axis
Divergent & convergent Wrenching:
In real, the fault is usually deviated (not straight line) & this type of fault forming two zones:
• Convergent Wrench: zone in which a compression occurred& forming folds
• Divergent Wrench: zone in which a tension occurred & forming faults. Sometimes Blocks may slump in this zone which called Interblock Tension
Effect of Wrench on Upper layers:
• left lateral(Sinstral): will form right stepping faults in Tension zone & left stepping folds & thrust faults in compression zone
• Right Lateral(Dextral): will form left stepping normal faults in tension zone & right stepping folds & reverse faults in compression zone
Roll over Structure:
Rollover systems are extremely common structures of thin‐skinned extensional systems resulting from gravity force.
Rollover anticline is fold resulting from extension force (not tension like other folds) due to gravity
Rollover structure usually associated with Crestal collapse forming Grabens & half Grabens
Wrench
Geo
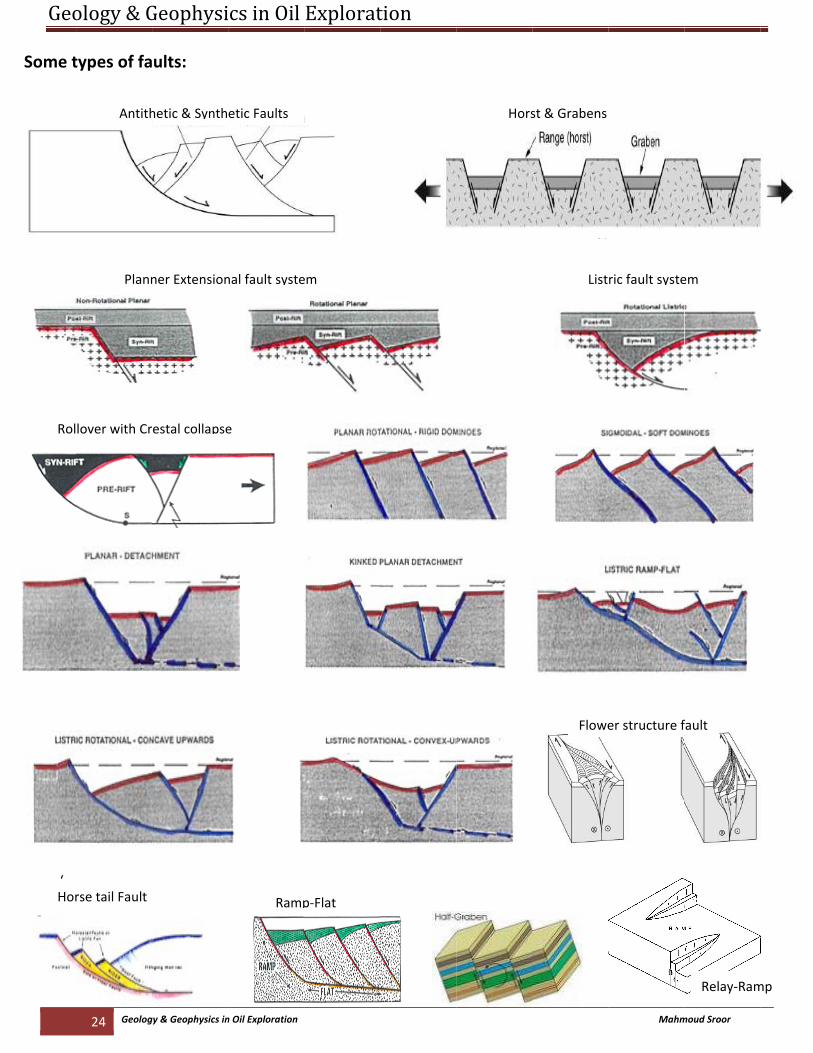
Some t
ttry rertty
‘
Rol
Hor
ology & G
24 Geolog
types of fa
Antith
Plann
lover with Cr
rse tail Fault
Geophysi
gy & Geophysics in
ults:
hetic & Synth
ner Extension
estal collapse
cs in Oil
n Oil Exploration
etic Faults
nal fault syste
e
Ramp
Explorat
em
p‐Flat
tion
Hors
st & Grabens
List
Flowe
Mahm
ric fault syste
er structure f
moud Sroor
em
fault
Relay‐Rammp
Geology & Geophysics in Oil Exploration
25 Geology & Geophysics in Oil Exploration Mahmoud Sroor
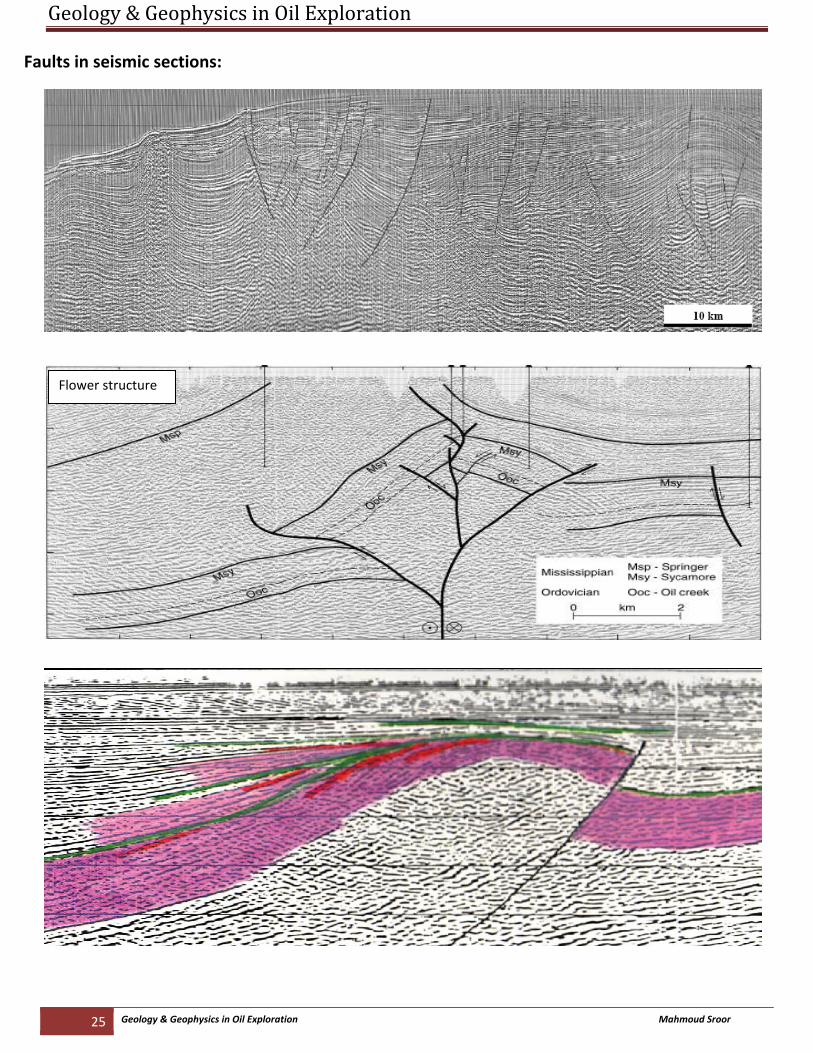
Faults in seismic sections:
Flower structure
Geology & Geophysics in Oil Exploration
26 Geology & Geophysics in Oil Exploration Mahmoud Sroor
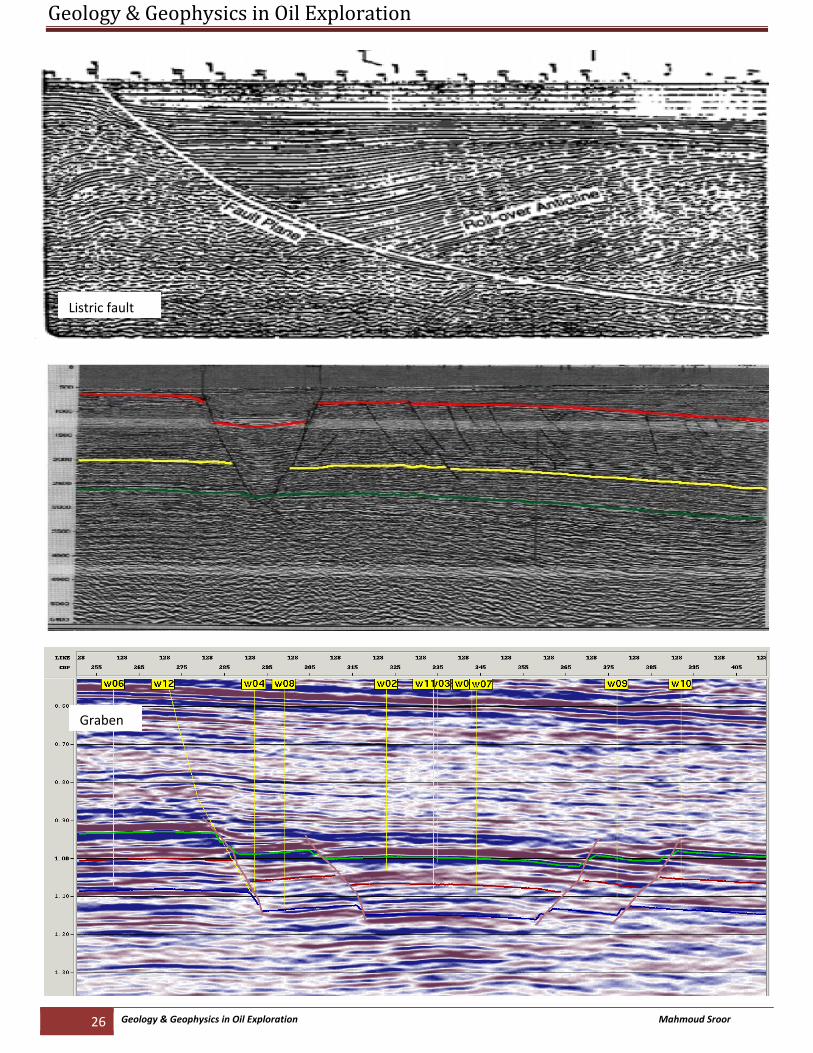
Listric fault
Graben
Geology & Geophysics in Oil Exploration
27 Geology & Geophysics in Oil Exploration Mahmoud Sroor
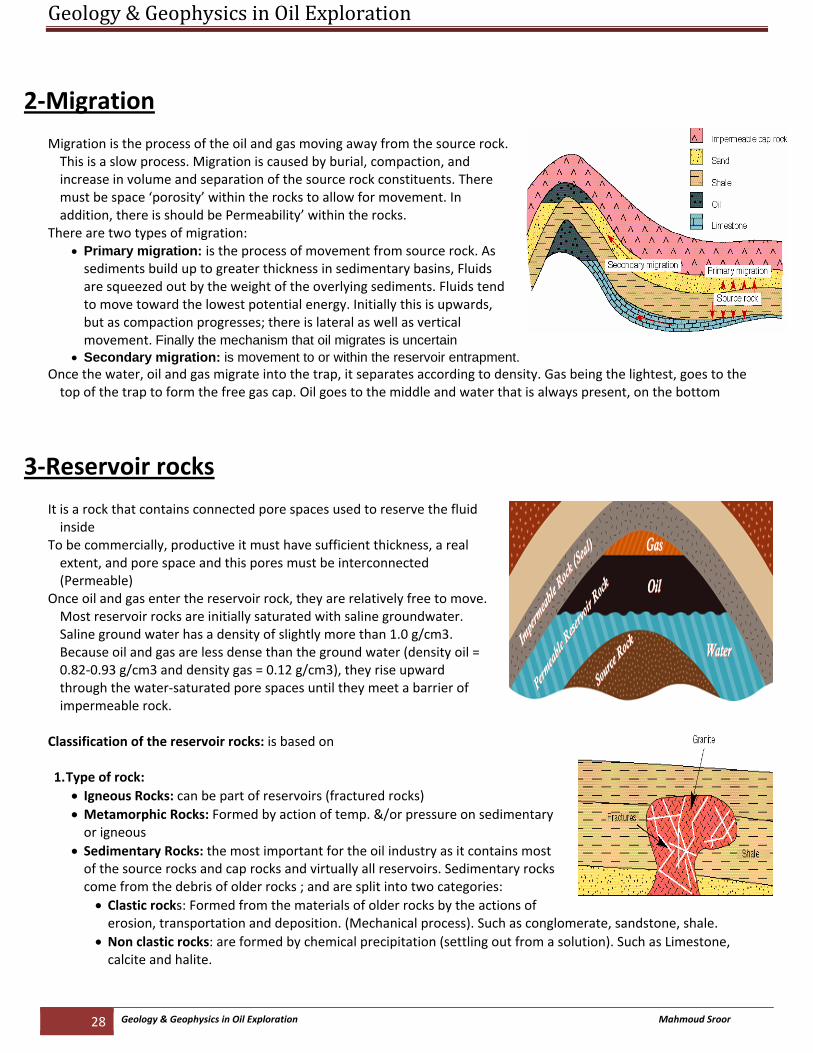
CH4: Petroleum Geology Petroleum geology refers to the specific set of geological disciplines that are applied to the search for hydrocarbons. Oil
and gas fields are geological features that result from the coincident occurrence of four types of geologic features (1) oil and gas source rocks, (2) Migration, (3) reservoir rocks, (4) seals, and (5) traps.
1‐Source rock:
In petroleum geology, source rock refers to rocks from which hydrocarbons have been generated or are capable of being generated. They form one of the necessary elements of a working petroleum system. They are organic‐rich sediments that may have been deposited in a variety of environments including deep water marine, Lacoustrine and deltaic. Oil shale can be regarded as an organic‐rich but immature source rock from which little or no oil has been generated and expelled.
Types of source rocks: are classified from the types of kerogen that they contain
• source rocks are formed from algal remains deposited under anoxic conditions in deep lakes: they tend to generate waxy crude oils when submitted to thermal stress during deep burial
• Source rocks are formed from marine planktonic remains preserved under anoxic conditions in marine environments: they produce both oil and gas when thermally cracked during deep burial.
• Source rocks are formed from terrestrial plant material that has been decomposed by bacteria and fungi under oxic or sub‐oxic conditions: they tend to generate mostly gas with associated light oils when thermally cracked during deep burial. Most coals and coaly shales are generally Type 3 source rocks.
Maturation and expulsion When temperatures of the organic‐rich sedimentary rocks exceed 120o C (250o F) the organic remains within the rocks begin to be "cooked" and oil and natural gas are formed from the organic remains and expelled from the source rock. It takes millions of years for these source rocks to be buried deeply enough to attain these maturation temperatures and additional millions of years to cook (or generate) sufficient volumes of oil and natural gas to form commercial accumulations as the oil and gas are expelled from the source rock into adjacent reservoir rocks.
If the organic materials within the source rock are mostly wood fragments, then the primary hydrocarbons generated upon maturation are natural gas. If the organic materials are mostly algae or the soft parts of land plants, then both oil and natural gas are formed.
Gas can be generated in two ways in the natural systems; it can be generated directly from woody organic matter in the source rocks or it can be derived by thermal breakdown of previously generated oils at high temperatures.
Oil window: oil maturation begins at 120`F (50`C) peaks at 190`F (90`C) & ends at 350`F (175`C). Above and below Oil Window, natural gas is generated. At higher temperatures above 500°F (260°C), the organic material is carbonized & destroyed as a source material. So, if source beds become too deeply buried, no hydrocarbons will be produced.
Geology & Geophysics in Oil Exploration
28 Geology & Geophysics in Oil Exploration Mahmoud Sroor
2‐Migration
Migration is the process of the oil and gas moving away from the source rock. This is a slow process. Migration is caused by burial, compaction, and increase in volume and separation of the source rock constituents. There must be space ‘porosity’ within the rocks to allow for movement. In addition, there is should be Permeability’ within the rocks.
There are two types of migration: • Primary migration: is the process of movement from source rock. As sediments build up to greater thickness in sedimentary basins, Fluids are squeezed out by the weight of the overlying sediments. Fluids tend to move toward the lowest potential energy. Initially this is upwards, but as compaction progresses; there is lateral as well as vertical movement. Finally the mechanism that oil migrates is uncertain
• Secondary migration: is movement to or within the reservoir entrapment. Once the water, oil and gas migrate into the trap, it separates according to density. Gas being the lightest, goes to the top of the trap to form the free gas cap. Oil goes to the middle and water that is always present, on the bottom
3‐Reservoir rocks
It is a rock that contains connected pore spaces used to reserve the fluid inside
To be commercially, productive it must have sufficient thickness, a real extent, and pore space and this pores must be interconnected (Permeable)
Once oil and gas enter the reservoir rock, they are relatively free to move. Most reservoir rocks are initially saturated with saline groundwater. Saline ground water has a density of slightly more than 1.0 g/cm3. Because oil and gas are less dense than the ground water (density oil = 0.82‐0.93 g/cm3 and density gas = 0.12 g/cm3), they rise upward through the water‐saturated pore spaces until they meet a barrier of impermeable rock.
Classification of the reservoir rocks: is based on 1. Type of rock:
• Igneous Rocks: can be part of reservoirs (fractured rocks) • Metamorphic Rocks: Formed by action of temp. &/or pressure on sedimentary or igneous
• Sedimentary Rocks: the most important for the oil industry as it contains most of the source rocks and cap rocks and virtually all reservoirs. Sedimentary rocks come from the debris of older rocks ; and are split into two categories:
• Clastic rocks: Formed from the materials of older rocks by the actions of erosion, transportation and deposition. (Mechanical process). Such as conglomerate, sandstone, shale.
• Non clastic rocks: are formed by chemical precipitation (settling out from a solution). Such as Limestone, calcite and halite.
Geology & Geophysics in Oil Exploration
29 Geology & Geophysics in Oil Exploration Mahmoud Sroor
2. Origin of rock:
• Fragmental reservoir rocks: Aggregates of particles and fragments of the older rocks (called also detrital rock). Fragmental reservoir rocks: (sandstones, Conglomerates, Arkoses, gray wakes) are the most common reservoir rocks. Most of these rocks are siliceous, but many are carbonates such as Oolites and Coquinas.
• Chemical reservoir rocks: It is composed of chemical or biochemical precipitates such as limestone and dolomite not transported as clastic grains. Limestone and dolomite are by far the most important of the chemical reservoir rocks, because they contain nearly half of world's petroleum reservoir.
• Miscellaneous reservoir rocks: It includes igneous and metamorphic rocks. It is geologically important but rarely important commercially. The reservoir space is usually in fractures in the brittle basement rocks.
3.Depositional environment
Sedimentary reservoir rocks may be subdivided into those of marine origin and those of nonmarine, or continental origin but between these classes there are many gradations and intermixtures Most petroleum found in rocks believed to have been deposited under marine conditions, but substantial deposits have also been found in rocks of nonmarine origin.
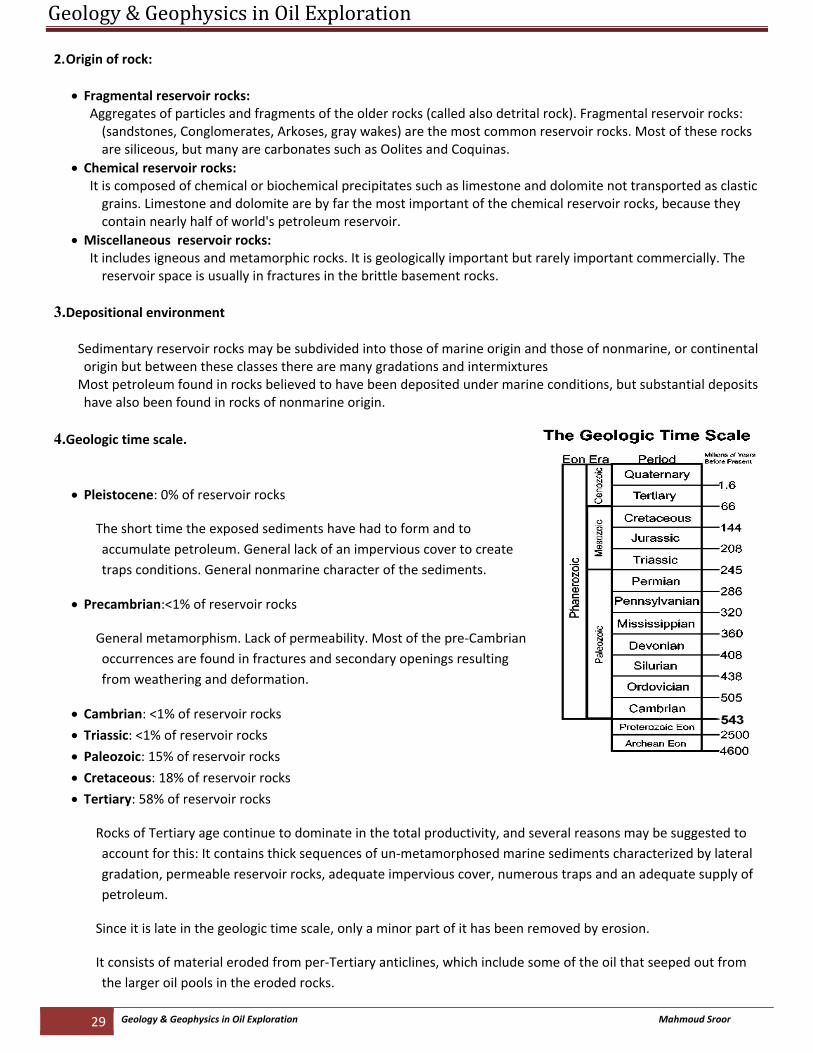
4.Geologic time scale.
• Pleistocene: 0% of reservoir rocks
The short time the exposed sediments have had to form and to accumulate petroleum. General lack of an impervious cover to create traps conditions. General nonmarine character of the sediments.
• Precambrian:<1% of reservoir rocks
General metamorphism. Lack of permeability. Most of the pre‐Cambrian occurrences are found in fractures and secondary openings resulting from weathering and deformation.
• Cambrian: <1% of reservoir rocks
• Triassic: <1% of reservoir rocks • Paleozoic: 15% of reservoir rocks • Cretaceous: 18% of reservoir rocks • Tertiary: 58% of reservoir rocks
Rocks of Tertiary age continue to dominate in the total productivity, and several reasons may be suggested to account for this: It contains thick sequences of un‐metamorphosed marine sediments characterized by lateral gradation, permeable reservoir rocks, adequate impervious cover, numerous traps and an adequate supply of petroleum.
Since it is late in the geologic time scale, only a minor part of it has been removed by erosion.
It consists of material eroded from per‐Tertiary anticlines, which include some of the oil that seeped out from the larger oil pools in the eroded rocks.
Geology & Geophysics in Oil Exploration
30 Geology & Geophysics in Oil Exploration Mahmoud Sroor
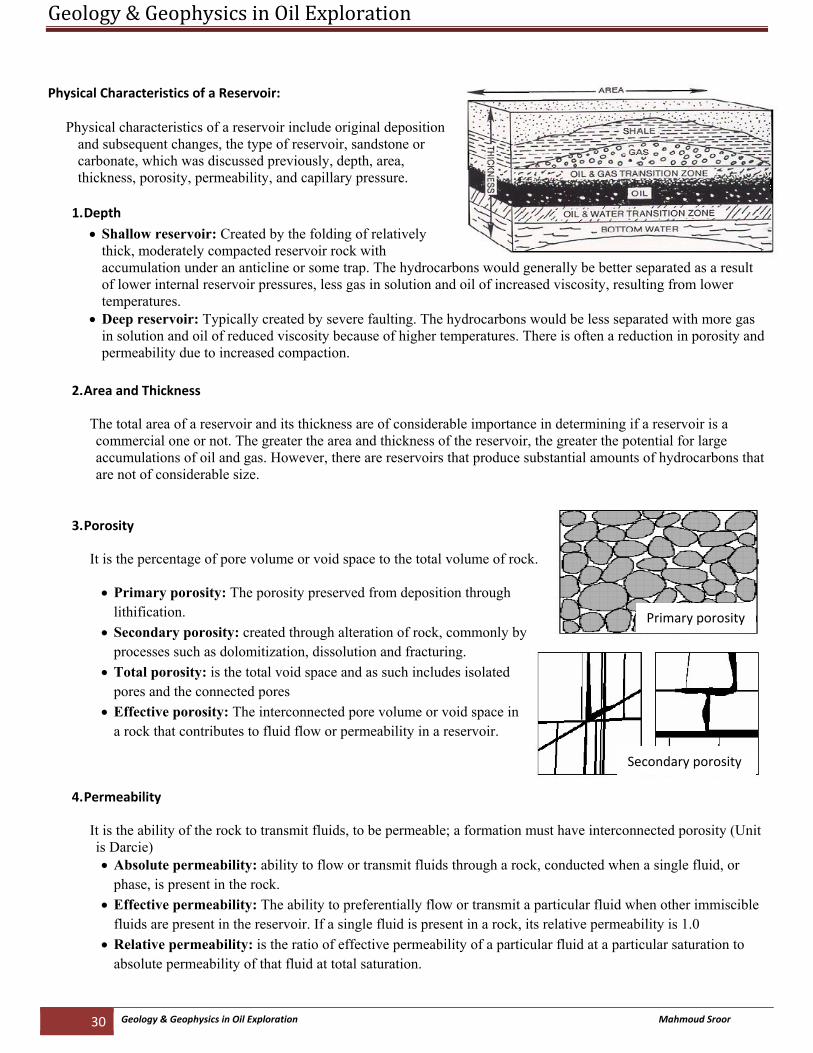
Physical Characteristics of a Reservoir: Physical characteristics of a reservoir include original deposition
and subsequent changes, the type of reservoir, sandstone or carbonate, which was discussed previously, depth, area, thickness, porosity, permeability, and capillary pressure.
1. Depth
• Shallow reservoir: Created by the folding of relatively thick, moderately compacted reservoir rock with accumulation under an anticline or some trap. The hydrocarbons would generally be better separated as a result of lower internal reservoir pressures, less gas in solution and oil of increased viscosity, resulting from lower temperatures.
• Deep reservoir: Typically created by severe faulting. The hydrocarbons would be less separated with more gas in solution and oil of reduced viscosity because of higher temperatures. There is often a reduction in porosity and permeability due to increased compaction.
2. Area and Thickness
The total area of a reservoir and its thickness are of considerable importance in determining if a reservoir is a commercial one or not. The greater the area and thickness of the reservoir, the greater the potential for large accumulations of oil and gas. However, there are reservoirs that produce substantial amounts of hydrocarbons that are not of considerable size.
3. Porosity
It is the percentage of pore volume or void space to the total volume of rock.
• Primary porosity: The porosity preserved from deposition through lithification.
• Secondary porosity: created through alteration of rock, commonly by processes such as dolomitization, dissolution and fracturing.
• Total porosity: is the total void space and as such includes isolated pores and the connected pores
• Effective porosity: The interconnected pore volume or void space in a rock that contributes to fluid flow or permeability in a reservoir.
4. Permeability
It is the ability of the rock to transmit fluids, to be permeable; a formation must have interconnected porosity (Unit is Darcie) • Absolute permeability: ability to flow or transmit fluids through a rock, conducted when a single fluid, or
phase, is present in the rock. • Effective permeability: The ability to preferentially flow or transmit a particular fluid when other immiscible
fluids are present in the reservoir. If a single fluid is present in a rock, its relative permeability is 1.0 • Relative permeability: is the ratio of effective permeability of a particular fluid at a particular saturation to
absolute permeability of that fluid at total saturation.
Primary porosity
Secondary porosity
Geology & Geophysics in Oil Exploration
31 Geology & Geophysics in Oil Exploration Mahmoud Sroor
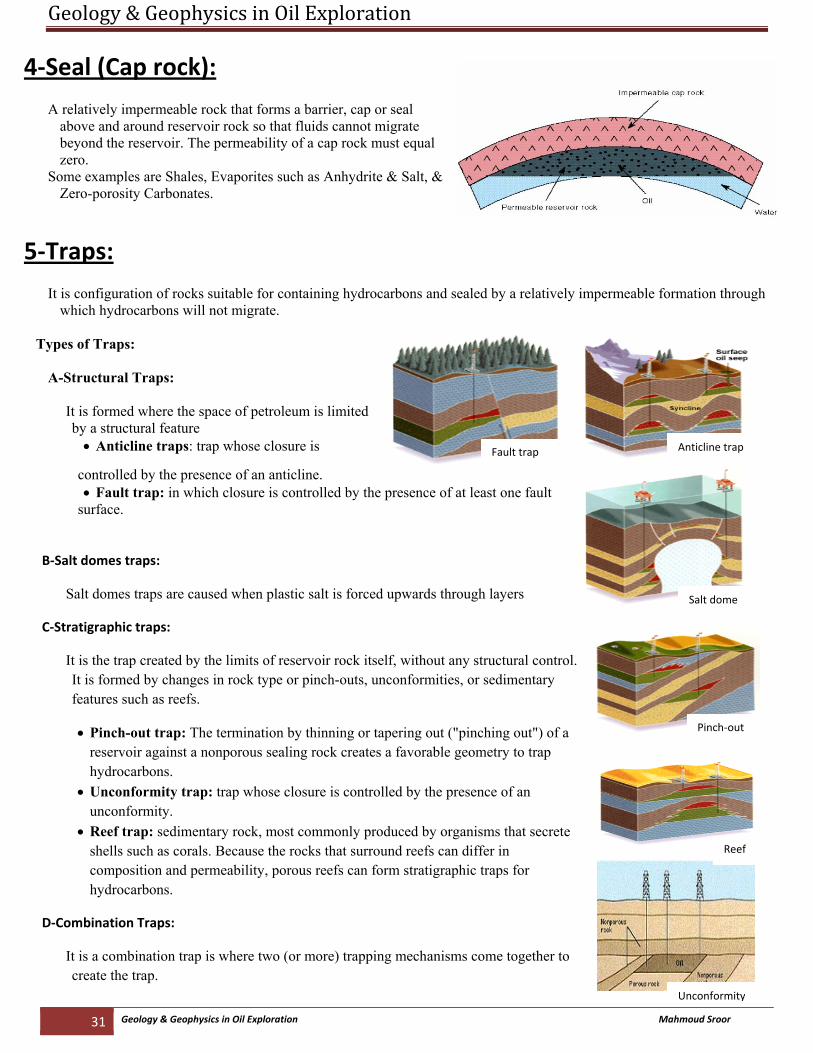
4‐Seal (Cap rock):
A relatively impermeable rock that forms a barrier, cap or seal above and around reservoir rock so that fluids cannot migrate beyond the reservoir. The permeability of a cap rock must equal zero.
Some examples are Shales, Evaporites such as Anhydrite & Salt, & Zero-porosity Carbonates.
5‐Traps:
It is configuration of rocks suitable for containing hydrocarbons and sealed by a relatively impermeable formation through which hydrocarbons will not migrate.
Types of Traps:
A-Structural Traps:
It is formed where the space of petroleum is limited by a structural feature
• Anticline traps: trap whose closure is
controlled by the presence of an anticline. • Fault trap: in which closure is controlled by the presence of at least one fault
surface.
B‐Salt domes traps:
Salt domes traps are caused when plastic salt is forced upwards through layers
C‐Stratigraphic traps:
It is the trap created by the limits of reservoir rock itself, without any structural control. It is formed by changes in rock type or pinch-outs, unconformities, or sedimentary features such as reefs.
• Pinch-out trap: The termination by thinning or tapering out ("pinching out") of a reservoir against a nonporous sealing rock creates a favorable geometry to trap hydrocarbons.
• Unconformity trap: trap whose closure is controlled by the presence of an unconformity.
• Reef trap: sedimentary rock, most commonly produced by organisms that secrete shells such as corals. Because the rocks that surround reefs can differ in composition and permeability, porous reefs can form stratigraphic traps for hydrocarbons.
D‐Combination Traps:
It is a combination trap is where two (or more) trapping mechanisms come together to create the trap.
Fault trap Anticline trap
Salt dome
Pinch‐out
Reef
Unconformity
Geology & Geophysics in Oil Exploration
32 Geology & Geophysics in Oil Exploration Mahmoud Sroor
Ch5: Seismic Survey
Seismic surveys use reflected sound waves to produce a scanning of the Earth’s subsurface. Seismic surveys can help locate ground water, are used to investigate locations for landfills, and characterize how an area will shake during an earthquake, but they are primarily used for oil and gas exploration (Seismic acquisition)
Before starting discussion about Seismic acquisition, we must know some concepts about the seismic theory.
Seismic waves:
Seismic waves are sound waves that travel through the Earth or other elastic bodies, for example as a result of an earthquake, explosion, or some other process that imparts forces.
Types of seismic waves:
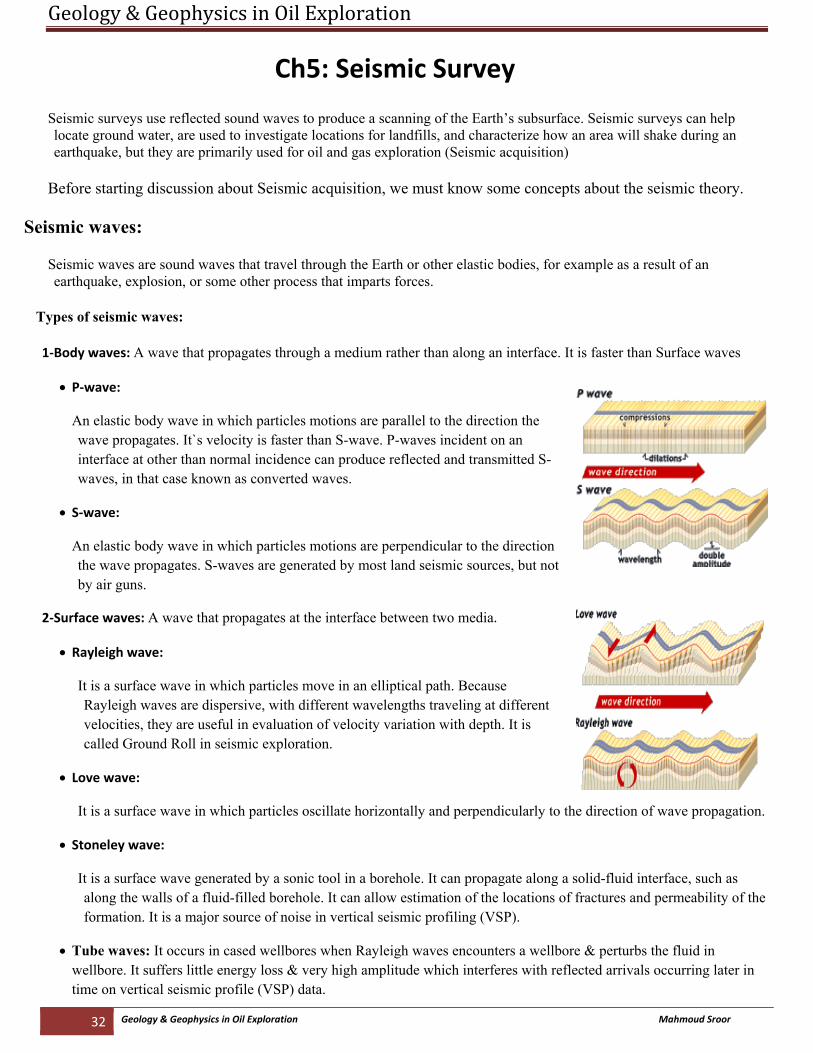
1‐Body waves: A wave that propagates through a medium rather than along an interface. It is faster than Surface waves
• P‐wave:
An elastic body wave in which particles motions are parallel to the direction the wave propagates. It`s velocity is faster than S-wave. P-waves incident on an interface at other than normal incidence can produce reflected and transmitted S-waves, in that case known as converted waves.
• S‐wave:
An elastic body wave in which particles motions are perpendicular to the direction the wave propagates. S-waves are generated by most land seismic sources, but not by air guns.
2‐Surface waves: A wave that propagates at the interface between two media.
• Rayleigh wave:
It is a surface wave in which particles move in an elliptical path. Because Rayleigh waves are dispersive, with different wavelengths traveling at different velocities, they are useful in evaluation of velocity variation with depth. It is called Ground Roll in seismic exploration.
• Love wave:
It is a surface wave in which particles oscillate horizontally and perpendicularly to the direction of wave propagation.
• Stoneley wave:
It is a surface wave generated by a sonic tool in a borehole. It can propagate along a solid-fluid interface, such as along the walls of a fluid-filled borehole. It can allow estimation of the locations of fractures and permeability of the formation. It is a major source of noise in vertical seismic profiling (VSP).
• Tube waves: It occurs in cased wellbores when Rayleigh waves encounters a wellbore & perturbs the fluid in wellbore. It suffers little energy loss & very high amplitude which interferes with reflected arrivals occurring later in time on vertical seismic profile (VSP) data.
Geology & Geophysics in Oil Exploration
33 Geology & Geophysics in Oil Exploration Mahmoud Sroor
Seismic Anisotropy:
It is the variation of seismic velocity with the direction or with wave polarization.
Transverse Isotropy: is the most common & important type of anisotropy in seismic studies.
• Vertical Transverse Isotropy (VTI): the main cause of VTI is the thin layering of shales in subsurface • Horizontal Transverse Isotropy(HTI): main cause of HTI is the presence of vertical aligned fractures
Mediums affect on seismic waves:
1‐Geometrical spreading: The energy intensity decreases when wave front gets farther from the source.
2‐Absorption: Transformation of elastic energy to heat as seismic wave passes through a medium, causes amplitude to decrease
3‐Dispersion: is dependence of seismic velocity on the frequency (is negligible for body waves but very important for surface waves)
4‐Interface‐related effects: when a wave finds an abrupt change in elastic properties, some of energy reflected & some of energy refracted.
Seismic noises:
It is anything other than desired signal. Noise includes disturbances in seismic data caused by any unwanted seismic energy.
• Random noise: random on all traces & includes wind, rain, human & machines (Environment noise) • Coherent noise: include surface waves, refractions, diffractions & multiples
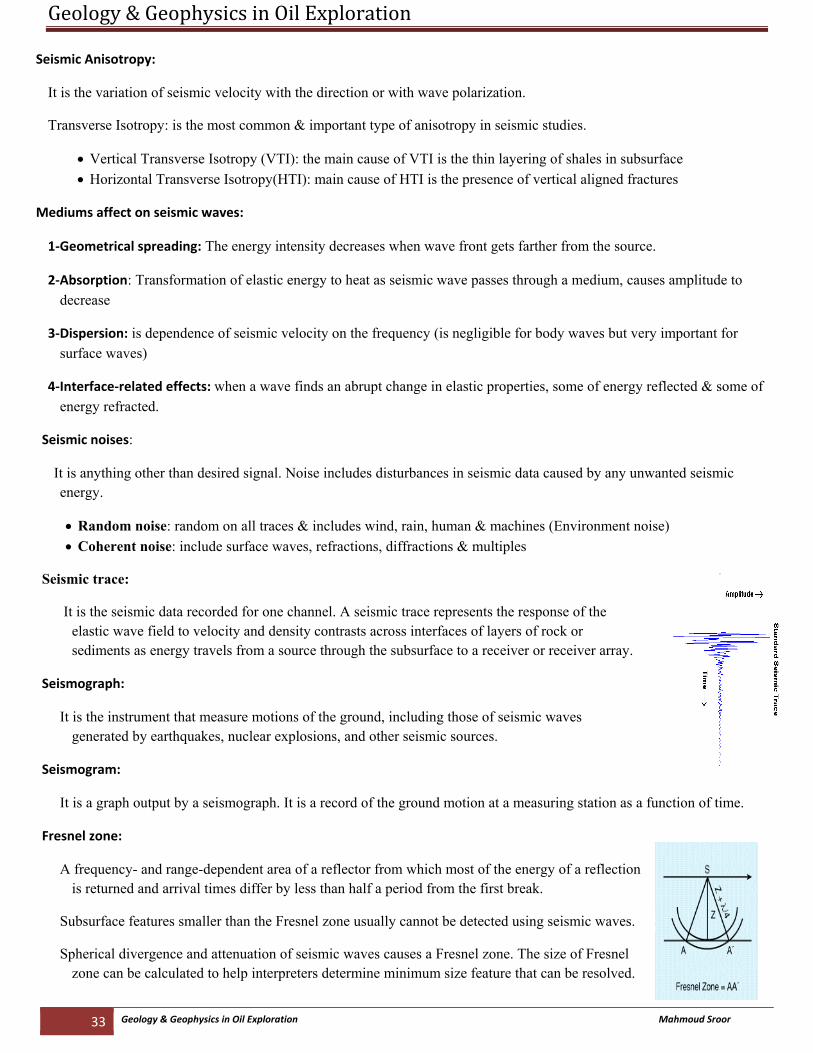
Seismic trace:
It is the seismic data recorded for one channel. A seismic trace represents the response of the elastic wave field to velocity and density contrasts across interfaces of layers of rock or sediments as energy travels from a source through the subsurface to a receiver or receiver array.
Seismograph:
It is the instrument that measure motions of the ground, including those of seismic waves generated by earthquakes, nuclear explosions, and other seismic sources.
Seismogram:
It is a graph output by a seismograph. It is a record of the ground motion at a measuring station as a function of time.
Fresnel zone:
A frequency- and range-dependent area of a reflector from which most of the energy of a reflection is returned and arrival times differ by less than half a period from the first break.
Subsurface features smaller than the Fresnel zone usually cannot be detected using seismic waves.
Spherical divergence and attenuation of seismic waves causes a Fresnel zone. The size of Fresnel zone can be calculated to help interpreters determine minimum size feature that can be resolved.
Geology & Geophysics in Oil Exploration
34 Geology & Geophysics in Oil Exploration Mahmoud Sroor
Seismic Resolution:
It is the ability to distinguish between separate points or objects, such as sedimentary sequences in a seismic section. High frequency and short wavelengths provide better vertical and lateral resolution.
• Vertical resolution: is minimum separation in time or depth to distinguish between two interfaces to show two separate reflectors & depends on dominant frequency, magnitude of events, & Separation between events
• Horizontal resolution: is minimum distance between two features required to distinguish them as two separate features on seismic record. It depends on Receiver spacing, dominant frequency, Velocity, and dip angle.
Seismic events:
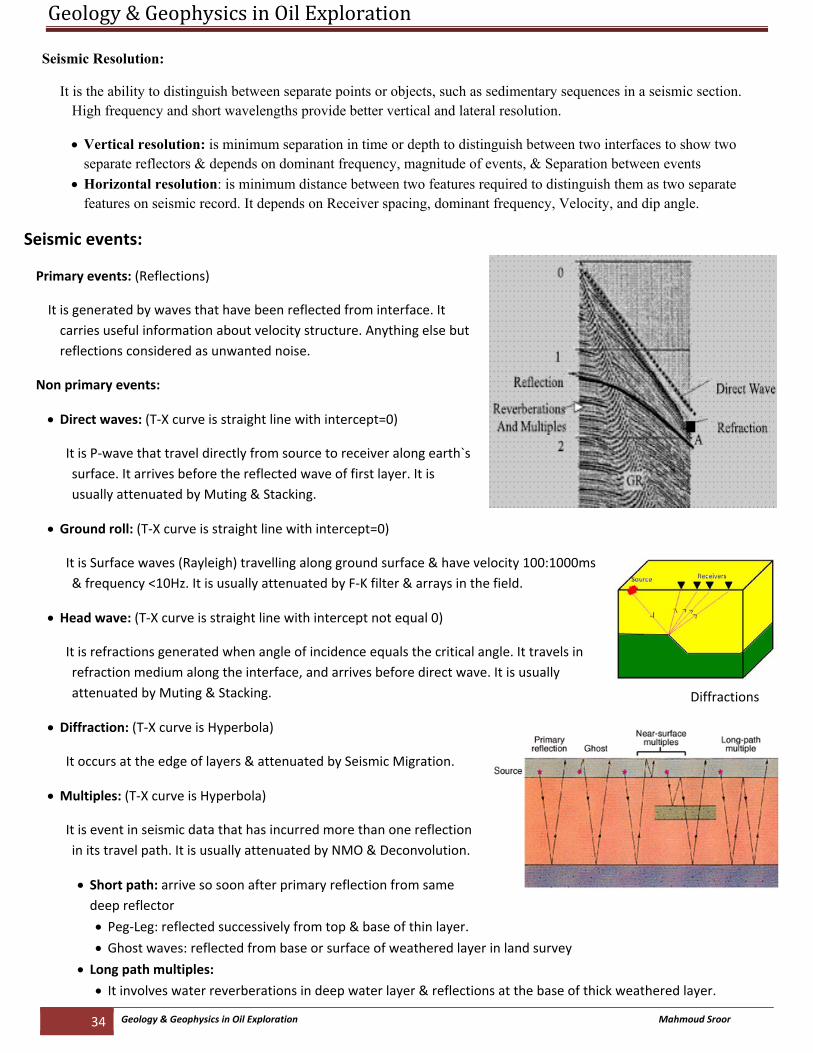
Primary events: (Reflections)
It is generated by waves that have been reflected from interface. It carries useful information about velocity structure. Anything else but reflections considered as unwanted noise.
Non primary events:
• Direct waves: (T‐X curve is straight line with intercept=0)
It is P‐wave that travel directly from source to receiver along earth`s surface. It arrives before the reflected wave of first layer. It is usually attenuated by Muting & Stacking.
• Ground roll: (T‐X curve is straight line with intercept=0)
It is Surface waves (Rayleigh) travelling along ground surface & have velocity 100:1000ms & frequency <10Hz. It is usually attenuated by F‐K filter & arrays in the field.
• Head wave: (T‐X curve is straight line with intercept not equal 0)
It is refractions generated when angle of incidence equals the critical angle. It travels in refraction medium along the interface, and arrives before direct wave. It is usually attenuated by Muting & Stacking.
• Diffraction: (T‐X curve is Hyperbola)
It occurs at the edge of layers & attenuated by Seismic Migration.
• Multiples: (T‐X curve is Hyperbola)
It is event in seismic data that has incurred more than one reflection in its travel path. It is usually attenuated by NMO & Deconvolution.
• Short path: arrive so soon after primary reflection from same deep reflector
• Peg‐Leg: reflected successively from top & base of thin layer.
• Ghost waves: reflected from base or surface of weathered layer in land survey
• Long path multiples:
• It involves water reverberations in deep water layer & reflections at the base of thick weathered layer.
Diffractions
Geology & Geophysics in Oil Exploration
35 Geology & Geophysics in Oil Exploration Mahmoud Sroor
Seismic equipments:
1‐Determining location:
• Land: • Conventional survey instruments such as Thelodolite
• Electromagnetic distance devices (EDM)
• Global positioning system (GPS), which is commonly, used method.
• Marine:
• Radio positioning, Transit satellite positioning • Streamer locations by using Tail Buoy
• Global positioning system
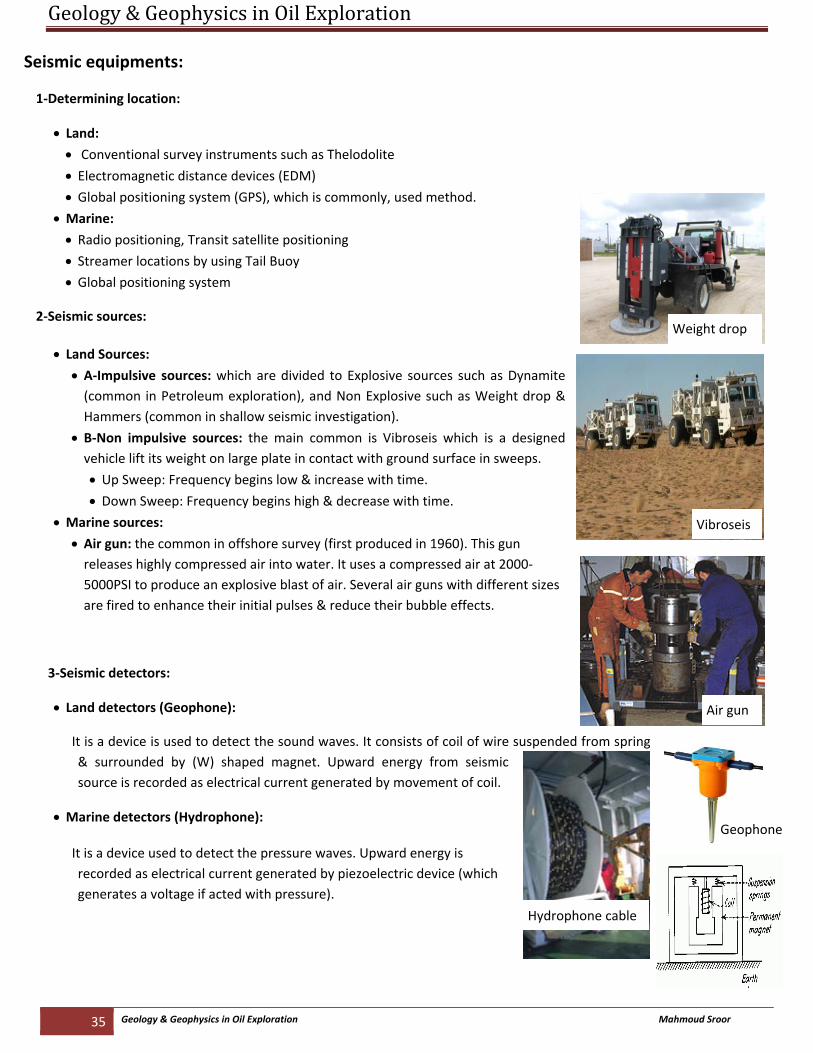
2‐Seismic sources:
• Land Sources: • A‐Impulsive sources: which are divided to Explosive sources such as Dynamite (common in Petroleum exploration), and Non Explosive such as Weight drop & Hammers (common in shallow seismic investigation).
• B‐Non impulsive sources: the main common is Vibroseis which is a designed vehicle lift its weight on large plate in contact with ground surface in sweeps.
• Up Sweep: Frequency begins low & increase with time.
• Down Sweep: Frequency begins high & decrease with time.
• Marine sources:
• Air gun: the common in offshore survey (first produced in 1960). This gun releases highly compressed air into water. It uses a compressed air at 2000‐5000PSI to produce an explosive blast of air. Several air guns with different sizes are fired to enhance their initial pulses & reduce their bubble effects.
3‐Seismic detectors:
• Land detectors (Geophone):
It is a device is used to detect the sound waves. It consists of coil of wire suspended from spring & surrounded by (W) shaped magnet. Upward energy from seismic source is recorded as electrical current generated by movement of coil.
• Marine detectors (Hydrophone):
It is a device used to detect the pressure waves. Upward energy is recorded as electrical current generated by piezoelectric device (which generates a voltage if acted with pressure).
Weight drop
Vibroseis
Air gun
Geophone
Hydrophone cable
Geology & Geophysics in Oil Exploration
36 Geology & Geophysics in Oil Exploration Mahmoud Sroor
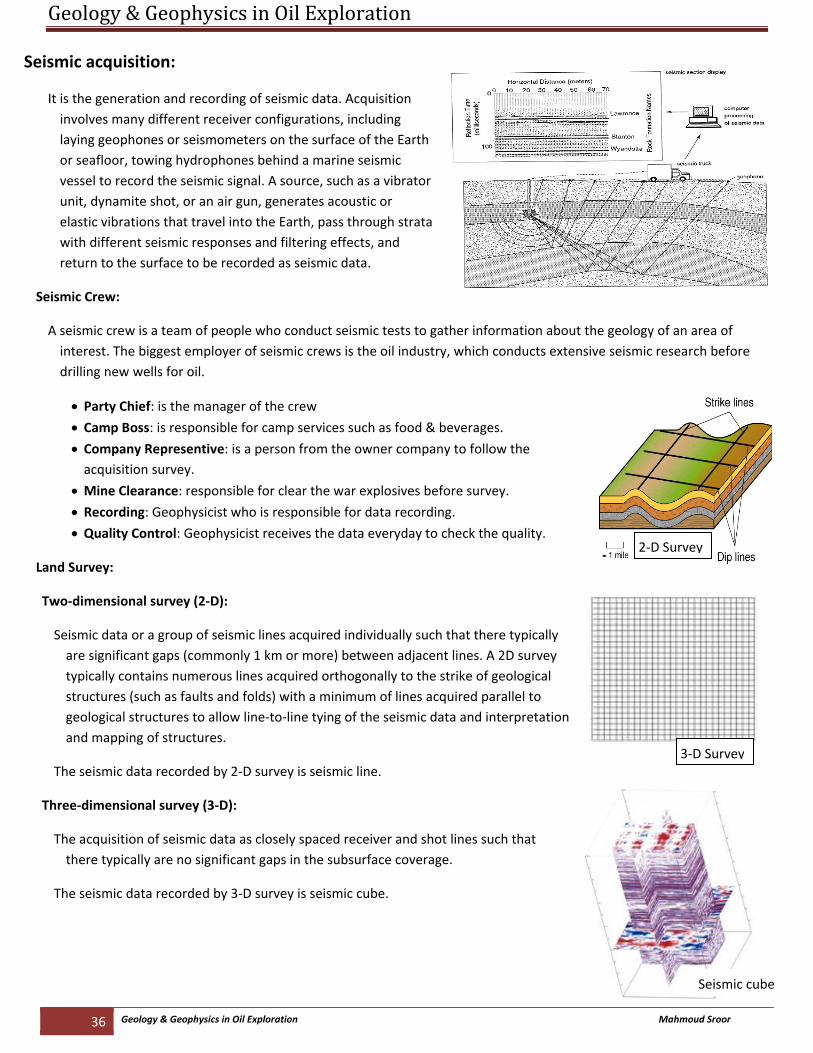
Seismic acquisition:
It is the generation and recording of seismic data. Acquisition involves many different receiver configurations, including laying geophones or seismometers on the surface of the Earth or seafloor, towing hydrophones behind a marine seismic vessel to record the seismic signal. A source, such as a vibrator unit, dynamite shot, or an air gun, generates acoustic or elastic vibrations that travel into the Earth, pass through strata with different seismic responses and filtering effects, and return to the surface to be recorded as seismic data.
Seismic Crew:
A seismic crew is a team of people who conduct seismic tests to gather information about the geology of an area of interest. The biggest employer of seismic crews is the oil industry, which conducts extensive seismic research before drilling new wells for oil.
• Party Chief: is the manager of the crew
• Camp Boss: is responsible for camp services such as food & beverages.
• Company Representive: is a person from the owner company to follow the acquisition survey.
• Mine Clearance: responsible for clear the war explosives before survey.
• Recording: Geophysicist who is responsible for data recording. • Quality Control: Geophysicist receives the data everyday to check the quality.
Land Survey:
Two‐dimensional survey (2‐D):
Seismic data or a group of seismic lines acquired individually such that there typically are significant gaps (commonly 1 km or more) between adjacent lines. A 2D survey typically contains numerous lines acquired orthogonally to the strike of geological structures (such as faults and folds) with a minimum of lines acquired parallel to geological structures to allow line‐to‐line tying of the seismic data and interpretation and mapping of structures.
The seismic data recorded by 2‐D survey is seismic line.
Three‐dimensional survey (3‐D):
The acquisition of seismic data as closely spaced receiver and shot lines such that there typically are no significant gaps in the subsurface coverage.
The seismic data recorded by 3‐D survey is seismic cube.
2‐D Survey
3‐D Survey
Seismic cube
Geology & Geophysics in Oil Exploration
37 Geology & Geophysics in Oil Exploration Mahmoud Sroor
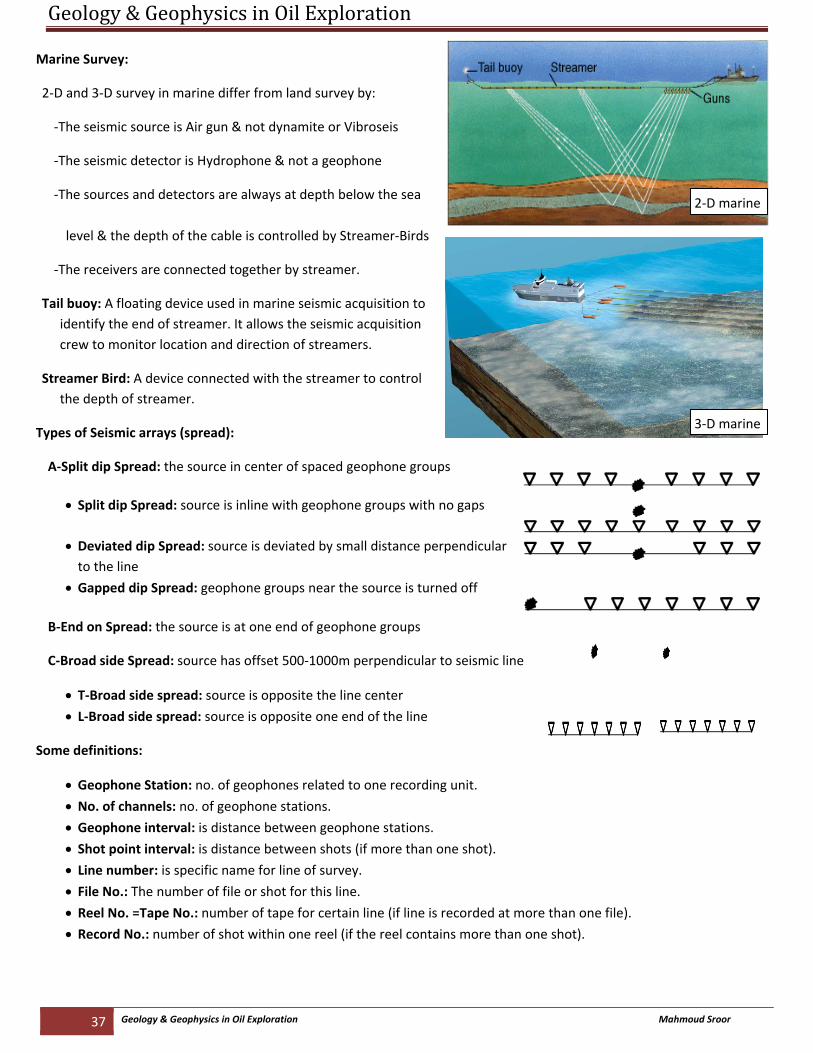
Marine Survey:
2‐D and 3‐D survey in marine differ from land survey by:
‐The seismic source is Air gun & not dynamite or Vibroseis
‐The seismic detector is Hydrophone & not a geophone
‐The sources and detectors are always at depth below the sea
level & the depth of the cable is controlled by Streamer‐Birds
‐The receivers are connected together by streamer.
Tail buoy: A floating device used in marine seismic acquisition to identify the end of streamer. It allows the seismic acquisition crew to monitor location and direction of streamers.
Streamer Bird: A device connected with the streamer to control the depth of streamer.
Types of Seismic arrays (spread):
A‐Split dip Spread: the source in center of spaced geophone groups
• Split dip Spread: source is inline with geophone groups with no gaps
• Deviated dip Spread: source is deviated by small distance perpendicular to the line
• Gapped dip Spread: geophone groups near the source is turned off
B‐End on Spread: the source is at one end of geophone groups
C‐Broad side Spread: source has offset 500‐1000m perpendicular to seismic line
• T‐Broad side spread: source is opposite the line center • L‐Broad side spread: source is opposite one end of the line
Some definitions:
• Geophone Station: no. of geophones related to one recording unit. • No. of channels: no. of geophone stations. • Geophone interval: is distance between geophone stations. • Shot point interval: is distance between shots (if more than one shot).
• Line number: is specific name for line of survey.
• File No.: The number of file or shot for this line.
• Reel No. =Tape No.: number of tape for certain line (if line is recorded at more than one file).
• Record No.: number of shot within one reel (if the reel contains more than one shot).
3‐D marine
2‐D marine
Geology & Geophysics in Oil Exploration
38 Geology & Geophysics in Oil Exploration Mahmoud Sroor
Ch6: Seismic Data Processing Alteration of seismic data to suppress noise, enhance signal and migrate seismic events to the appropriate location in space. Processing steps typically include analysis of velocities and frequencies, static corrections, Deconvolution, normal moveout, dip moveout, stacking, and migration, which can be performed before or after stacking. Seismic processing facilitates better interpretation because subsurface structures and reflection geometries are more apparent.
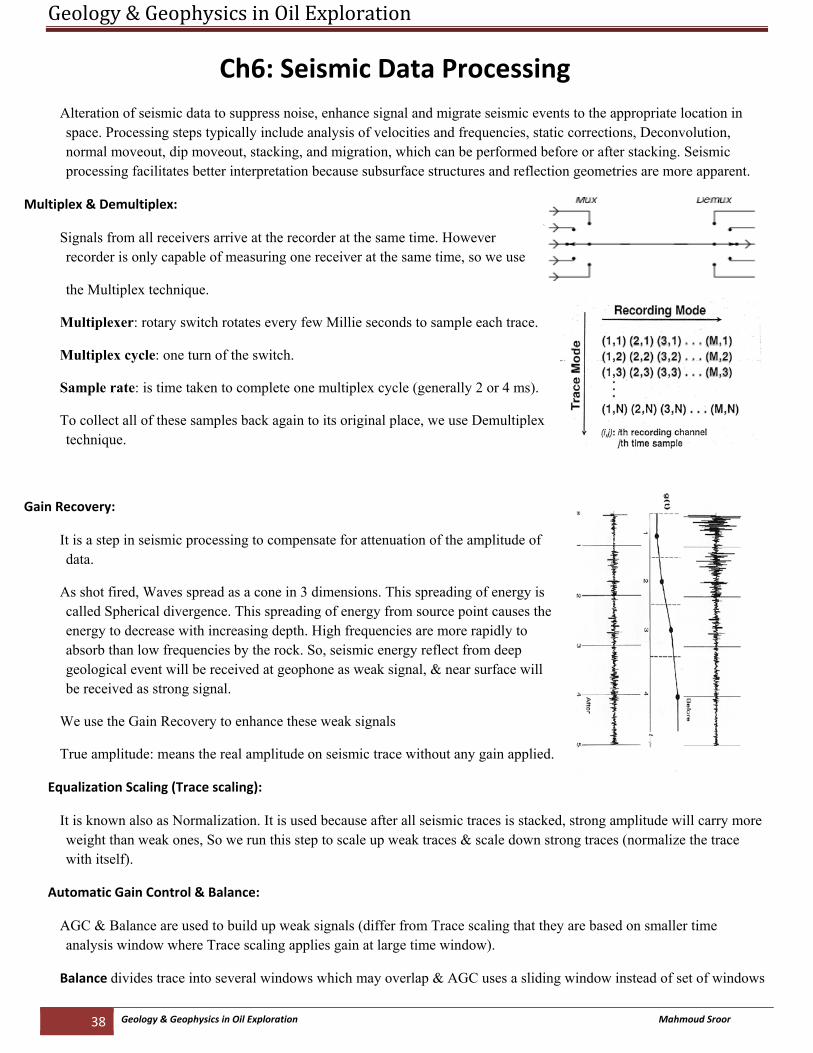
Multiplex & Demultiplex:
Signals from all receivers arrive at the recorder at the same time. However recorder is only capable of measuring one receiver at the same time, so we use
the Multiplex technique.
Multiplexer: rotary switch rotates every few Millie seconds to sample each trace.
Multiplex cycle: one turn of the switch.
Sample rate: is time taken to complete one multiplex cycle (generally 2 or 4 ms).
To collect all of these samples back again to its original place, we use Demultiplex technique.
Gain Recovery:
It is a step in seismic processing to compensate for attenuation of the amplitude of data.
As shot fired, Waves spread as a cone in 3 dimensions. This spreading of energy is called Spherical divergence. This spreading of energy from source point causes the energy to decrease with increasing depth. High frequencies are more rapidly to absorb than low frequencies by the rock. So, seismic energy reflect from deep geological event will be received at geophone as weak signal, & near surface will be received as strong signal.
We use the Gain Recovery to enhance these weak signals
True amplitude: means the real amplitude on seismic trace without any gain applied.
Equalization Scaling (Trace scaling):
It is known also as Normalization. It is used because after all seismic traces is stacked, strong amplitude will carry more weight than weak ones, So we run this step to scale up weak traces & scale down strong traces (normalize the trace with itself).
Automatic Gain Control & Balance:
AGC & Balance are used to build up weak signals (differ from Trace scaling that they are based on smaller time analysis window where Trace scaling applies gain at large time window).
Balance divides trace into several windows which may overlap & AGC uses a sliding window instead of set of windows
Geology & Geophysics in Oil Exploration
39 Geology & Geophysics in Oil Exploration Mahmoud Sroor
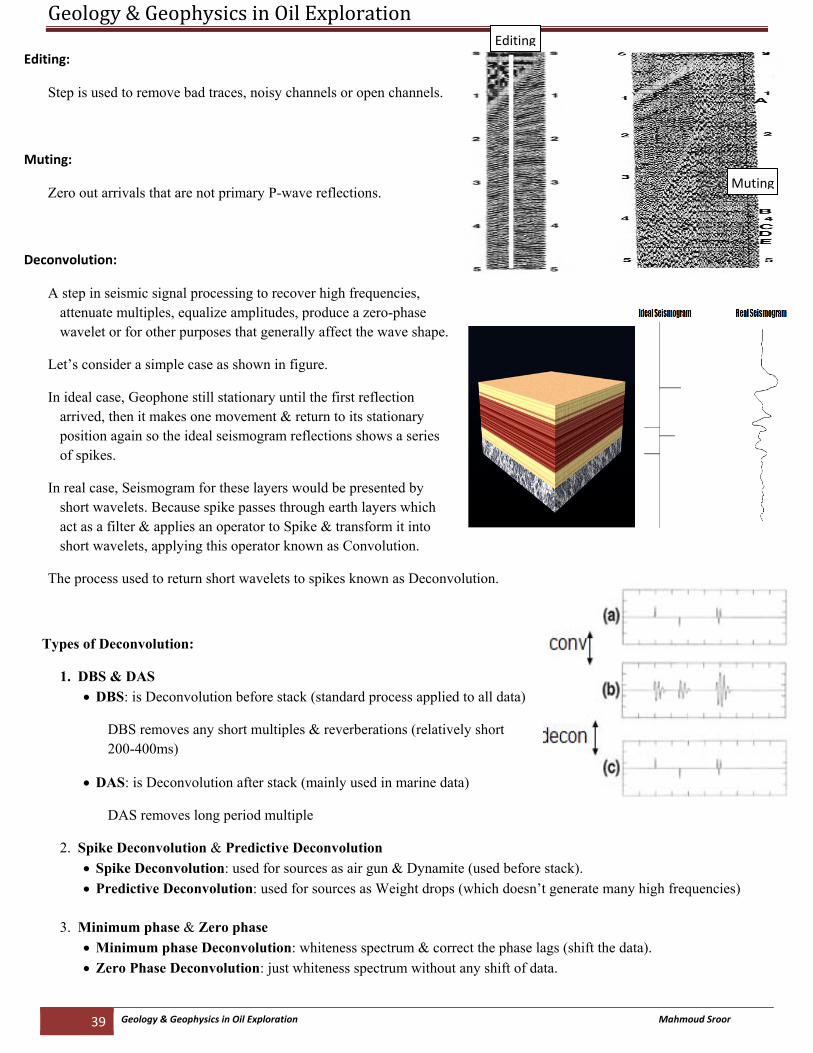
Editing:
Step is used to remove bad traces, noisy channels or open channels.
Muting:
Zero out arrivals that are not primary P-wave reflections.
Deconvolution:
A step in seismic signal processing to recover high frequencies, attenuate multiples, equalize amplitudes, produce a zero-phase wavelet or for other purposes that generally affect the wave shape.
Let’s consider a simple case as shown in figure.
In ideal case, Geophone still stationary until the first reflection arrived, then it makes one movement & return to its stationary position again so the ideal seismogram reflections shows a series of spikes.
In real case, Seismogram for these layers would be presented by short wavelets. Because spike passes through earth layers which act as a filter & applies an operator to Spike & transform it into short wavelets, applying this operator known as Convolution.
The process used to return short wavelets to spikes known as Deconvolution.
Types of Deconvolution:
1. DBS & DAS • DBS: is Deconvolution before stack (standard process applied to all data)
DBS removes any short multiples & reverberations (relatively short 200-400ms)
• DAS: is Deconvolution after stack (mainly used in marine data)
DAS removes long period multiple
2. Spike Deconvolution & Predictive Deconvolution • Spike Deconvolution: used for sources as air gun & Dynamite (used before stack). • Predictive Deconvolution: used for sources as Weight drops (which doesn’t generate many high frequencies)
3. Minimum phase & Zero phase
• Minimum phase Deconvolution: whiteness spectrum & correct the phase lags (shift the data). • Zero Phase Deconvolution: just whiteness spectrum without any shift of data.
Editing
Muting
Geology & Geophysics in Oil Exploration
40 Geology & Geophysics in Oil Exploration Mahmoud Sroor
Filtering:
A process or algorithm using a set of limits used to eliminate unwanted portions of seismic data, commonly on the basis of frequency or amplitude, to enhance the signal-to-noise ratio of the data or to achieve Deconvolution.
The common use of digital filter in data processing is to filter out unwanted frequencies.
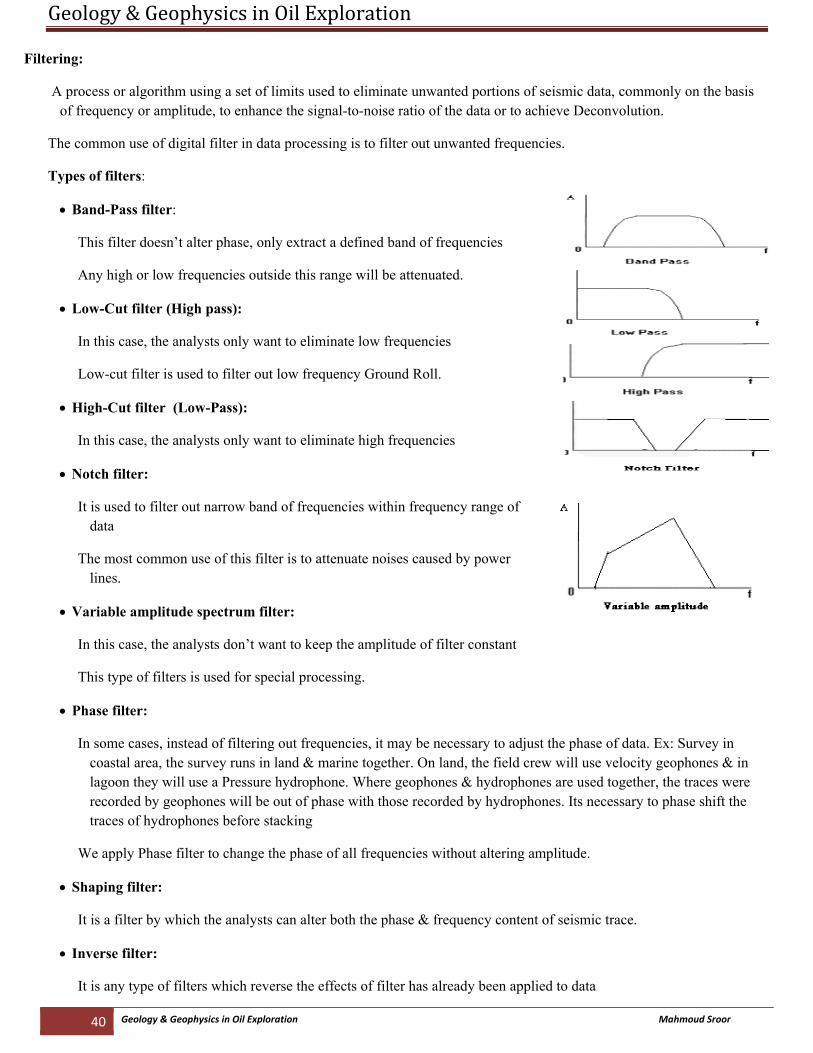
Types of filters:
• Band-Pass filter:
This filter doesn’t alter phase, only extract a defined band of frequencies
Any high or low frequencies outside this range will be attenuated.
• Low-Cut filter (High pass):
In this case, the analysts only want to eliminate low frequencies
Low-cut filter is used to filter out low frequency Ground Roll.
• High-Cut filter (Low-Pass):
In this case, the analysts only want to eliminate high frequencies
• Notch filter:
It is used to filter out narrow band of frequencies within frequency range of data
The most common use of this filter is to attenuate noises caused by power lines.
• Variable amplitude spectrum filter:
In this case, the analysts don’t want to keep the amplitude of filter constant
This type of filters is used for special processing.
• Phase filter:
In some cases, instead of filtering out frequencies, it may be necessary to adjust the phase of data. Ex: Survey in coastal area, the survey runs in land & marine together. On land, the field crew will use velocity geophones & in lagoon they will use a Pressure hydrophone. Where geophones & hydrophones are used together, the traces were recorded by geophones will be out of phase with those recorded by hydrophones. Its necessary to phase shift the traces of hydrophones before stacking
We apply Phase filter to change the phase of all frequencies without altering amplitude.
• Shaping filter:
It is a filter by which the analysts can alter both the phase & frequency content of seismic trace.
• Inverse filter:
It is any type of filters which reverse the effects of filter has already been applied to data
Geology & Geophysics in Oil Exploration
41 Geology & Geophysics in Oil Exploration Mahmoud Sroor
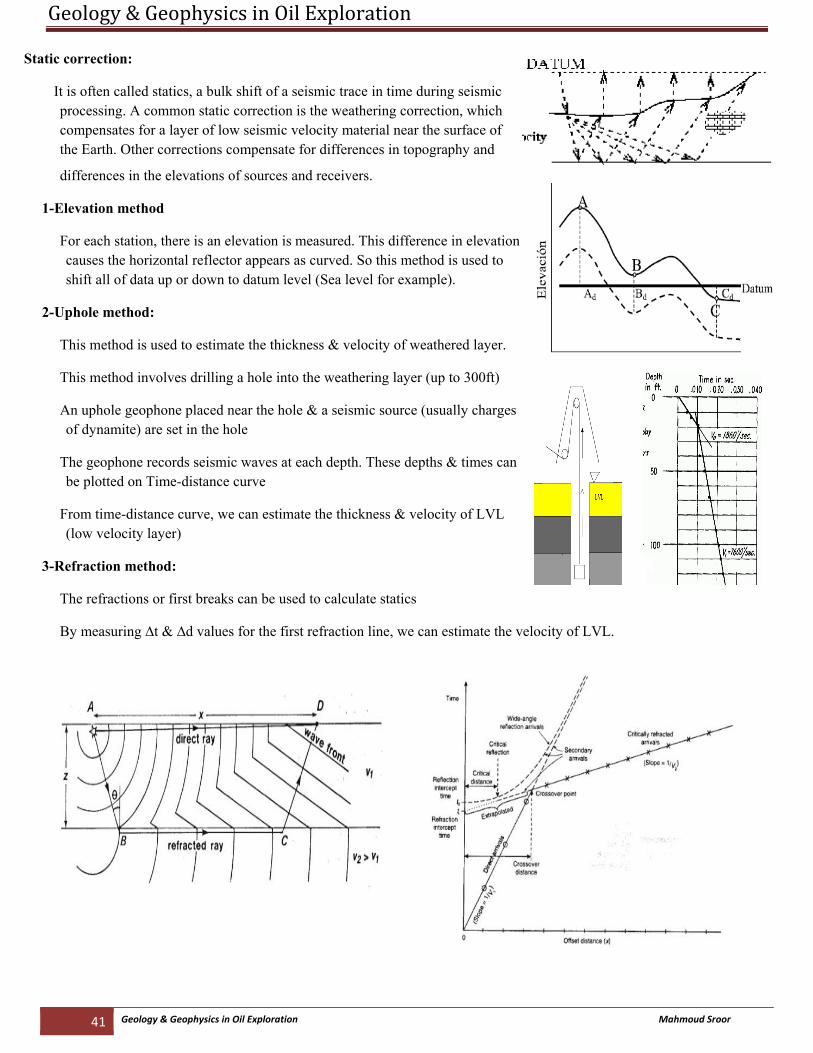
Static correction:
It is often called statics, a bulk shift of a seismic trace in time during seismic processing. A common static correction is the weathering correction, which compensates for a layer of low seismic velocity material near the surface of the Earth. Other corrections compensate for differences in topography and
differences in the elevations of sources and receivers.
1-Elevation method
For each station, there is an elevation is measured. This difference in elevation causes the horizontal reflector appears as curved. So this method is used to shift all of data up or down to datum level (Sea level for example).
2-Uphole method:
This method is used to estimate the thickness & velocity of weathered layer.
This method involves drilling a hole into the weathering layer (up to 300ft)
An uphole geophone placed near the hole & a seismic source (usually charges of dynamite) are set in the hole
The geophone records seismic waves at each depth. These depths & times can be plotted on Time-distance curve
From time-distance curve, we can estimate the thickness & velocity of LVL (low velocity layer)
3-Refraction method:
The refractions or first breaks can be used to calculate statics
By measuring ∆t & ∆d values for the first refraction line, we can estimate the velocity of LVL.
Geology & Geophysics in Oil Exploration
42 Geology & Geophysics in Oil Exploration Mahmoud Sroor
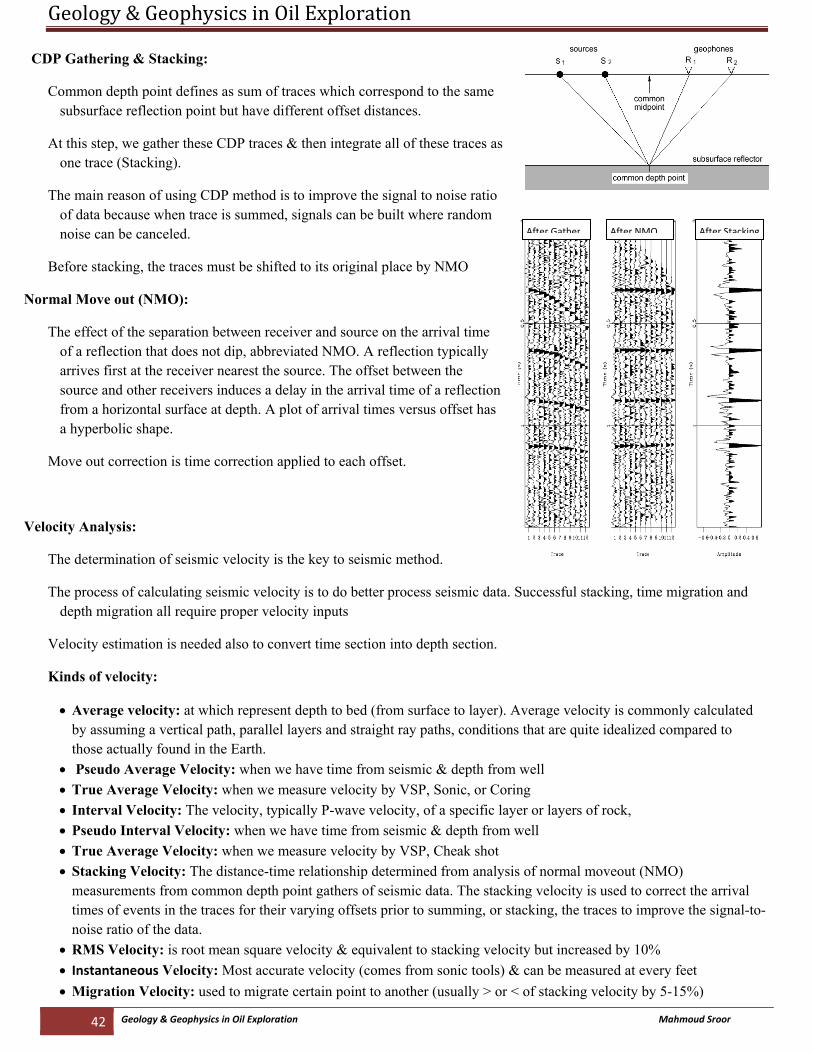
CDP Gathering & Stacking:
Common depth point defines as sum of traces which correspond to the same subsurface reflection point but have different offset distances.
At this step, we gather these CDP traces & then integrate all of these traces as one trace (Stacking).
The main reason of using CDP method is to improve the signal to noise ratio of data because when trace is summed, signals can be built where random noise can be canceled.
Before stacking, the traces must be shifted to its original place by NMO
Normal Move out (NMO):
The effect of the separation between receiver and source on the arrival time of a reflection that does not dip, abbreviated NMO. A reflection typically arrives first at the receiver nearest the source. The offset between the source and other receivers induces a delay in the arrival time of a reflection from a horizontal surface at depth. A plot of arrival times versus offset has a hyperbolic shape.
Move out correction is time correction applied to each offset.
Velocity Analysis:
The determination of seismic velocity is the key to seismic method.
The process of calculating seismic velocity is to do better process seismic data. Successful stacking, time migration and depth migration all require proper velocity inputs
Velocity estimation is needed also to convert time section into depth section.
Kinds of velocity:
• Average velocity: at which represent depth to bed (from surface to layer). Average velocity is commonly calculated by assuming a vertical path, parallel layers and straight ray paths, conditions that are quite idealized compared to those actually found in the Earth.
• Pseudo Average Velocity: when we have time from seismic & depth from well • True Average Velocity: when we measure velocity by VSP, Sonic, or Coring • Interval Velocity: The velocity, typically P-wave velocity, of a specific layer or layers of rock, • Pseudo Interval Velocity: when we have time from seismic & depth from well • True Average Velocity: when we measure velocity by VSP, Cheak shot • Stacking Velocity: The distance-time relationship determined from analysis of normal moveout (NMO)
measurements from common depth point gathers of seismic data. The stacking velocity is used to correct the arrival times of events in the traces for their varying offsets prior to summing, or stacking, the traces to improve the signal-to-noise ratio of the data.
• RMS Velocity: is root mean square velocity & equivalent to stacking velocity but increased by 10% • Instantaneous Velocity: Most accurate velocity (comes from sonic tools) & can be measured at every feet • Migration Velocity: used to migrate certain point to another (usually > or < of stacking velocity by 5-15%)
After Gather After NMO After Stacking
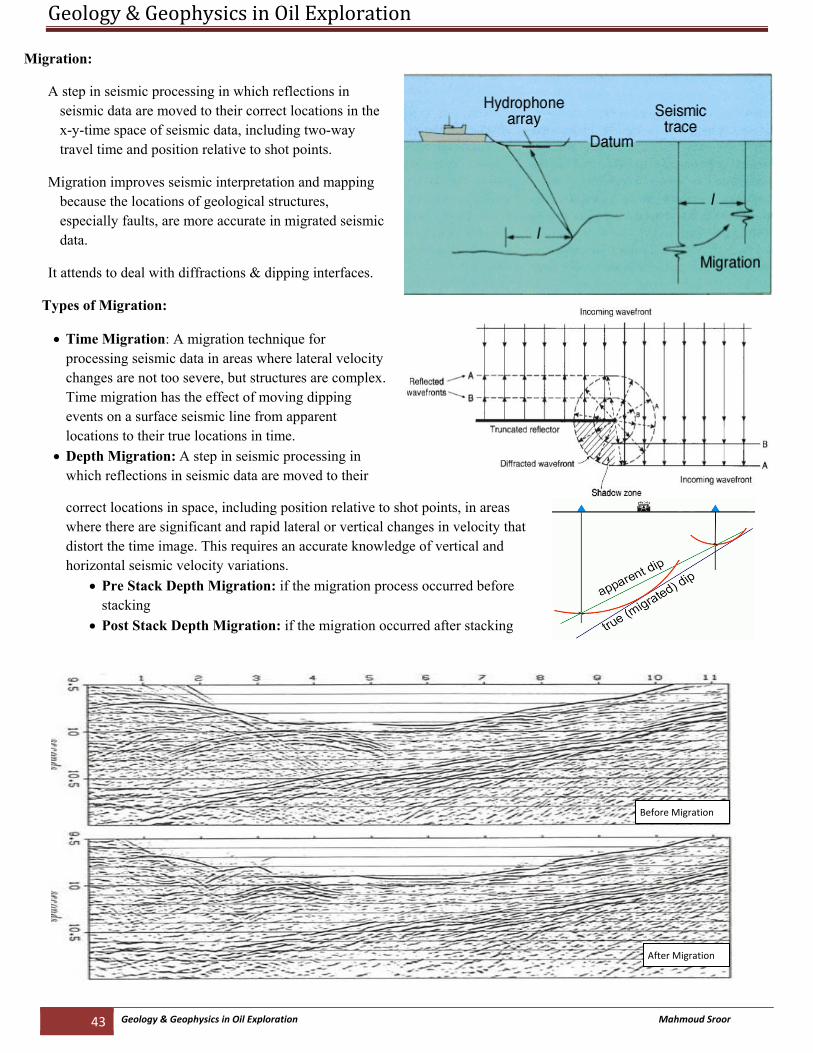
Geology & Geophysics in Oil Exploration
43 Geology & Geophysics in Oil Exploration Mahmoud Sroor
Migration:
A step in seismic processing in which reflections in seismic data are moved to their correct locations in the x-y-time space of seismic data, including two-way travel time and position relative to shot points.
Migration improves seismic interpretation and mapping because the locations of geological structures, especially faults, are more accurate in migrated seismic data.
It attends to deal with diffractions & dipping interfaces.
Types of Migration:
• Time Migration: A migration technique for processing seismic data in areas where lateral velocity changes are not too severe, but structures are complex. Time migration has the effect of moving dipping events on a surface seismic line from apparent locations to their true locations in time.
• Depth Migration: A step in seismic processing in which reflections in seismic data are moved to their
correct locations in space, including position relative to shot points, in areas where there are significant and rapid lateral or vertical changes in velocity that distort the time image. This requires an accurate knowledge of vertical and horizontal seismic velocity variations.
• Pre Stack Depth Migration: if the migration process occurred before stacking
• Post Stack Depth Migration: if the migration occurred after stacking
Before Migration
After Migration
Geology & Geophysics in Oil Exploration
44 Geology & Geophysics in Oil Exploration Mahmoud Sroor
Post Stack Processing:
Sometimes, we have a seismic section & already had been processed in past but we need to enhance & filtering this data again.
Usually, this data came in seismic section papers (not in tapes), So at first we scan this data & convert it to SEG-Y format by Victorization process.
Sometimes also, we digitize the shot point maps & put X-Y directions in the SEG-Y trace header.
Post Stack Processing steps:
• Resampling: convert the trace into digital form (or from 2ms to 2ms for example). • Interpolation: is to estimate a synthetic trace between two traces. • AGC & Trace Balance: is automatic gain control is used to build up weak signals. • Trace Mix: control the gain like AGC but laterally (from trace to other). • Migration: apllies both Prestack Migration & Poststack Migration.
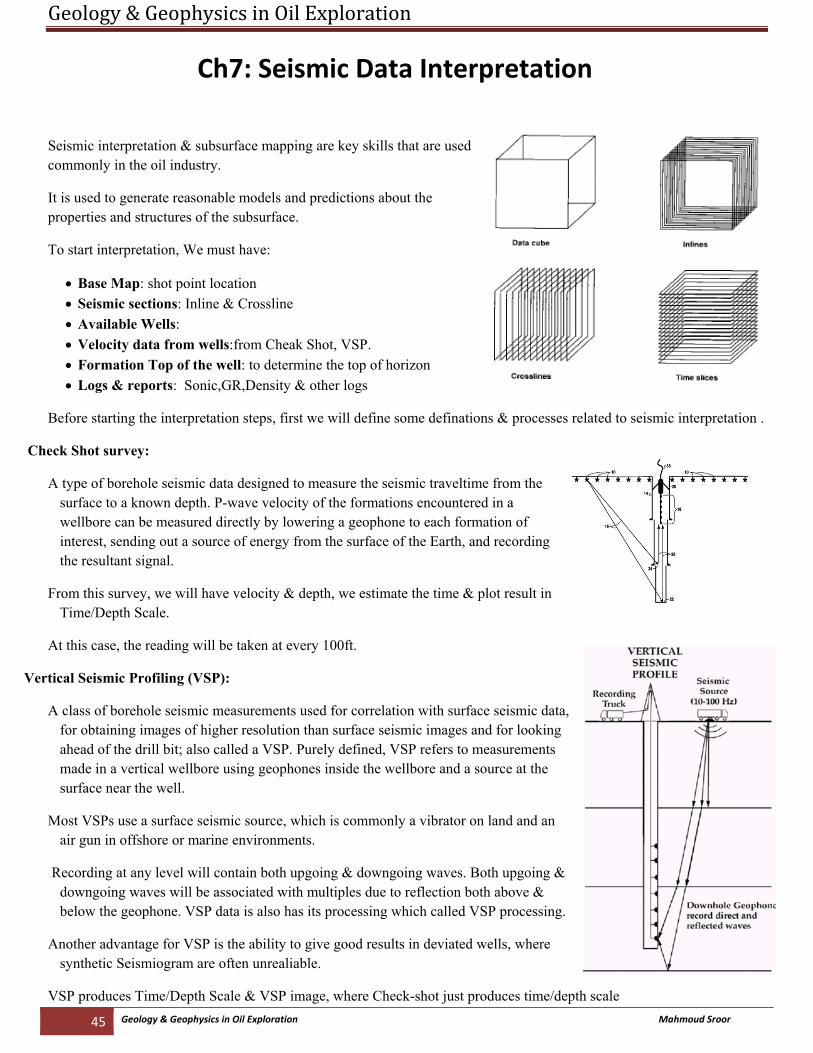
Geology & Geophysics in Oil Exploration
45 Geology & Geophysics in Oil Exploration Mahmoud Sroor
Ch7: Seismic Data Interpretation
Seismic interpretation & subsurface mapping are key skills that are used commonly in the oil industry.
It is used to generate reasonable models and predictions about the properties and structures of the subsurface.
To start interpretation, We must have:
• Base Map: shot point location • Seismic sections: Inline & Crossline • Available Wells: • Velocity data from wells:from Cheak Shot, VSP. • Formation Top of the well: to determine the top of horizon • Logs & reports: Sonic,GR,Density & other logs
Before starting the interpretation steps, first we will define some definations & processes related to seismic interpretation .
Check Shot survey:
A type of borehole seismic data designed to measure the seismic traveltime from the surface to a known depth. P-wave velocity of the formations encountered in a wellbore can be measured directly by lowering a geophone to each formation of interest, sending out a source of energy from the surface of the Earth, and recording the resultant signal.
From this survey, we will have velocity & depth, we estimate the time & plot result in Time/Depth Scale.
At this case, the reading will be taken at every 100ft.
Vertical Seismic Profiling (VSP):
A class of borehole seismic measurements used for correlation with surface seismic data, for obtaining images of higher resolution than surface seismic images and for looking ahead of the drill bit; also called a VSP. Purely defined, VSP refers to measurements made in a vertical wellbore using geophones inside the wellbore and a source at the surface near the well.
Most VSPs use a surface seismic source, which is commonly a vibrator on land and an air gun in offshore or marine environments.
Recording at any level will contain both upgoing & downgoing waves. Both upgoing & downgoing waves will be associated with multiples due to reflection both above & below the geophone. VSP data is also has its processing which called VSP processing.
Another advantage for VSP is the ability to give good results in deviated wells, where synthetic Seismiogram are often unrealiable.
VSP produces Time/Depth Scale & VSP image, where Check-shot just produces time/depth scale
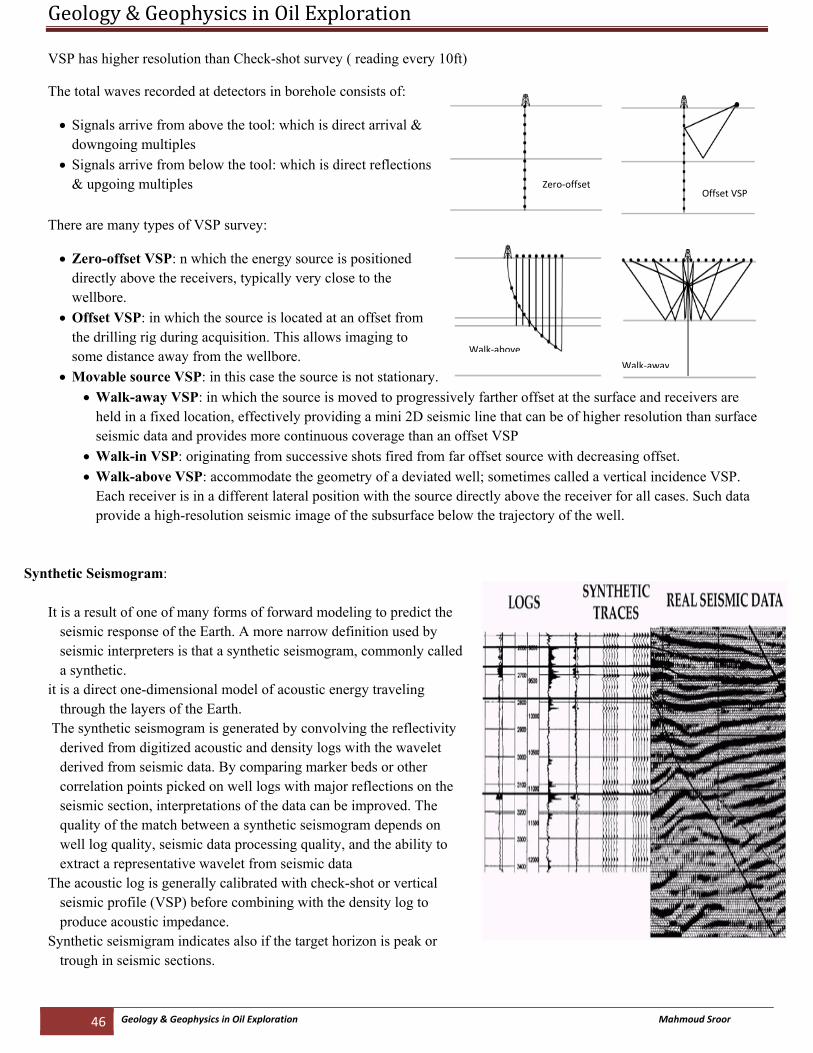
Geology & Geophysics in Oil Exploration
46 Geology & Geophysics in Oil Exploration Mahmoud Sroor
VSP has higher resolution than Check-shot survey ( reading every 10ft)
The total waves recorded at detectors in borehole consists of:
• Signals arrive from above the tool: which is direct arrival & downgoing multiples
• Signals arrive from below the tool: which is direct reflections & upgoing multiples
There are many types of VSP survey:
• Zero-offset VSP: n which the energy source is positioned directly above the receivers, typically very close to the wellbore.
• Offset VSP: in which the source is located at an offset from the drilling rig during acquisition. This allows imaging to some distance away from the wellbore.
• Movable source VSP: in this case the source is not stationary. • Walk-away VSP: in which the source is moved to progressively farther offset at the surface and receivers are
held in a fixed location, effectively providing a mini 2D seismic line that can be of higher resolution than surface seismic data and provides more continuous coverage than an offset VSP
• Walk-in VSP: originating from successive shots fired from far offset source with decreasing offset. • Walk-above VSP: accommodate the geometry of a deviated well; sometimes called a vertical incidence VSP.
Each receiver is in a different lateral position with the source directly above the receiver for all cases. Such data provide a high-resolution seismic image of the subsurface below the trajectory of the well.
Synthetic Seismogram:
It is a result of one of many forms of forward modeling to predict the seismic response of the Earth. A more narrow definition used by seismic interpreters is that a synthetic seismogram, commonly called a synthetic.
it is a direct one-dimensional model of acoustic energy traveling through the layers of the Earth.
The synthetic seismogram is generated by convolving the reflectivity derived from digitized acoustic and density logs with the wavelet derived from seismic data. By comparing marker beds or other correlation points picked on well logs with major reflections on the seismic section, interpretations of the data can be improved. The quality of the match between a synthetic seismogram depends on well log quality, seismic data processing quality, and the ability to extract a representative wavelet from seismic data
The acoustic log is generally calibrated with check-shot or vertical seismic profile (VSP) before combining with the density log to produce acoustic impedance.
Synthetic seismigram indicates also if the target horizon is peak or trough in seismic sections.
Zero‐offset Offset VSP
Walk‐above
Walk‐away
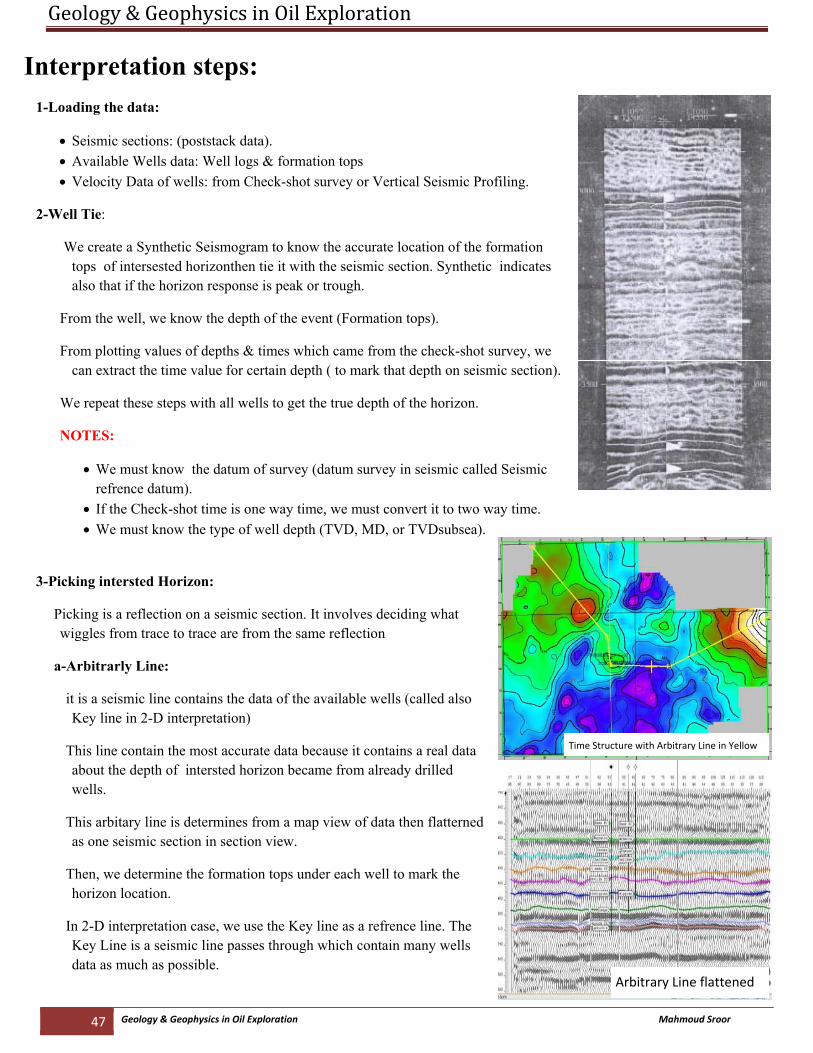
Geology & Geophysics in Oil Exploration
47 Geology & Geophysics in Oil Exploration Mahmoud Sroor
Interpretation steps: 1-Loading the data:
• Seismic sections: (poststack data). • Available Wells data: Well logs & formation tops • Velocity Data of wells: from Check-shot survey or Vertical Seismic Profiling.
2-Well Tie:
We create a Synthetic Seismogram to know the accurate location of the formation tops of intersested horizonthen tie it with the seismic section. Synthetic indicates also that if the horizon response is peak or trough.
From the well, we know the depth of the event (Formation tops).
From plotting values of depths & times which came from the check-shot survey, we can extract the time value for certain depth ( to mark that depth on seismic section).
We repeat these steps with all wells to get the true depth of the horizon.
NOTES:
• We must know the datum of survey (datum survey in seismic called Seismic refrence datum).
• If the Check-shot time is one way time, we must convert it to two way time. • We must know the type of well depth (TVD, MD, or TVDsubsea).
3-Picking intersted Horizon:
Picking is a reflection on a seismic section. It involves deciding what wiggles from trace to trace are from the same reflection
a-Arbitrarly Line:
it is a seismic line contains the data of the available wells (called also Key line in 2-D interpretation)
This line contain the most accurate data because it contains a real data about the depth of intersted horizon became from already drilled wells.
This arbitary line is determines from a map view of data then flatterned as one seismic section in section view.
Then, we determine the formation tops under each well to mark the horizon location.
In 2-D interpretation case, we use the Key line as a refrence line. The Key Line is a seismic line passes through which contain many wells data as much as possible.
Time Structure with Arbitrary Line in Yellow
Arbitrary Line flattened
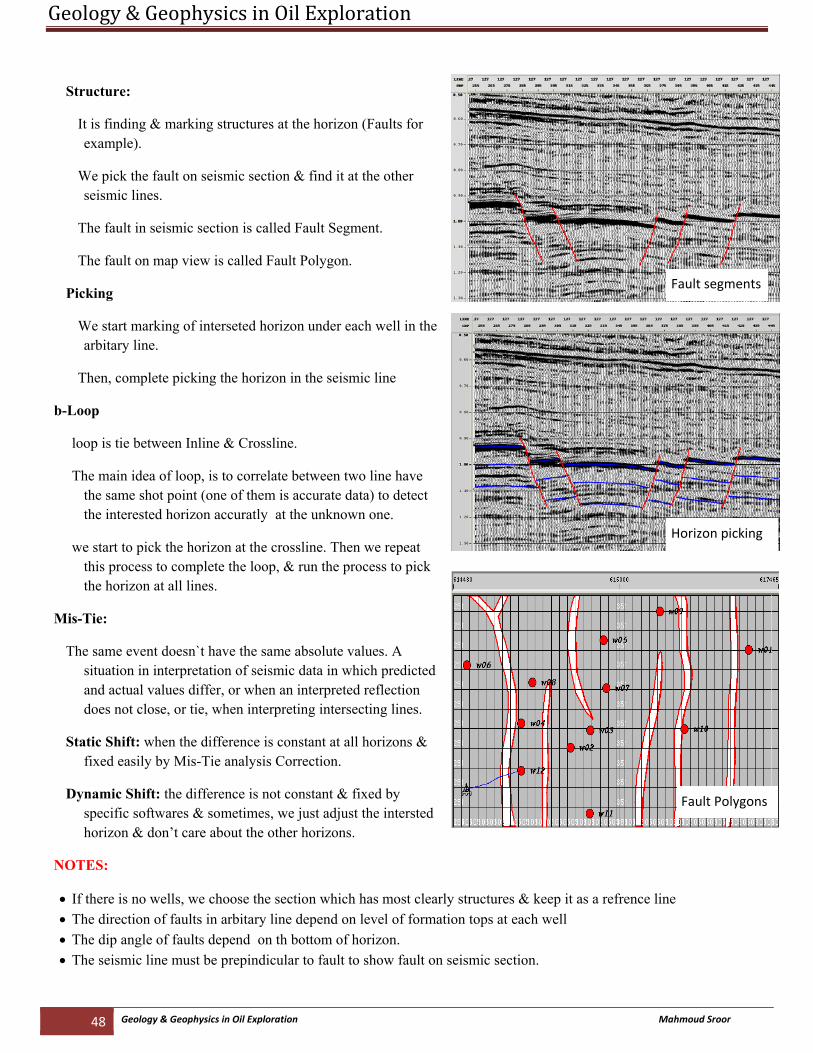
Geology & Geophysics in Oil Exploration
48 Geology & Geophysics in Oil Exploration Mahmoud Sroor
Structure:
It is finding & marking structures at the horizon (Faults for example).
We pick the fault on seismic section & find it at the other seismic lines.
The fault in seismic section is called Fault Segment.
The fault on map view is called Fault Polygon.
Picking
We start marking of interseted horizon under each well in the arbitary line.
Then, complete picking the horizon in the seismic line
b-Loop
loop is tie between Inline & Crossline.
The main idea of loop, is to correlate between two line have the same shot point (one of them is accurate data) to detect the interested horizon accuratly at the unknown one.
we start to pick the horizon at the crossline. Then we repeat this process to complete the loop, & run the process to pick the horizon at all lines.
Mis-Tie:
The same event doesn`t have the same absolute values. A situation in interpretation of seismic data in which predicted and actual values differ, or when an interpreted reflection does not close, or tie, when interpreting intersecting lines.
Static Shift: when the difference is constant at all horizons & fixed easily by Mis-Tie analysis Correction.
Dynamic Shift: the difference is not constant & fixed by specific softwares & sometimes, we just adjust the intersted horizon & don’t care about the other horizons.
NOTES:
• If there is no wells, we choose the section which has most clearly structures & keep it as a refrence line • The direction of faults in arbitary line depend on level of formation tops at each well • The dip angle of faults depend on th bottom of horizon. • The seismic line must be prepindicular to fault to show fault on seismic section.
Fault segments
Fault Polygons
Horizon picking
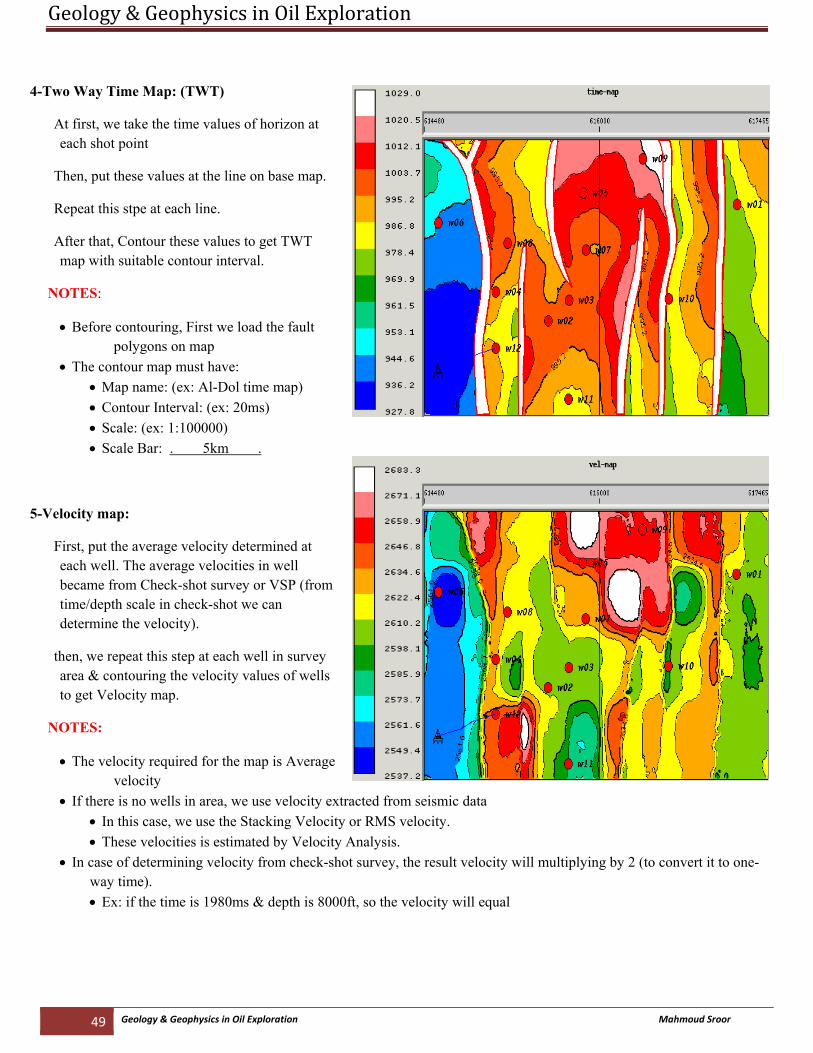
Geology & Geophysics in Oil Exploration
49 Geology & Geophysics in Oil Exploration Mahmoud Sroor
4-Two Way Time Map: (TWT)
At first, we take the time values of horizon at each shot point
Then, put these values at the line on base map.
Repeat this stpe at each line.
After that, Contour these values to get TWT map with suitable contour interval.
NOTES:
• Before contouring, First we load the fault polygons on map
• The contour map must have: • Map name: (ex: Al-Dol time map) • Contour Interval: (ex: 20ms) • Scale: (ex: 1:100000) • Scale Bar: . 5km .
5-Velocity map:
First, put the average velocity determined at each well. The average velocities in well became from Check-shot survey or VSP (from time/depth scale in check-shot we can determine the velocity).
then, we repeat this step at each well in survey area & contouring the velocity values of wells to get Velocity map.
NOTES:
• The velocity required for the map is Average velocity
• If there is no wells in area, we use velocity extracted from seismic data • In this case, we use the Stacking Velocity or RMS velocity. • These velocities is estimated by Velocity Analysis.
• In case of determining velocity from check-shot survey, the result velocity will multiplying by 2 (to convert it to one-way time). • Ex: if the time is 1980ms & depth is 8000ft, so the velocity will equal
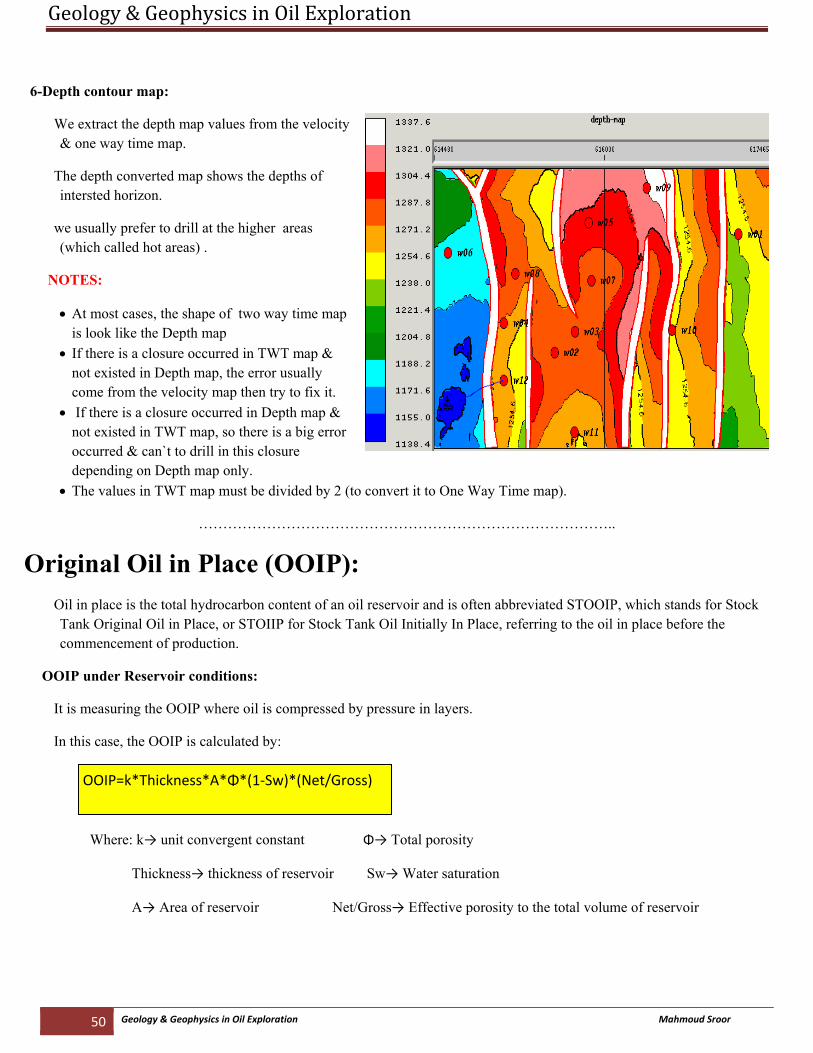
Geology & Geophysics in Oil Exploration
50 Geology & Geophysics in Oil Exploration Mahmoud Sroor
6-Depth contour map:
We extract the depth map values from the velocity & one way time map.
The depth converted map shows the depths of intersted horizon.
we usually prefer to drill at the higher areas (which called hot areas) .
NOTES:
• At most cases, the shape of two way time map is look like the Depth map
• If there is a closure occurred in TWT map & not existed in Depth map, the error usually come from the velocity map then try to fix it.
• If there is a closure occurred in Depth map & not existed in TWT map, so there is a big error occurred & can`t to drill in this closure depending on Depth map only.
• The values in TWT map must be divided by 2 (to convert it to One Way Time map).
…………………………………………………………………………..
Original Oil in Place (OOIP): Oil in place is the total hydrocarbon content of an oil reservoir and is often abbreviated STOOIP, which stands for Stock Tank Original Oil in Place, or STOIIP for Stock Tank Oil Initially In Place, referring to the oil in place before the commencement of production.
OOIP under Reservoir conditions:
It is measuring the OOIP where oil is compressed by pressure in layers.
In this case, the OOIP is calculated by:
Where: k→ unit convergent constant Φ→ Total porosity
Thickness→ thickness of reservoir Sw→ Water saturation
A→ Area of reservoir Net/Gross→ Effective porosity to the total volume of reservoir
OOIP=k*Thickness*A*Φ*(1‐Sw)*(Net/Gross)
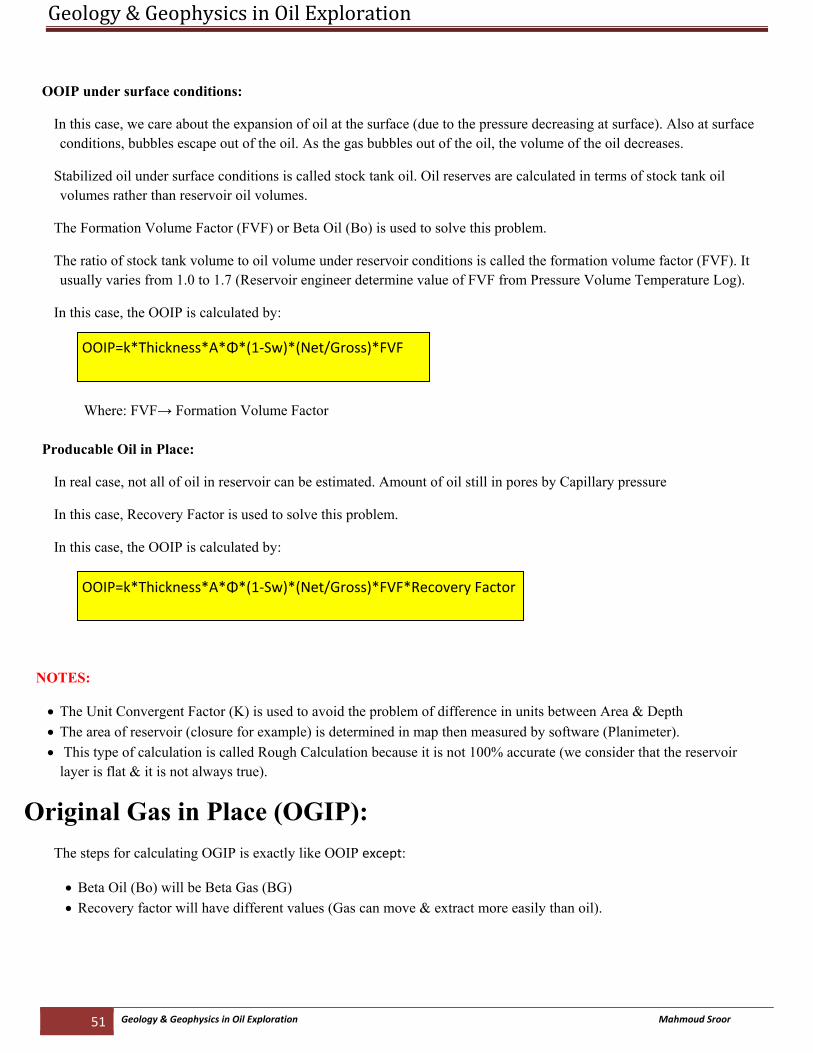
Geology & Geophysics in Oil Exploration
51 Geology & Geophysics in Oil Exploration Mahmoud Sroor
OOIP under surface conditions:
In this case, we care about the expansion of oil at the surface (due to the pressure decreasing at surface). Also at surface conditions, bubbles escape out of the oil. As the gas bubbles out of the oil, the volume of the oil decreases.
Stabilized oil under surface conditions is called stock tank oil. Oil reserves are calculated in terms of stock tank oil volumes rather than reservoir oil volumes.
The Formation Volume Factor (FVF) or Beta Oil (Bo) is used to solve this problem.
The ratio of stock tank volume to oil volume under reservoir conditions is called the formation volume factor (FVF). It usually varies from 1.0 to 1.7 (Reservoir engineer determine value of FVF from Pressure Volume Temperature Log).
In this case, the OOIP is calculated by:
Where: FVF→ Formation Volume Factor
Producable Oil in Place:
In real case, not all of oil in reservoir can be estimated. Amount of oil still in pores by Capillary pressure
In this case, Recovery Factor is used to solve this problem.
In this case, the OOIP is calculated by:
NOTES:
• The Unit Convergent Factor (K) is used to avoid the problem of difference in units between Area & Depth • The area of reservoir (closure for example) is determined in map then measured by software (Planimeter). • This type of calculation is called Rough Calculation because it is not 100% accurate (we consider that the reservoir
layer is flat & it is not always true).
Original Gas in Place (OGIP):
The steps for calculating OGIP is exactly like OOIP except:
• Beta Oil (Bo) will be Beta Gas (BG) • Recovery factor will have different values (Gas can move & extract more easily than oil).
OOIP=k*Thickness*A*Φ*(1‐Sw)*(Net/Gross)*FVF
OOIP=k*Thickness*A*Φ*(1‐Sw)*(Net/Gross)*FVF*Recovery Factor
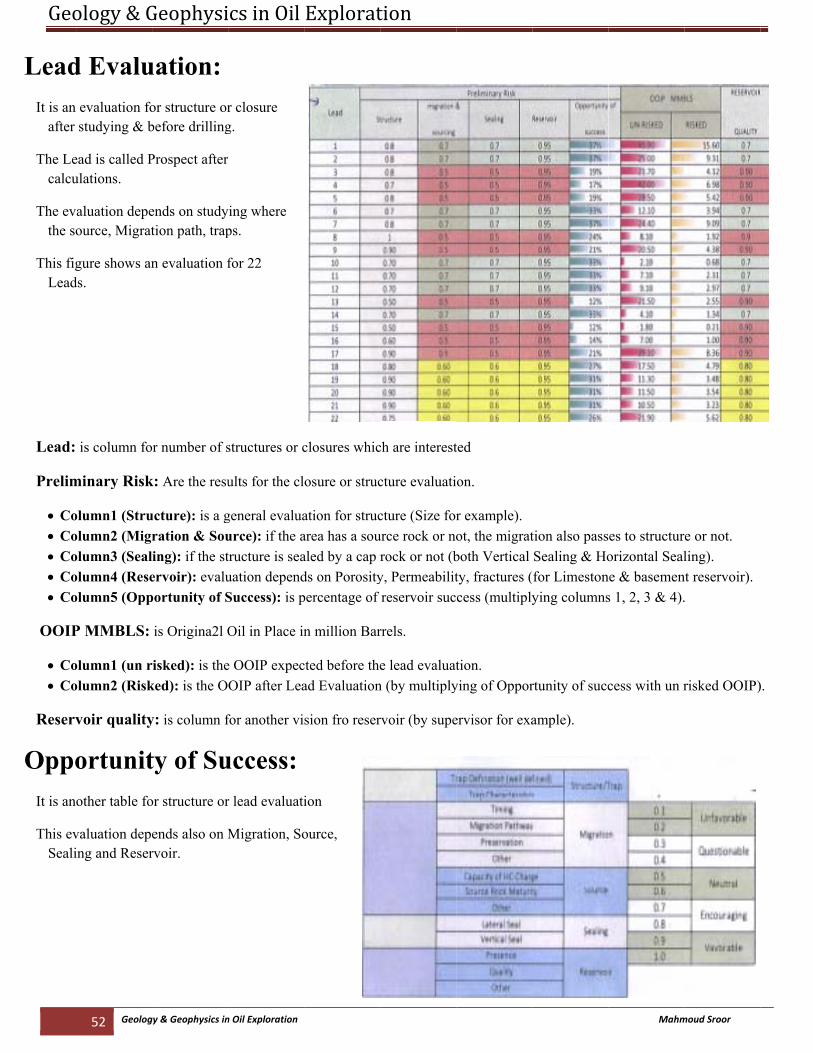
Geo
LeadIt is an
after
The Lecalcu
The evthe so
This figLead
Lead:
Prelim
• Co• Co• Co• Co• Co
OOIP
• Co• Co
Reserv
OppoIt is an
This evSeali
ology & G
52 Geolog
d Evaluevaluation fostudying & b
ead is called Pulations.
aluation depeource, Migrat
gure shows ands.
is column fo
minary Risk
olumn1 (Struolumn2 (Migrolumn3 (Sealolumn4 (Reseolumn5 (Opp
P MMBLS:
olumn1 (un rolumn2 (Risk
voir quality
ortunitother table fo
valuation depeing and Reser
Geophysi
gy & Geophysics in
uation: or structure orbefore drilling
Prospect after
ends on studytion path, trap
n evaluation f
r number of s
k: Are the resu
ucture): is a gration & Souing): if the stervoir): evaluportunity of S
is Origina2l O
risked): is theked): is the O
y: is column f
ty of Suor structure or
ends also on Mrvoir.
cs in Oil
n Oil Exploration
r closure g.
ying where ps.
for 22
structures or c
ults for the cl
general evaluaurce): if the atructure is seauation dependSuccess): is p
Oil in Place in
e OOIP expecOIP after Lea
for another vi
uccess: r lead evaluati
Migration, So
Explorat
closures whic
osure or struc
ation for strucarea has a soualed by a cap rds on Porositypercentage of
n million Bar
cted before thead Evaluation
sion fro reser
ion
ource,
tion
ch are interest
cture evaluati
cture (Size forurce rock or norock or not (b
y, Permeabilitreservoir suc
rrels.
e lead evaluatn (by multiply
rvoir (by supe
ted
on.
r example). ot, the migratboth Vertical ty, fractures (cess (multiply
tion. ying of Oppor
ervisor for exa
tion also passSealing & Ho
(for Limestonying columns
rtunity of succ
ample).
Mahm
es to structurorizontal Seal
ne & basemens 1, 2, 3 & 4).
cess with un r
moud Sroor
e or not. ling).
nt reservoir). .
risked OOIP)).
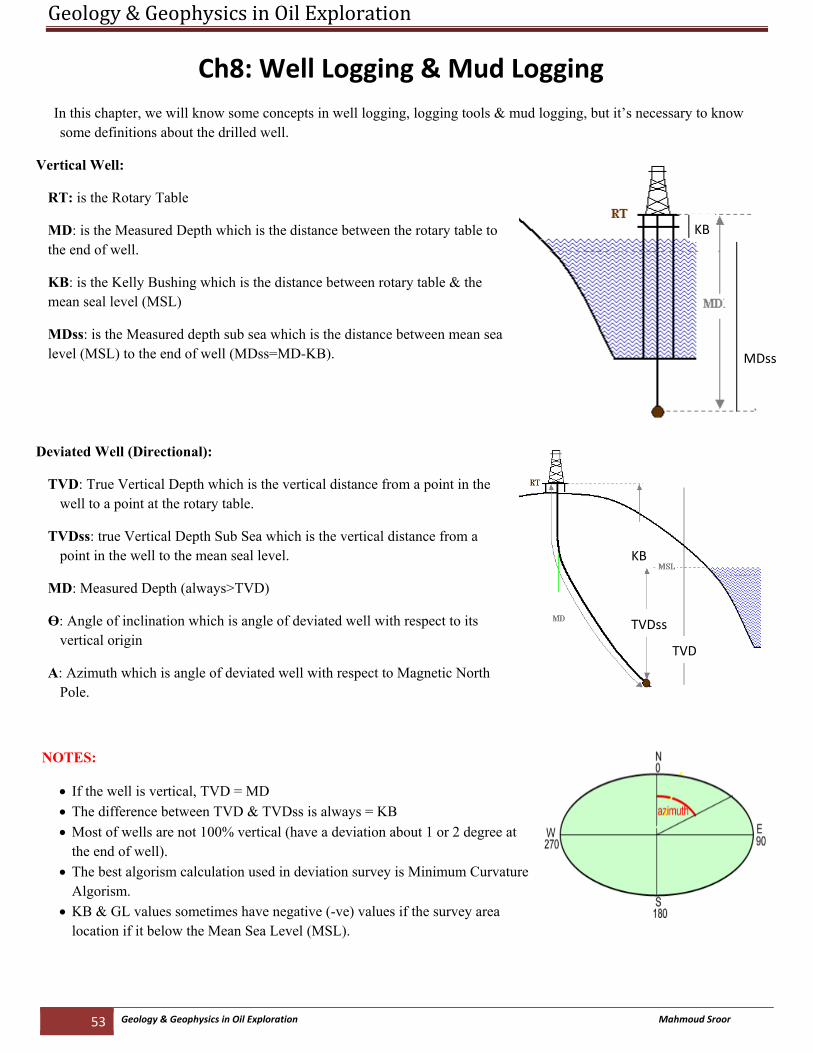
Geology & Geophysics in Oil Exploration
53 Geology & Geophysics in Oil Exploration Mahmoud Sroor
Ch8: Well Logging & Mud Logging In this chapter, we will know some concepts in well logging, logging tools & mud logging, but it’s necessary to know some definitions about the drilled well.
Vertical Well:
RT: is the Rotary Table
MD: is the Measured Depth which is the distance between the rotary table to the end of well.
KB: is the Kelly Bushing which is the distance between rotary table & the mean seal level (MSL)
MDss: is the Measured depth sub sea which is the distance between mean sea level (MSL) to the end of well (MDss=MD-KB).
Deviated Well (Directional):
TVD: True Vertical Depth which is the vertical distance from a point in the well to a point at the rotary table.
TVDss: true Vertical Depth Sub Sea which is the vertical distance from a point in the well to the mean seal level.
MD: Measured Depth (always>TVD)
Ө: Angle of inclination which is angle of deviated well with respect to its vertical origin
A: Azimuth which is angle of deviated well with respect to Magnetic North Pole.
NOTES:
• If the well is vertical, TVD = MD • The difference between TVD & TVDss is always = KB • Most of wells are not 100% vertical (have a deviation about 1 or 2 degree at
the end of well). • The best algorism calculation used in deviation survey is Minimum Curvature
Algorism. • KB & GL values sometimes have negative (-ve) values if the survey area
location if it below the Mean Sea Level (MSL).
MDss
KB
KB
TVDss
TVD
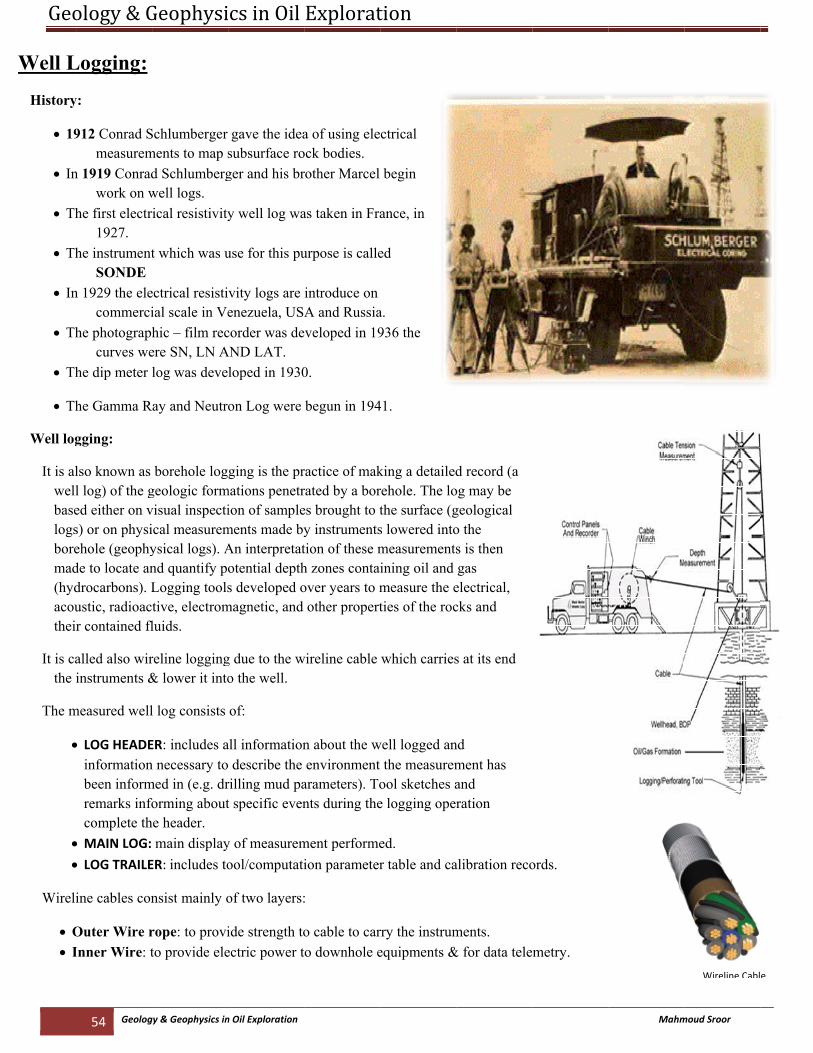
Geo
Well L
History
• 19
• In
• Th
• Th
• In
• Th
• Th
• Th
Well log
It is alwellbaselogsboremad(hydacoutheir
It is cathe i
The m
•
••
Wireli
• O• I
ology & G
54 Geolog
Logging:
y:
912 Conrad Smeasurem
n 1919 Conradwork on w
he first electr1927.
he instrumentSONDE
n 1929 the elecommerci
he photographcurves we
he dip meter l
he Gamma R
gging:
lso known as l log) of the ged either on vs) or on physiehole (geophyde to locate androcarbons). Lustic, radioacr contained fl
alled also wirinstruments &
measured well
• LOG HEADEinformationbeen informremarks infocomplete th
• MAIN LOG:
• LOG TRAILE
ine cables con
Outer Wire rInner Wire: t
Geophysi
gy & Geophysics in
Schlumberger ments to map sd Schlumbergwell logs. ical resistivity
t which was u
ectrical resistiial scale in Vehic – film recere SN, LN Alog was deve
Ray and Neutro
borehole loggeologic formvisual inspectiical measuremysical logs). And quantify poLogging toolstive, electromluids.
reline logging& lower it into
l log consists
ER: includes an necessary tomed in (e.g. drforming abouthe header.
main displayER: includes to
nsist mainly o
rope: to provito provide ele
cs in Oil
n Oil Exploration
gave the ideasubsurface roger and his br
y well log wa
use for this pu
vity logs are enezuela, USAcorder was de
AND LAT. loped in 1930
on Log were
ging is the prmations penetr
ion of samplements made byAn interpretatotential depths developed o
magnetic, and
g due to the wo the well.
of:
all information describe the
rilling mud pat specific even
y of measuremool/computati
of two layers:
ide strength toectric power t
Explorat
a of using eleock bodies. rother Marcel
as taken in Fra
urpose is calle
introduce on A and Russia
eveloped in 19
0.
begun in 194
ractice of makrated by a bores brought to ty instrumentstion of these mh zones contaiover years to mother propert
wireline cable
n about the wenvironment
arameters). Tonts during the
ment performeion parameter
:
o cable to carto downhole e
tion
ctrical
begin
ance, in
ed
a. 936 the
41.
king a detailedrehole. The lothe surface (gs lowered intomeasurementsining oil and measure the eties of the roc
which carries
well logged anthe measurem
ool sketches ae logging oper
ed. r table and ca
rry the instrumequipments &
d record (a og may be geological o the s is then gas
electrical, cks and
s at its end
nd ment has and ration
alibration reco
ments. & for data tele
ords.
metry.
Mahmmoud Sroor
Wireline Cable
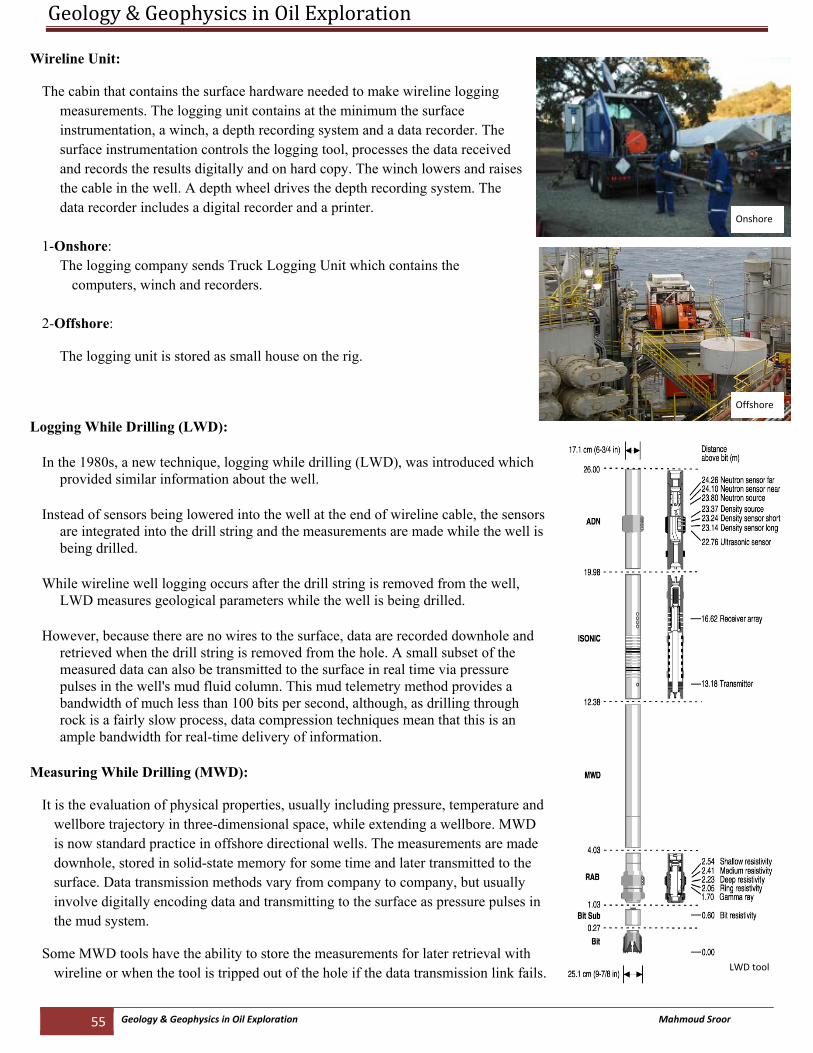
Geology & Geophysics in Oil Exploration
55 Geology & Geophysics in Oil Exploration Mahmoud Sroor
Wireline Unit:
The cabin that contains the surface hardware needed to make wireline logging measurements. The logging unit contains at the minimum the surface instrumentation, a winch, a depth recording system and a data recorder. The surface instrumentation controls the logging tool, processes the data received and records the results digitally and on hard copy. The winch lowers and raises the cable in the well. A depth wheel drives the depth recording system. The data recorder includes a digital recorder and a printer.
1-Onshore:
The logging company sends Truck Logging Unit which contains the computers, winch and recorders.
2-Offshore:
The logging unit is stored as small house on the rig.
Logging While Drilling (LWD):
In the 1980s, a new technique, logging while drilling (LWD), was introduced which provided similar information about the well.
Instead of sensors being lowered into the well at the end of wireline cable, the sensors are integrated into the drill string and the measurements are made while the well is being drilled.
While wireline well logging occurs after the drill string is removed from the well, LWD measures geological parameters while the well is being drilled.
However, because there are no wires to the surface, data are recorded downhole and retrieved when the drill string is removed from the hole. A small subset of the measured data can also be transmitted to the surface in real time via pressure pulses in the well's mud fluid column. This mud telemetry method provides a bandwidth of much less than 100 bits per second, although, as drilling through rock is a fairly slow process, data compression techniques mean that this is an ample bandwidth for real-time delivery of information.
Measuring While Drilling (MWD):
It is the evaluation of physical properties, usually including pressure, temperature and wellbore trajectory in three-dimensional space, while extending a wellbore. MWD is now standard practice in offshore directional wells. The measurements are made downhole, stored in solid-state memory for some time and later transmitted to the surface. Data transmission methods vary from company to company, but usually involve digitally encoding data and transmitting to the surface as pressure pulses in the mud system.
Some MWD tools have the ability to store the measurements for later retrieval with wireline or when the tool is tripped out of the hole if the data transmission link fails.
Onshore
Offshore
LWD tool
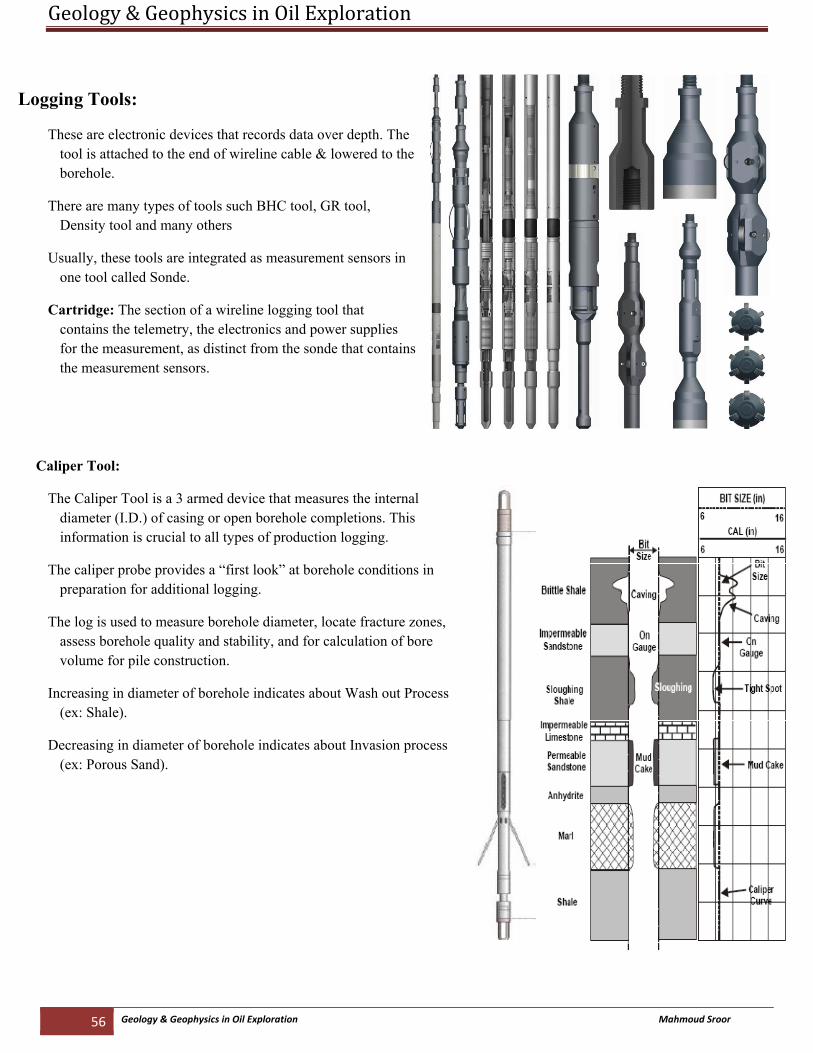
Geology & Geophysics in Oil Exploration
56 Geology & Geophysics in Oil Exploration Mahmoud Sroor
Logging Tools:
These are electronic devices that records data over depth. The tool is attached to the end of wireline cable & lowered to the borehole.
There are many types of tools such BHC tool, GR tool, Density tool and many others
Usually, these tools are integrated as measurement sensors in one tool called Sonde.
Cartridge: The section of a wireline logging tool that contains the telemetry, the electronics and power supplies for the measurement, as distinct from the sonde that contains the measurement sensors.
Caliper Tool:
The Caliper Tool is a 3 armed device that measures the internal diameter (I.D.) of casing or open borehole completions. This information is crucial to all types of production logging.
The caliper probe provides a “first look” at borehole conditions in preparation for additional logging.
The log is used to measure borehole diameter, locate fracture zones, assess borehole quality and stability, and for calculation of bore volume for pile construction.
Increasing in diameter of borehole indicates about Wash out Process (ex: Shale).
Decreasing in diameter of borehole indicates about Invasion process (ex: Porous Sand).
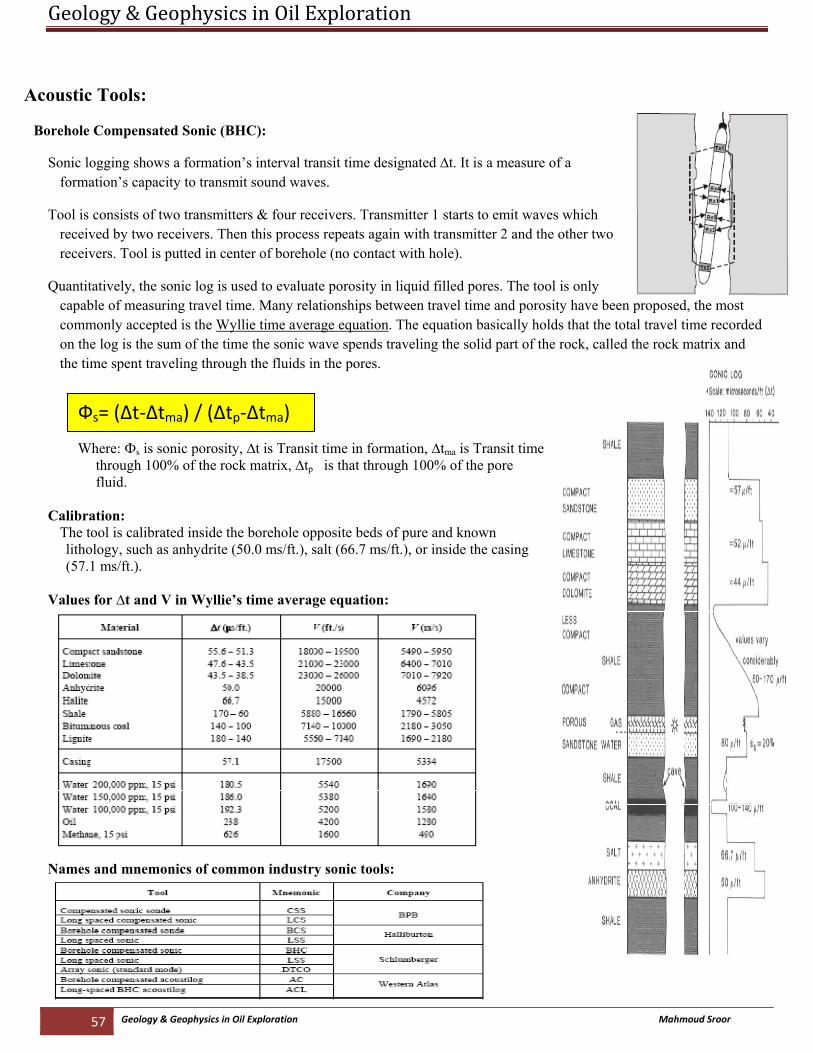
Geology & Geophysics in Oil Exploration
57 Geology & Geophysics in Oil Exploration Mahmoud Sroor
Acoustic Tools:
Borehole Compensated Sonic (BHC): Sonic logging shows a formation’s interval transit time designated ∆t. It is a measure of a
formation’s capacity to transmit sound waves.
Tool is consists of two transmitters & four receivers. Transmitter 1 starts to emit waves which received by two receivers. Then this process repeats again with transmitter 2 and the other two receivers. Tool is putted in center of borehole (no contact with hole).
Quantitatively, the sonic log is used to evaluate porosity in liquid filled pores. The tool is only capable of measuring travel time. Many relationships between travel time and porosity have been proposed, the most commonly accepted is the Wyllie time average equation. The equation basically holds that the total travel time recorded on the log is the sum of the time the sonic wave spends traveling the solid part of the rock, called the rock matrix and the time spent traveling through the fluids in the pores.
Where: Фs is sonic porosity, ∆t is Transit time in formation, ∆tma is Transit time through 100% of the rock matrix, ∆tp is that through 100% of the pore fluid.
Calibration:
The tool is calibrated inside the borehole opposite beds of pure and known lithology, such as anhydrite (50.0 ms/ft.), salt (66.7 ms/ft.), or inside the casing (57.1 ms/ft.).
Values for ∆t and V in Wyllie’s time average equation:
Names and mnemonics of common industry sonic tools:
Фs= (∆t‐∆tma) / (∆tp‐∆tma)
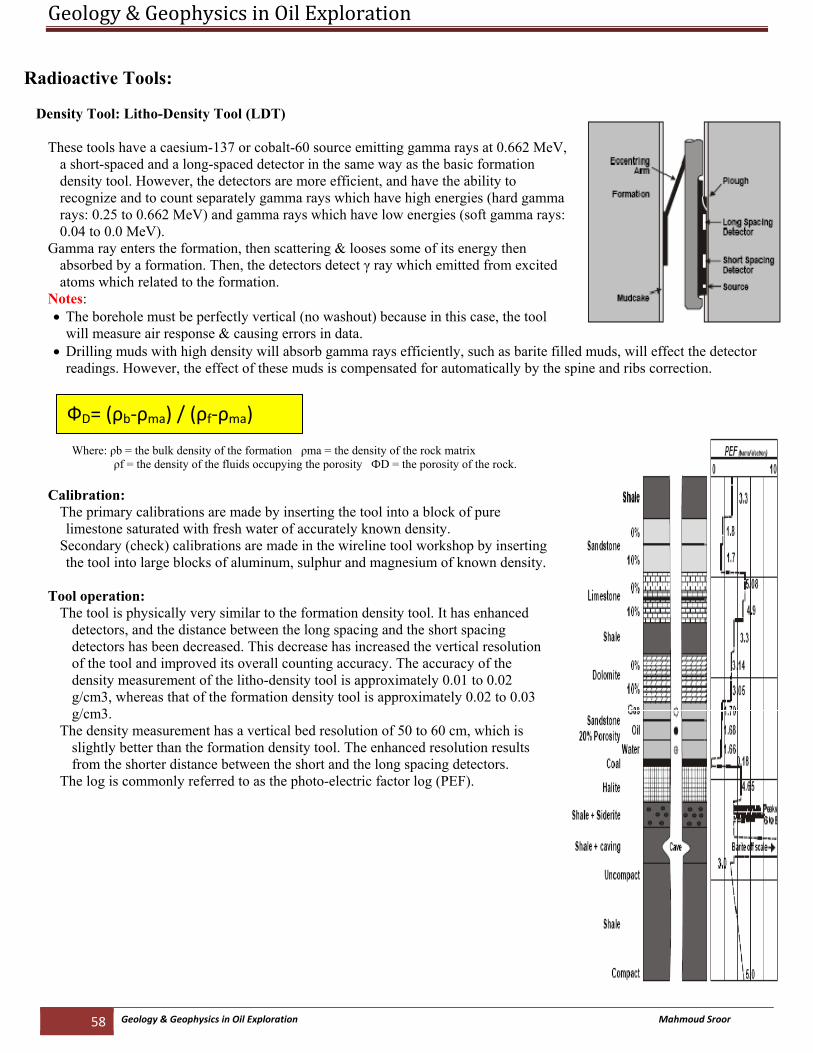
Geology & Geophysics in Oil Exploration
58 Geology & Geophysics in Oil Exploration Mahmoud Sroor
Radioactive Tools:
Density Tool: Litho-Density Tool (LDT)
These tools have a caesium-137 or cobalt-60 source emitting gamma rays at 0.662 MeV,
a short-spaced and a long-spaced detector in the same way as the basic formation density tool. However, the detectors are more efficient, and have the ability to recognize and to count separately gamma rays which have high energies (hard gamma rays: 0.25 to 0.662 MeV) and gamma rays which have low energies (soft gamma rays: 0.04 to 0.0 MeV).
Gamma ray enters the formation, then scattering & looses some of its energy then absorbed by a formation. Then, the detectors detect γ ray which emitted from excited atoms which related to the formation.
Notes: • The borehole must be perfectly vertical (no washout) because in this case, the tool
will measure air response & causing errors in data. • Drilling muds with high density will absorb gamma rays efficiently, such as barite filled muds, will effect the detector
readings. However, the effect of these muds is compensated for automatically by the spine and ribs correction.
Where: ρb = the bulk density of the formation ρma = the density of the rock matrix ρf = the density of the fluids occupying the porosity ФD = the porosity of the rock.
Calibration:
The primary calibrations are made by inserting the tool into a block of pure limestone saturated with fresh water of accurately known density.
Secondary (check) calibrations are made in the wireline tool workshop by inserting the tool into large blocks of aluminum, sulphur and magnesium of known density.
Tool operation:
The tool is physically very similar to the formation density tool. It has enhanced detectors, and the distance between the long spacing and the short spacing detectors has been decreased. This decrease has increased the vertical resolution of the tool and improved its overall counting accuracy. The accuracy of the density measurement of the litho-density tool is approximately 0.01 to 0.02 g/cm3, whereas that of the formation density tool is approximately 0.02 to 0.03 g/cm3.
The density measurement has a vertical bed resolution of 50 to 60 cm, which is slightly better than the formation density tool. The enhanced resolution results from the shorter distance between the short and the long spacing detectors.
The log is commonly referred to as the photo-electric factor log (PEF).
ФD= (ρb‐ρma) / (ρf‐ρma)
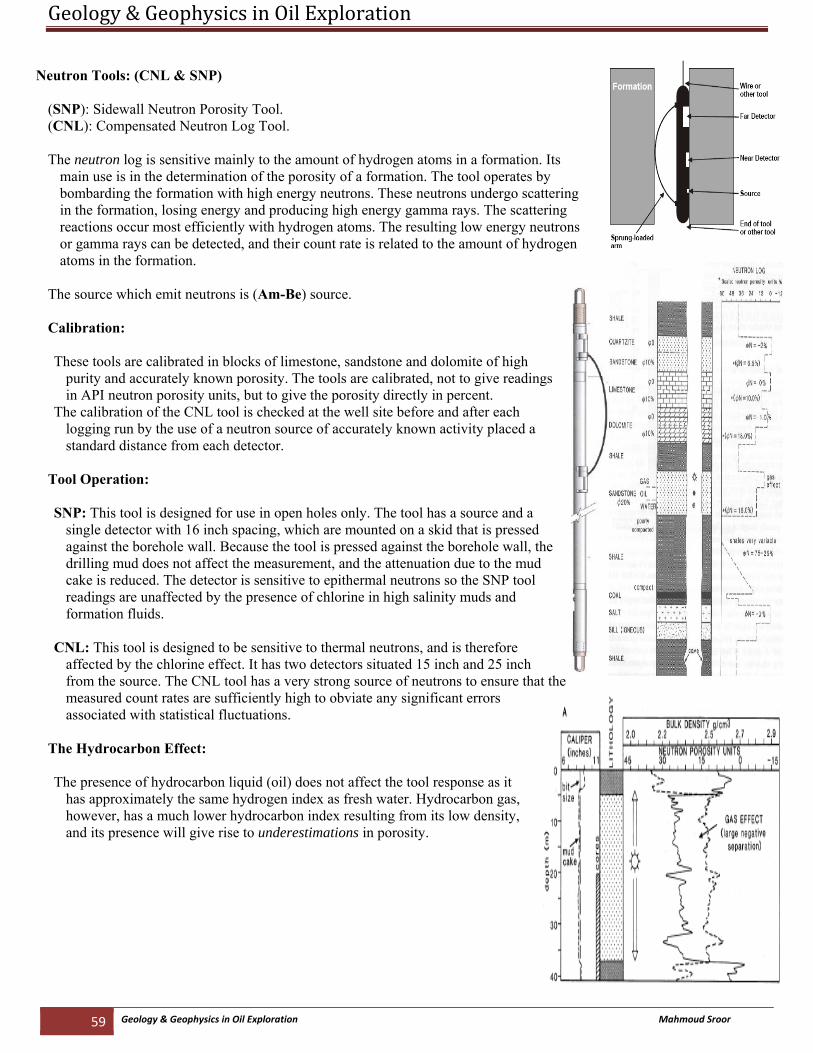
Geology & Geophysics in Oil Exploration
59 Geology & Geophysics in Oil Exploration Mahmoud Sroor
Neutron Tools: (CNL & SNP)
(SNP): Sidewall Neutron Porosity Tool. (CNL): Compensated Neutron Log Tool. The neutron log is sensitive mainly to the amount of hydrogen atoms in a formation. Its
main use is in the determination of the porosity of a formation. The tool operates by bombarding the formation with high energy neutrons. These neutrons undergo scattering in the formation, losing energy and producing high energy gamma rays. The scattering reactions occur most efficiently with hydrogen atoms. The resulting low energy neutrons or gamma rays can be detected, and their count rate is related to the amount of hydrogen atoms in the formation.
The source which emit neutrons is (Am-Be) source. Calibration: These tools are calibrated in blocks of limestone, sandstone and dolomite of high
purity and accurately known porosity. The tools are calibrated, not to give readings in API neutron porosity units, but to give the porosity directly in percent.
The calibration of the CNL tool is checked at the well site before and after each logging run by the use of a neutron source of accurately known activity placed a standard distance from each detector.
Tool Operation: SNP: This tool is designed for use in open holes only. The tool has a source and a
single detector with 16 inch spacing, which are mounted on a skid that is pressed against the borehole wall. Because the tool is pressed against the borehole wall, the drilling mud does not affect the measurement, and the attenuation due to the mud cake is reduced. The detector is sensitive to epithermal neutrons so the SNP tool readings are unaffected by the presence of chlorine in high salinity muds and formation fluids.
CNL: This tool is designed to be sensitive to thermal neutrons, and is therefore
affected by the chlorine effect. It has two detectors situated 15 inch and 25 inch from the source. The CNL tool has a very strong source of neutrons to ensure that the measured count rates are sufficiently high to obviate any significant errors associated with statistical fluctuations.
The Hydrocarbon Effect: The presence of hydrocarbon liquid (oil) does not affect the tool response as it
has approximately the same hydrogen index as fresh water. Hydrocarbon gas, however, has a much lower hydrocarbon index resulting from its low density, and its presence will give rise to underestimations in porosity.
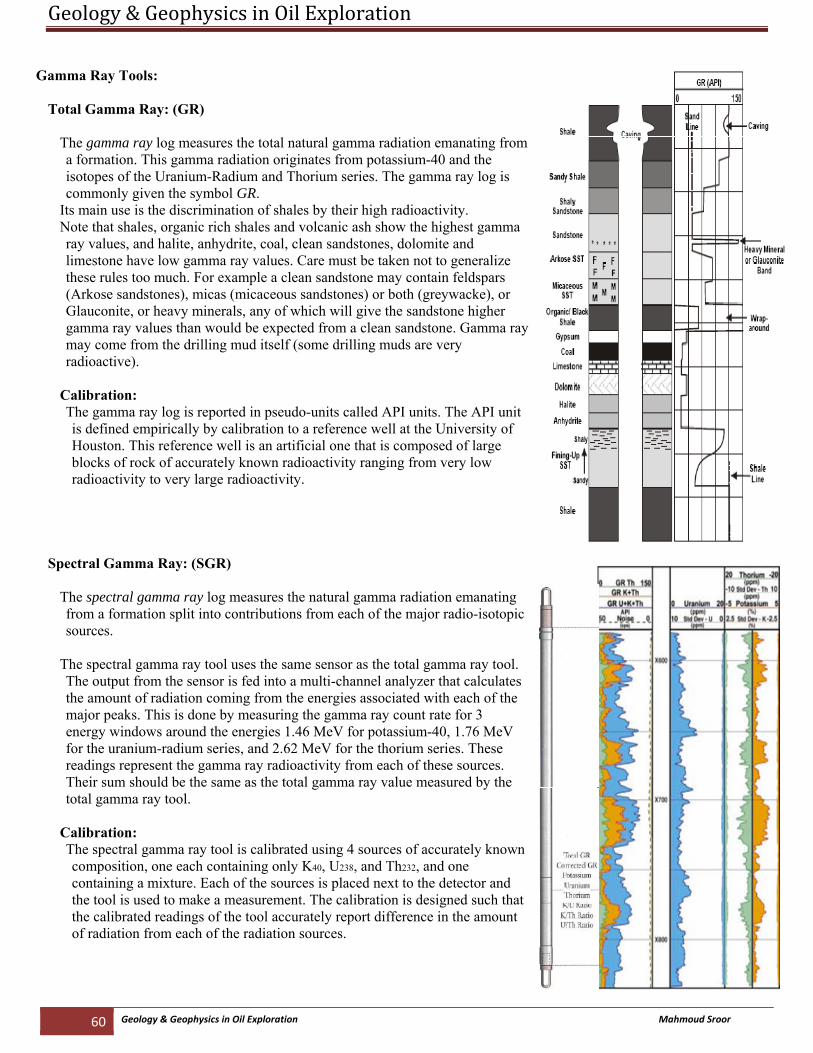
Geology & Geophysics in Oil Exploration
60 Geology & Geophysics in Oil Exploration Mahmoud Sroor
Gamma Ray Tools:
Total Gamma Ray: (GR)
The gamma ray log measures the total natural gamma radiation emanating from a formation. This gamma radiation originates from potassium-40 and the isotopes of the Uranium-Radium and Thorium series. The gamma ray log is commonly given the symbol GR.
Its main use is the discrimination of shales by their high radioactivity. Note that shales, organic rich shales and volcanic ash show the highest gamma ray values, and halite, anhydrite, coal, clean sandstones, dolomite and limestone have low gamma ray values. Care must be taken not to generalize these rules too much. For example a clean sandstone may contain feldspars (Arkose sandstones), micas (micaceous sandstones) or both (greywacke), or Glauconite, or heavy minerals, any of which will give the sandstone higher gamma ray values than would be expected from a clean sandstone. Gamma ray may come from the drilling mud itself (some drilling muds are very radioactive).
Calibration: The gamma ray log is reported in pseudo-units called API units. The API unit is defined empirically by calibration to a reference well at the University of Houston. This reference well is an artificial one that is composed of large blocks of rock of accurately known radioactivity ranging from very low radioactivity to very large radioactivity.
Spectral Gamma Ray: (SGR) The spectral gamma ray log measures the natural gamma radiation emanating from a formation split into contributions from each of the major radio-isotopic sources.
The spectral gamma ray tool uses the same sensor as the total gamma ray tool. The output from the sensor is fed into a multi-channel analyzer that calculates the amount of radiation coming from the energies associated with each of the major peaks. This is done by measuring the gamma ray count rate for 3 energy windows around the energies 1.46 MeV for potassium-40, 1.76 MeV for the uranium-radium series, and 2.62 MeV for the thorium series. These readings represent the gamma ray radioactivity from each of these sources. Their sum should be the same as the total gamma ray value measured by the total gamma ray tool.
Calibration: The spectral gamma ray tool is calibrated using 4 sources of accurately known composition, one each containing only K40, U238, and Th232, and one containing a mixture. Each of the sources is placed next to the detector and the tool is used to make a measurement. The calibration is designed such that the calibrated readings of the tool accurately report difference in the amount of radiation from each of the radiation sources.
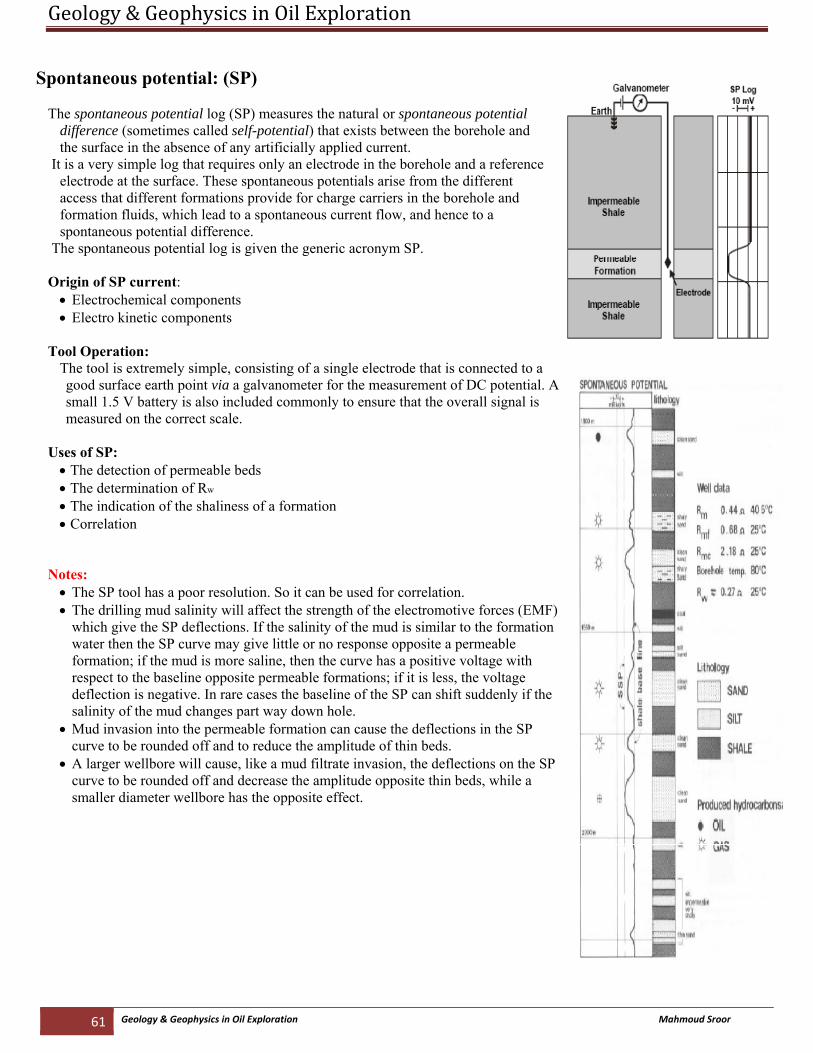
Geology & Geophysics in Oil Exploration
61 Geology & Geophysics in Oil Exploration Mahmoud Sroor
Spontaneous potential: (SP)
The spontaneous potential log (SP) measures the natural or spontaneous potential
difference (sometimes called self-potential) that exists between the borehole and the surface in the absence of any artificially applied current.
It is a very simple log that requires only an electrode in the borehole and a reference electrode at the surface. These spontaneous potentials arise from the different access that different formations provide for charge carriers in the borehole and formation fluids, which lead to a spontaneous current flow, and hence to a spontaneous potential difference.
The spontaneous potential log is given the generic acronym SP. Origin of SP current:
• Electrochemical components • Electro kinetic components
Tool Operation:
The tool is extremely simple, consisting of a single electrode that is connected to a good surface earth point via a galvanometer for the measurement of DC potential. A small 1.5 V battery is also included commonly to ensure that the overall signal is measured on the correct scale.
Uses of SP:
• The detection of permeable beds • The determination of Rw • The indication of the shaliness of a formation • Correlation
Notes:
• The SP tool has a poor resolution. So it can be used for correlation. • The drilling mud salinity will affect the strength of the electromotive forces (EMF)
which give the SP deflections. If the salinity of the mud is similar to the formation water then the SP curve may give little or no response opposite a permeable formation; if the mud is more saline, then the curve has a positive voltage with respect to the baseline opposite permeable formations; if it is less, the voltage deflection is negative. In rare cases the baseline of the SP can shift suddenly if the salinity of the mud changes part way down hole.
• Mud invasion into the permeable formation can cause the deflections in the SP curve to be rounded off and to reduce the amplitude of thin beds.
• A larger wellbore will cause, like a mud filtrate invasion, the deflections on the SP curve to be rounded off and decrease the amplitude opposite thin beds, while a smaller diameter wellbore has the opposite effect.
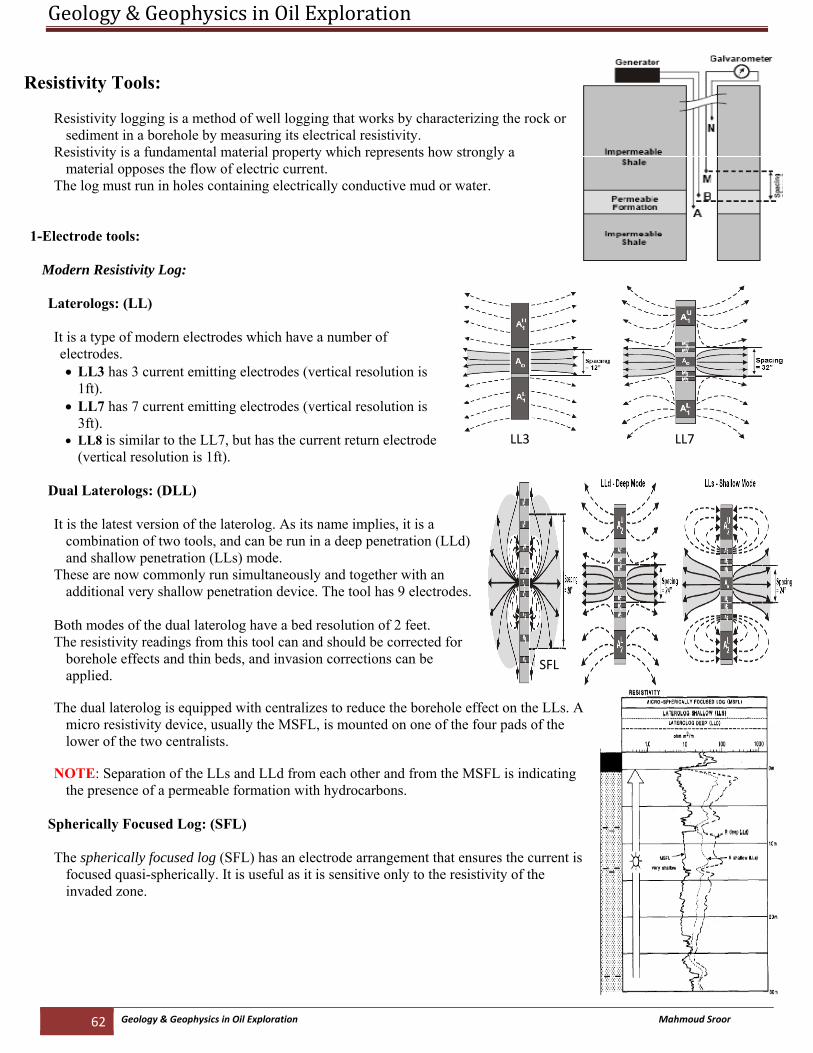
Geology & Geophysics in Oil Exploration
62 Geology & Geophysics in Oil Exploration Mahmoud Sroor
Resistivity Tools:
Resistivity logging is a method of well logging that works by characterizing the rock or
sediment in a borehole by measuring its electrical resistivity. Resistivity is a fundamental material property which represents how strongly a
material opposes the flow of electric current. The log must run in holes containing electrically conductive mud or water.
1-Electrode tools:
Modern Resistivity Log: Laterologs: (LL) It is a type of modern electrodes which have a number of electrodes. • LL3 has 3 current emitting electrodes (vertical resolution is
1ft). • LL7 has 7 current emitting electrodes (vertical resolution is
3ft). • LL8 is similar to the LL7, but has the current return electrode
(vertical resolution is 1ft). Dual Laterologs: (DLL) It is the latest version of the laterolog. As its name implies, it is a
combination of two tools, and can be run in a deep penetration (LLd) and shallow penetration (LLs) mode.
These are now commonly run simultaneously and together with an additional very shallow penetration device. The tool has 9 electrodes.
Both modes of the dual laterolog have a bed resolution of 2 feet. The resistivity readings from this tool can and should be corrected for
borehole effects and thin beds, and invasion corrections can be applied.
The dual laterolog is equipped with centralizes to reduce the borehole effect on the LLs. A
micro resistivity device, usually the MSFL, is mounted on one of the four pads of the lower of the two centralists.
NOTE: Separation of the LLs and LLd from each other and from the MSFL is indicating
the presence of a permeable formation with hydrocarbons.
Spherically Focused Log: (SFL) The spherically focused log (SFL) has an electrode arrangement that ensures the current is
focused quasi-spherically. It is useful as it is sensitive only to the resistivity of the invaded zone.
LL3 LL7
SFL
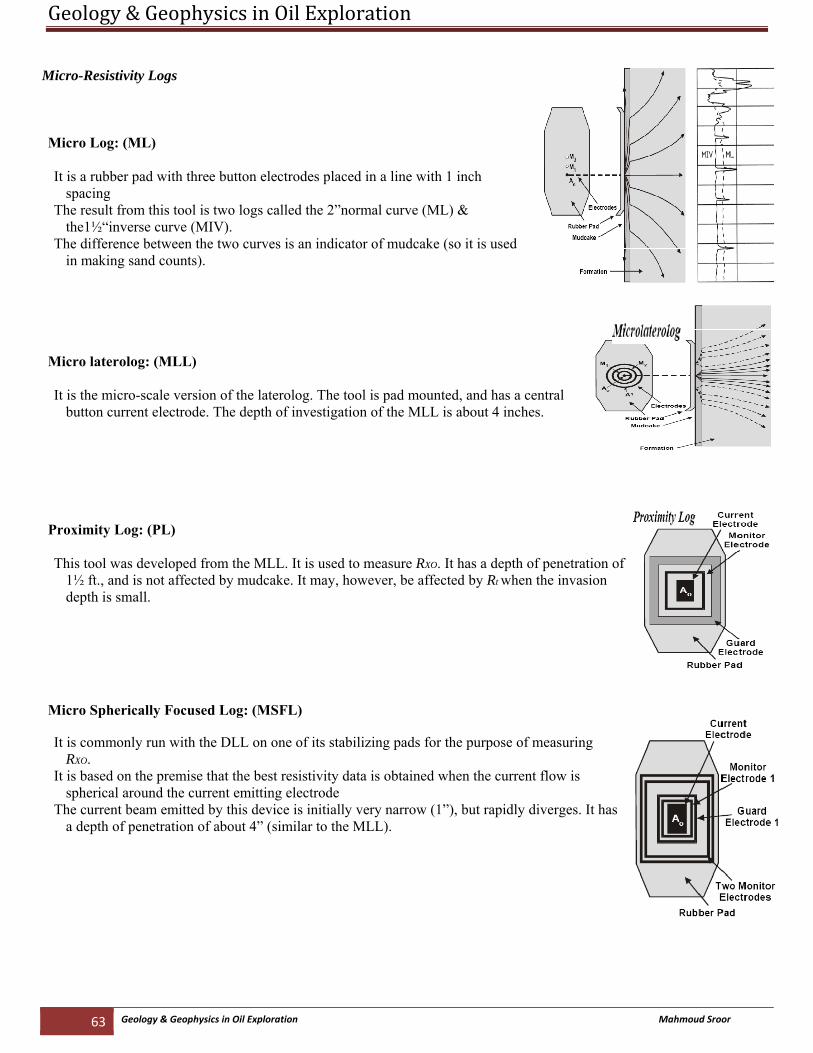
Geology & Geophysics in Oil Exploration
63 Geology & Geophysics in Oil Exploration Mahmoud Sroor
Micro-Resistivity Logs Micro Log: (ML) It is a rubber pad with three button electrodes placed in a line with 1 inch
spacing The result from this tool is two logs called the 2”normal curve (ML) &
the1½“inverse curve (MIV). The difference between the two curves is an indicator of mudcake (so it is used
in making sand counts). Micro laterolog: (MLL) It is the micro-scale version of the laterolog. The tool is pad mounted, and has a central
button current electrode. The depth of investigation of the MLL is about 4 inches.
Proximity Log: (PL) This tool was developed from the MLL. It is used to measure RXO. It has a depth of penetration of
1½ ft., and is not affected by mudcake. It may, however, be affected by Rt when the invasion depth is small.
Micro Spherically Focused Log: (MSFL) It is commonly run with the DLL on one of its stabilizing pads for the purpose of measuring
RXO. It is based on the premise that the best resistivity data is obtained when the current flow is
spherical around the current emitting electrode The current beam emitted by this device is initially very narrow (1”), but rapidly diverges. It has
a depth of penetration of about 4” (similar to the MLL).
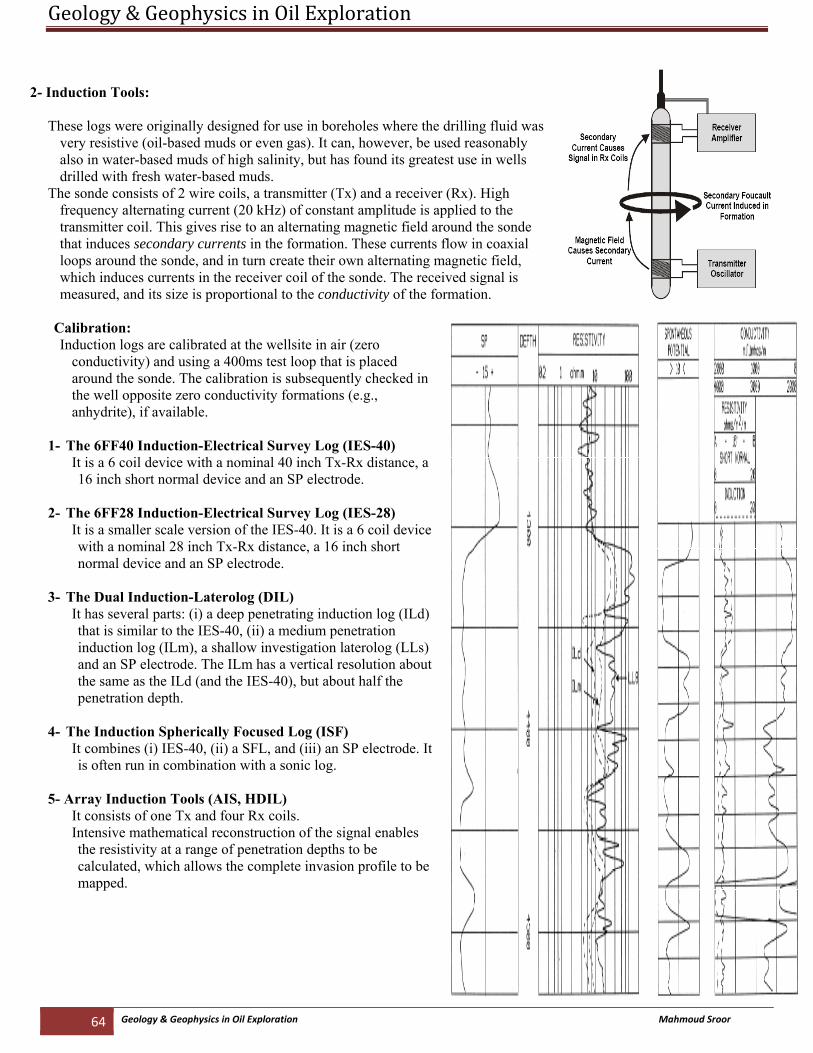
Geology & Geophysics in Oil Exploration
64 Geology & Geophysics in Oil Exploration Mahmoud Sroor
2- Induction Tools:
These logs were originally designed for use in boreholes where the drilling fluid was very resistive (oil-based muds or even gas). It can, however, be used reasonably also in water-based muds of high salinity, but has found its greatest use in wells drilled with fresh water-based muds.
The sonde consists of 2 wire coils, a transmitter (Tx) and a receiver (Rx). High frequency alternating current (20 kHz) of constant amplitude is applied to the transmitter coil. This gives rise to an alternating magnetic field around the sonde that induces secondary currents in the formation. These currents flow in coaxial loops around the sonde, and in turn create their own alternating magnetic field, which induces currents in the receiver coil of the sonde. The received signal is measured, and its size is proportional to the conductivity of the formation.
Calibration: Induction logs are calibrated at the wellsite in air (zero
conductivity) and using a 400ms test loop that is placed around the sonde. The calibration is subsequently checked in the well opposite zero conductivity formations (e.g., anhydrite), if available.
1- The 6FF40 Induction-Electrical Survey Log (IES-40)
It is a 6 coil device with a nominal 40 inch Tx-Rx distance, a 16 inch short normal device and an SP electrode.
2- The 6FF28 Induction-Electrical Survey Log (IES-28)
It is a smaller scale version of the IES-40. It is a 6 coil device with a nominal 28 inch Tx-Rx distance, a 16 inch short normal device and an SP electrode.
3- The Dual Induction-Laterolog (DIL)
It has several parts: (i) a deep penetrating induction log (ILd) that is similar to the IES-40, (ii) a medium penetration induction log (ILm), a shallow investigation laterolog (LLs) and an SP electrode. The ILm has a vertical resolution about the same as the ILd (and the IES-40), but about half the penetration depth.
4- The Induction Spherically Focused Log (ISF)
It combines (i) IES-40, (ii) a SFL, and (iii) an SP electrode. It is often run in combination with a sonic log.
5- Array Induction Tools (AIS, HDIL)
It consists of one Tx and four Rx coils. Intensive mathematical reconstruction of the signal enables the resistivity at a range of penetration depths to be calculated, which allows the complete invasion profile to be mapped.
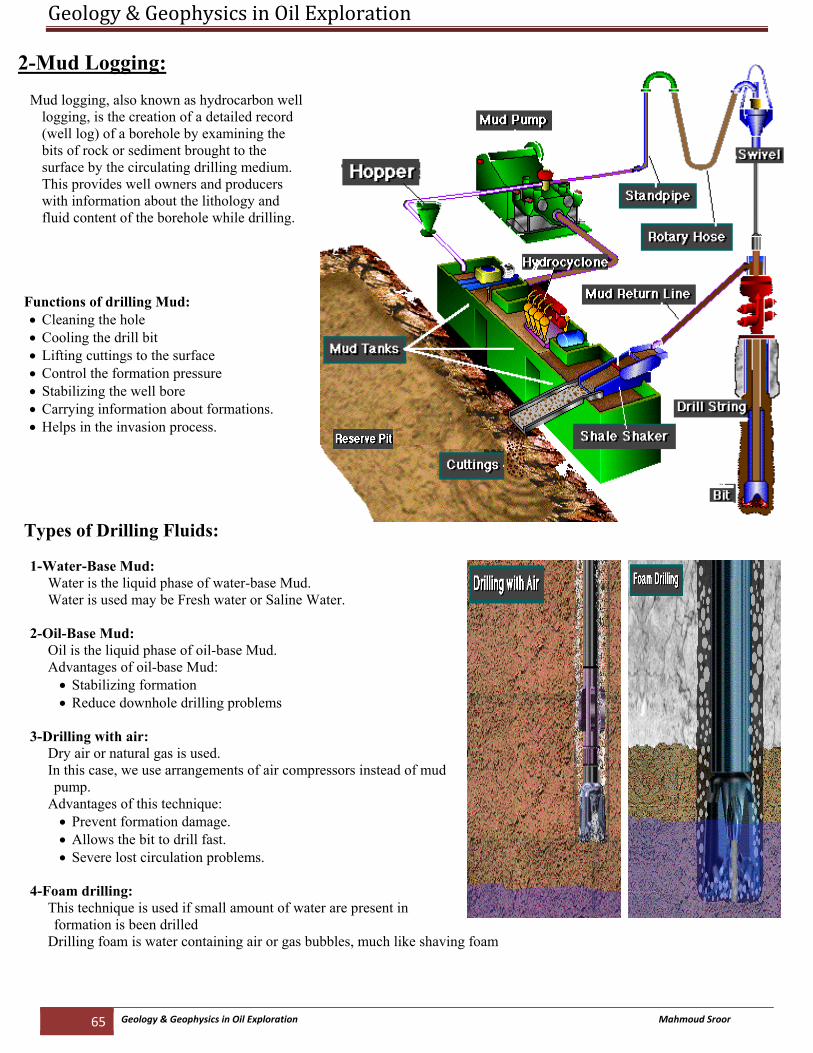
Geology & Geophysics in Oil Exploration
65 Geology & Geophysics in Oil Exploration Mahmoud Sroor
2-Mud Logging:
Mud logging, also known as hydrocarbon well logging, is the creation of a detailed record (well log) of a borehole by examining the bits of rock or sediment brought to the surface by the circulating drilling medium. This provides well owners and producers with information about the lithology and fluid content of the borehole while drilling.
Functions of drilling Mud: • Cleaning the hole • Cooling the drill bit • Lifting cuttings to the surface • Control the formation pressure • Stabilizing the well bore • Carrying information about formations. • Helps in the invasion process.
Types of Drilling Fluids: 1-Water-Base Mud:
Water is the liquid phase of water-base Mud. Water is used may be Fresh water or Saline Water.
2-Oil-Base Mud:
Oil is the liquid phase of oil-base Mud. Advantages of oil-base Mud:
• Stabilizing formation • Reduce downhole drilling problems
3-Drilling with air:
Dry air or natural gas is used. In this case, we use arrangements of air compressors instead of mud pump.
Advantages of this technique: • Prevent formation damage. • Allows the bit to drill fast. • Severe lost circulation problems.
4-Foam drilling:
This technique is used if small amount of water are present in formation is been drilled
Drilling foam is water containing air or gas bubbles, much like shaving foam
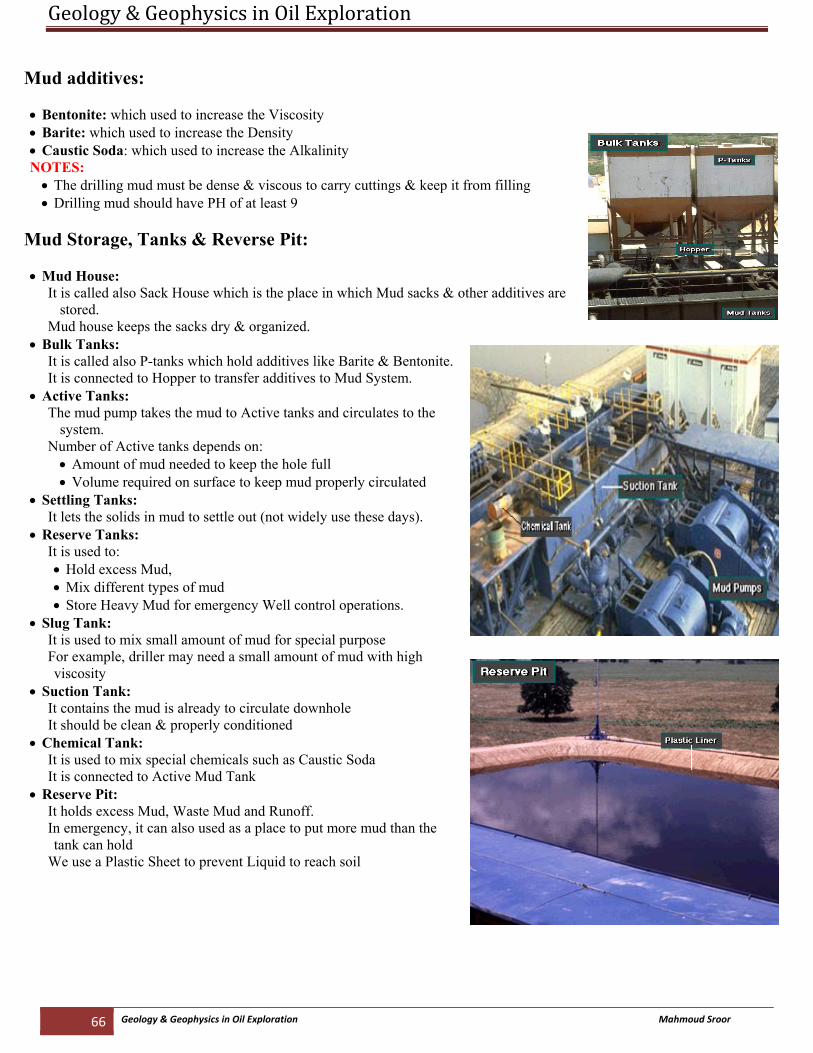
Geology & Geophysics in Oil Exploration
66 Geology & Geophysics in Oil Exploration Mahmoud Sroor
Mud additives: • Bentonite: which used to increase the Viscosity • Barite: which used to increase the Density • Caustic Soda: which used to increase the Alkalinity NOTES:
• The drilling mud must be dense & viscous to carry cuttings & keep it from filling • Drilling mud should have PH of at least 9
Mud Storage, Tanks & Reverse Pit: • Mud House:
It is called also Sack House which is the place in which Mud sacks & other additives are stored.
Mud house keeps the sacks dry & organized. • Bulk Tanks:
It is called also P-tanks which hold additives like Barite & Bentonite. It is connected to Hopper to transfer additives to Mud System.
• Active Tanks: The mud pump takes the mud to Active tanks and circulates to the
system. Number of Active tanks depends on:
• Amount of mud needed to keep the hole full • Volume required on surface to keep mud properly circulated
• Settling Tanks: It lets the solids in mud to settle out (not widely use these days).
• Reserve Tanks: It is used to: • Hold excess Mud, • Mix different types of mud • Store Heavy Mud for emergency Well control operations.
• Slug Tank: It is used to mix small amount of mud for special purpose For example, driller may need a small amount of mud with high viscosity
• Suction Tank: It contains the mud is already to circulate downhole It should be clean & properly conditioned
• Chemical Tank: It is used to mix special chemicals such as Caustic Soda It is connected to Active Mud Tank
• Reserve Pit: It holds excess Mud, Waste Mud and Runoff. In emergency, it can also used as a place to put more mud than the tank can hold
We use a Plastic Sheet to prevent Liquid to reach soil
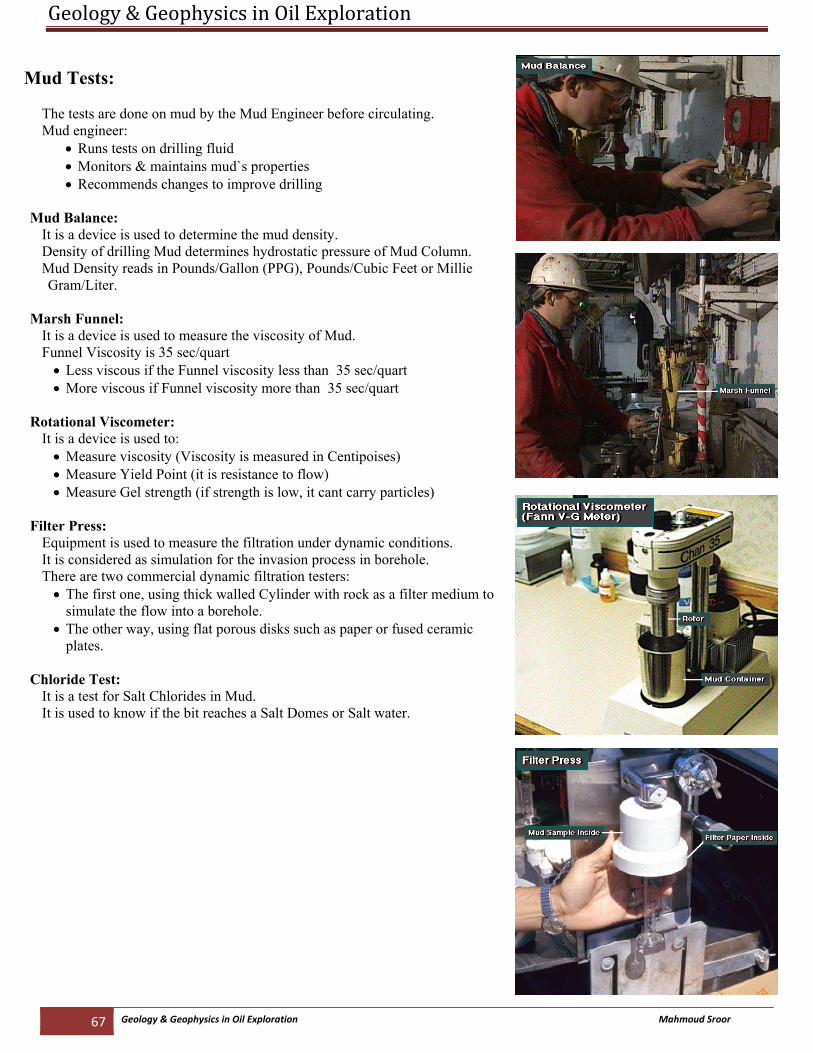
Geology & Geophysics in Oil Exploration
67 Geology & Geophysics in Oil Exploration Mahmoud Sroor
Mud Tests:
The tests are done on mud by the Mud Engineer before circulating. Mud engineer:
• Runs tests on drilling fluid • Monitors & maintains mud`s properties • Recommends changes to improve drilling
Mud Balance:
It is a device is used to determine the mud density. Density of drilling Mud determines hydrostatic pressure of Mud Column. Mud Density reads in Pounds/Gallon (PPG), Pounds/Cubic Feet or Millie Gram/Liter.
Marsh Funnel:
It is a device is used to measure the viscosity of Mud. Funnel Viscosity is 35 sec/quart
• Less viscous if the Funnel viscosity less than 35 sec/quart • More viscous if Funnel viscosity more than 35 sec/quart
Rotational Viscometer:
It is a device is used to: • Measure viscosity (Viscosity is measured in Centipoises) • Measure Yield Point (it is resistance to flow) • Measure Gel strength (if strength is low, it cant carry particles)
Filter Press:
Equipment is used to measure the filtration under dynamic conditions. It is considered as simulation for the invasion process in borehole. There are two commercial dynamic filtration testers:
• The first one, using thick walled Cylinder with rock as a filter medium to simulate the flow into a borehole.
• The other way, using flat porous disks such as paper or fused ceramic plates.
Chloride Test:
It is a test for Salt Chlorides in Mud. It is used to know if the bit reaches a Salt Domes or Salt water.
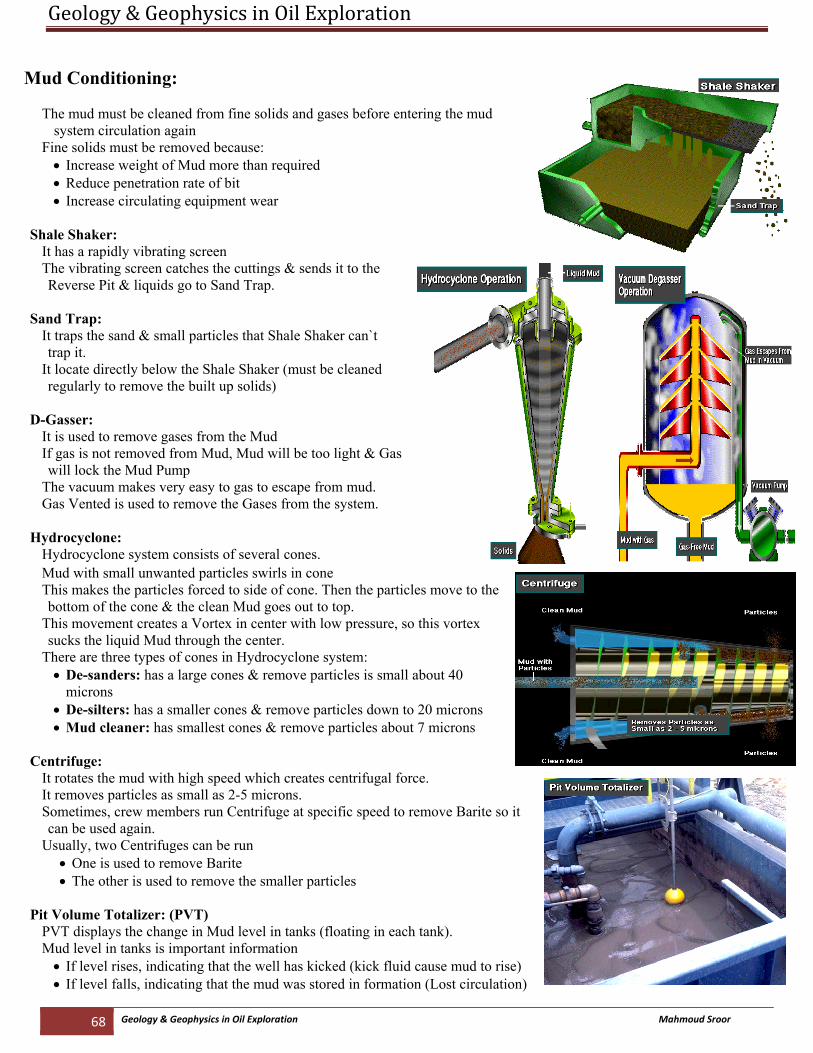
Geology & Geophysics in Oil Exploration
68 Geology & Geophysics in Oil Exploration Mahmoud Sroor
Mud Conditioning:
The mud must be cleaned from fine solids and gases before entering the mud system circulation again
Fine solids must be removed because: • Increase weight of Mud more than required • Reduce penetration rate of bit • Increase circulating equipment wear
Shale Shaker: It has a rapidly vibrating screen The vibrating screen catches the cuttings & sends it to the Reverse Pit & liquids go to Sand Trap.
Sand Trap:
It traps the sand & small particles that Shale Shaker can`t trap it.
It locate directly below the Shale Shaker (must be cleaned regularly to remove the built up solids)
D-Gasser:
It is used to remove gases from the Mud If gas is not removed from Mud, Mud will be too light & Gas will lock the Mud Pump
The vacuum makes very easy to gas to escape from mud. Gas Vented is used to remove the Gases from the system.
Hydrocyclone:
Hydrocyclone system consists of several cones. Mud with small unwanted particles swirls in cone This makes the particles forced to side of cone. Then the particles move to the bottom of the cone & the clean Mud goes out to top.
This movement creates a Vortex in center with low pressure, so this vortex sucks the liquid Mud through the center.
There are three types of cones in Hydrocyclone system: • De-sanders: has a large cones & remove particles is small about 40
microns • De-silters: has a smaller cones & remove particles down to 20 microns • Mud cleaner: has smallest cones & remove particles about 7 microns
Centrifuge:
It rotates the mud with high speed which creates centrifugal force. It removes particles as small as 2-5 microns. Sometimes, crew members run Centrifuge at specific speed to remove Barite so it can be used again.
Usually, two Centrifuges can be run • One is used to remove Barite • The other is used to remove the smaller particles
Pit Volume Totalizer: (PVT)
PVT displays the change in Mud level in tanks (floating in each tank). Mud level in tanks is important information
• If level rises, indicating that the well has kicked (kick fluid cause mud to rise) • If level falls, indicating that the mud was stored in formation (Lost circulation)
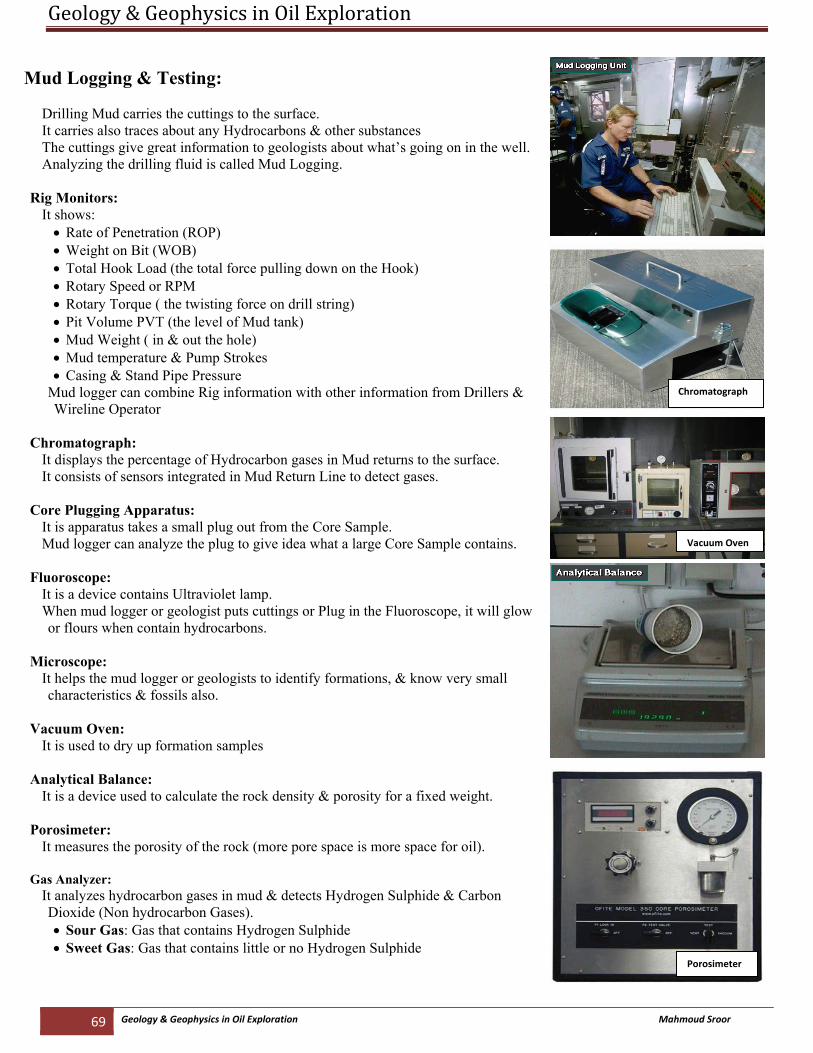
Geology & Geophysics in Oil Exploration
69 Geology & Geophysics in Oil Exploration Mahmoud Sroor
Mud Logging & Testing:
Drilling Mud carries the cuttings to the surface. It carries also traces about any Hydrocarbons & other substances The cuttings give great information to geologists about what’s going on in the well. Analyzing the drilling fluid is called Mud Logging.
Rig Monitors:
It shows: • Rate of Penetration (ROP) • Weight on Bit (WOB) • Total Hook Load (the total force pulling down on the Hook) • Rotary Speed or RPM • Rotary Torque ( the twisting force on drill string) • Pit Volume PVT (the level of Mud tank) • Mud Weight ( in & out the hole) • Mud temperature & Pump Strokes • Casing & Stand Pipe Pressure
Mud logger can combine Rig information with other information from Drillers & Wireline Operator
Chromatograph:
It displays the percentage of Hydrocarbon gases in Mud returns to the surface. It consists of sensors integrated in Mud Return Line to detect gases.
Core Plugging Apparatus:
It is apparatus takes a small plug out from the Core Sample. Mud logger can analyze the plug to give idea what a large Core Sample contains.
Fluoroscope:
It is a device contains Ultraviolet lamp. When mud logger or geologist puts cuttings or Plug in the Fluoroscope, it will glow or flours when contain hydrocarbons.
Microscope:
It helps the mud logger or geologists to identify formations, & know very small characteristics & fossils also.
Vacuum Oven:
It is used to dry up formation samples Analytical Balance:
It is a device used to calculate the rock density & porosity for a fixed weight. Porosimeter:
It measures the porosity of the rock (more pore space is more space for oil). Gas Analyzer:
It analyzes hydrocarbon gases in mud & detects Hydrogen Sulphide & Carbon Dioxide (Non hydrocarbon Gases). • Sour Gas: Gas that contains Hydrogen Sulphide • Sweet Gas: Gas that contains little or no Hydrogen Sulphide
Chromatograph
Vacuum Oven
Porosimeter
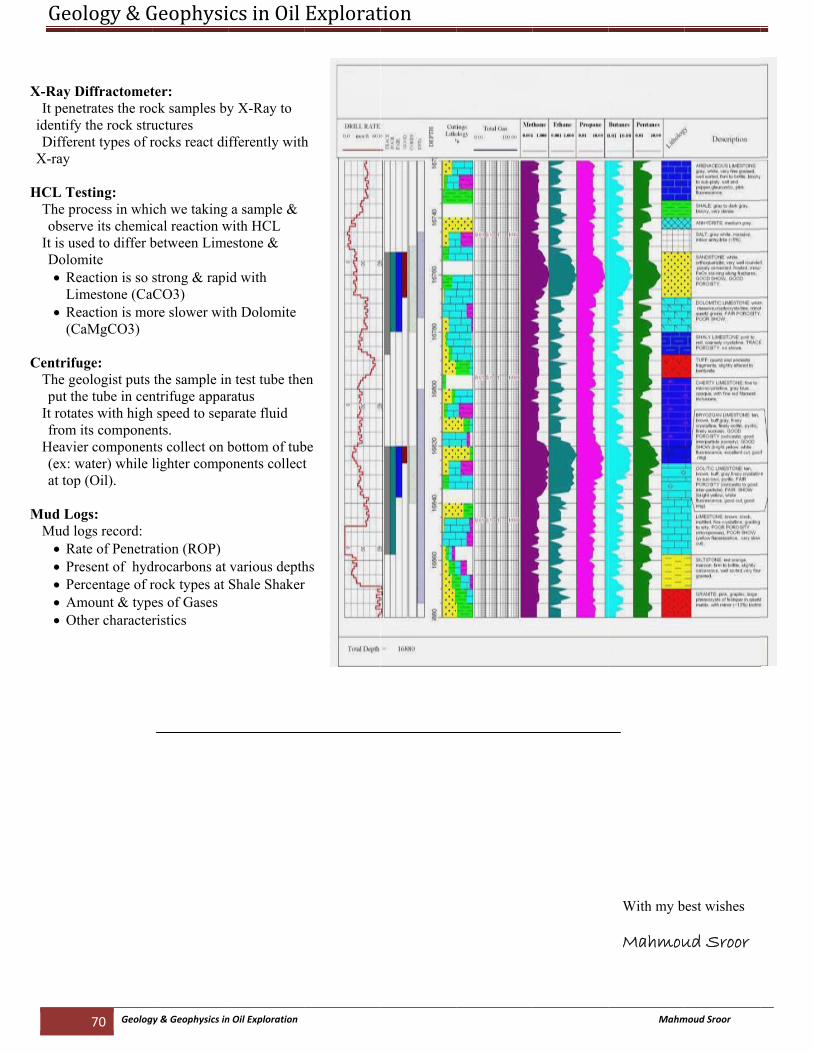
Geo
X-Ray DIt pen
identifyDiffer
X-ray
HCL TeThe probser
It is usDolo• R
Li• R
(C Centrifu
The gput th
It rotafrom
Heavi(ex: wat top
Mud Lo
Mud l• R• Pr• Pe• A• O
ology & G
70 Geolog
Diffractometetrates the rocy the rock strurent types of r
esting: rocess in whirve its chemicsed to differ b
omite eaction is so imestone (Caeaction is mo
CaMgCO3)
fuge: eologist puts he tube in cenates with high
m its componenier componenwater) while lp (Oil).
ogs: logs record: ate of Penetraresent of hydercentage of r
Amount & typether character
Geophysi
gy & Geophysics in
ter: ck samples byuctures rocks react di
ich we taking cal reaction wbetween Lime
strong & rapiaCO3) ore slower wit
the sample inntrifuge apparh speed to sepnts.
nts collect on blighter compo
ation (ROP) drocarbons at rock types at es of Gases ristics
cs in Oil
n Oil Exploration
y X-Ray to
fferently with
a sample & with HCL estone &
id with
th Dolomite
n test tube theratus arate fluid
bottom of tubonents collect
various depthShale Shaker
Explorat
h
en
be t
hs r
tion
Mahm
With my b
Mahmou
moud Sroor
best wishes
ud Sroor