exploration geophysics (geol 3092) for geology students
TRANSCRIPT
Exploration Geophysics (Geol 3092)
For Geology Students
Dessalegn G. (Dr.)Feb. 2010
Chapter One
Introduction To Exploration geophysics
Introduction • Exploration geophysics is an applied branch of geophysics which uses physical methods, such as seismic, gravitational, magnetic, electrical and electromagnetic at the surface o f the Ea r th to measure the phys i ca l properties of the subsurface, along with the anomalies in those properties
• It is most often used to detect or infer the presence and position of economically useful g e o l o g i c a l d e p o s i t s , s u c h a s o r e m i n e r a l s ; f o s s i l f u e l s a n d other hydrocarbons; geothermal reservoirs; and groundwater reservoirs.
Overview of the geophysical methods
1. GRAVITY METHODSGravity applications include:ü Fault problemsüGround water inventoriesü Intrusive delineationsüBasin studies
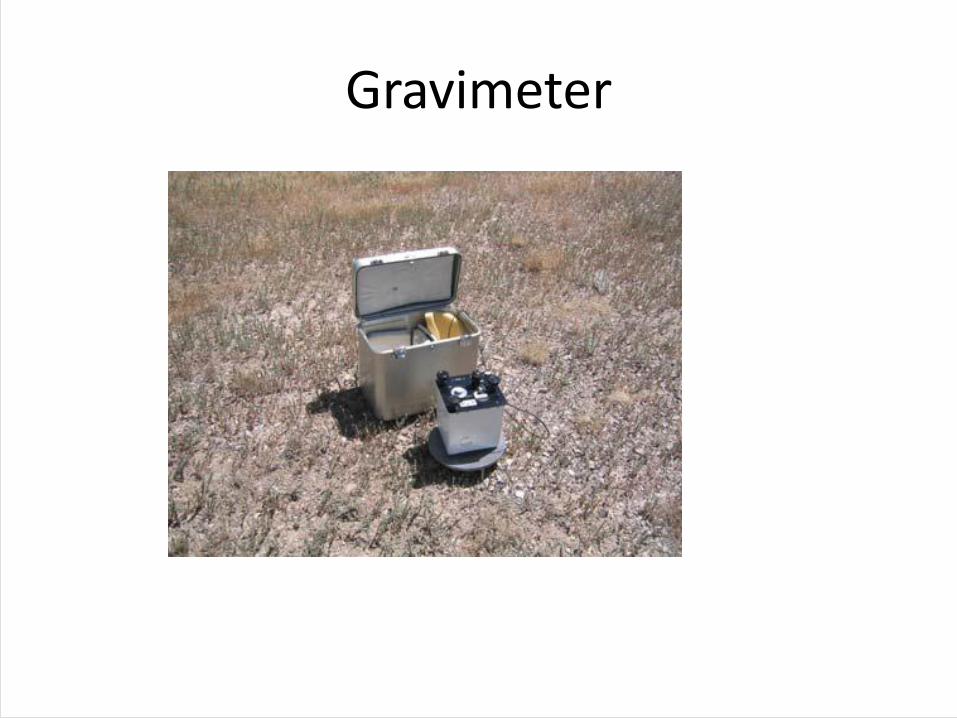
Gravimeter
2. MAGNETIC METHODvThis is an efficient and effective method to survey large areas for underground iron and steel objects such as tanks and barrels.
Magnetic surveys are useful in:ü Locating buried drums, tanks, and other metal objectsü Finding abandoned wellsü Mapping geologic structuresü Locating utilitiesü Investigating landfillsü Gathering of forensic evidence
3. SEISMIC METHODSvSeismic techniques are commonly used to determine site geology, stratigraphy, and rock quality. These techniques provide detailed information about subsurface layering and rock geo mechanical properties using seismic acoustical waves.
vReflection and Refraction are the most commonly used seismic techniques. These methods determine geological structure and rock velocities by either refracting or reflecting waves off boundaries between rock units with different seismic velocities or impedance.
Seismic Applications Include:ü General geologic structureü Faults and other hazardsü Landfill investigationsü Overburden thicknessü Rock rippability and qualityü Water table depthü Bedrock depthü Dynamic rock moduliü Vibration loading responseü Rock velocities and qualityü Geologic layering
4. Electrical (RESISTIVITY) methodvResistivity contrast occurs in the subsurface between, dry and water bearing sediments, d i ffer ing rock l i thologies and di ffer ing weathering histories.
vUsing an electrical apparatus with two current electrodes, one a source and the other a sink, and two potent ia l e lectrodes, a depth electrical profile can be measured when the electrode spacing is progressively expanded.
Resistivity surveys give insight on:ü Fault problemsü Water table determinationsü Contamination plumesü Lithologyü Landfillsü Tunnel/cavern mapping
5. ELECTROMAGNETIC METHODSvElectromagnetic induction (EM), as the name implies, uses the principle of induction to measure the electrical conductivity of the subsurface. Unlike conventional resistivity techniques, no ground contact is required. This eliminates direct electrical coupling problems and allows much more rapid data acquisition.
EM techniques are particularly useful in:ü Locating buried metal objects ü Delineating contamination plumesü Map soil salinity and salt water intrusionüDefining lateral changes in lithologyü Locating cavities (old mine tunnels)ü Locating water producing fracturesü Investigating LandfillsüGathering of forensic evidence
Use
vExploration geophysics is used to map the subsurface structure of a region, to elucidate the underlying structures, spatial distribution of rock units, and to detect structures such as faults, folds and intrusive rocks. This is an indirect method for assessing the likelihood of ore deposits or hydrocarbon accumulations.
vMethods devised for f inding mineral or hydrocarbon deposits can also be used in other areas such as monitoring environmental impact, imaging subsurface archaeological sites, ground water investigations, subsurface sal inity mapping, c iv i l engineering s ite investigations and interplanetary imaging.
Some of the main applications (Uses) of Exploration Geophysics are:
1. Mineral explorationv The most direct method of detection of ore via
m a g n e t i s m i n v o l v e s d e t e c t i n g i r o n ore mineral izat ion v ia mapping magnetic anomal ie s a s soc iated w i th banded i ron formations which usually contain magnetite in some proportion.
vGravity surveying can be used to detect dense bodies of rocks within host formations of less dense wall rocks.vElectromagnetic (EM) surveys can be used to help detect a wide variety of mineral deposits, especially base metal sulphides via detection of conductivity anomalies which can be generated around sulphide bodies in the subsurface.
vElectric-resistance methods such as induced polarization methods can be useful for directly detecting sulfide bodies, coal and resistive rocks such as salt and carbonates.
2. Hydrocarbon explorationvSeismic reflection techniques are the most widely used geophys i ca l techn ique in hydrocarbon exploration.vGravity and magnetic are also used, with considerable frequency, in oil and gas exploration. These can be used to determine the geometry and depth of covered geological structures including uplifts, subsiding basins, faults, folds, igneous intrusions and salt diapirs due to their unique density and magnetic susceptibility signatures compared to the surrounding rocks.
For Civil engineering
1. Ground penetrating radarv Ground penetrating radar is a non-invasive
technique, and is used within civil construction and engineering for a variety of uses, including detection of utilities (buried water, gas, sewerage, electrical and telecommunication cables), mapp i n g o f s o f t s o i l s a nd o ve r bu rden for geotechnical characterization, and other similar uses.
2. Spectral-Analysis-of-Surface-WavesvThe Spectral-Analysis-of-Surface-Waves (SASW) method is another non-invasive technique, which is widely used in practice to image the shear wave velocity profile of the soil. The SASW method relies on the dispersive nature of Raleigh waves in layered media, i.e., the wave-velocity depends on the load's frequency.
3. Full waveform inversionvFull-waveform-inversion (FWI) methods are among t h e mo s t r e c en t t e c hn i que s fo r geotechnical site characterization, and are still under continuous development. The method is fairly general, and is capable of imaging the arbitrarily heterogeneous compression and shear wave velocity profiles of the soil.
4. Other techniquesvCivil engineering can also use remote sensing information for topographical mapping, p l a nn i n g a nd env i ronmenta l impa c t assessment. Airborne electromagnetic surveys are also used to characterize soft sediments in planning and engineering roads, dams and other structures.
Chapter Two
The Gravity Geophysical Method
IntroductionvThe p r imary goa l o f s tudy ing
detailed gravity data is to provide a b e t t e r u n d e r s t a n d i n g o f t h e subsurface geology. The gravity method is a relatively cheap, non-invasive, non-destructive remote sensing method that has already been tested on the lunar surface.
vIt is also passive – that is, no energy need be put into the ground in order to acquire data; thus, the method is well suited to a populated setting such as Taos, and a remote setting such as Mars. The small portable instrument also permits walking traverses – ideal, in view of the congested tourist traffic in Taos.
vMeasurements of gravity provide information about densities of rocks underground. There is a wide range in density among rock types, and therefore geologists can make inferences about the distribution of strata. In the Taos Valley, we are attempting to map subsurface faults. Because faults commonly juxtapose rocks of differing densities, the gravity method is an excellent exploration choice.
Gravity and geology
vDensity is a mass per volume. Units that describe density of a substance are gram per centimetre cubed.
vPoint masses are small units of mass that can attract each other.
vThe density of the material can be thought of as a number that quantifies the number of point masses needed to represent the material per unit volume.
vThe more close point masses that are directly below the ball, the larger its acceleration will be.
vT h e v a r i a t i o n o f g r a v i t a t i o n a l acceleration is not dependent on the absolute density of the rocks instead it is dependant on the density difference b/n the ore body and the surrounding soils.
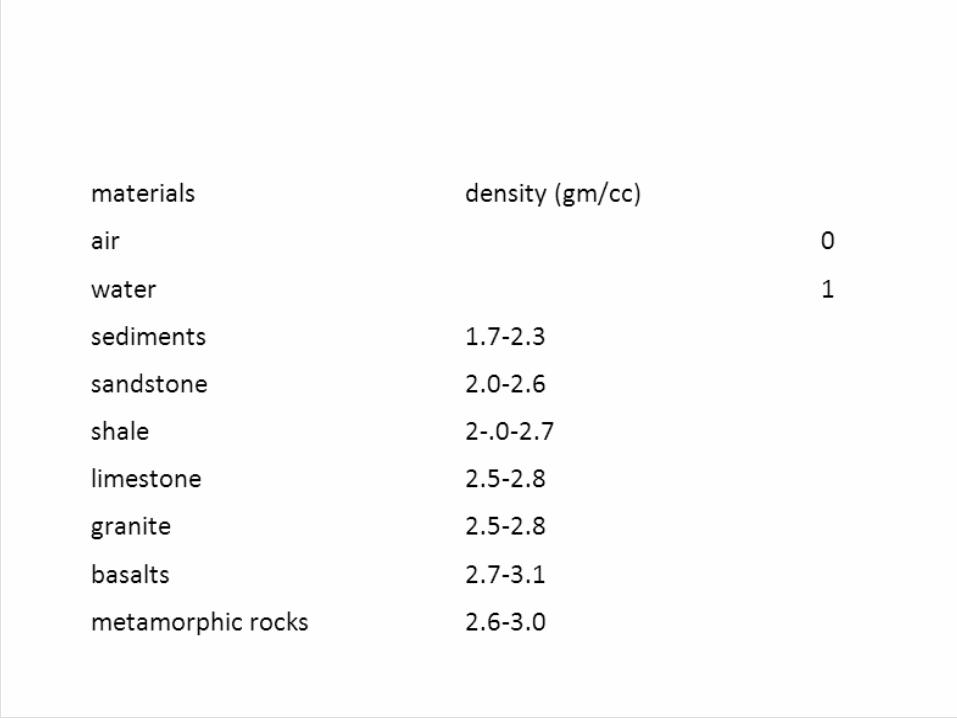
vThe relative variation of the rock is quite small, 0.8 gm/cc and there is a considerable overlap in the measured densities.
vHence, knowledge of rock density alone will not be sufficient to determine rock type.
vThe small variation in rock density also implies that the spatial variat ions in the observed gravitational acceleration caused by geologic structures will be quite small and thus difficult to detect.

Universal GravitationvDefinition: every particle in the Universe
attracts every other particle with a force that is directly proportional to the product of their masses and inversely proportional to the square of the distance between them.vIf the particles have masses m1 and m2 and are
separated by a distance r, the magnitude of this gravitational force is
vWhere G i s a cons tan t , ca l led the universal gravitational constant that has been measured experimentally. Its value in SI units is
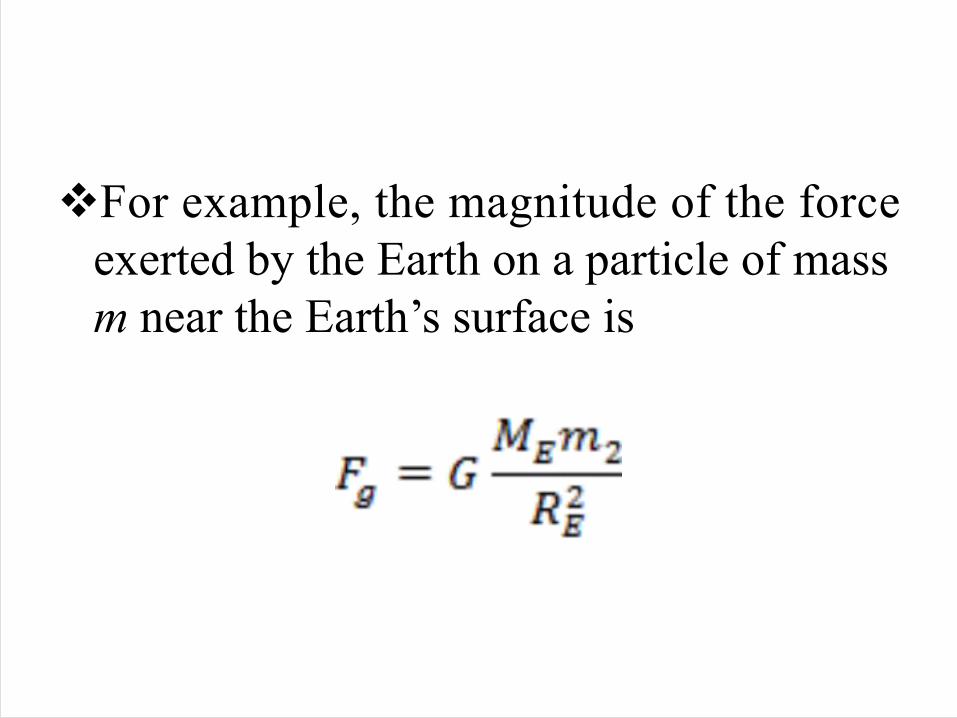
vFor example, the magnitude of the force exerted by the Earth on a particle of mass m near the Earth’s surface is

vwhere ME is the Earth’s mass and RE its radius. This force is directed toward the center of the Earth.
Example : Three 0.300-kg billiard balls are placed
on a table at the corners of a right triangle, as s h o w n i n F i g u r e b e l o w C a l c u l a t e t h e gravitational force on m1 resulting from the other two balls.

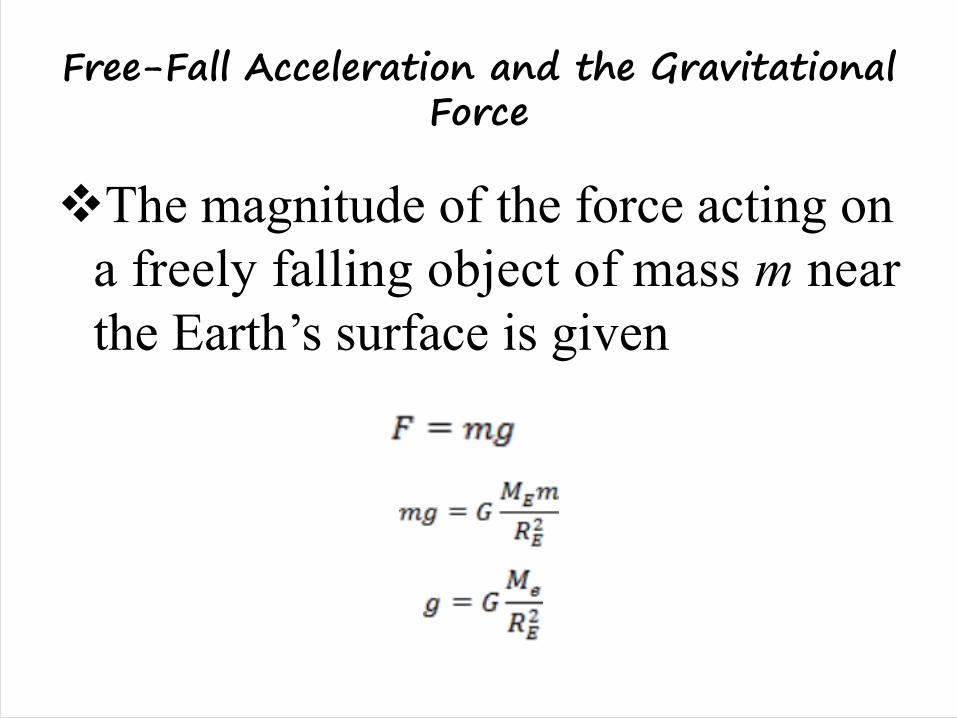
Free-Fall Acceleration and the Gravitational Force
vThe magnitude of the force acting on a freely falling object of mass m near the Earth’s surface is given
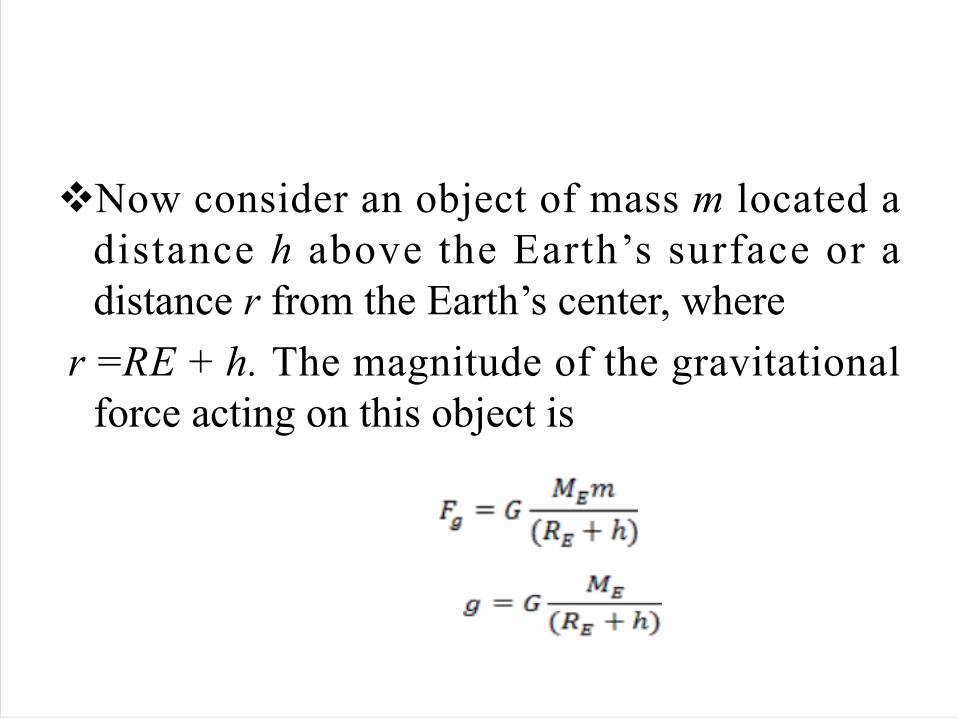
vNow consider an object of mass m located a distance h above the Earth’s surface or a distance r from the Earth’s center, where
r =RE + h. The magnitude of the gravitational force acting on this object is
vThus, it follows that g decreases with increasing altitude. Because the weight of an object is mg, we see that as , its weight approaches zero.
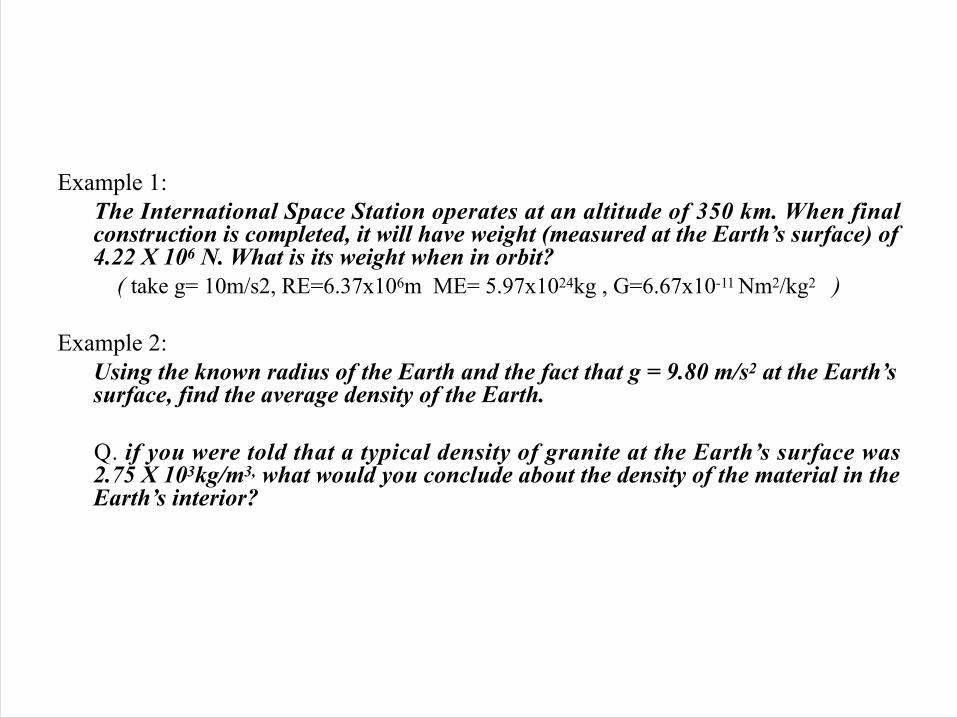
Example 1:The International Space Station operates at an altitude of 350 km. When final construction is completed, it will have weight (measured at the Earth’s surface) of 4.22 X 10⁶ N. What is its weight when in orbit?
( take g= 10m/s2, RE=6.37x10⁶m ME= 5.97x1024kg , G=6.67x10⁻¹¹ Nm2/kg2 ) Example 2:
Using the known radius of the Earth and the fact that g = 9.80 m/s2 at the Earth’s surface, find the average density of the Earth.
Q. if you were told that a typical density of granite at the Earth’s surface was 2.75 X 10³kg/m3, what would you conclude about the density of the material in the Earth’s interior?
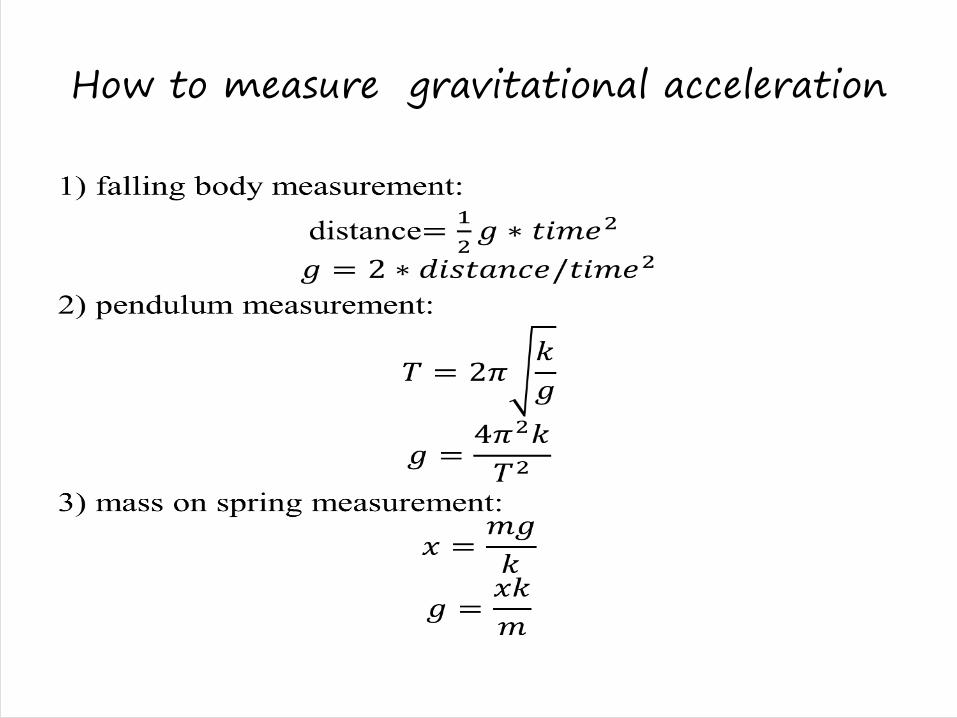
How to measure gravitational acceleration
vThe per iod and f requency of a s imple pendulum depend only on the length of the string and the acceleration due to gravity.vBecause the period is independent of the mass,
we conclude that all simple pendula that are of equal length and are at the same location (so that g is constant) oscillate with the same period.
vThe s imple pendulum can be used as a timekeeper because its period depends only on its length and the local value of g. It is also a conven ien t dev ice for mak ing prec i se measurements of the free-fall acceleration. Such measurements are important because variations in local values of g can provide information on the location of oil and of other valuable underground resources.
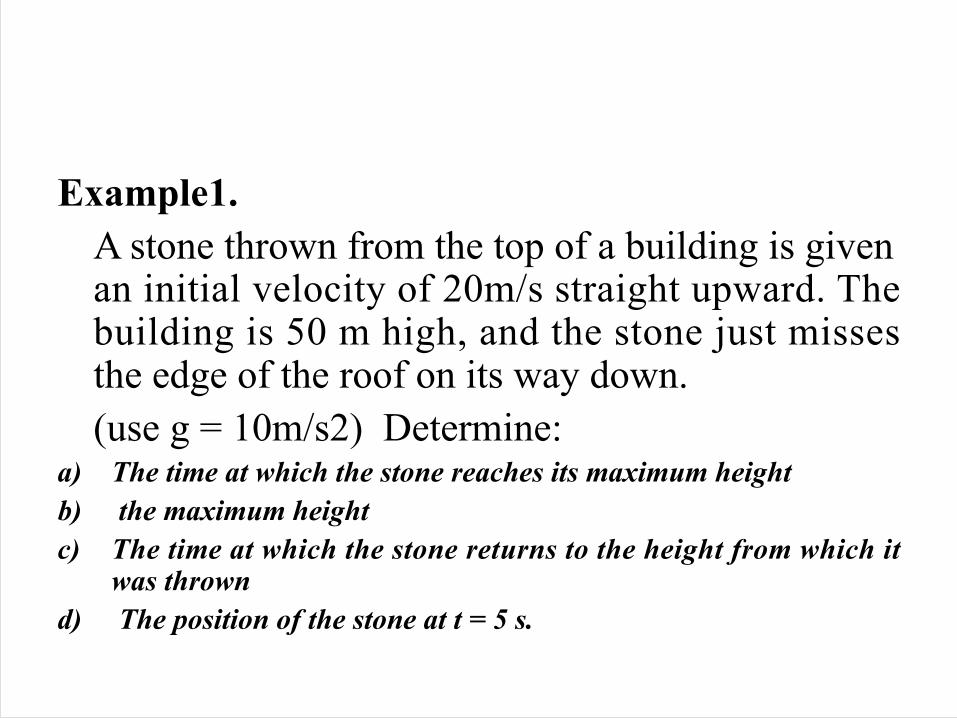
Example1.A stone thrown from the top of a building is given an initial velocity of 20m/s straight upward. The building is 50 m high, and the stone just misses the edge of the roof on its way down. (use g = 10m/s2) Determine:
a) The time at which the stone reaches its maximum heightb) the maximum heightc) The time at which the stone returns to the height from which it
was thrownd) The position of the stone at t = 5 s.
Example 2.A block of mass 10kg is connected to a spring of spring constant 400N/M on a smooth ground surface. What is the maximum displacement of the spring due to this attached block ? (Use g=10m/s2)
Example 3.Christian Huygens (1629–1695), the greatest clockmaker in history, suggested that an international unit of length could be defined as the length of a simple pendulum having a period of exactly 1 s. How much shorter would our length unit be had his suggestion been followed?
Q. If the man had been born on another planet What would the value for g have to be on that planet such that the meter based on Huygens’s pendulum would have 0.2m for the same time given above ?
Factors affecting gravitational acceleration
1) temporal based variation1.1) instrumental drift: v Changing of spring properties due to stretching of the spring over time or related to temperature changes.v In addition, the elastic properties of the spring are not perfect, but creep slowly with time.
1.2) tidal effect:v During the day, while measurements are being made, the gravimeter
is subject to tidal attraction, including vertical displacement due to the bodily Earth-tides.
v The distortion of the solid earth produces measureable changes in the gravitational acceleration.
v It represents a real change in the gravitational acceleration.
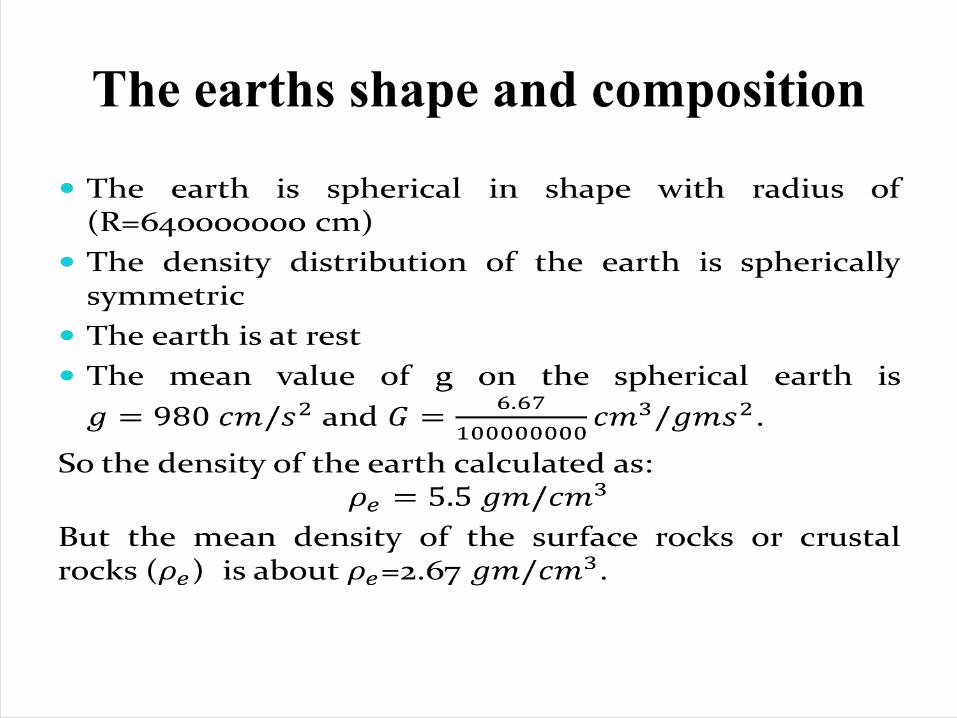
The earths shape and composition

v Before the era of scientific awakening the Earth’s shape was believed to be a sphere.
v The best mathematical approximation to the figure is an oblate ellipsoid, or spheroid
v The gravitational forces of Sun and Moon deform the Earth’s shape, causing tides in the oceans, atmosphere and solid body of the Earth.
v The Earth’s rotational vector is affected by the gravitational attractions of the Sun, Moon and the planets. The rate of rotation and the orientation of the rotational axis change with time. The orbital motion around the Sun is also affected.
v Due to the attractions of the earth by moon and sun, the distortion of the earth is produced.

Normal gravity
Gravitational Corrections
vObserved Gravity (go b s ) - Gravity readings observed at each gravity station after corrections have been applied for instrument drift and earth tides.vLatitude Correction (gn ) - Correction
subtracted from gobs that accounts for Earth's elliptical shape and rotation.

vThe gravity value that would be observed if Earth were a perfect (no geologic or topographic complexities), rotating ellipsoid is referred to as the normal gravity.gn = 978031.85 (1.0 + 0.005278895 sin2(lat) + 0.000023462 sin4(lat)) (mGal)
Where lat is latitude
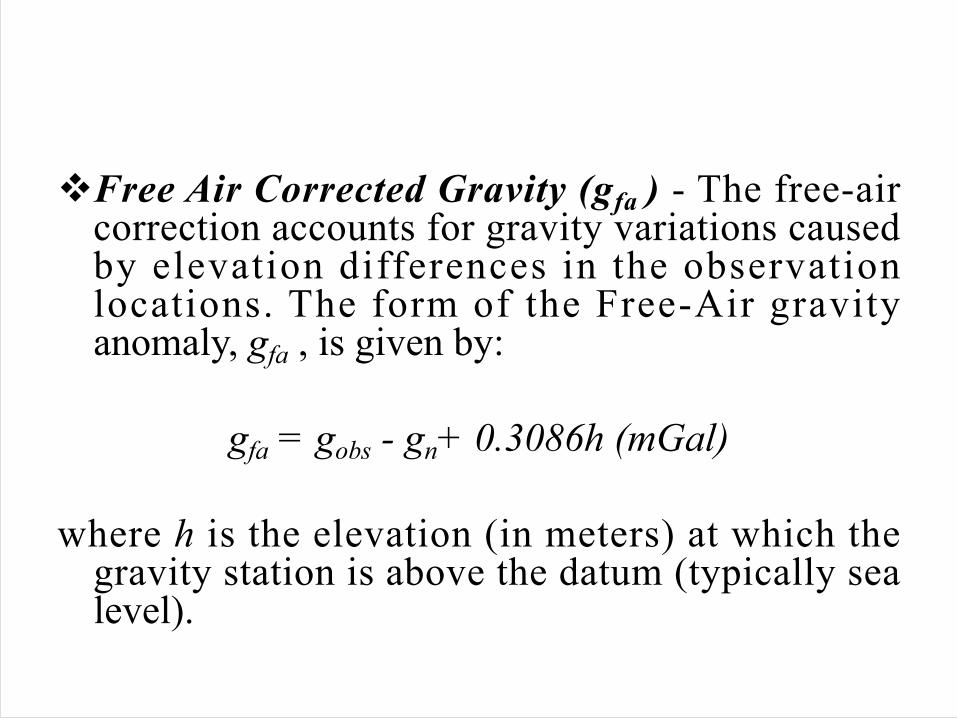
vFree Air Corrected Gravity (gfa ) - The free-air correction accounts for gravity variations caused by elevation differences in the observation locations. The form of the Free-Air gravity anomaly, gfa , is given by:
gfa = gobs - gn+ 0.3086h (mGal)
where h is the elevation (in meters) at which the gravity station is above the datum (typically sea level).
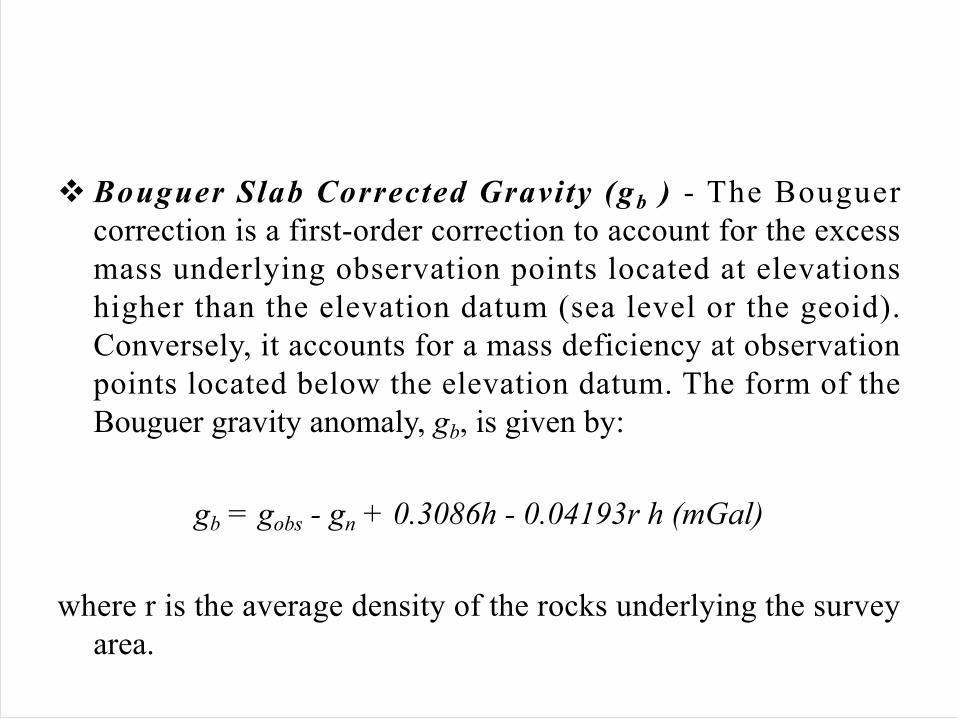
v Bouguer Slab Corrected Gravity (gb ) - The Bouguer correction is a first-order correction to account for the excess mass underlying observation points located at elevations higher than the elevation datum (sea level or the geoid). Conversely, it accounts for a mass deficiency at observation points located below the elevation datum. The form of the Bouguer gravity anomaly, gb, is given by:
gb = gobs - gn + 0.3086h - 0.04193r h (mGal)
where r is the average density of the rocks underlying the survey area.

v Terrain Corrected Bouguer Gravity (gt ) - The Terrain correction accounts for variat ions in the observed gravitat ional accelerat ion caused by variat ions in topography near each observation point. Because of the assumptions made during the Bouguer Slab correction, the terrain correction is positive regardless of whether the local topography consists of a mountain or a valley. The form of the Terrain corrected, Bouguer gravity anomaly, gt , is given by:
gt = gobs - gn + 0.3086h - 0.04193r h + TC (mGal)
where TC is the value of the computed Terrain correction.
Chapter Three
The magnetic Geophysical Methods
The magnetic Methods
vIt is an efficient and effective method to survey large areas for underground iron and steel objects such as tanks and barrels.v Magnetic measurement of the Earth’s total
magnetic field and local magnetic gradients are u sua l l y m a d e w i t h p r o t o n p r e c e s s i o n magnetometers at points along a line which should be oriented at a high angle to the suspected trend of structures.
vFor local surveys, the Earth’s area field may be considered uniform. v Local geological and cultural magnetic
m a t e r i a l s w i l l t h e n e x p r e s s t h e i r distribution by local perturbations in the Earth’s field. In general, sedimentary rocks are non-magnetic while igneous and metamorphic rocks are magnetic.
vThe Earth possesses a magnetic field caused primarily by sources in the core. The form of the field is roughly the same as would be caused by a dipole or bar magnet located near the Earth's center and aligned sub parallel to the geographic axis.
vMany rocks and minerals are weakly magnetic or are magnetized by induction in the Earth's field, and cause spatial perturbations or "anomaly" in the Earth's main field. vMagnetic methods are generally used to map
the location and size of ferrous objects.
vThe Earth's magnetic field dominates most magnetic measurements made at or near the surface of the Earth. The Earth's total field intensity varies considerably by location over the surface of the Earth. vMost materials except for permanent magnets,
exhibit an induced magnetic field due to the behavior of the material when the material is in a strong field such as the Earth's.
vThe induced magnetization is equal to the product of the volume magnetic susceptibility and the inducing field of the Earth:
Where
Application of Magnetic Method
v Locating buried drums, tanks, and other metal objectsv Finding abandoned wellsvMapping geologic structuresv Investigating landfillsvGathering of forensic evidence
Classification of Magnetic Substances
Substances can be classified as belonging to one of three categories, depending on their magnetic properties:Ø Paramagnetic Ø ferromagnetic materials
are those made of atoms that have permanent magnetic moments.
ØDiamagnetic materials :-are those made of atoms that do not have permanent magnetic moments.
vFor paramagnetic and diamagnetic substances, the magnetization vector M is propor t ional to the magnet ic f ie ld strength H. For these substances placed in an external magnetic field, we can write
M = x H
vwhere x (Greek letter chi) is a dimensionless factor called the magnetic susceptibility.
vIt can be considered a measure of how susceptible a material is to being magnetized.
vFor paramagnetic substances, x is positive and M is in the same direction as H. For diamagnetic substances, x is negative and M is opposite H.
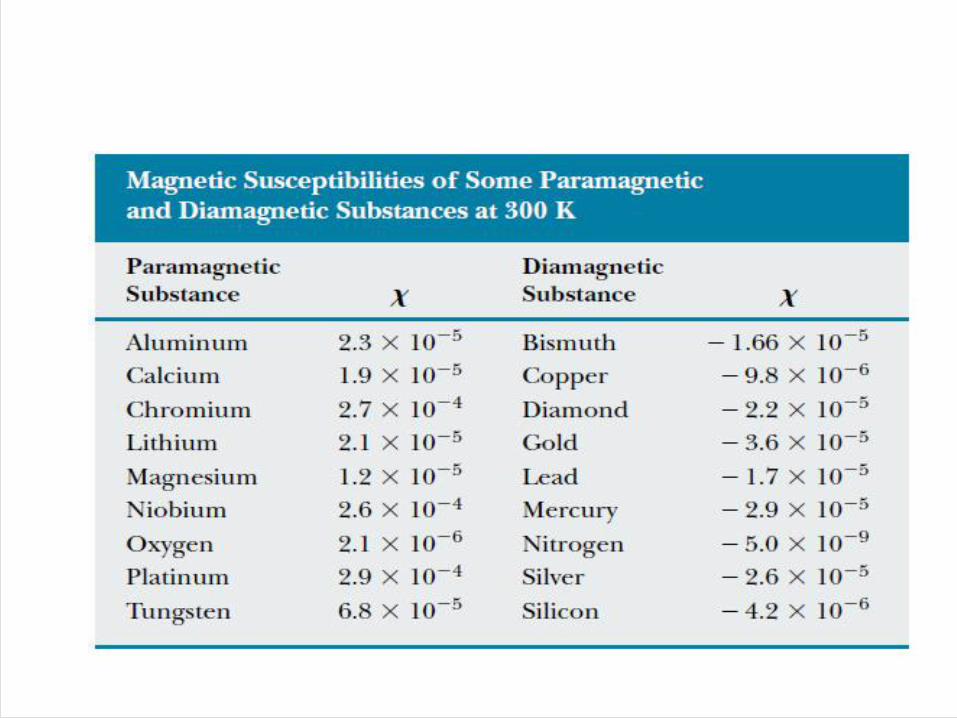
vThe susceptibilities of some substances are given in Table below.
Substituting Equation M = x H for M into Equation B = µ0(H + M) gives:
B = µ0(H + x H ), B= µ0 (1+x)H=µm H• where the constant µm is called the magnetic
permeability of the substance.
vSubstances may be classified in terms of how their magnetic permeability µm compares with µ0 (the permeability of free space), as follows:
Paramagnetic µm > µ0
Diamagnetic µm < µ0
The Magnetic Field of the Earth
vLike gravity, Earth's magnetic field depends on earth's internal properties and so has provided a wealth of information on the interior of the planet. The earth i t se l f i s a grea t magnet , causing a compass needle to assume its various directions in different localities.

vThe earth's magnetic field (B- field) can be represented by a magnetic dipole (imagine a huge bar magnet at the center of the earth) situated at the center of the earth. The B- field is a vector quantity that is far from being constant either in magnitude or in direction and varies spatially over the surface of the earth as well as in time.
vThe two points on the earth's surface at which the magnetic field is vertical (has no horizontal component) are called the magnetic poles. The magnetic equator is the line along which the magnetic field is horizontal and has no vertical component.

vthe Earth’s south magnetic pole is located near the north geographic pole, and the Earth’s north magnetic pole is located near the south geographic pole.
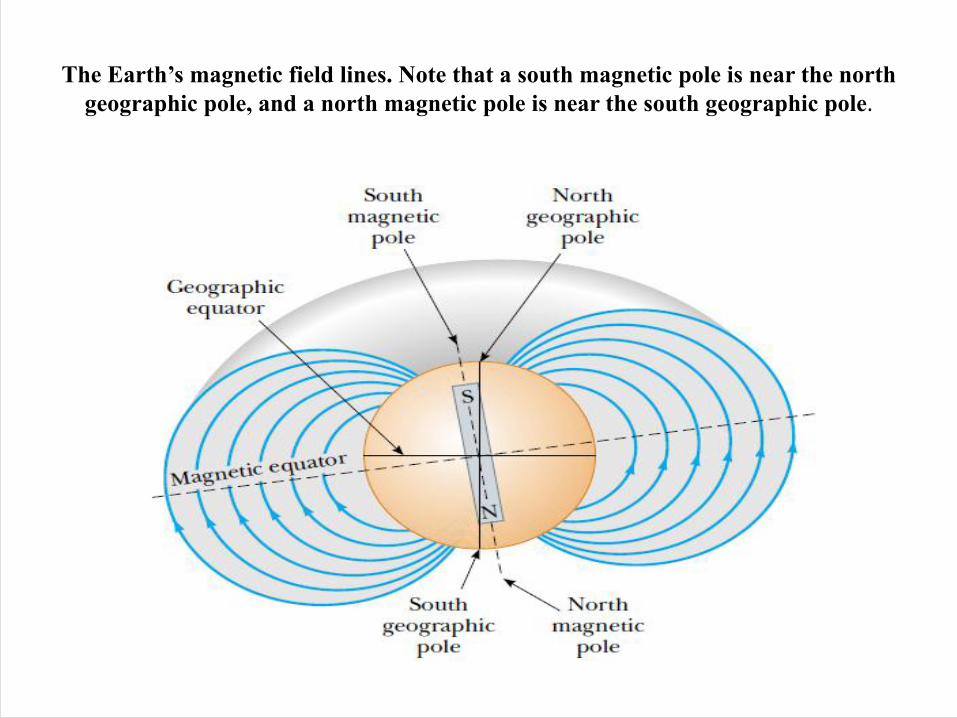
The Earth’s magnetic field lines. Note that a south magnetic pole is near the north geographic pole, and a north magnetic pole is near the south geographic pole.
vIf a compass needle is suspended in bearings that allow it to rotate in the vertical plane as well as in the horizontal plane, the needle is horizontal with respect to the Earth’s surface only near the equator. vAs the compass is moved northward, the
needle rotates so that it points more and more toward the surface of the Earth.
Instrumentation
vT h e r e a r e m a n y d i f f e r e n t t y p e s o f magnetometers in use today for varying purposes.v F o r e n v i r o n m e n t a l a n d e n g i n e e r i n g
investigations the current standards are generally proton procession and cesium vapor.vThe magnetometer type reflects the physical
process by which the magnet ic f ie ld is measured.
vProton procession instruments have a sensor filled with a hydrogen rich fluid (similar to kerosene). vAn inductor creates a strong magnetic field in
the fluid resulting in the alignment of protons.
vWhen the inducted current is suspended, the relaxation rate as the protons return to area magnetic conditions is recorded.
vThis rate is directly proportional to the magnetic field.
vA cesium vapor magnetometer is usually made up of a photon emitter, an absorption chamber, a buffer gas, and a photon detector. vThe known properties of a cesium atom allow
for the displacement of electrons by applying photons. Cesium can exist at any of nine energy levels; however, it is only affected by the photons at three of the nine energy levels.
vGiven the requirements for high data density and high acquisition rate, the cesium vapor approach is generally more favorable due to the faster measurement speed. vProton procession magnetometers are
frequently incorporated as base stations in these types of investigations.
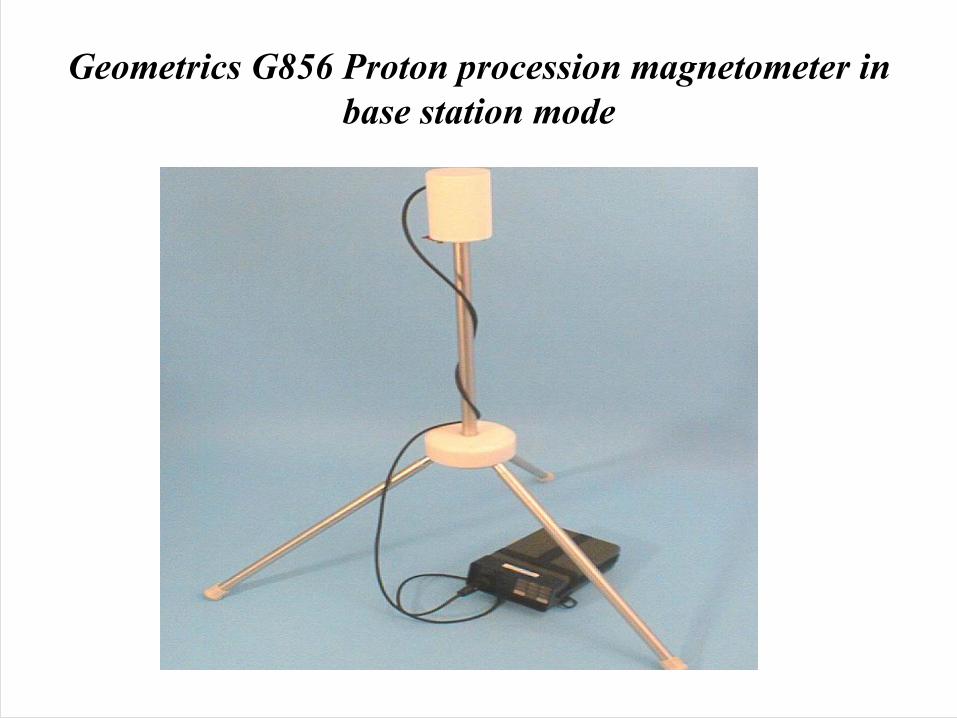
Geometrics G856 Proton procession magnetometer in base station mode

G858 cesium vapor magnetometer, in gradiometer configuration
Data Acquisition
vGround magnetic measurements are usually made with portable instruments at regular intervals along more or less straight and parallel lines that cover the survey area. vOften the interval between measurement
locations (stations) along the lines is less than the spacing between lines.
vThe magnetometer is a sensitive instrument that is used to map spatial variations in the Earth's magnetic field. vIn the proton magnetometer, a magnetic field
that is not parallel to the Earth's field is applied to a fluid rich in protons causing them to partly align with this artificial field.
vWhen the controlled field is removed, the protons tend to return to its original direction in the earth's magnetic field by précising around the Earth 's f ie ld at a frequency depending on the intensity of the Earth's field. vBy measuring this precession frequency, the
total intensity of the field can be determined.
vT h e p h y s i c a l b a s i s f o r s e v e r a l o t h e r magnetometers , such as the ces ium or rubidium-vapor magnetometers, is similarly founded in a fundamental physical constant. vThe optically pumped magnetometers have
increased sensitivity and shorter cycle times (as small as 0.04 s), making them particularly useful in airborne applications.
vThe magnetometer is operated by a single person. However, grid layout, surveying, or the buddy system may require the use of another technician.v If two magnetometers are available,
production is usually doubled as the ordinary operation of the instrument itself is straightforward.
Distortion
vSteel and other ferrous metals in the vicinity of a magnetometer can distort the data. Large belt buckles, etc., must be removed when operating the unit. vA compass should be more than 3 m
away from the magnetometer when measuring the field.
vA final test is to immobilize the magnetometer and take readings while the operator moves around the sensor. If the readings do not change by m or e t ha n 1 o r 2 nT , t h e o p e r a t o r i s "magnetically clean."
v Z ippers , watches , eyeglass f rames , boot grommets, room keys, and mechanical pencils can all contain steel or iron. On very precise surveys, the operator effect must be held under 1 nT.
vTo obtain a representative reading, the sensor should be operated well above the ground. This procedure i s done because of the probability of collections of soil magnetite disturbing the reading near the ground. v In rocky terrain where the rocks have some
percentage of magnetite, sensor heights of up to 4 m have been used to remove near-surface effects.

vData recording methods will vary with the purpose of the survey and the amount of noise present.
v Methods include taking three readings and averaging the results, taking three readings within a meter of the station and either recording each or recording the average.
vSome magnetometers can apply either of these methods and even do the averaging internally. vAn experienced field geophysicist will specify
which technique is required for a given survey.vIn either case, the time of the reading is also
recorded unless the magnetometer stores the readings and times internally.
vItems to be recorded in the field book for magnetics include:
a)Station location, including locations of lines with respect to permanent landmarks or surveyed points.
b)Magnetic field and/or gradient reading.c)Time.d)Nearby sources of potential interference.
vThe experienced magnetics operator will be alert for the possible occurrence of the following:
1. Excessive gradients may be beyond the magnetometer's ability to make a stable measurement. Modern magnetometers give a quality factor for the reading. Multiple measurements at a station, minor adjustments of the station location and other adjustments of technique may be necessary to produce repeatable, representative data.
2. Nearby metal objects may cause interference. Some items, such as automobiles, are obvious, but some subtle interference will be recognized only by the imaginative and observant magnetics operator. Old buried curbs and foundations, buried cans and bottles, power lines, fences, and other hidden factors can greatly affect magnetic readings.
Data Processing and Interpretation
vThe correction for diurnal drift can be made by repeat measurements of a base s t a t ion a t f r equen t in t e rva l s . The measurements at field stations are then cor rec ted fo r t empora l va r i a t ions assuming a linear change of the field between repeat base station readings.
vContinuously recording magnetometers can also be used at fixed base sites to monitor the temporal changes. If time is accurately recorded at both base site and field location, the field data can be corrected by subtraction of the variations at the base site.
vAfter all corrections have been made, magnetic survey data are usually displayed as individual profiles (Figure 1) or as contour maps (Figure 2). Identification of anomalies caused by cultural features, such as railroads, pipelines, and bridges is commonly made using field observations and maps showing such features.
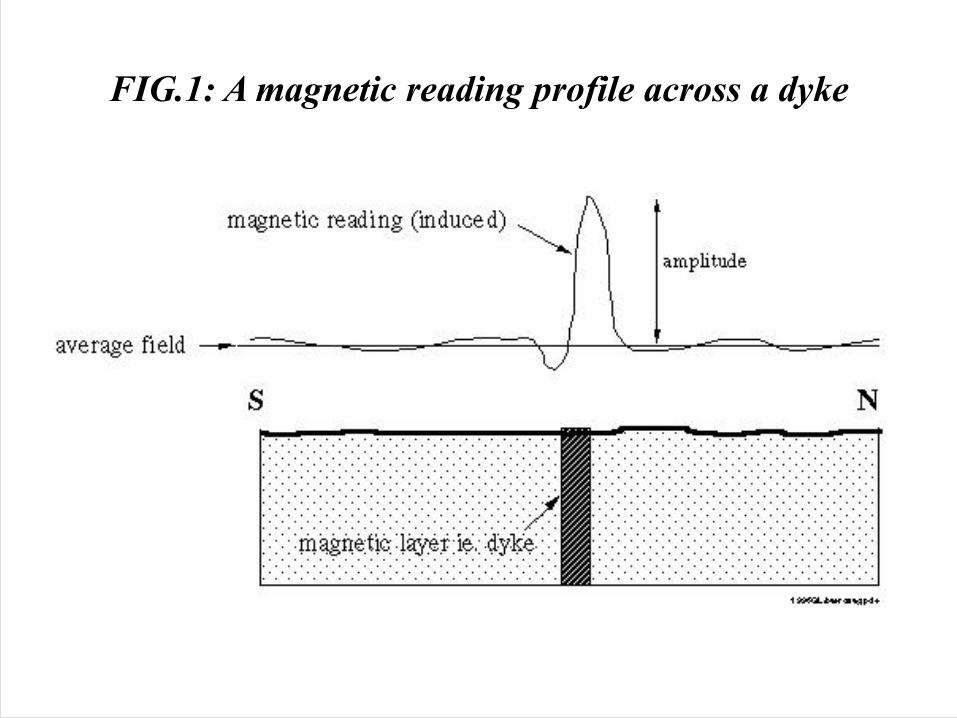
FIG.1: A magnetic reading profile across a dyke
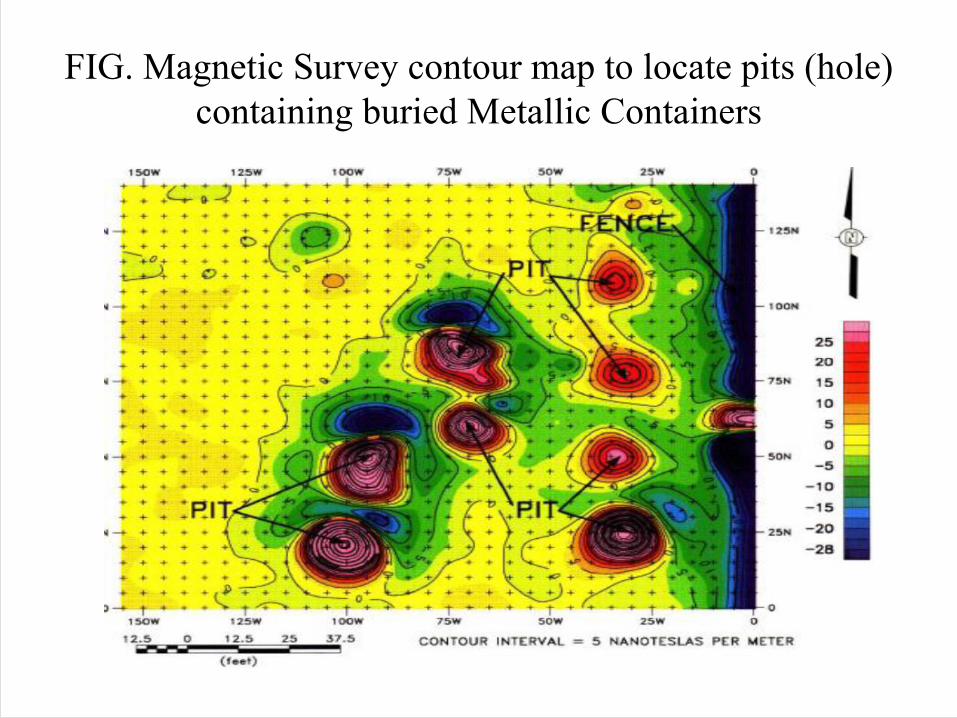
FIG. Magnetic Survey contour map to locate pits (hole) containing buried Metallic Containers

Chapter Four
The Seismic Method
vSeismic methods are based on the laws of elastic wave propagation in the ground. T h e p r o p a g a t i o n v e l o c i t y a n d charac ter i s t ic of se ismic waves i s predominately affected by mechanical properties of the soil/rock (bulk modulus, shear modulus, density).
vThe goal of all seismic methods is to der ive the d i s t r ibu t ion of se i smic velocities and thus used to image the ground’s structure from the observation and ana lys i s o f t he s e i smic wave propagation.

vS e i s m i c w a v e s c a n b e g e n e r a t e d b y earthquakes – the corresponding science is called Seismology, whereas Seismic refers to a procedure in which artificially generated waves are employed.
vThe techniques provide detailed information a b o u t s u b s u r f a c e l a y e r i n g a n d r o c k geomechanical properties using seismic acoustical waves.
vThere are two types of seismic methods:
1. Reflection method2. Refraction method
Applications of Seismic method
v General geologic structurev Faults and other hazardsv Landfill investigationsv Overburden thicknessv Rock rip ability and qualityv Water table depthv Bedrock depthv Dynamic rock moduliv Vibration loading responsev Rock velocities and qualityv Geologic layering
Reflection of light
vWhen a l ight ray traveling in one medium encounters a boundary with another medium, part of the incident light is reflected. The figure below shows several rays of a beam of light incident on a smooth, mirror-like, reflecting surface.
vThe reflected rays are parallel to each other, as indicated in the figure.
vThe direction of a reflected ray is in the plane perpendicular to the reflecting surface that contains the incident ray.

Schematic representation of (a) seculars reflection, where the reflectedrays are all parallel to each other (smooth surface), and (b) diffuse reflection,
where the reflected rays travel in random directions(rough surface)
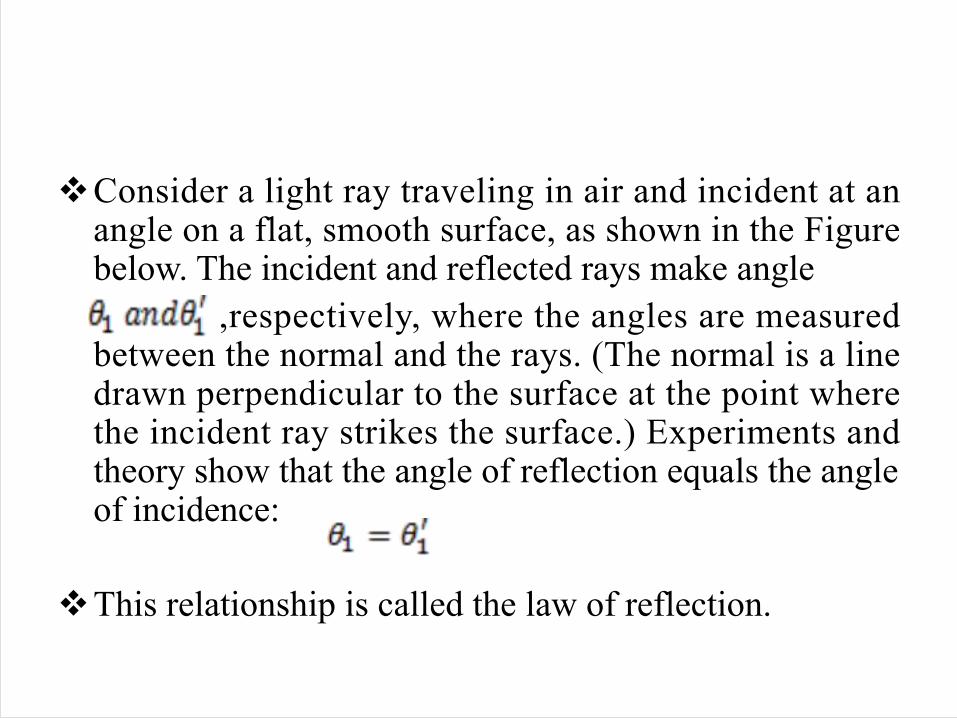
vConsider a light ray traveling in air and incident at an angle on a flat, smooth surface, as shown in the Figure below. The incident and reflected rays make angle
,respectively, where the angles are measured between the normal and the rays. (The normal is a line drawn perpendicular to the surface at the point where the incident ray strikes the surface.) Experiments and theory show that the angle of reflection equals the angle of incidence:
vThis relationship is called the law of reflection.
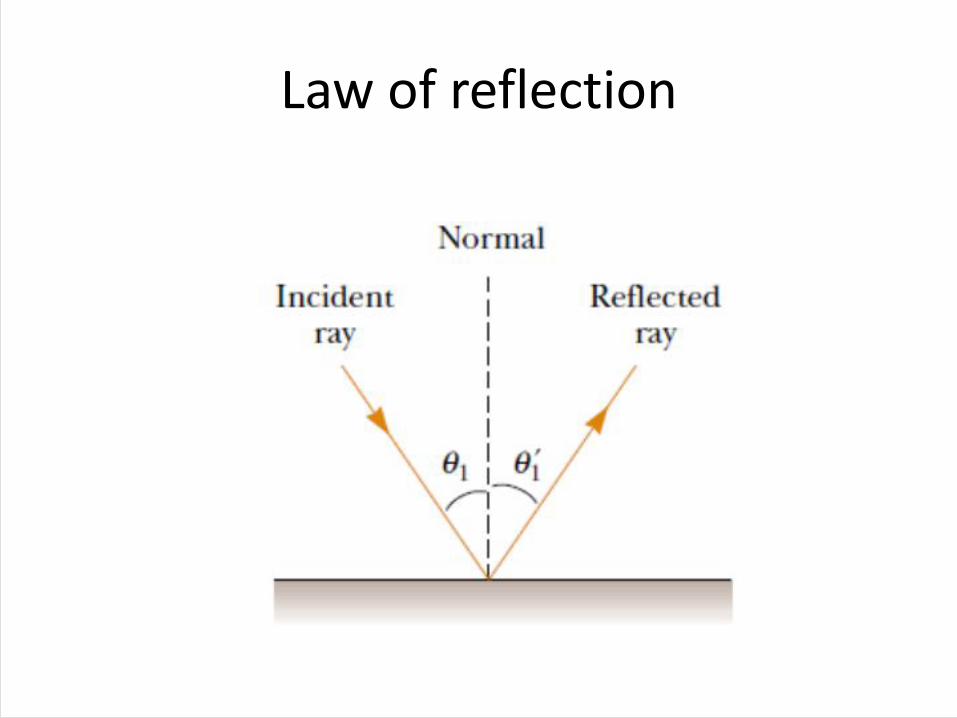
Law of reflection
Example:
Two mirrors make an angle of 120° with each other, A ray is incident on mirror M1 at an angle of 65° to the normal. Find the direction of the ray after it is reflected from mirror M2.
Seismic Reflection Methods
vSeismic Reflection Methods is a method of exploration geophysics that uses the principles of seismology to estimate the properties of the Earth's subsurface from reflected seismic waves. vThe physical process of reflection is illustrated in Fig. below, where the ray paths through successive layers are shown.
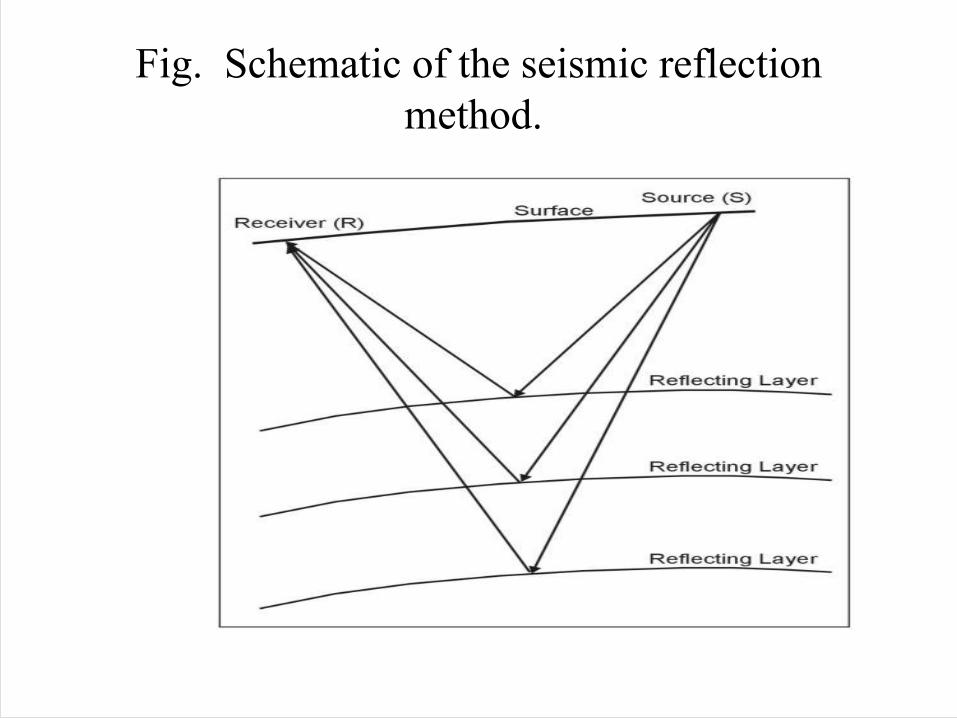
Fig. Schematic of the seismic reflection method.
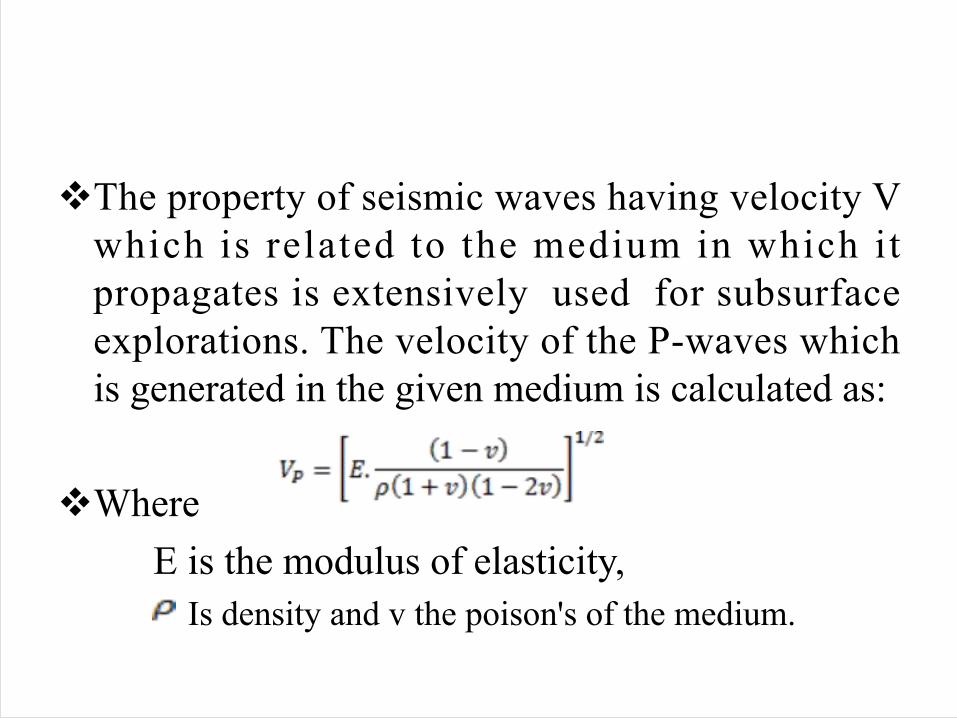
vThe property of seismic waves having velocity V which is related to the medium in which it propagates is extensively used for subsurface explorations. The velocity of the P-waves which is generated in the given medium is calculated as:
vWhere E is the modulus of elasticity, Is density and v the poison's of the medium.
vThe Fig . Given below indicates the paths of arrivals that would be recorded on a multichannel seismograph. Note that the subsurface coverage is exactly one-half of the surface distance across the geophone spread.
vThe subsurface sampling interval is one-half of the distance between geophones on the surface. Another important feature of modern reflection-data acquisition is illustrated by fig. below.
v If multiple shots, S1 and S2, are recorded by multiple receivers, R1 and R2, and the geometry is as shown in the figure, the reflection point for both ray paths is the same. However, the ray paths are not the same length, thus the reflection will occur at different times on the two traces.
vThis time delay, whose magnitude is indicative of the subsurface velocities, is ca l led normal -move out . Wi th an appropriate time shift, called the normal-move out correction, the two traces (S1 to R2 and S2 to R1) can be summed, greatly enhancing the reflected energy and canceling spurious noise.
vThis method is cal led the common reflection point, common midpoint, or common depth point (CDP) method. If all receiver locations are used as shot points, the multiplicity of data on one subsurface point (called CDP fold) is equal to one-half of the number of recording channels.
vThus, a 24-channel seismograph will r e c o r d 1 2 - f o l d d a t a i f a s h o t corresponding to every receiver position is shot into a full spread. Thus, for 12-fold data, every subsurface point will have 12 separate traces added, after appropriate time shifting, to represent that point.
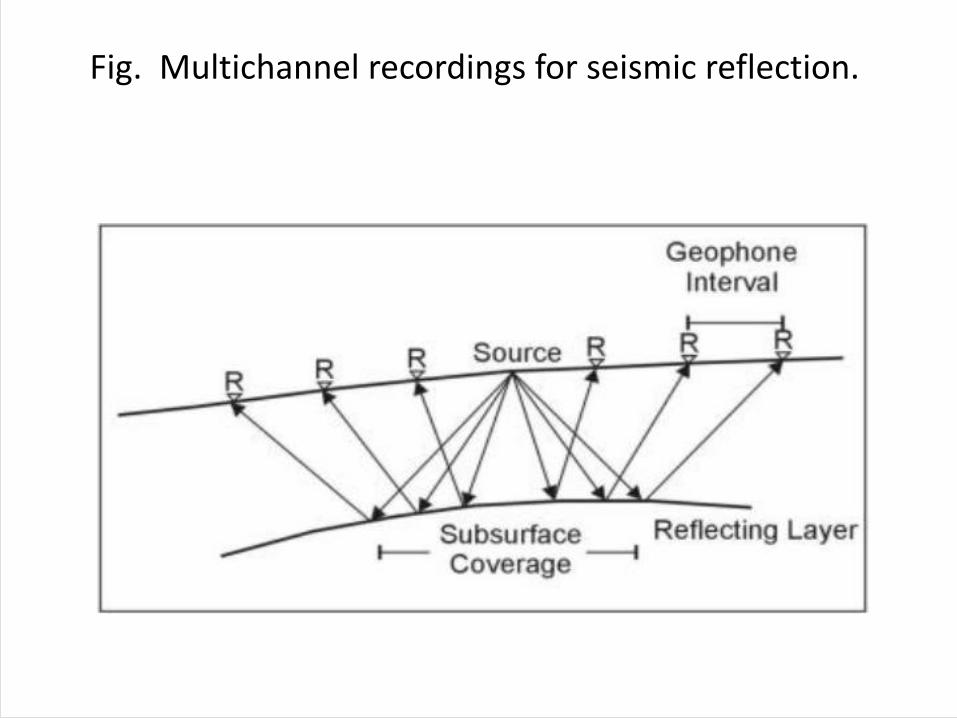
Fig. Multichannel recordings for seismic reflection.
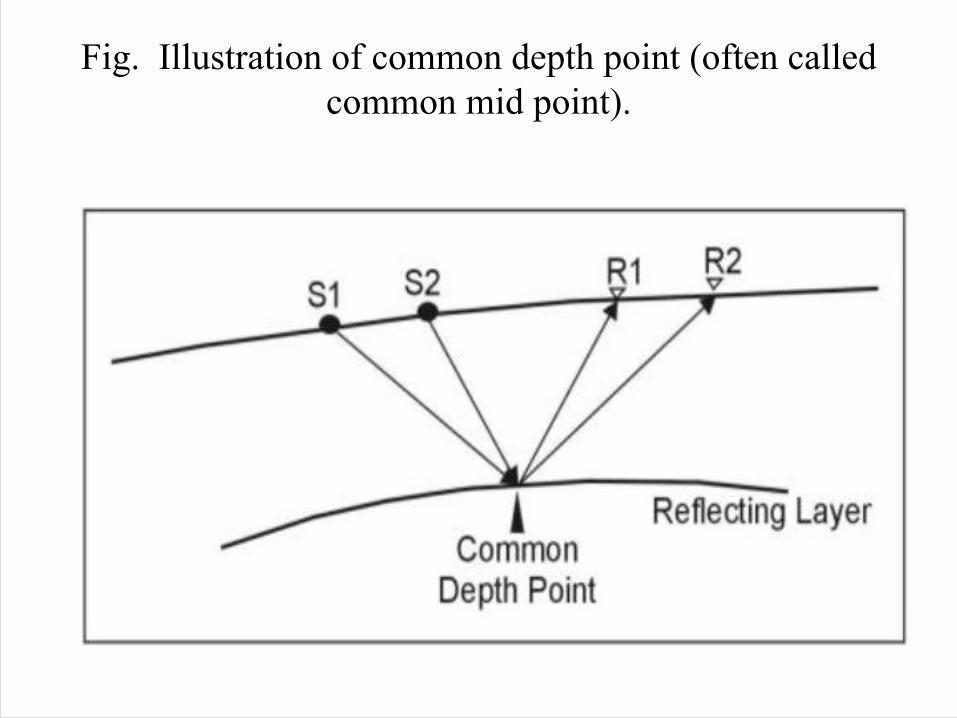
Fig. Illustration of common depth point (often called common mid point).
Outline of the method
vWhen a seismic wave travelling through the Earth encounters an interface between two materials with different acoustic impedances, some of the wave energy will reflect off the interface and some will refract through the interface. At its most basic, the seismic reflection technique consists of generating seismic waves and measuring the time taken for the waves to travel from the source, reflect off an interface and be detected by an array of receivers (or geophones) at the surface.

vKnowing the travel times from the source to various receivers, and the velocity of the seismic waves, a geophysicist then attempts to reconstruct the pathways of the waves in order to build up an image of the subsurface.
The reflection experiment
vThe gene ra l p r i nc ip l e o f s e i smic reflection is to send elastic waves (using an energy source such as dynamite explosion or Vibroseis) into the Earth, where each layer within the Earth reflects a portion of the wave’s energy back and allows the rest to refract through.
vThese reflected energy waves are recorded over a predetermined time period (called the record length) by receivers that detect the motion of the ground in which they are placed. On land, the typical receiver used is a small , portable instrument known as a geophone, which converts ground motion into an analogue electrical signal.
vIn water, hydrophones are used, which convert pressure changes into electrical signals. Each receiver’s response to a single shot is known as a “trace” and is recorded onto a data storage device, then the shot location is moved along and the process is repeated.

vTypically, the recorded signals are subjected to significant amounts of signal processing before they are ready to be i n t e rp re t ed and t h i s i s an a r ea o f significant active research within industry and academia.
vIn general, the more complex the geology of the area under study, the more sophisticated are the techniques required to remove noise and increase resolution. Modern seismic reflection surveys contain large amount of data and so require large amounts of computer p r o c e s s i n g , o f t e n p e r f o r m e d o n supercomputers or computer clusters.
Reflection and transmission at normal incidence
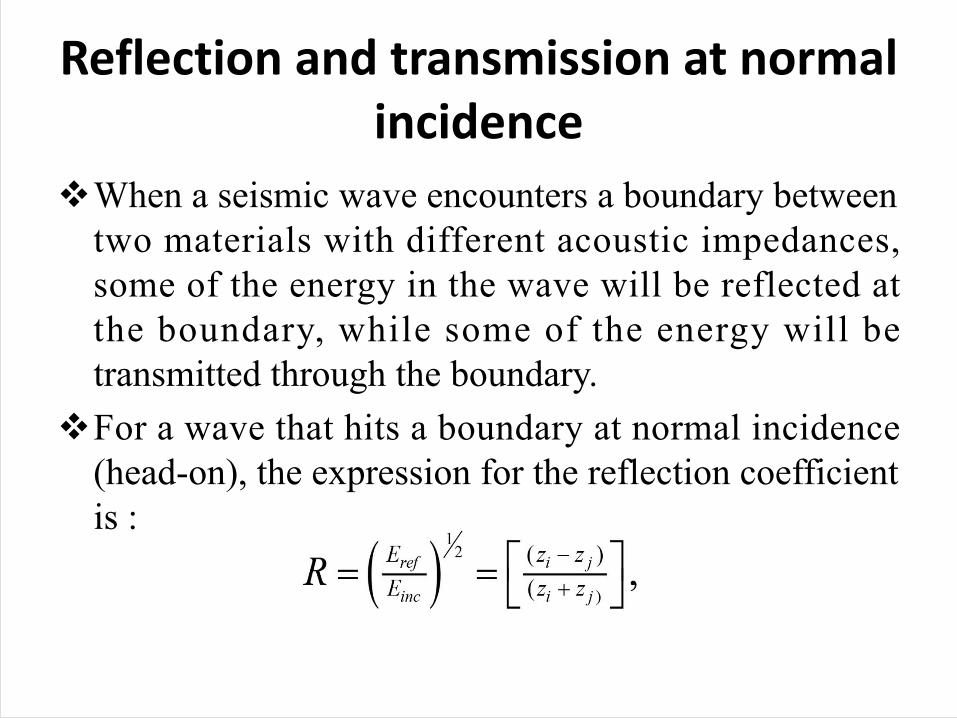
vWhen a seismic wave encounters a boundary between two materials with different acoustic impedances, some of the energy in the wave will be reflected at the boundary, while some of the energy will be transmitted through the boundary.
vFor a wave that hits a boundary at normal incidence (head-on), the expression for the reflection coefficient is :
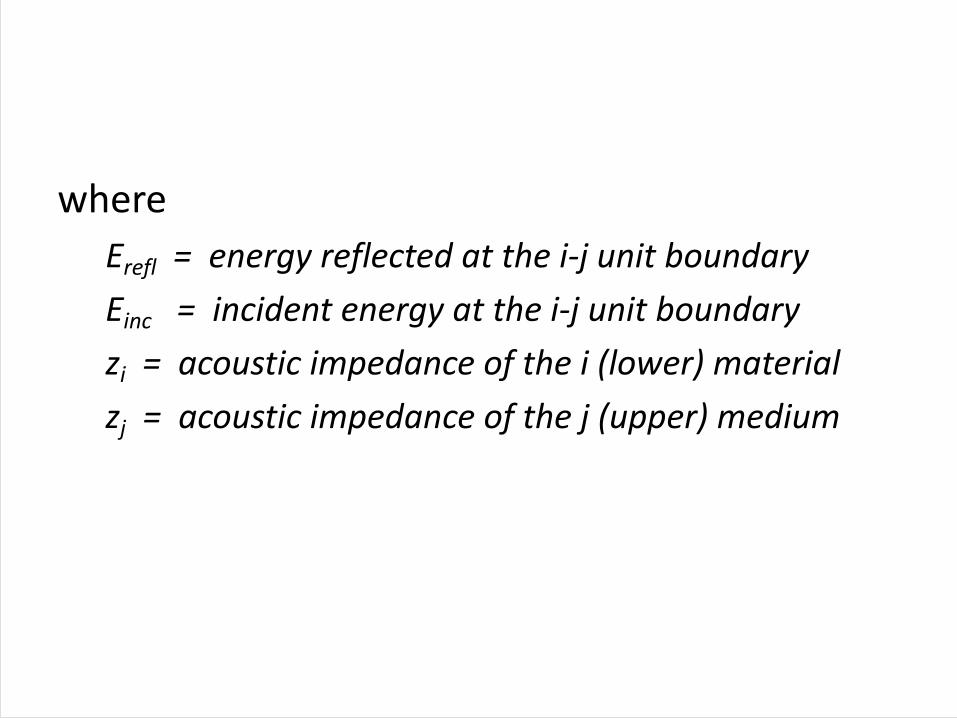
where Erefl = energy reflected at the i-j unit boundary Einc = incident energy at the i-j unit boundaryzi = acoustic impedance of the i (lower) material zj = acoustic impedance of the j (upper) medium
Interpretation of reflections
vThe time it takes for a reflection from a particular boundary to arrive at the geophone is called the travel time.
vIf the seismic wave velocity in the rock is known, then the travel time may be used to estimate the depth to the reflector. For a simple vertically traveling wave, the travel time t from the surface to the reflector and back is called the Two-Way Time (TWT) and is given by the formula:
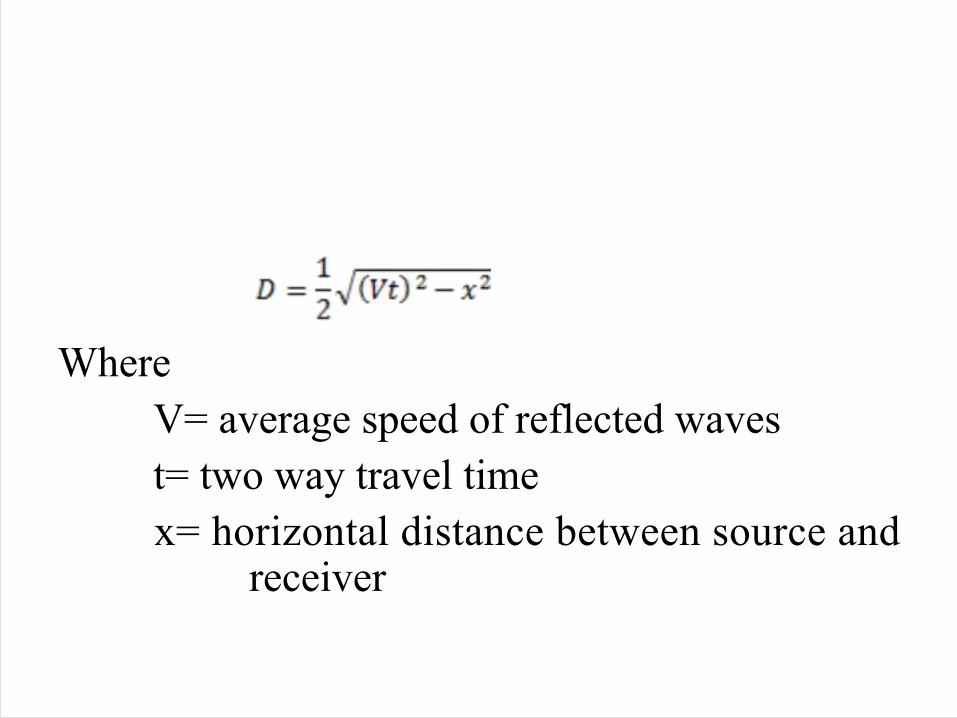
Where V= average speed of reflected wavest= two way travel time x= horizontal distance between source and
receiver
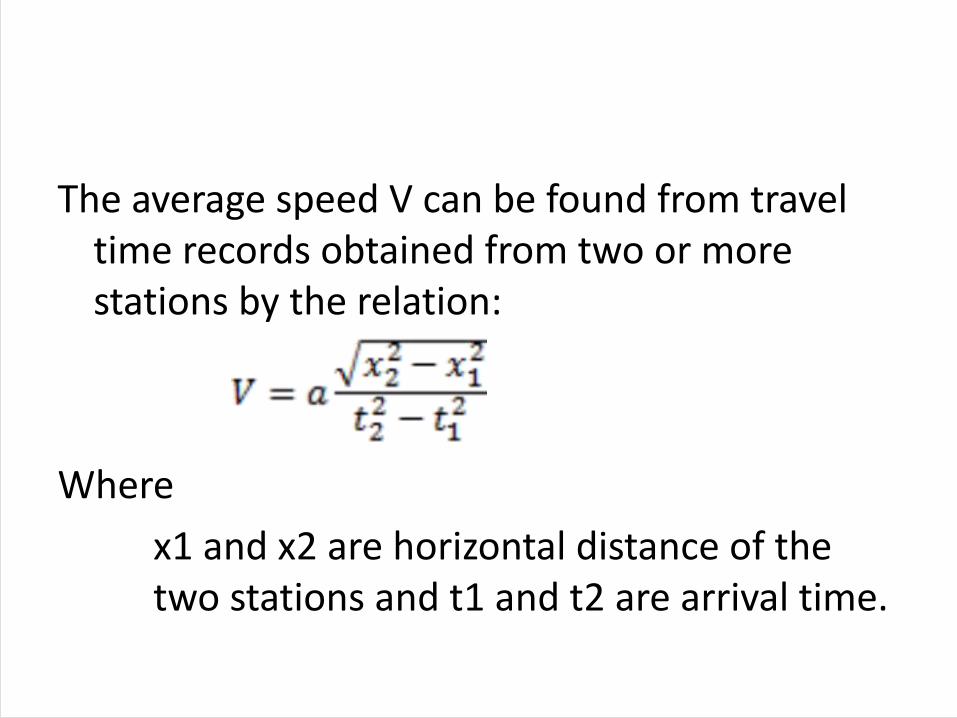
The average speed V can be found from travel time records obtained from two or more stations by the relation:
Wherex1 and x2 are horizontal distance of the two stations and t1 and t2 are arrival time.
Applications
vReflection seismology is used extensively in a number of fields and its applications can be categorized into th ree g roups , each de f ined by the i r dep th o f investigation:
ØNear-surface applications – an application that aims to understand geology at depths of up to approximately 1 km, typically used for engineering and environmental surveys, as well as coal and mineral exploration. A more recently developed application for seismic reflection is for geothermal energy surveys, although the depth of investigation can e up to 2 km deep in this case.
ØHydrocarbon exploration - used by the hydrocarbon industry to provide a high resolution map of acoustic impedance contrasts at depths of up to 10 km within the subsurface. This can be combined with seismic attribute analysis and other exploration geophysics tools and used to help geologists build a geological model of the area of interest.ØCrustal studies – investigation into the structure and origin of the Earth's crust, through to the Moho discontinuity and beyond, at depths of up to 100 km.
vA m e t h o d s i m i l a r t o r e f l e c t i o n seismology which uses electromagnetic instead of elast ic waves, and has a smaller depth of penetration, is known as Ground-penetrating radar or GPR.
Seismic data processing
There are three main processes in seismic data processing: ü deconvolution, ü common-midpoint (CMP) stacking and ümigration.
Deconvolution : is a process that tries to extract the reflectivity series of the Earth, under the assumption that a seismic trace is just the reflectivity series of the Earth convolved with distorting filters. This process improves temporal resolution by collapsing the seismic wavelet, but it is nonunique unless further information is available such as well logs, or further assumptions are made. Deconvolution operations can be cascaded, with each individual deconvolution designed to remove a particular type of distortion.
vCMP stacking:- is a robust process that uses the fact that a particular location in the subsurface will have been sampled numerous times and at different offsets. This allows a geophysicist to construct a group of traces with a range of offsets that all sample the same subsurface location, known as a Common Midpoint Gather . The average amplitude is then calculated along a time sample, resulting in significantly lowering the random noise but also losing al l valuable information about the relationship between seismic amplitude and offset.

vLess significant processes that are applied shortly before the CMP stack are Normal moveout correction and statics correction. Unlike marine seismic data, land seismic data has to be corrected for the elevation differences between the shot and receiver locations. This correction is in the form of a vertical time shift to a flat datum and is known as a statics correction, but will need further correcting later in the processing sequence because the velocity of the near-surface is not accurately known. This further correction is known as a residual statics correction.
vSeismic migration :-is the process by which seismic events are geometrically re-located in either space or time to the loca t ion the event occurred in the subsurface rather than the location that it was recorded at the surface, thereby creating a more accurate image of the subsurface.
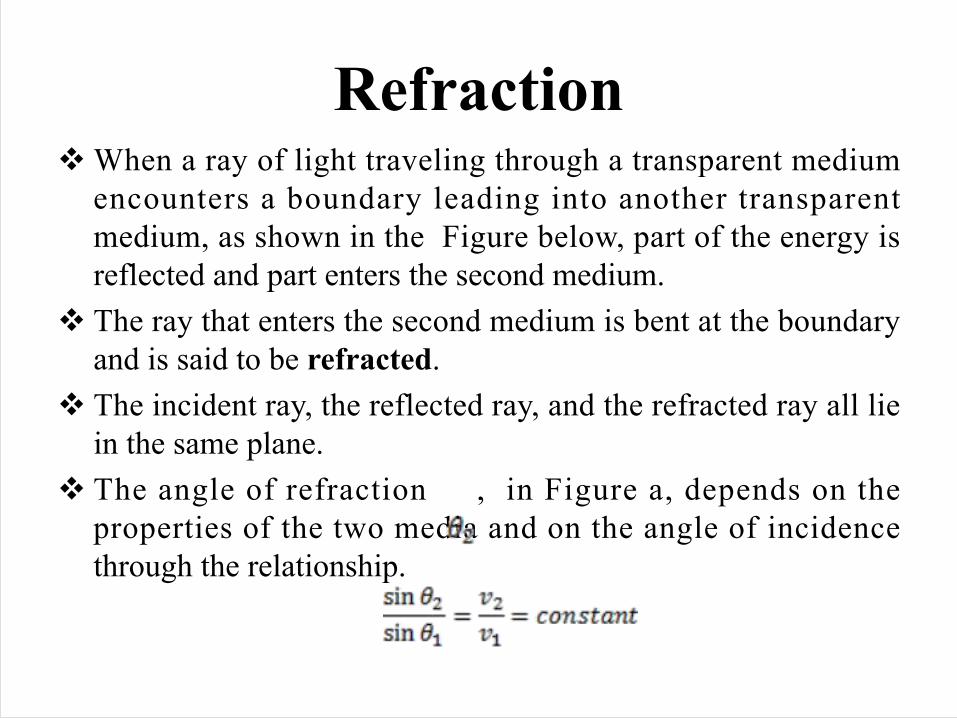
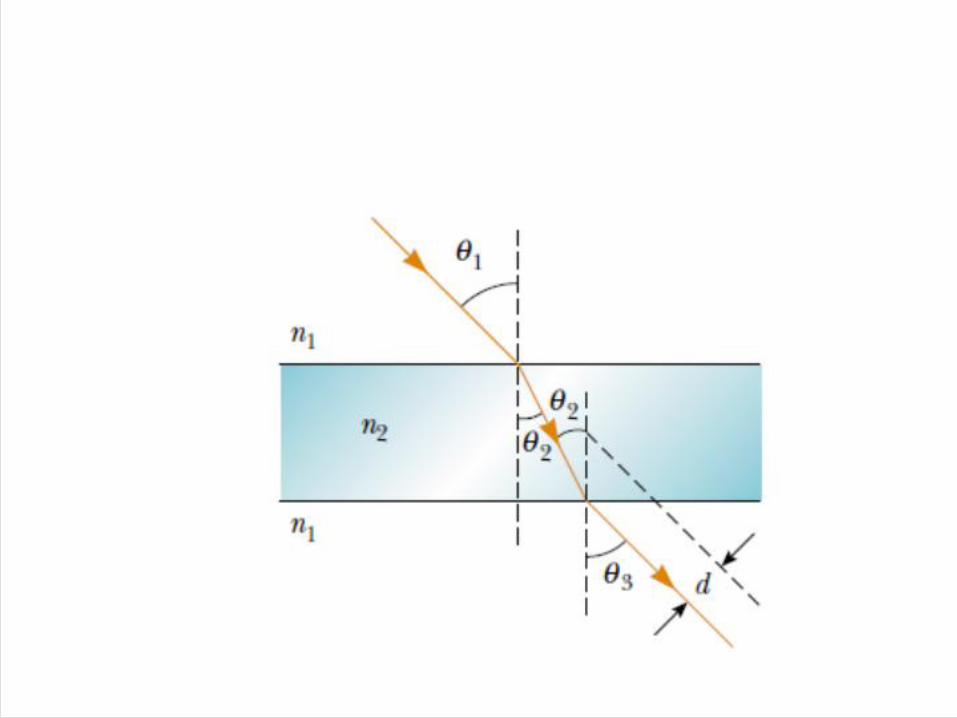
RefractionvWhen a ray of light traveling through a transparent medium
encounters a boundary leading into another transparent medium, as shown in the Figure below, part of the energy is reflected and part enters the second medium.
v The ray that enters the second medium is bent at the boundary and is said to be refracted.
v The incident ray, the reflected ray, and the refracted ray all lie in the same plane.
v The angle of refraction , in Figure a, depends on the properties of the two media and on the angle of incidence through the relationship.
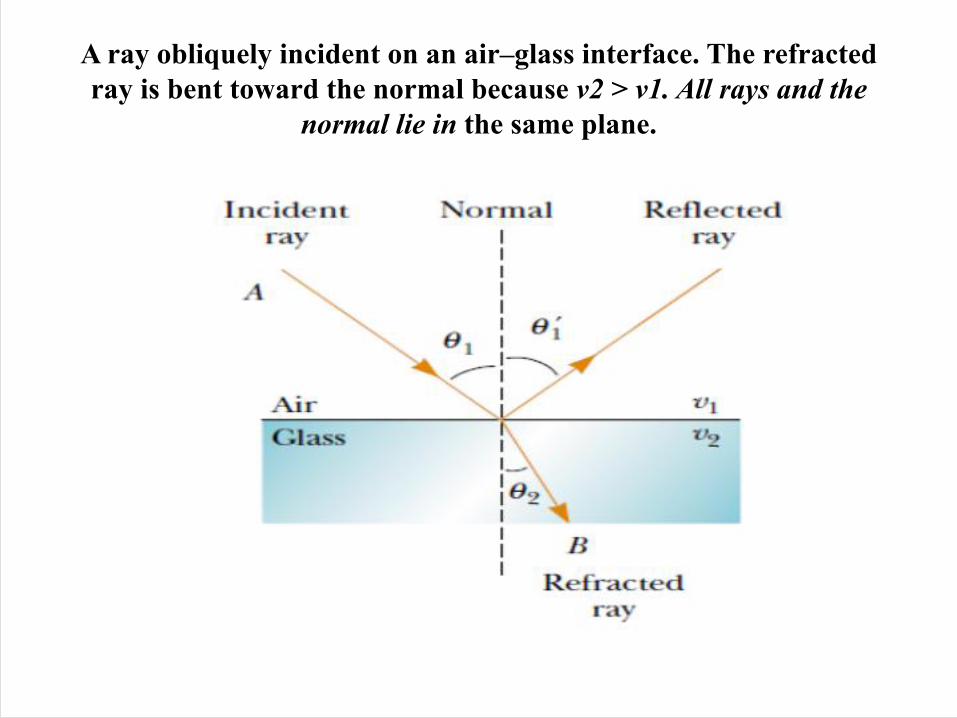
A ray obliquely incident on an air–glass interface. The refractedray is bent toward the normal because v2 > v1. All rays and the
normal lie in the same plane.

Index of Refraction
vIn general, the speed of light in any material is less than its speed in vacuum. In fact, light travels at its maximum speed in vacuum. It is convenient to define the index of refraction n of a medium to be the ratio:
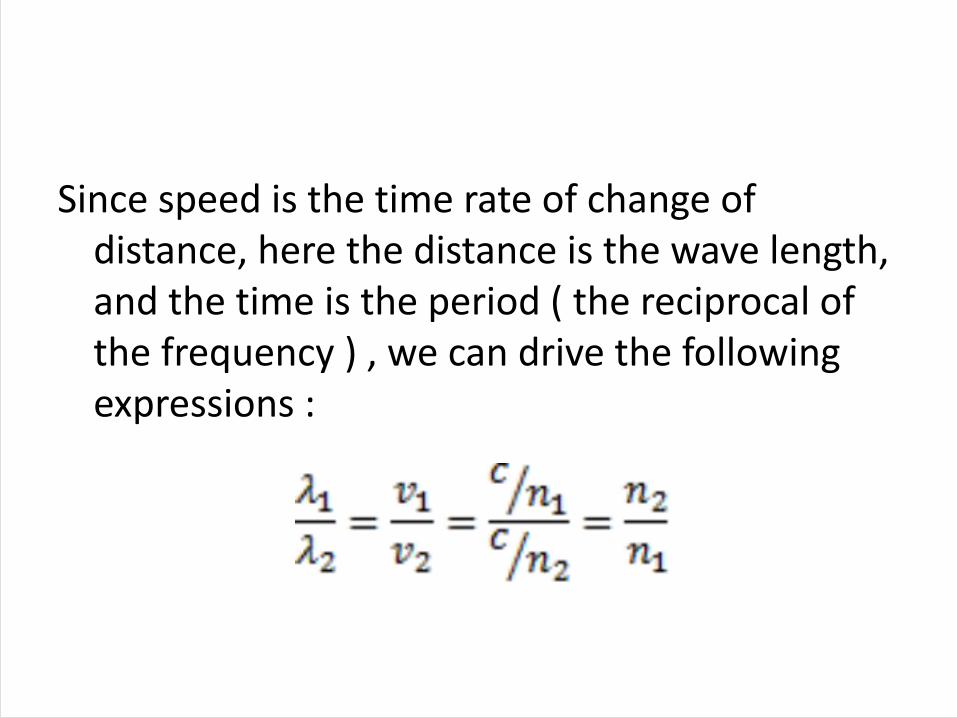
Since speed is the time rate of change of distance, here the distance is the wave length, and the time is the period ( the reciprocal of the frequency ) , we can drive the following expressions :
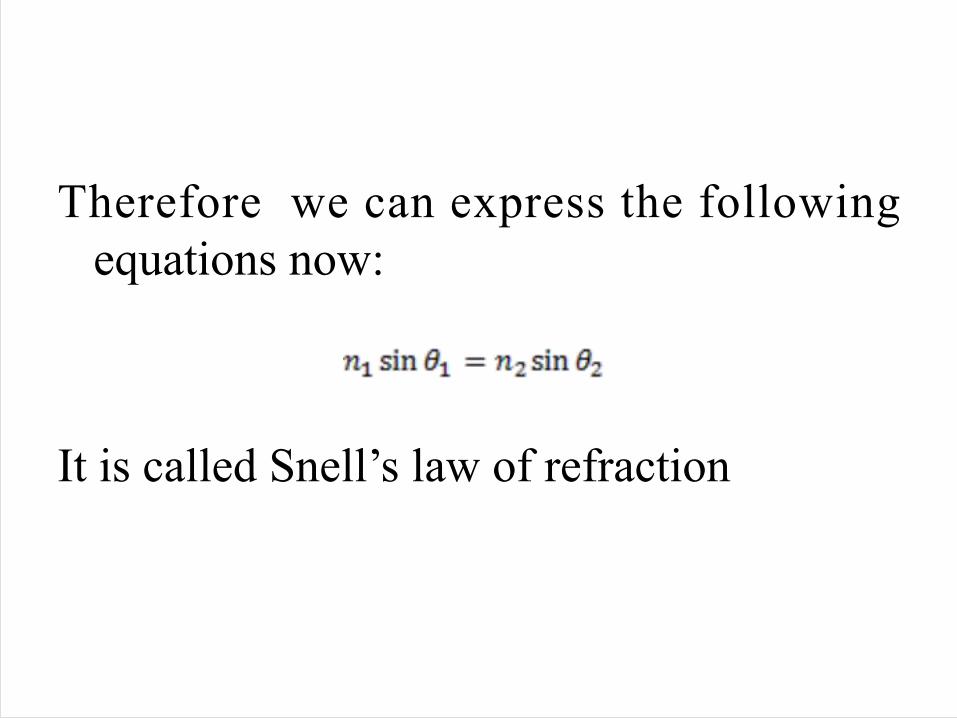
Therefore we can express the following equations now:
It is called Snell’s law of refraction

Example:1.A beam of l ight of wavelength 550 nm
traveling in air is incident on a slab of transparent material. The incident beam makes an angle of 40° with the normal, and the refracted beam makes an angle of 26° with the normal. Find the index of refraction of the material.
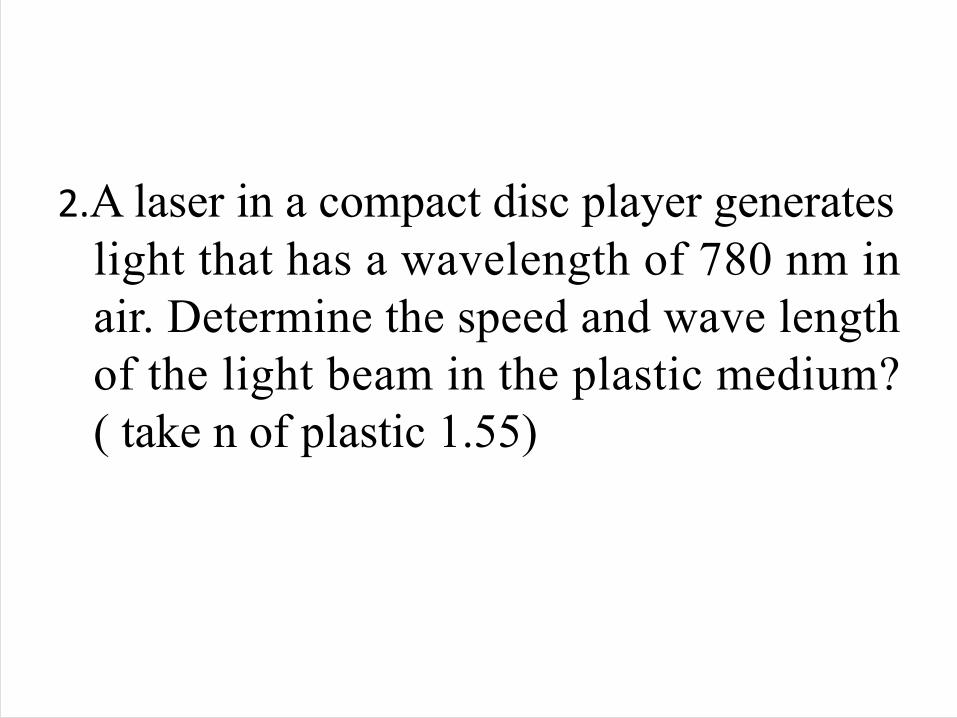
2.A laser in a compact disc player generates light that has a wavelength of 780 nm in air. Determine the speed and wave length of the light beam in the plastic medium? ( take n of plastic 1.55)
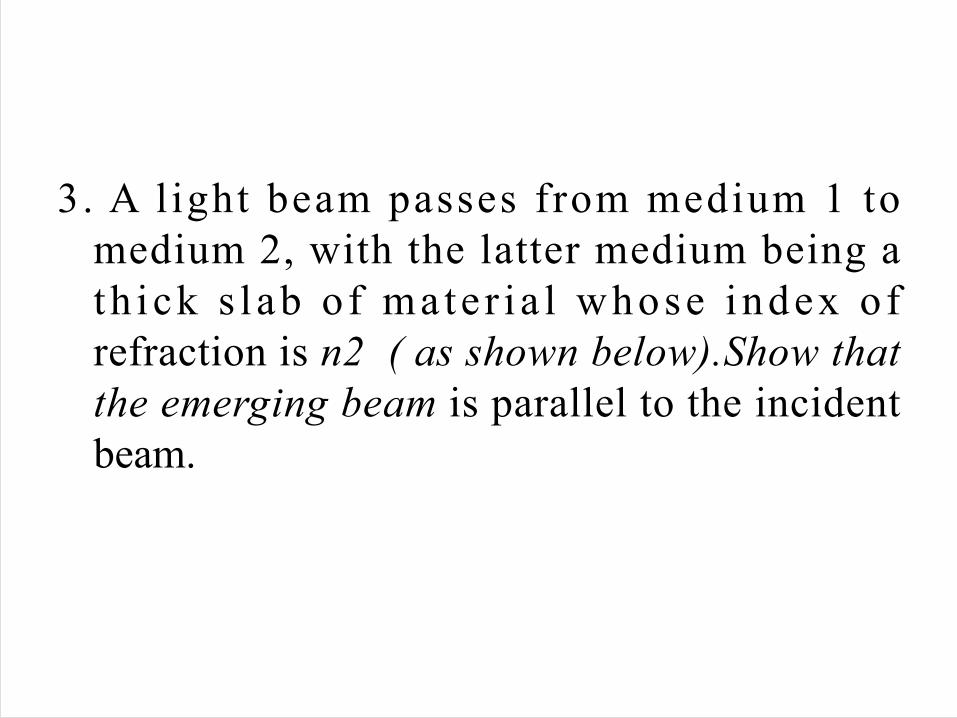
3. A light beam passes from medium 1 to medium 2, with the latter medium being a th ick s lab of mate r ia l whose index o f refraction is n2 ( as shown below).Show that the emerging beam is parallel to the incident beam.
Seismic refraction method
vSeismic refraction is a geophysical principle governed by Snell's Law .
v In this method ,it is the velocity of the refracted waves that is determined.
vUsed in the fields of engineering geology, geotechnical engineering and exploration geophysics.
vThe seismic refraction method utilizes the refraction of seismic waves on geologic layers and rock/soil units in order to characterize the subsurface geologic conditions and geologic structure.
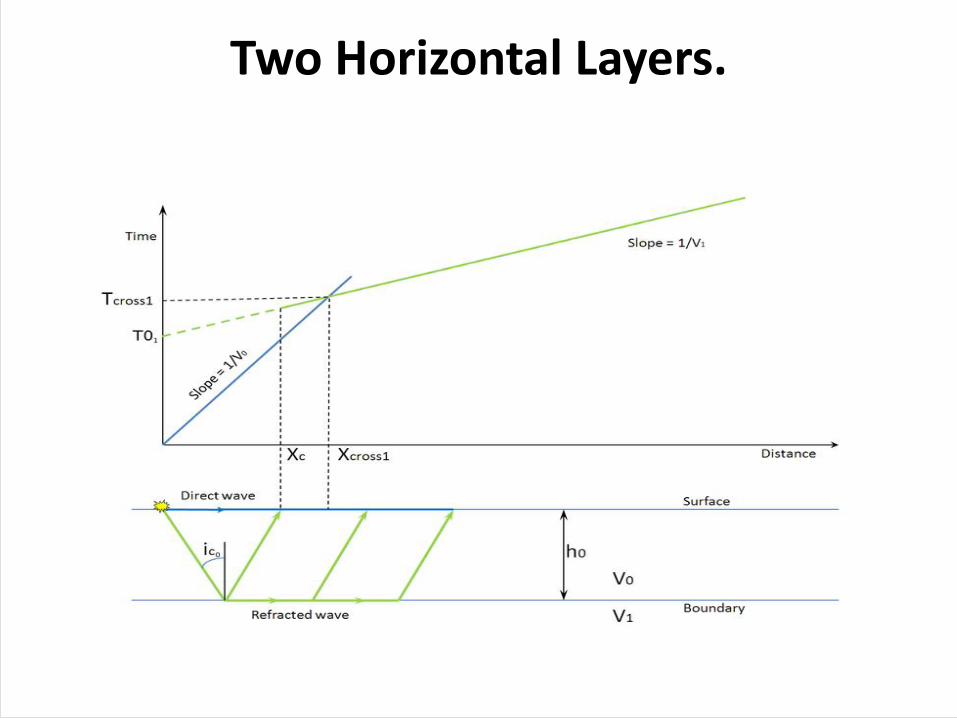
Two Horizontal Layers.
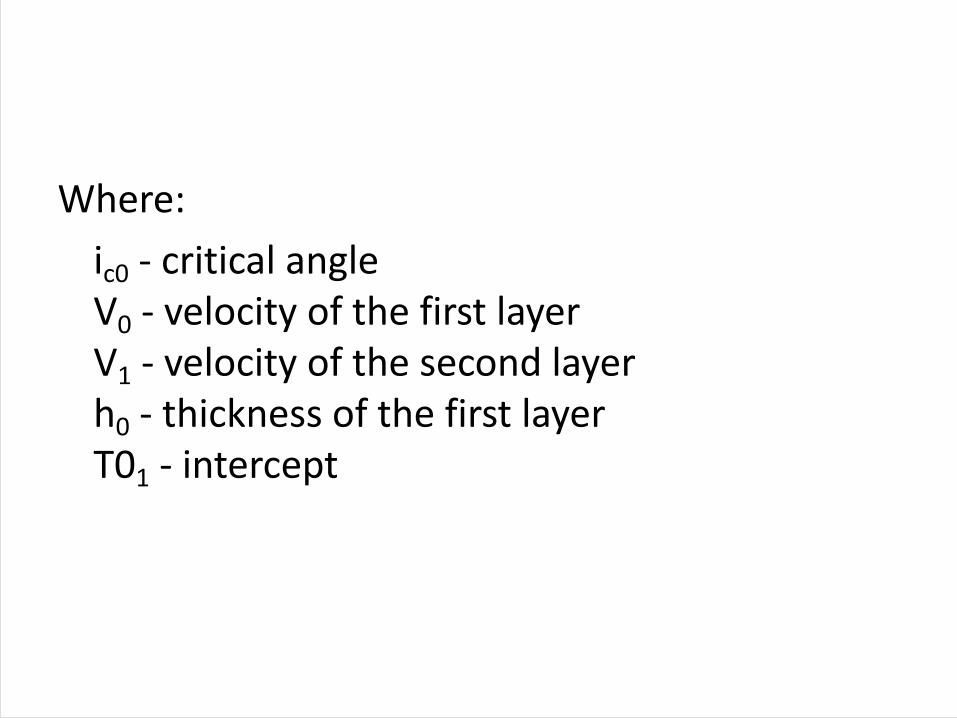
Where:ic0 - critical angleV0 - velocity of the first layerV1 - velocity of the second layerh0 - thickness of the first layerT01 - intercept
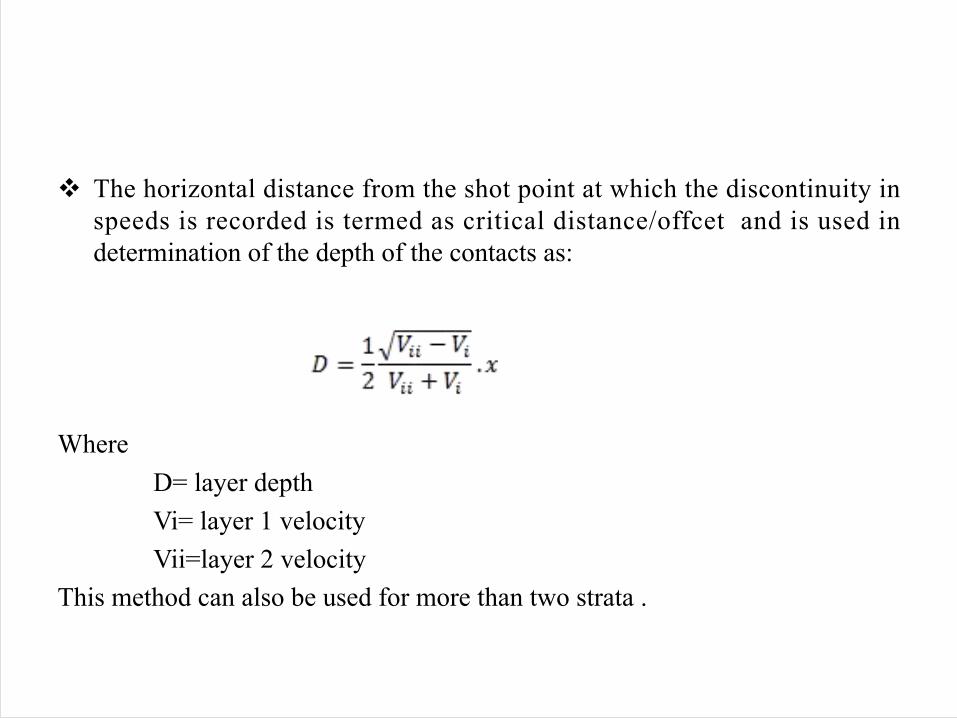
v The horizontal distance from the shot point at which the discontinuity in speeds is recorded is termed as critical distance/offcet and is used in determination of the depth of the contacts as:
Where D= layer depthVi= layer 1 velocityVii=layer 2 velocity
This method can also be used for more than two strata .

Seismic refraction for two layer horizontal strata
vThe typical instrument working on this principle consists of two parts:
i. The Source/shot point- for producing artificial seismic waves
ii. The geophone(seismometer)-receiver which records the travel of the wave with time.

The Two way Travel times
vA seismic wave travelling through an isotropic homogeneous medium wil l propagate at a constant velocity.
vTherefore, the time t required for a seismic wave to travel from source to the second layer and then back to the receiver on the surface of the earth in a homogeneous earth layer with velocity v is simply given by the formula:
t=d/vvwhere d is the depth between the layers
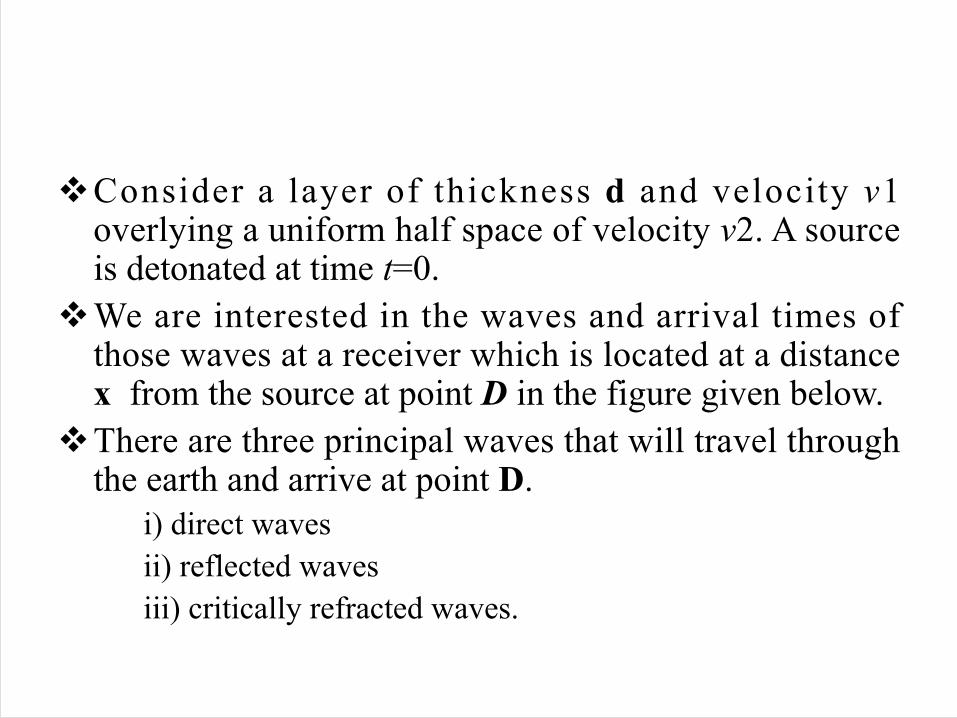
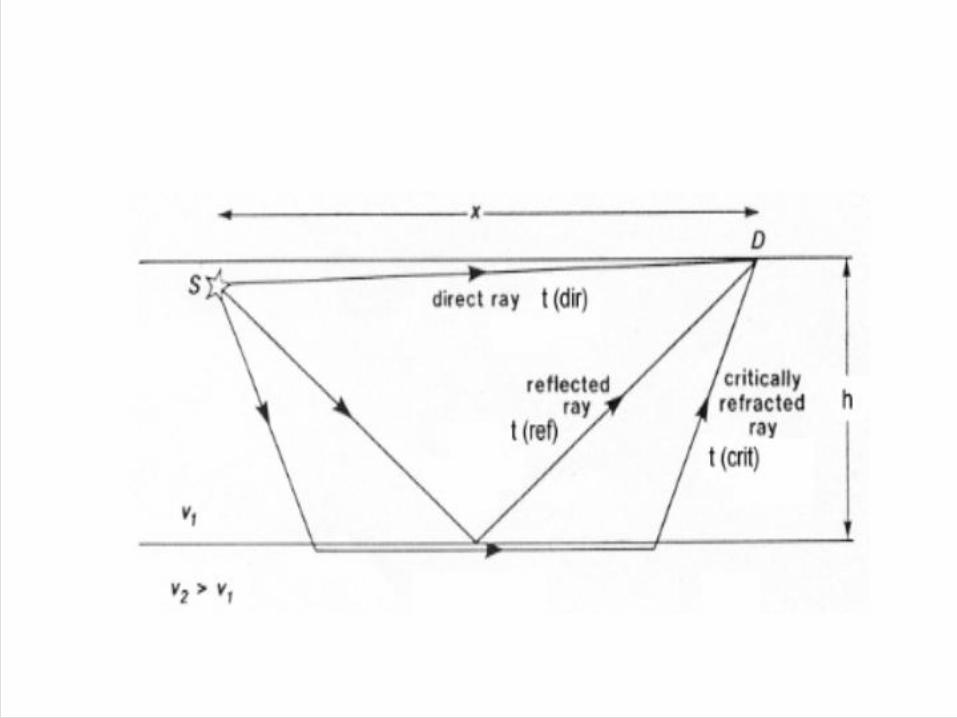
vConsider a layer of thickness d and velocity v1 overlying a uniform half space of velocity v2. A source is detonated at time t=0.
vWe are interested in the waves and arrival times of those waves at a receiver which is located at a distance x from the source at point D in the figure given below.
vThere are three principal waves that will travel through the earth and arrive at point D.
i) direct waves ii) reflected waves iii) critically refracted waves.

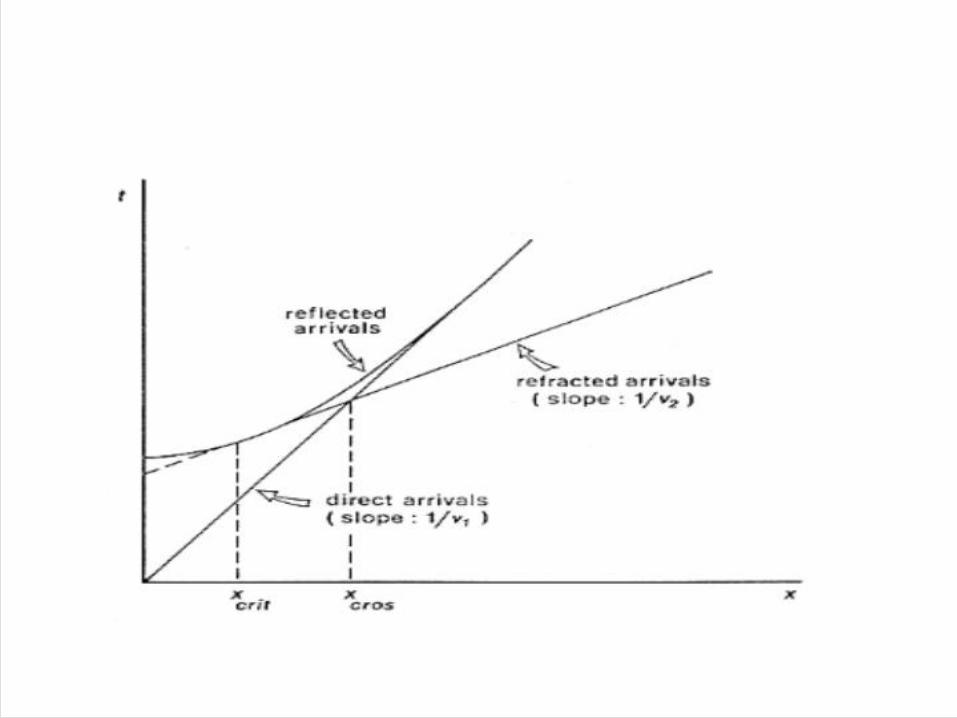
vThe travel time curves for these ray paths are shown below, where the horizontal axis represents distance from the source along the flat surface of the earth, xcrit is called the critical distance, and xcross the crossover distance.
vThe critical distance is the closest surface point to the source at which the refracted ray can be observed.
vThe crossover distance is the surface point at which the direct and refracted rays arrive at the same time.
v At offsets from the source greater than the crossover distance the refracted ray will be the first signal to arrive from the source.
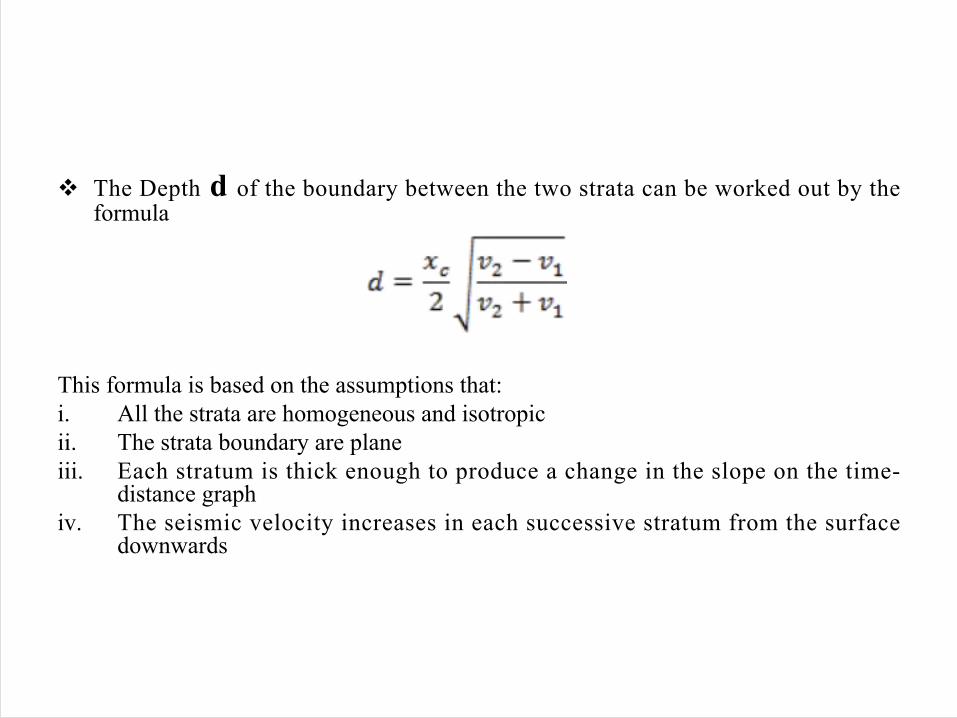
v The Depth d of the boundary between the two strata can be worked out by the formula
This formula is based on the assumptions that:i. All the strata are homogeneous and isotropicii. The strata boundary are planeiii. Each stratum is thick enough to produce a change in the slope on the time-
distance graphiv. The seismic velocity increases in each successive stratum from the surface
downwards
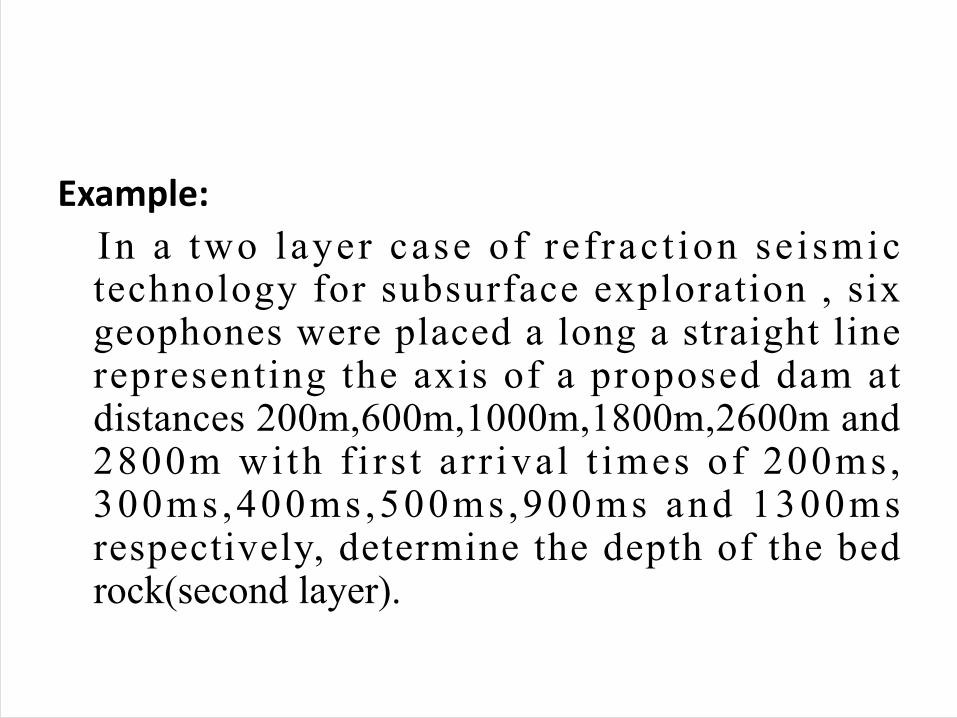
Example:In a two layer case of ref rac t ion se ismic technology for subsurface exploration , six geophones were placed a long a straight line representing the axis of a proposed dam at distances 200m,600m,1000m,1800m,2600m and 2800m with f i rs t ar r ival t imes of 200ms, 300ms,400ms,500ms,900ms and 1300ms respectively, determine the depth of the bed rock(second layer).
Chapter Five
Electrical Methods
Introduction
vThe electrical methods are based on the fact that the subsurface formations,structures,ores etc all possess different electrical properties .vThese differences are suitably investigated and
analyzed to infer conclusions about the geology of the site.
vThe electrical methods can be employed in the following three ways:ØUsing self potential method-use natural
electric field existing in the area of study.ØUsing surface potential method , called the
electrical resistivity method-Use artificial DC/AC electric currents .ØUsing electro-magnetic method-The electro-
magnetic field of the area is measured
vOut of the above three , the e lec t r ica l resistivity method is mostly used by engineers for sub-surface explorations.vThis electrical resistivity , which is the
reciprocal conductivity, of different rock formations, depends on the dissolved salt concentrations the pore water present in the in rock and the volume of the pore water , because the so l id so i l g ra ins a re poor conductors.
vAll materials, including soil and rock, have an intrinsic property, resistivity, that governs the relation between the current density and the gradient of the electrical potential.

vVariations in the resistivity of earth materials, either vertically or laterally, produce variations in the relations between the applied current and the potential distribution as measured on the surface, and thereby reveal something about the composition, extent, and physical properties of the subsurface materials.
vProperties that affect the resistivity of a soil or rock include porosity, water content, composition (clay mineral and metal content), salinity of the pore water, and grain size distribution.
vIn an electrically conductive body that lends itself to description as a one-dimensional body, such as an ordinary wire, the relationship between the current and potential distribution is described by Ohm's law:
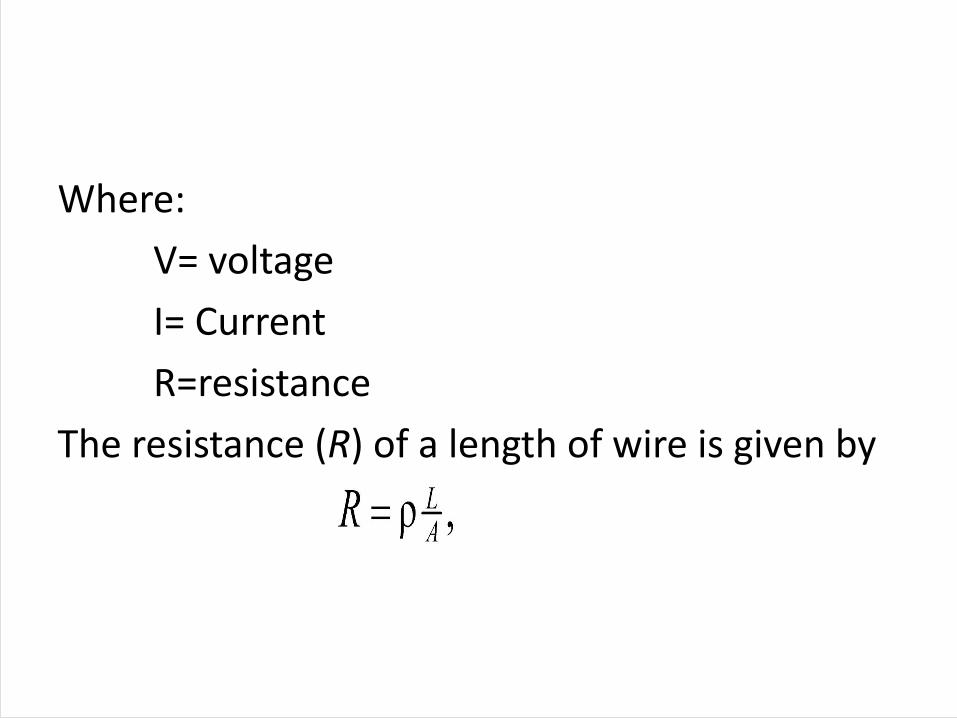
Where:V= voltageI= CurrentR=resistance
The resistance (R) of a length of wire is given by
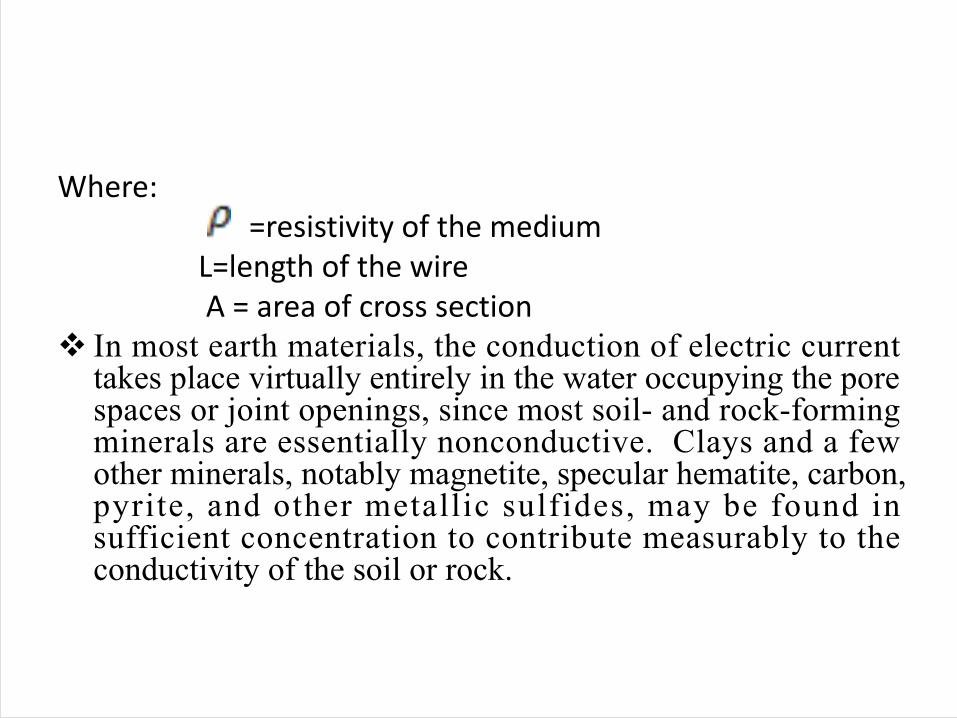
Where: =resistivity of the medium
L=length of the wire A = area of cross section
v In most earth materials, the conduction of electric current takes place virtually entirely in the water occupying the pore spaces or joint openings, since most soil- and rock-forming minerals are essentially nonconductive. Clays and a few other minerals, notably magnetite, specular hematite, carbon, pyrite, and other metallic sulfides, may be found in sufficient concentration to contribute measurably to the conductivity of the soil or rock.

Example 1. A solid cube of a rock containing silver (density of silver
= 10.5 g/cm3) has a mass of 90 g. (a) What is the resistance between opposite faces of the
cube rock? (Ans: L=2.02m, R=7.77x10⁻⁷ ohm). (b) Assume each silver atom in the rock contributes one
conduction electron. Find the induced current of electrons when a potential difference of 1 x10⁻⁵V is applied to opposite faces. (Ans.I=12.9A).
(resistivity of silver=1.5x10⁻⁸ )
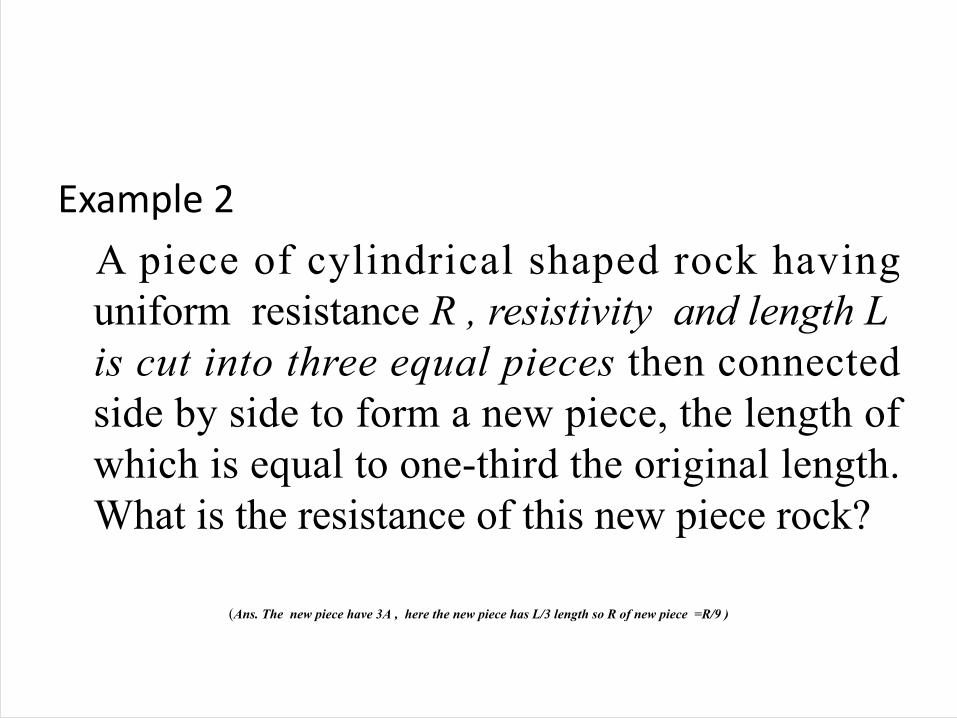
Example 2A piece of cylindrical shaped rock having uniform resistance R , resistivity and length L is cut into three equal pieces then connected side by side to form a new piece, the length of which is equal to one-third the original length. What is the resistance of this new piece rock?
(Ans. The new piece have 3A , here the new piece has L/3 length so R of new piece =R/9 )
vA number of different electrode configurations can be employed for electrical surveys, including:üVertical Electric Soundings (VES) for grounding
studies (ASTM G57, IEEE-81);ü2-D and 3-D Electrical Resistivity Tomography
(ERT)ü2-D dipole-dipole gradient maps (in the horizontal
plane) of resistivity and induced polarization.
Typical applications include:üElectrical grounding studies;üGeological mapping;üHydrogeology;üEnvironmental studies (contaminant mapping,
landfill sites);üMineral exploration (induced polarisation (IP)
surveys).
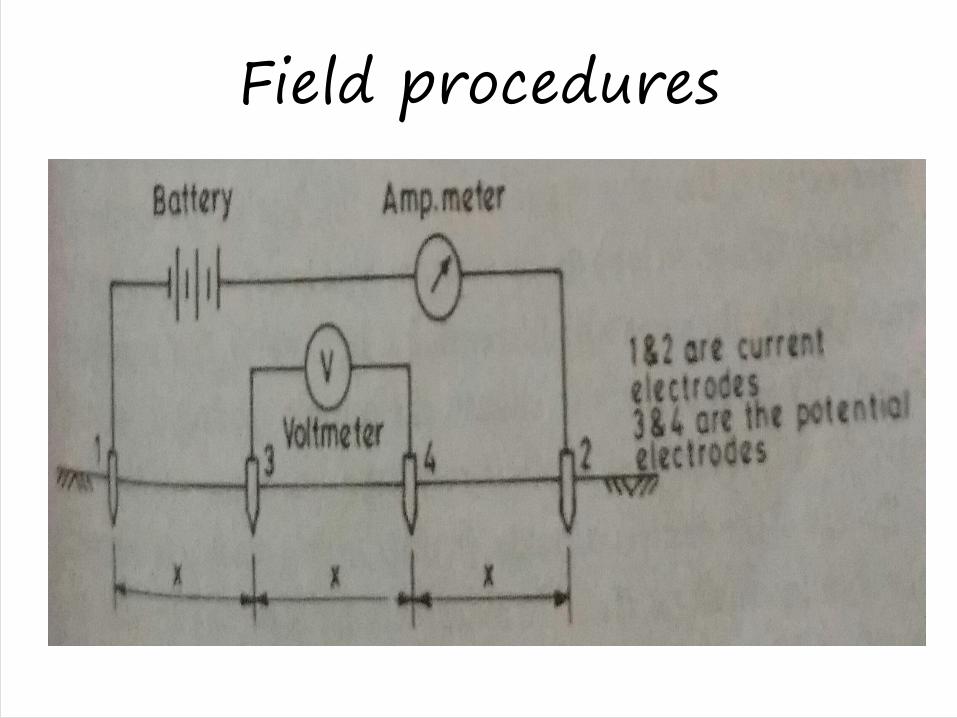
Field procedures
vThe usual adopted procedure involved in this testing ,consist of driving two electrodes 1 and 2 as shown above in to the ground at considerable distance ,say 3x.
vAnd an ammeter is connected with the battery to measure current in the circuit. The potential E at two intermediate points is measured by means of other two electrodes 3 and 4 , placed equally spaced between the first two.
vAll 4 electrodes would ,thus , be at equal spacing each of 3x/3 =x.

vThis electrode spacing (x) determines the effective depth upon which the lines of electric current flow ,and hence the depth of the strata influencing the rate of drop of potential (V) from one electrode to the other.vThe larger the spacing (x), the larger is the
depth of the strata involved in the circuit.
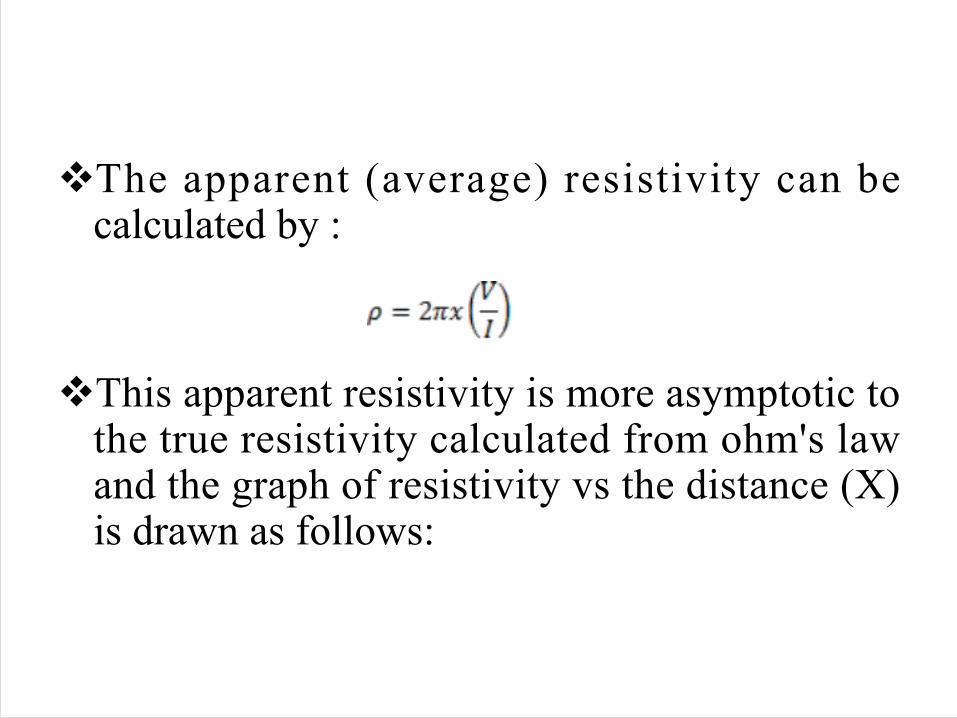
vThe apparent (average) resistivity can be calculated by :
vThis apparent resistivity is more asymptotic to the true resistivity calculated from ohm's law and the graph of resistivity vs the distance (X) is drawn as follows:
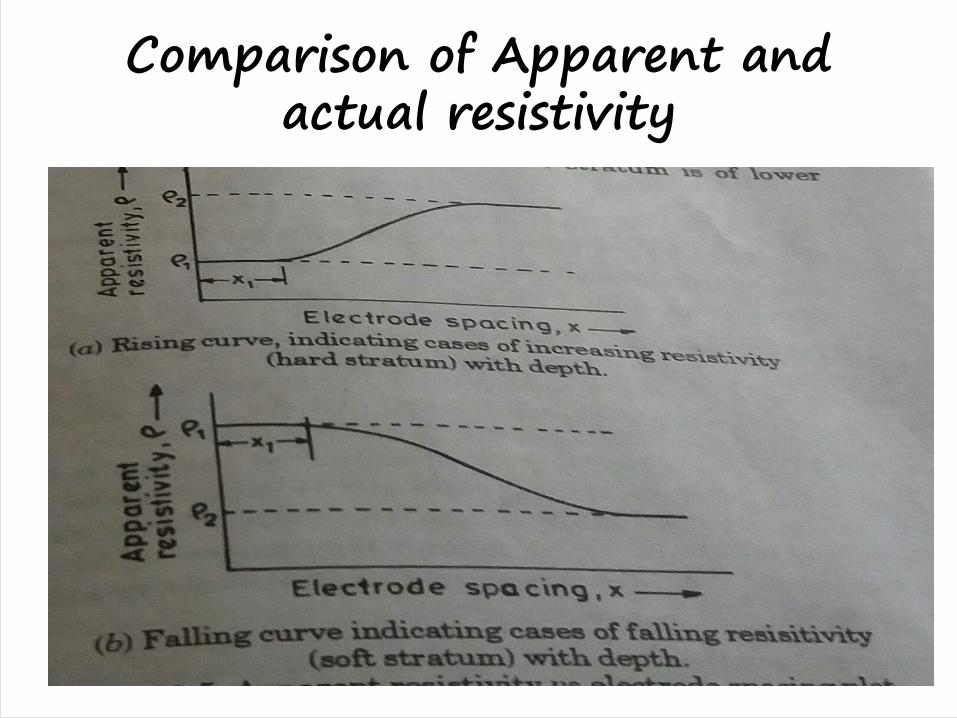
Comparison of Apparent and actual resistivity
vThe Resistivity survey can be done in two methods:Ø Horizontal variations =depth and electrode
spacing kept equalØ Vert ical variat ions=here the spacing b/n
electrodes and the depth may /may not be equal.
Engineering applications
vIt is widely used to determine water level and water bearing stratavC i v i l e n g i n e e r s u s e i t f o r
determination of depth of bed rocks for concrete dam constructions.
General Geological Applications of this method
vDetermination of bed rock at foundation site. vTo detect fractures zones in the bed rocksvTo determine type and strength of sub-surface rocks.vTo locate dykes and veins in the foundation rocksvTo know strikes and dips in the rocksvTo locate suitable building materials at shallow depth
near the project site.vTo locate places of leakages along canals or reservoirs
or tanks.vTo know ground water conditions.
Chapter Six (6)
Other Geophysical Methods
1. Radiometric method
vThis method is based on the radioactive property of rocks.
vThe radioactivity is a natural phenomena under which the nuclei of the mother element decomposed to the nuclei of the daughter element simultaneously releasing alpha, beta and gamma rays.
vAmong the three emitted radiations gamma rays are the most powerful in which the intensity of it become the measure of radioactivity.

vThe normal radioactive is different in different rocks.Example:v In Igneous rocks, it decreases with decreasing acidity. It
is high in granite (which is more acidic) and low in gabbros.
v In sedimentary rocks clay has high radioactive ,while shale, sandstone and limestone have low respectively.
v IN certain rocks contain radio active ores, very high radioactivity shale be noticed , thus a radioactive geophysical method is used not only to identify the type of rocks but also to detect the radioactive ore bodies.
Applications of radioactive methodsüExploration of radioactive minerals like
uranium, thorium, etcüTo detect some rare elements and minerals on
the earths surface like beryllium ,lithium, etcü to detect structures containing gas and oil since
they are associated with low values of gamma intensity.üTo measure ground water velocityüTo detect leakage in water storage reservoirs.
2. Geothermal Methods
vIt is based on the thermal conductivity of rocks, which is based on measuring temperature contribution of subsurface rocks, at various points in the earth.vAny d i f f e r ence i n t empe ra t u r e i n t he
subsur face shows the s t ruc tu re o f the subsurface, rock types, ore bodies etc.vTemperature distribution on the surface of the
earth consists three different sources:
i. Solar contribution – which remains limmited up to only a few meter deep in to the surface and it also varies with seasons.
ii. Heat contributed by the decay of radioactive minerals in the crust of the earth
iii. Heat contributed by hot subsurface rocks by conduction and convection .This is dependent on the conductivity character of rocks their structures and ore bodies.
Applications of geothermal methodsüFor deep structural studiesüFor oil and gas explorationsüFor detection of ore depositesüFor ground water studies
3. Remote sensing method
IntroductionvEvery thing on earth above absolute zero temperature(-
273oc ) radiate electromagnetic energy, although we can not see it.
vAll such radiations ,though can not be seen by human eyes , yet can be registered by modern day sensors in several wave lengths , when such sensitive sensors are installed on aircrafts ,or on satellites ,they can record the earth’s object from far off distance, such method of acquisition of information on the earths surface is called Remote sensing.
vWi t h t h e d e v e l o p m e n t o f r o c k e t s a n d satellites ,the remote sensing instruments were carried much more about the ground.
vAn aircraft flying at 10km above the earth can record at most 5000sq.km in 3hrs , at a resolution of 2mx2m and takes 35 years to cover the entire globe
vWhen we use a satellite at a distance of 900km above the ground it can view 185 sq.km in an hour and it will take only 18 day to view the whole globe.
Applications of remote sensing method
vThe expert interpretation of aerial photography a n d s a t e l l i t e i m a g e r i e s a r e u s e d t o understanding:üGeomorphologic set-upüSpecial distributionüLithology and structures of the rocküThe hydrographic and hydrologic features of the
area.
4. Well logging
vGeophysical well logging (borehole logging,) is a set of borehole investigation methods that are based on special logging tools.
vFirst developed in the beginning of the 20th century, well logging comprises today several tens of methods that involve measurements of natural or induced physical fields in the borehole.
v It is , also known as borehole logging is the practice of making a detailed record (a well log) of the geologic formations penetrated by a borehole.
vThe log may be based either on visual inspection of samples brought to the surface (geological logs) or on physical measurements made by instruments lowered into the hole(geophysical logs).
vSome types of geophysical well logs can be done during any phase of a wel l ' s his tory: dr i l l ing, completing, producing, or abandoning.
vWell logging is performed in boreholes drilled for the oil and gas, groundwater, mineral and geothermal exploration, as well as part of environmental and geotechnical studies.
vI t i s a f ie ld technique used in minera l exploration to analyze the geologic formations penetrated by a drill hole. vIf the hole has been drilled by using coring
techniques, the core provides a visual record of the formations and rock types encountered.vThe description (log) of the core provides the
ba s i c da t a u sed i n geo log i c ana l y s i s , interpretation, and resource calculations.
vA well log is a record of the formations and any events that are encountered in the drilling process. It basically tells you what you pass through as you are drilling deeper and deeper. It is also referred to as borehole logging.
Purpose of Well LoggingvWell logging is actually used not just for water
wells, but also for oil wells. vResearchers also use well logging as a means to
p e r f o r m g e o t h e r m a l , g e o t e c h n i c a l , a n d environmental studies. Well logs tell researchers how deep certain formations are and what types of formations are present underground.
vWell logs are used while drilling to determine a well's suitability and to record any events, such as any problems that occur, a long wi th what k ind of formations are being drilled through.
vThis information is then used to determine if the formations are desirable ones or undesirable ones depending on the type of well.
vWell logs also tell workers whether a water well has enough water or whether an oil well has enough oil.
vThey also tell workers whether the oil or water from a well needs additional treatment before it can be used commercially.

Wireline loggingvWireline logging can be defined as being "The
acquisition and analysis of geophysical data performed as a function of well bore depth, together with the provision of related services.
vWireline logging is performed by lowering a ' logging tool ' - or a str ing of one or more instruments - on the end of a wireline into an oil well (or borehole) and recording petrophysical properties using a variety of sensors.
Types of Well Logs
vWith well logs serving so many purposes, there are various types of well logs that suit each purpose. Here is a list of just some of the types of well logs that are currently being used.
Electrical resistivity well logs i. Resistivity logØ tell you how hard it is for an electric current to pass
through a formation. This is also an indication of whether the water in the potential well is fresh or salty. (Salt water conducts more electricity making it easier for the electric current to pass through.)
ii. Borehole Imaging v The term "borehole imaging" refers to those
logging and data-processing methods that are used to produce centimeter-scale images of the borehole wall and the rocks that make it up. vBorehole imaging has been one of the most
rapidly advancing technologies in wireline well logging.
vSpecific applications are fracture identification, analysis of small-scale sedimentological features, evaluation of net pay in thinly bedded formations, and the identification of breakouts (irregularities in the borehole wall that are aligned with the minimum horizontal stress and appear where stresses around the wellbore exceed the compressive strength of the rock).
vThe subject area can be classified into four parts:
1. Optical imaging2. Acoustic imaging3. Electrical imaging4. Methods that draw on both acoustic and electrical
imaging techniques using the same logging tool
Porosity logsvPorosity logs measure the fraction or percentage of pore
volume in a volume of rock.v Most porosity logs use either acoustic or nuclear
technology. vAcoustic logs measure characteristics of sound waves
propagated through the well-bore environment.vNuclear logs utilize nuclear reactions that take place in
the downhole logging instrument or in the formation.vNuclear logs include density logs and neutron logs, as
well as gamma ray logs which are used for correlation.
i. Densityv The density log measures the bulk density of
a fo rmat ion by bombard ing i t wi th a radioact ive source and measuring the resulting gamma ray count after the effects of Compton Scattering and Photoelectric absorption. This bulk density can then be used to determine porosity.
ii. Neutron porosityvThe neutron porosity log works by bombarding a
formation with high energy epithermal neutrons that lose energy through elastic scattering to near thermal levels before being absorbed by the nuclei of the formation atoms.
v Depending on the particular type of neutron logging tool, either the gamma ray of capture, scattered thermal neutrons or scattered, higher energy epithermal neutrons are detected.
vThe neutron porosity log is predominantly sensitive to the quanti ty of hydrogen atoms in a part icular formation, which generally corresponds to rock porosity.
iii. SonicvA sonic log provides a formation interval
transit time, which typically a function of lithology and rock texture but particularly porosity. The logging tool consists of a piezoelectric transmitter and receiver and the time taken to for the sound wave to travel the fixed distance between the two is recorded as an interval transit time.

Lithology logsi. Gamma rayvA log of the natural radioactivity of the formation
along the borehole, measured in API units, particularly useful for distinguishing between sands and shales in a siliclastic environment.This is because sandstones are usually nonradioactive quartz, whereas shales are naturally radioactive due to potassium isotopes in clays, and adsorbed uranium and thorium.
vIn some rocks, and in particular in carbonate rocks, the contribution from uranium can be large and erratic, and can cause the carbonate to be mistaken for a shale. In this case, The carbonate gamma ray is a better indicator of shaliness. the carbonate gamma ray log is a gamma ray log from which the uranium contribution has been subtracted.
ii. Self/spontaneous potentialvThe Spontaneous Potential (SP) log measures
the natural or spontaneous potential difference between the borehole and the surface, without any applied current. It was one of the first wireline logs to be developed, found when a single potential electrode was lowered into a well and a potential was measured relative to a fixed reference electrode at the surface.
vThe most useful component of this potential difference is the electrochemical potential because it can cause a significant deflection in the SP response opposite permeable beds. The magnitude of this deflection depends mainly on the salinity contrast between the drilling mud and the formation water, and the clay content of the permeable bed. Therefore, the SP log is commonly used to detect permeable beds and to estimate clay content and formation water salinity. The SP log can be used to distinguish between impermeable shale and permeable shale and porous sands.
Well logging operations
vWell logging opera t ions can e i ther be performed during the drilling process (see Logging While Drilling), to provide real-time information about the formations being penetrated by the borehole, or once the well has reached Total Depth and the whole depth of the borehole can be logged.
Logging while drillingv In the 1970s, a new approach to wireline logging was
introduced in the form of logging while drilling (LWD). v This technique provides similar well information to
conventional wireline logging but instead of sensors being lowered into the well at the end of wireline cable, the sensors are integrated into the dri l l s tr ing and the measurements are made in real-time, whilst the well is being drilled. This allows drilling engineers and geologists to quickly obtain information such as porosity, resistivity, hole direction and weight-on-bit and they can use this information to make immediate decisions about the future of the well and the direction of drilling.
Memory logvThis method of data acquisition involves
recording the sensor data into a down hole memory, rather than transmitting "Real Time" to surface.