geological mapping of dam abutments utilizing historic ... · n75e 89se napcf n29w59sw n53w82ne...
TRANSCRIPT
International Archives of Photogrammetry and Remote Sensing. Vol. XXXII, Part 5. Hakodate 1998
Geological Mapping of Dam Abutments Utilizing Historic Images and Digital Feature Matching
Gary Robertson GRAI Imaging Inc. Nepean, Ontario Canada
Doug Bennett U.S. Department of the Interior
Bureau of Reclamation
Commission V 0/VG V1)
Keywords: Geological Mapping, Dip and Strike, Historical Images, Dam Abutment, digital image matching.
Abstract:
Close range photogrammetry has been used for Geological mapping for many years and has been well addressed in several papers. This paper will discuss an interesting problem solving approach, utilizing historical photographs, extent images, digital image matching and digital photogrammetry to provide geological mapping of Dam abutments. A request was made to expand the geological information of a Dams left and right upstream and downstream abutments. The major problem was that the Dam was built in the 1948 -1953 time period . The main abutments are under heavy tree cover and very steep slopes. Historical photographs taken during the 1948 and 1951 construction time period were located showing the exposed slopes. This paper describes the procedure for digitally matching the historical images with the extent photography of the few visible exposed portions of the slope. Utilizing digital photogrammetry geological profiles, and orientations (dip & strike) were obtained .
INTRODUCTION
Hungry Horse Dam, the principal feature of the Hungry Horse Project, is located on the South Fork of the Flathead River in northwestern Montana near Glacier National Park. The dam is located approximately 3 miles from Hungry Horse, 9 miles southeast of Columbia Falls and 17 air miles northeast of Kalispell, Montana, in the Flathead National Forest (see Figure 1 ).
Hungry Horse Dam is a variable thickness, concrete arch-type structure constructed between 1948 and 1953. The dam has a crest length of 2,115 feet, a structural height of 564 feet and a hydraulic height of 515 feet. The crest has a thickness of 35 feet at elevation 3565.0 feet, and a maximum base thickness of af)proximately 320 feet. The dam contains 2,934,321 yd3 of concrete .
The spillway is located at the right abutment and consists of a morning glory-type inlet structure surmounted by a ring gate with a diameter of 64 feet and a crest elevation of 3560.0 feet while in the fully raised position. An inclined shaft passing thought the right abutment underneath the dam to a horizontal tunnel, and a flip bucket terminal structure, complete the spillway. At the maximum design water surface elevation, 3565.0 feet, the capacity of the spillway is estimated to be 53,000 ft3/s .
The power plant, located at the downstream toe of the dam, includes four 162-inch-diameter penstocks that supply four 105,000-horsepower Francis-type turbines. The total generating capacity of the plant is 428,000 kilowatts . Figure 2 shows a general layout of Hungry Horse Dam and Power Plant.
Hungry Horse Reservoir provides storage for power generation, flood control, irrigation, and recreation. The dam forms a reservoir approximately 34 miles long, with a maximum width of 3 ½ miles. Reservoir capacity is nearly 3.5 million acre-feet. The maximum depth of the reservoir is 500 feet.
143
PURPOSE OF THE STUDY
A team of engineers and geologists, from the Bureau of Reclamation's Technical Service Center in Denver, Colorado, familiar with various aspects of Hungry Horse Dam met to perform a screening level risk assessment for Hungry Horse Dam. The purpose of the risk assessment was to evaluate the dam, appurtenances, and foundation for static, hydrologic, and seismic loading conditions.
The risk assessment identified a number of potential failures for the dam. This risk screening showed a high level of risk associated with static, and seismic loading conditions. Failure probabilities were estimated on the high side due to lack of information. These results reflect many uncertainties associated with unknown loading probabilities for the hydrologic and seismic load cases in this study, and uncertainties for the condition of the rock foundation for the static load case.
To address these uncertainties, a field exploration program was initiated . The focus of the exploration program was detailed mapping of the geologic features of both abutments downstream of the dam and at upstream areas where they are exposed , plus, assessment of the rockfall potential near the spillway intake structure and the condition of the foundation rock surrounding the spillway tunnel. This is essential for identifying critical potential failure blocks in the foundation for detailed foundation stability analyses.
Initial site visits to the dam revealed that the right abutment was relatively bare of vegetation, although any work on the abutment wou ld need to be performed on ropes. However, the left abutment was virtually covered with trees and soil with very little exposure. In addition, archival drawings revealed that geologic mapping was confined primarily to the footprint of the dam. During construction numerous photographs were taken of the site to document the construction progress. It was proposed that these construction photos might be of use

[==:Jn.aT"UCNATIOJIUIL'OflEST
C=1or11u1111.llOl!AL,()AUU
6£0TION··THRU SPILLWAY
N
1
UNITED STATES DEPARTMENT OF THE INTERIOR
BUREAU OF RECLAMATION
HUNGRY HORSE PROJECT MONTANA
LOCATION MAP
HUNGRY HORS£ OAM LOGAT/ON ANO GENERAL LAYOUT
Figure 2.
144
MA1'l111/M SCCTION THlfU 1'6NITOQK A/10 N:WDf l'LANT
WtLIUr NICIIUIC•IIIGI MCCIClrtn • 10 a .0 IO
111111"111111 ""'"'"·•.J°"!'"' ,rn
in documenting geologic features on the abutments. images The decision was made to attempt to use historic photography of the Hungry Horse Dam to collect geologic and topographic data from the abutments shown in the images for an initial phase of the exploration program.
GEOLOGY
Regional Geology
Hungry Horse Dam is located in an area of high mountains and ridges made up of sedimentary rocks described as the belt series of the Proterozoic Era, Precambrian . The valley areas are covered with geologically younger Tertiary age lakebed deposits, Pleistocene glacial deposits, and Holocene alluvial deposits.
In the general vicinity of the damsite are three formations of the belt series. The Grinnel Formation is the oldest and consists of thinly laminated to massive argillite containing some quartzite beds. Overflying the Grinnel argillite is the younger Siyeh Formation that consists of siliceous, argillaceous, and dolomitic limestone. Hungry Horse Dam is located within this formation . The third and uppermost formation is the Missoula Formation composed of thinly bedded argillites and quartzites.
Site Geology
The Siyeh Limestone Formation underlies both abutments and the toe area of the dam. Bedding in the Siyeh is generally regular and is shown by a difference of mineral composition, color and texture. The beds range in thickness from a few inches to several feet, are continuous and composed of fine grained material of medium hardness, bluish gray to greenish gray in color with some light gray beds. Nowhere is the limestone pure, instead varying amounts of siliceous, argillaceous and dolomitic materials are present. These impurities in the limestone have slightly increased the hardness of the rock and have increased the resistance of the rock to erosion and weathering over that of a pure limestone. The siliceous beds are light gray, the argillaceous beds are greenish gray and the beds high in calcareous material are bluish gray in color.
At the damsite the bedding has an average strike and dip of N38° W, 30° NE. The slope of the left abutment has been controlled by the dip of the bedding, while the slope of the right abutment has been controlled by the northwest striking joints.
PHOTOGRAMMETRIC ANALYSIS
Gary Robertson & Assoc. Inc. (GRAI) was contracted to perform the necessary photogrammetric studies, including collection of accurate coordinate data from historic black and white photography for the purpose of depicting, mapping and analyzing, three-dimensional geologic and topographic features .
For inaccessible areas, close range photogrammetry provides the best means for providing orientation and extent of discontinuities. For the photogrammetric analysis images had to be obtained showing the exposed slopes mainly the downstream portion of the dam
145
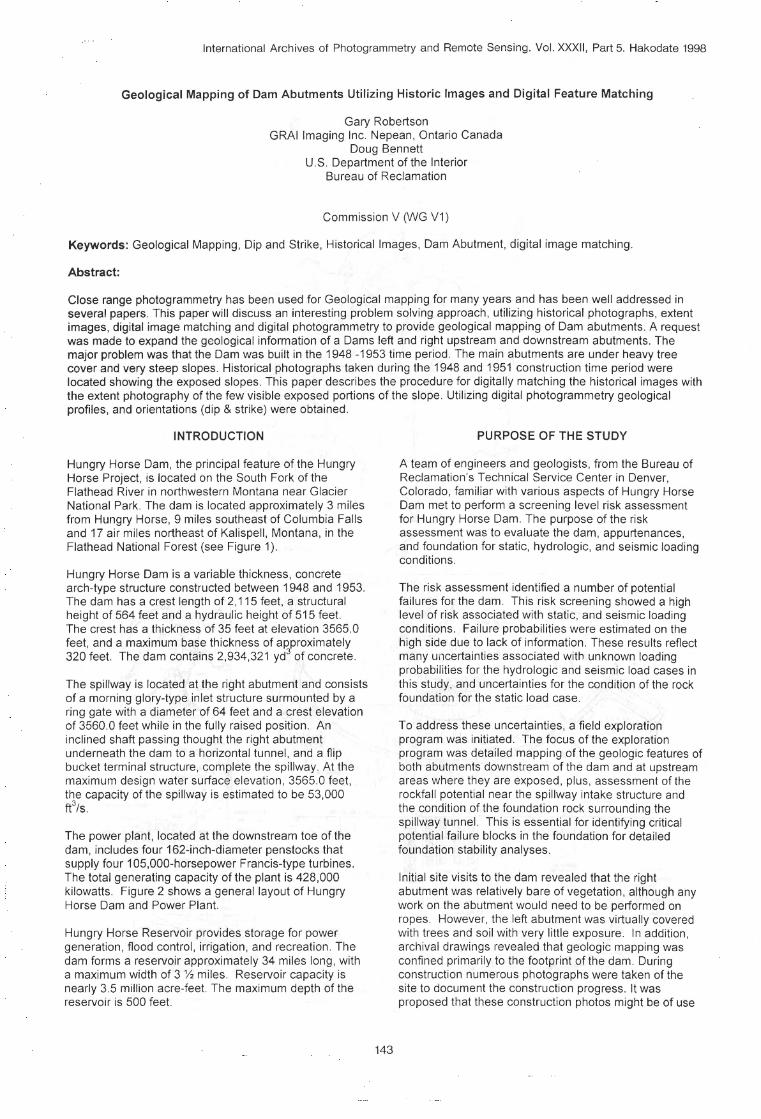
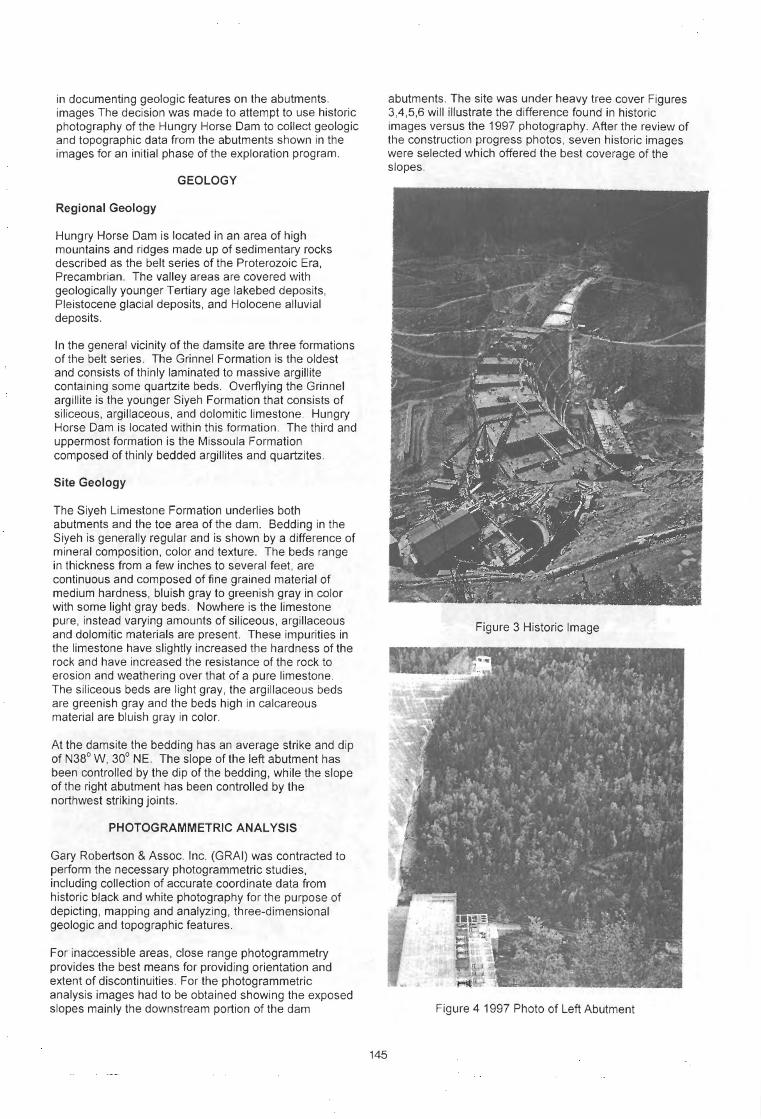
abutments. The site was under heavy tree cover Figures 3,4,5,6 will illustrate the difference found in historic images versus the 1997 photography. After the review of the construction progress photos, seven historic images were selected which offered the best coverage of the slopes.
Figure 3 Historic Image
Figure 4 1997 Photo of Left Abutment
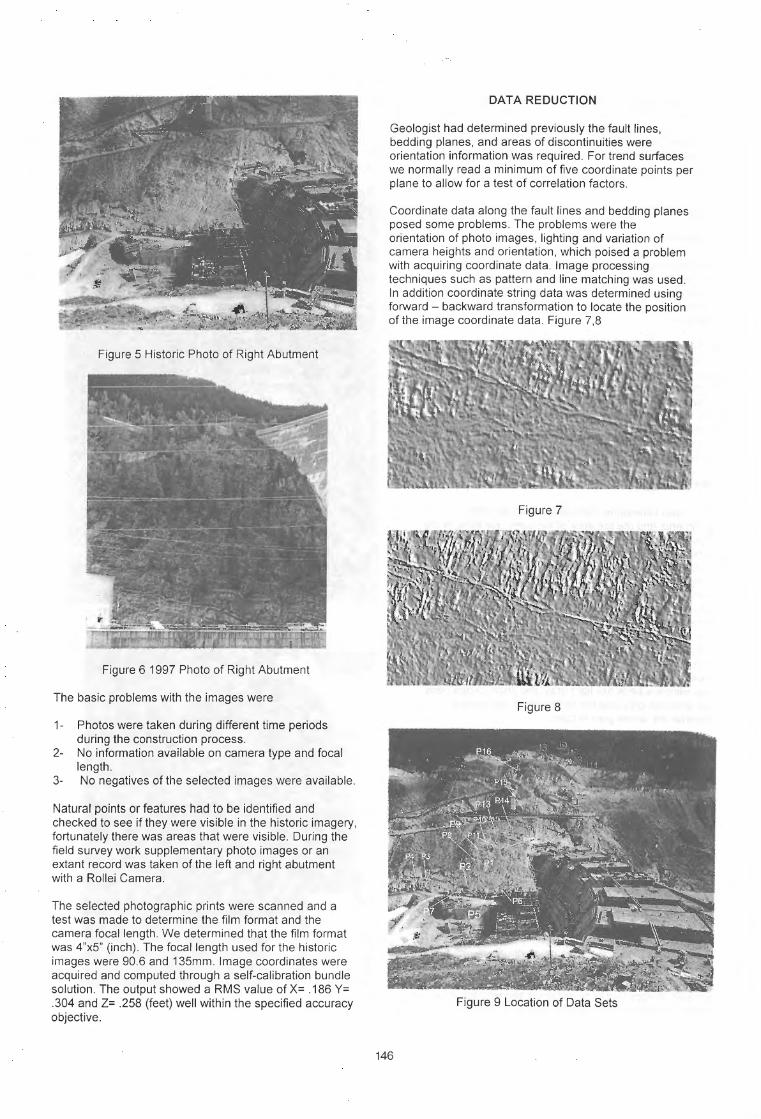
Figure 5 Historic Photo of Right Abutment
Figure 6 1997 Photo of Right Abutment
The basic problems with the images were
1- Photos were taken during different time periods during the construction process.
2- No information available on camera type and focal length.
3- No negatives of the selected images were available.
Natural points or features had to be identified and checked to see if they were visible in the historic imagery, fortunately there was areas that were visible. During the field survey work supplementary photo images or an extant record was taken of the left and right abutment with a Rollei Camera.
The selected photographic prints were scanned and a test was made to determine the film format and the camera focal length. We determined that the film format was 4"x5" (inch). The focal length used for the historic images were 90.6 and 135mm. Image coordinates were acquired and computed through a self-calibration bundle solution. The output showed a RMS value of X= .186 Y= .304 and Z= .258 (feet) well within the specified accuracy objective.
DAT A REDUCTION
Geologist had determined previously the fault lines, bedding planes, and areas of discontinuities were orientation information was required. For trend surfaces we normally read a minimum of five coordinate points per plane to allow for a test of correlation factors.
Coordinate data along the fault lines and bedding planes posed some problems. The problems were the orientation of photo images, lighting and variation of camera heights and orientation, which poised a problem with acquiring coordinate data. Image processing techniques such as pattern and line matching was used. In addition coordinate string data was determined using forward - backward transformation to locate the position of the image coordinate data. Figure 7,8
Figure 7
Figure 8
Figure 9 Location of Data Sets
146
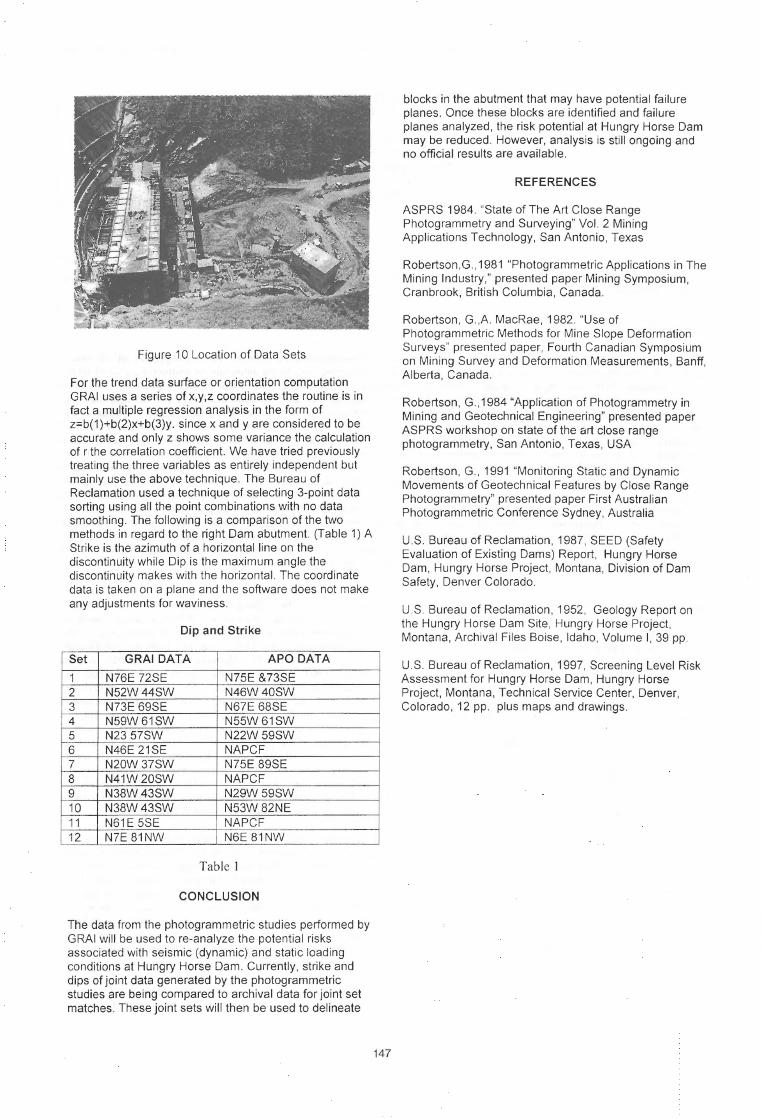
Figure 10 Location of Data Sets
For the trend data surface or orientation computation GRAI uses a series of x,y,z coordinates the routine is in fact a multiple regression analysis in the form of z=b(1}+b(2)x+b(3)y. since x and y are considered to b~ accurate and only z shows some variance the calculation of r the correlation coefficient. We have tried previously treating the three variables as entirely independent but mainly use the above technique. The Bureau of Reclamation used a technique of selecting 3-point data sorting using all the point combinations with no data smoothing. The following is a comparison of the two methods in regard to the right Dam abutment. (Table 1) A Strike is the azimuth of a horizontal line on the discontinuity while Dip is the maximum angle the discontinuity makes with the horizontal. The coordinate data is taken on a plane and the software does not make any adjustments for waviness.
Set
1 2 3 4 5 6 7 8 9 10 11 12
Dip and Strike
GRAI DATA APO DATA
N76E 72SE N52W44SW N73E 69SE N59W61SW N23 57SW N46E 21SE N20W37SW N41W20SW N38W43SW N38W43SW N61E 5SE N7E 81NW
N75E &73SE N46W40SW N67E 68SE N55W61SW N22W59SW NAPCF N75E 89SE NAPCF N29W59SW N53W82NE NAPCF N6E 81NW
Table I
CONCLUSION
The data from the photogrammetric studies performed by GRAI will be used to re-analyze the potential risks associated with seismic (dynamic) and static loading conditions at Hungry Horse Dam. Currently, strike and dips of joint data generated by the photogrammetric studies are being compared to archival data for joint set matches. These joint sets will then be used to delineate
147
blocks in the abutment that may have potential failure planes. Once these blocks are identified and failure planes analyzed, the risk potential at Hungry Horse Dam may be reduced. However, analysis is still ongoing and no official results are available.
REFERENCES
ASP RS 1984. "State of The Art Close Range Photogrammetry and Surveying" Vol. 2 Mining Applications Technology, San Antonio, Texas
Robertson,G., 1981 "Photogrammetric Applications in The Mining Industry," presented paper Mining Symposium, Cranbrook, British Columbia, Canada.
Robertson, G.,A. MacRae, 1982. "Use of Photogrammetric Methods for Mine Slope Deformation Surveys" presented paper, Fourth Canadian Symposium on Mining Survey and Deformation Measurements, Banff, Alberta, Canada.
Robertson, G., 1984 "Application of Photogrammetry in Mining and Geotechnical Engineering" presented paper ASP RS workshop on state of the art close range photogrammetry, San Antonio, Texas, USA
Robertson, G., 1991 "Monitoring Static and Dynamic Movements of Geotechnical Features by Close Range Photogrammetry" presented paper First Australian Photogrammetric Conference Sydney, Australia
U.S. Bureau of Reclamation, 1987, SEED (Safety Evaluation of Existing Dams) Report, Hungry Horse Dam, Hungry Horse Project, Montana, Division of Dam Safety, Denver Colorado.
U.S. Bureau of Reclamation, 1952, Geology Report on the Hungry Horse Dam Site, Hungry Horse Project, Montana, Archival Files Boise, Idaho, Volume I, 39 pp.
U.S. Bureau of Reclamation, 1997, Screening Level Risk Assessment for Hungry Horse Dam, Hungry Horse Project, Montana, Technical Service Center, Denver, Colorado, 12 pp. plus maps and drawings.