geologic storage formation classification: understanding ... library/research/carbon...
TRANSCRIPT

BEST PRACTICES for:
First Edition
Geologic Storage Formation Classification: Understanding Its Importance and Impacts on CCS Opportunities in the United States

Disclaimer This report was prepared as an account of work sponsored by an agency of the United States Government. Neither the United States Government nor any agency thereof, nor any of their employees, makes any warranty, express or implied, or assumes any legal liability or responsibility for the accuracy, completeness, or usefulness of any information, apparatus, product, or process disclosed, or represents that its use would not infringe privately owned rights. Reference therein to any specific commercial product, process, or service by trade name, trademark, manufacturer, or otherwise does not necessarily constitute or imply its endorsement, recommendation, or favoring by the United States Government or any agency thereof. The views and opinions of authors expressed therein do not necessarily state or reflect those of the United States Government or any agency thereof.
Cover Photos—Credits for images shown on the cover are noted with the corresponding figures within this document.

Geologic Storage Formation Classification: Understanding Its Importance and Impacts on CCS
Opportunities in the United States
September 2010
National Energy Technology Laboratory
www.netl.doe.gov
DOE/NETL-2010/1420


5
Table of ContentsExecutive Summary ____________________________________________________________________________ 10
1.0 Introduction and Background Geology _________________________________________________________ 111.1 Geologic Background _______________________________________________________________________________ 13
1.2 Igneous Rocks _____________________________________________________________________________________ 14
1.3 Metamorphic Rocks ________________________________________________________________________________ 16
1.4 Sedimentary Rocks _________________________________________________________________________________ 16
2.0 Characteristics of Storage Reservoirs and Confining Units _________________________________________ 202.1 Reservoir Properties _______________________________________________________________________________20
2.2 Sealing and Trapping Mechanisms ___________________________________________________________________ 21
3.0 Depositional Environments __________________________________________________________________ 243.1 Deltaic Reservoir Properties _________________________________________________________________________28
Deltaic Depositional Environment _______________________________________________________________________28
3.2 Carbonate Reservoir and Reef Reservoir Properties ____________________________________________________32
Carbonate Depositional Systems ________________________________________________________________________32
Reef Depositional System ______________________________________________________________________________33
3.3 Turbidites Reservoir Properties ______________________________________________________________________34
Turbidite Depositional System ___________________________________________________________________________34
3.4 Strandplain Reservoir Properties ____________________________________________________________________36
Strandplain Depositional System ________________________________________________________________________36
Barrier Island Depositional System _______________________________________________________________________ 37
3.5 Alluvial and Fluvial Fan Reservoir Properties __________________________________________________________38
Alluvial Depositional Systems ___________________________________________________________________________38
Fluvial Depositional Systems ____________________________________________________________________________38
3.6 Eolian Reservoir Properties _________________________________________________________________________40
Eolian Depositional Systems ____________________________________________________________________________40
3.7 Lacustrine Reservoir Properties ______________________________________________________________________ 41
Lacustrine Depositional Systems _________________________________________________________________________ 41
Evaporites Depositional System _________________________________________________________________________ 42
3.8 Basalt Reservoir Properties _________________________________________________________________________ 42
4.0 The Road to Commercialization _______________________________________________________________ 44
References ____________________________________________________________________________________ 48
Section 1 References __________________________________________________________________________________48
Sections 2 and 3 References ___________________________________________________________________________48
Section 4 References __________________________________________________________________________________53
Table of Contents Table of Contents

6
List of Figures
Figure 1-1. Schematic of CO2 from a Thermoelectric Power Plant and Refinery being stored in Various Geologic Formations. ___________________________________________________ 12
Figure 1-2. Formation and Distribution of Igneous Rock in the Earth’s Crust. _______________________________ 14
Figure 1-3. Cut and polished granite showing pink and white quartz crystals and black mica. _________________ 15
Figure 1-4. Basalt. ______________________________________________________________________________ 15
Figure 1-5. Distribution of Known Basalt Formations in the United States and Canada Investigated by NETL. _________________________________________________________________ 15
Figure 1-6. Slate, a fine-grained, foliated, metamorphic rock that was formerly shale. _______________________ 16
Figure 1-7. Schist a metamorphic rock where heat and pressure have elongated individual minerals. __________ 16
Figure 1-8. Environments for Weathering and Deposition of Rocks that can Produce Sedimentary Clastic Deposits.___________________________________________________________ 17
Figure 1-9. Environments for Formation of Carbonate Rocks. ___________________________________________ 17
Figure 1-10. Cut sandstone core from Eolian deposit showing banding, ___________________________________ 17
Figure 1-11. Close-up of coral pink sandstone from Eolian formation, _____________________________________ 17
Figure 1-12. Course sandstone showing bedding planes. _______________________________________________ 18
Figure 1-13. Shale with parallel bands or layers. _______________________________________________________ 18
Figure 1-14. Etched limestone showing shells and calcareous debris from Kope Formation, Ohio. ______________ 18
Figure 1-15. Map of Oil and Gas Fields Superimposed on Saline Basins of North America. _____________________ 19
Figure 1-16. Distribution of Known Coal Basins Investigated by NETL. _____________________________________ 19
Figure 2-1. Porosity in Rocks and Rock Permeability. __________________________________________________ 20
Figure 2-2. Microscopic Schematic of Rock Porosity and Permeability. ____________________________________ 21
Figure 2-3. Shale, sand, and anhydrite core from Colorado and well-sorted beach sand. _____________________ 22
Figure 2-4. Capillary trapping of CO2. ______________________________________________________________ 23
Figure 2-5. Structural traps: (left) Anticline, (center) Fault, (right) Salt Dome as trap. _________________________ 23
Figure 3-1. Components of a Deltaic System. ________________________________________________________ 28
Figure 3-2. Mississippi River Delta, United States, Lobe Development over the Last 5,000 years. _______________ 28
Figure 3-3. Mississippi River Delta, United States. A Recently Developed Elongated Shaped Delta that is River-Dominated. __________________________________________________________ 28
Figure 3-4. Nile River Delta, Egypt. A Lobe Shaped Delta that is Wave-Dominated. __________________________ 29
List of FiguresList of Figures

7
Figure 3-5. Rhone River, France. A Wave-Dominated Elongated Delta.. ___________________________________ 29
Figure 3-6. Ganges/Brahmaputra River Delta, Bangladesh. _____________________________________________ 29
Figure 3-7. As Time, Heat and Pressure Increase during Coalification, the Lignite Changes into Bituminous and Finally Anthracite Coal. ___________________________________________________ 30
Figure 3-8. Structure of coal and the cleat system within. ______________________________________________ 31
Figure 3-9. Carbonate Depositional System. An idealized block diagram of carbonate depositional environments based on Pennsylvanian carbonates in southeastern Utah. _______________________ 32
Figure 3-10. Groundwater zones. __________________________________________________________________ 33
Figure 3-11. Pinnacle Reef Development in Alberta. ___________________________________________________ 34
Figure 3-12. A. Coarse-grained, Sand-rich Turbidite System and B. Fine-grained, Mud-rich Turbidite System. _____________________________________________________________________ 35
Figure 3-13. Strandplain Deposit along the South Carolina Coast. ________________________________________ 36
Figure 3-14. Strandplain near the mouth of the Kugaryuak River, Coronation Gulf, Southwest Kitikmeot Region, Nunavut, Canada. _____________________________________________________ 36
Figure 3-15. Barrier Island with Beach and Back Dune Areas. ____________________________________________ 37
Figure 3-16. Barrier Island along the Texas Coast. _____________________________________________________ 37
Figure 3-17. Badwater Fan, Death Valley, California. ___________________________________________________ 38
Figure 3-18. Large alluvial fan between the Kunlun and Altun mountains, XinJiang Province, China. ____________ 38
Figure 3-19. Google Earth Image of Bhramapura River System, Bangladesh showing Braided stream system depositing sediment from the Himalayan Mountains. ___________________________ 39
Figure 3-20. Closer Image of Braided River Fluvial Depositional System. ___________________________________ 39
Figure 3-21. Braided River Flowing on a previously Glaciated Flat near Peyto Lake, Banff National Park, Canadian Rockies, Alberta, Canada. __________________________________________ 39
Figure 3-22. Block diagram of a meandering stream (A) and braided stream (B) showing lateral migration of channel and point bar sequence and environmental relationships. __________________ 40
Figure 3-23. The Namib Desert Dune Ridge System. ___________________________________________________ 41
Figure 3-24. A Lacustrine Formation Being Deposited in a Hydrologically Closed System. _____________________ 41
Figure 3-25. Evaporite Deposits being formed on the Caribbean Island of Bonaire. __________________________ 42
Figure 3-26. Major Internal Features of a Columbia River Basalt Group (North America) Lava Flow. ______________ 43
Figure 4-1. Matrix of NETL CO2 Geosequestration Projects and Depositional Environments. __________________ 47
List of Figures List of Figures

8
List of TablesTable 3-1. Reservoir Depositional Classification Schematic. ___________________________________________ 25
Table 3-2. Characteristics of Depositional Reservoirs. ________________________________________________ 26
Table 4-1. CO2 Geosequestration Projects with Lithology and Geologic Classification. _____________________ 44
List of TablesList of Tables

9
List of Acronyms and Abbreviations
Acronym/Abbreviation Definition
ARRA ________________________ American Recovery and Reinvestment Act of 2009
Big Sky _______________________ Big Sky Carbon Sequestration Partnership
Btu __________________________ British thermal unit
CBM _________________________ Coalbed Methane
CCS _________________________ Carbon Capture and Storage
CH4 _________________________ Methane
CO2 __________________________ Carbon Dioxide
CaCO3 _______________________ Calcium Carbonate
DOE _________________________ U.S. Department of Energy
ECBM ________________________ Enhanced Coalbed Methane
EOR _________________________ Enhanced Oil Recovery
EPA _________________________ U.S. Environmental Protection Agency
GHG _________________________ Greenhouse Gas
GIS __________________________ Geographic Information Systems
HFC _________________________ Hydrofluorocarbon
LIP __________________________ Large Igneous Provinces
MGSC________________________ Midwest Geological Sequestration Consortium
MORB _______________________ Mid-Ocean Ridge Basalts
MRCSP _______________________ Midwest Regional Carbon Sequestration Partnership
MWh ________________________ Megawatt Hour(s)
N2O _________________________ Nitrous Oxide
NRDC ________________________ Natural Resources Defense Council
NETL ________________________ National Energy Technology Laboratory
OIB __________________________ Ocean Island Basalts
OOIP ________________________ Original Oil in Place
PCOR ________________________ Plains CO2 Reduction Partnership
ppm _________________________ parts per million
RCSP ________________________ Regional Carbon Sequestration Partnership(s)
RD&D ________________________ Research, Design, and Demonstration
SECARB ______________________ Southeast Regional Carbon Sequestration Partnership
SWP _________________________ Southwest Regional Partnership on Carbon Sequestration
TDS _________________________ Total Dissolved Solids
USGS ________________________ U.S. Geological Survey
WAG ________________________ Water Alternating Gas
WESTCARB ___________________ West Coast Regional Carbon Sequestration Partnership
List of Acronyms and AbbreviationsList of Acronyms and Abbreviations
10
Executive SummaryA need exists for further research on carbon storage technologies to capture and store carbon dioxide (CO2) from stationary sources that would otherwise be emitted to the atmosphere. Carbon capture and storage (CCS) technologies have the potential to be a key technology for reducing CO2 emissions and mitigating global climate change.
Deploying these technologies on a commercial-scale will require geologic storage formations capable of: (1) storing large volumes of CO2; (2) receiving CO2 at an efficient and economic rate of injection; and (3) safely retaining CO2 over extended periods. Eleven major types of depositional environments, each having their own unique opportunities and challenges, are being considered by the U.S. Department of Energy (DOE) for CO2 storage. The different classes of reservoirs reviewed in this study include: deltaic, coal/shale, fluvial, alluvial, strandplain, turbidite, eolian, lacustrine, clastic shelf, carbonate shallow shelf, and reef. Basaltic interflow zones are also being considered as potential reservoirs.
DOE has recently completed this study which investigated the geology, geologic reservoir properties and confining units, and geologic depositional systems of potential
reservoirs and how enhanced oil recovery (EOR) and coalbed methane (CBM) are currently utilizing CO2. The study looked at the classes of geologic formations, and their potential to serve as CO2 reservoirs, distribution, and potential volumes.
This study discussed the efforts that DOE is supporting to characterize and test small- and large-scale CO2 injection into these different classes for reservoirs. These tests are important to better understand the directional tendencies imposed by the depositional environment that may influence how fluids flow within these systems today, and how CO2 in geologic storage would be anticipated to flow in the future. Although diagenesis has modified fluid flow paths during the intervening millions of years since they were deposited, the basic architectural framework created during deposition remains. Geologic processes that are working today also existed when the sediments were initially deposited. Analysis of modern day depositional analogs and evaluation of core, outcrops, and well logs from ancient subsurface formations give an indication of how formations were deposited and how fluid flow within the formation is anticipated to flow.
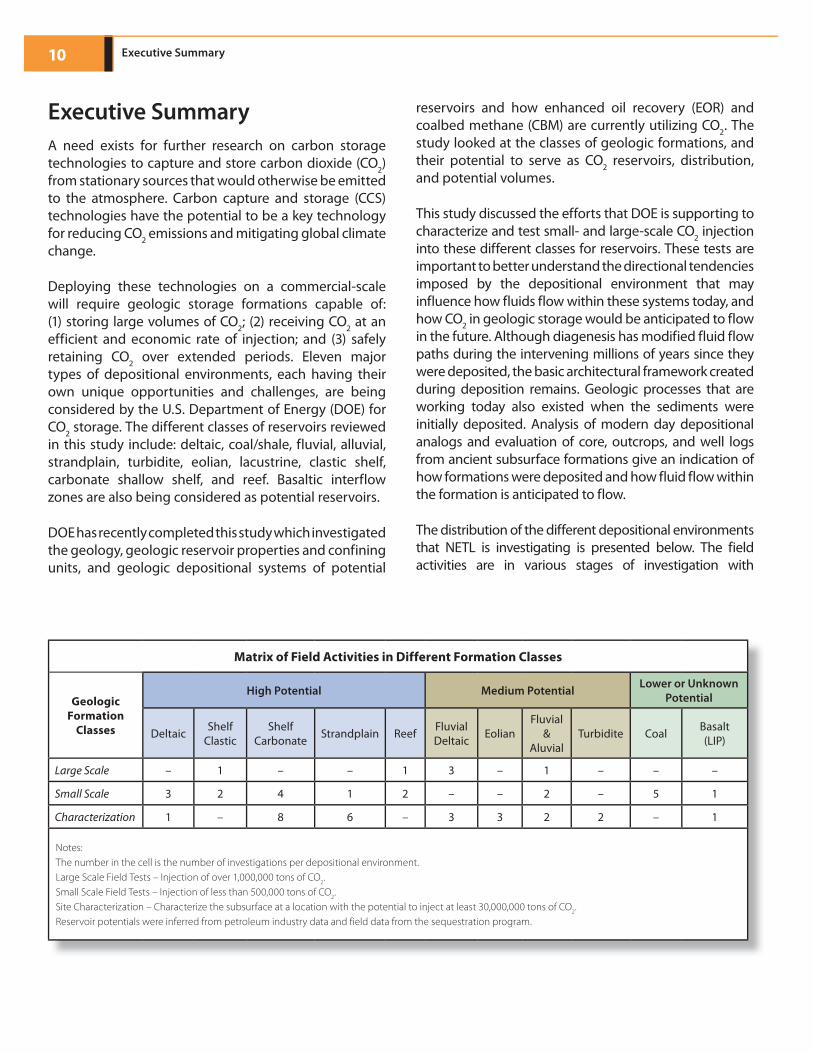
The distribution of the different depositional environments that NETL is investigating is presented below. The field activities are in various stages of investigation with
Executive Summary
Matrix of Field Activities in Different Formation Classes
Geologic Formation
Classes
High Potential Medium Potential Lower or Unknown Potential
Deltaic Shelf Clastic
Shelf Carbonate Strandplain Reef Fluvial
Deltaic EolianFluvial
& Aluvial
Turbidite Coal Basalt(LIP)
Large Scale – 1 – – 1 3 – 1 – – –
Small Scale 3 2 4 1 2 – – 2 – 5 1
Characterization 1 – 8 6 – 3 3 2 2 – 1
Notes:The number in the cell is the number of investigations per depositional environment.Large Scale Field Tests – Injection of over 1,000,000 tons of CO2.Small Scale Field Tests – Injection of less than 500,000 tons of CO2.Site Characterization – Characterize the subsurface at a location with the potential to inject at least 30,000,000 tons of CO2.Reservoir potentials were inferred from petroleum industry data and field data from the sequestration program.
Executive Summary

11
some completed and others just underway. Additional investigations, including small- and large-scale injection tests, will be needed to be completed on all of the different depositional environments. This will provide the information on the behavior and flow of CO2 in the different reservoirs.
Referring to the Distribution of Field Activities for CCS/Geologic Storage matrix, characterization has not been completed for a shelf clastic, reef, and coal environments. Small-scale injection tests (<500,000 tons of CO2) have not been performed on fluvial deltaic, eolian, and turbidite depositional environments. Large-scale injection tests (>1,000,000 tons of CO2) have not been performed on deltaic, strandplain, shelf carbonate, eolian, turbidite, basalt Large Igneous Providences (LIP), and coal. Three highly experimental reservoirs that are not included on the matrix because they have not been investigated are fractured shales, Mid Oceanic Ridge Basalts (MORB), and offshore turbidites.
Understanding the impacts of different reservoir depositional classes on storage of CO2 will support DOE’s efforts to develop the knowledge and tools necessary for future commercialization of carbon storage technologies throughout the United States.
1.0 Introduction and Background GeologyGeologic storage of CO2 is a complex issue involving a number of variables, including capturing the greenhouse gas (GHG) emissions from stationary sources, developing the infrastructure to transport the CO2, and selecting underground reservoirs for CO2 storage. This desk reference is based in part on a DOE report, titled, “Depositional Systems for CO2 Geosequestration (DOE/NETL-2009/1334 Olsen et al., 2009).”
This desk reference is intended to:
• Assist with an understanding of basic geologicalprinciples and terminology associated with potential CO2 geologic storage in formations.
• Show the importance of geologic depositionalsystems in determining the internal architecture of such formations, thus making it possible to predict the behavior of the injected CO2.
• Establish the importance of using the geologicaldepositional system to assess existing and future research, design, and demonstration (RD&D) needs related to storing CO2 in different depositional environments.
A goal of DOE’s Research and Development (R&D) program in carbon storage is to classify the depositional environments of various formations that are known to have excellent reservoir properties and are amenable to geologic CO2 storage. Using lessons learned from the behavior of CO2 in reservoirs from previous geologic investigations and their known depositional environments is important in developing an understanding for similar depositional environments being considered for storage, and predicting the expected behavior of CO2 within these proposed reservoirs without having to duplicate the time, effort, and funds that were expended on the original projects. This is being accomplished through the implementation of 28 CO2 injection field projects in collaboration with the Regional Carbon Sequestration Partnership (RCSP) Initiative and 10 American Recovery and Reinvestment Act of 2009 (Recovery Act) projects that are focused on the characterization of geologic formation as sites for possible commercial carbon capture and storage (CCS) development. DOE has completed this review of geologic depositional classification system to better understand how the field work being conducted today fulfills the need to test these different classes of depositional systems and determine what future R&D projects are still needed.
According to the U.S. Environmental Protection Agency (EPA), total GHG emissions were estimated at 7,100 million metric tons (7,800 million tons) CO2 equivalent in the United States in 2006. This estimate included CO2 emissions, as well as other GHGs, such as methane (CH4), nitrous oxide (N2O), and hydrofluorocarbons (HFCs). Annual GHG emissions from fossil fuel combustion, primarily CO2, were estimated at 5,600 million metric tons (6,200 million tons), with 3,800 million metric tons (4,200 million tons) from stationary sources. Carbon dioxide stationary sources are largely related to power production (Carbon Sequestration Atlas of the United States and Canada, 2008).
Carbon dioxide is a byproduct of the oxidation of hydrocarbons and is generated from the natural decomposition of organic material, accelerated oxidation
1. 0 I nt r o d u c t i o n a n d B a c kg r o u n d G e o l o g y1.0 Introduction and Background Geology

12
(burning of fossil hydrocarbons or biomass), and geologic sources (e.g., volcanoes). Carbon dioxide is also the product of decomposition of rocks, like limestone (calcium carbonate [CaCO3]), in cement manufacturing. Geologic storage of CO2, in underground formations as part of CCS, is one possible long-term/permanent storage solution for the reduction of anthropogenic CO2 from the atmosphere. This approach involves the capture and stabilization of large volumes of CO2 in underground carbon sinks (storage locations) (Baines and Worden, 2004). Some variants of these underground sinks are shown in Figure 1-1, including the surface infrastructure and the different types of reservoirs that are available.
Prior to implementing CCS, site developers and owners will utilize the results from existing storage projects to develop risk assessments and business models for their individual facilities. The existing data, developed by DOE’s National Energy Technology Laboratory (NETL) and others, will allow an individual site to be evaluated to better define the costs for geologic storage, determine the type and quality of geologic sinks that are available in the region, and evaluate the type and quality of transportation infrastructure that is required.
NETL has pioneered and developed practices for the evaluation, installation, and operation of CCS facilities. These practices were developed to both help reduce the costs of implementing CCS and to protect human health and the environment from adverse effects of CO2. CCS will allow the viable use of coal-fired power plants while helping to stabilize climate changing CO2 emissions. Coal fuels the majority of power generation capacity in the United States and in many other areas of the world. Coal is an abundant domestic energy resource and the primary source of baseload power generation in the United States, generating 1,986 million megawatt hours (MWh) in 2008. At the 2008 rate of consumption, coal could meet the United States’ needs for more than 234 years. Since 1976, coal has been the least expensive fossil fuel used to generate electricity when measured based on the cost per British thermal unit (Btu [a unit of energy content]). Although the cost of generating electricity from coal has increased, it is still lower than generating electricity from either natural gas or petroleum in most areas. The number of coal-fired power plants is expected to increase in the future. Existing facilities can be retrofitted with CCS technology to allow for the continued use of coal without emitting CO2 emissions into the atmosphere.
Figure 1-1. Schematic of CO2 from a Thermoelectric Power Plant and Refinery being stored in Various Geologic Formations. (Adapted from original figure, courtesy of Dan Magee, Alberta Energy Utilities Board, Alberta Geologic Survey, 2008.)
1. 0 I nt r o d u c t i o n a n d B a c kg r o u n d G e o l o g y1.0 Introduction and Background Geology

13
In the oil and natural gas industry, the injection of CO2 underground has been occurring for approximately four decades. As discussed later in this document, CO2 is used to extract previously unrecoverable oil and increase oil and gas production. This has resulted in millions of dollars of additional revenue to local and state economies. In this application, CO2 is considered a commodity.
Although it is also important to consider non-geologic factors for successful large-scale deployment of CCS technologies, including geographic location (source to sink matching), economic factors, public acceptance, and the capture portion of CCS, this report focuses on evaluating the depositional environment of potential geologic reservoirs for future CCS projects.
1.1 Geologic Background There are three major types of rock that future developers of CCS projects might target for storage formations, including: igneous, metamorphic, and sedimentary. Each major type of rocks was formed under different conditions, and their potential for CO2 storage varies based on the necessary criteria of:
• Capacity, which is based on the porosity or openings within a rock, often called “pore space.”
• Injectivity, which is dependent on the permeability or the relative ease with which a fluid or gas can move within the pore space(s) of a rock.
• Integrity, or the ability to confine a fluid or gas within a geologic unit, is of primary importance, because without impermeable seals, fluids will take the path of least resistance and move to a lower-pressure area, including the surface.
The answers to questions concerning capacity, injectivity, and integrity can be learned, in part, by reservoir characterization of the formations in the area of the proposed geologic storage site. Reservoir characterization is an evolving science that integrates many different scientific disciplines (geology, geophysics, mathematical modeling, computational science, seismic interpretation, well log and core analysis, etc.) in order to build a conceptual model of a formation. The decision to select a particular geologic unit for geologic storage
usually depends on having a detailed understanding of the reservoir characteristics and the behavior and fate of the injected fluids and their impact on the geologic strata receiving the fluids. Critical factors include: economic analysis of the location of the site, the distance from the CO2 source to the site, the depth of the reservoir (which influences drilling and injectivity of CO2), the volume of CO2 that the site can contain, the trapping mechanism and sealing capacity, and the ultimate fate of the
What is Supercritical CO2?Carbon dioxide can be stored in either a gas phase or in a liquid (supercritical) phase. The volume to store gas in a gas phase is huge compared to storage in the liquid (supercritical) phase. To get CO2 into a supercritical phase requires that the gas be compressed.
If the CO2 is injected into the reservoir as a liquid the area near the well is cooled but at some distance from the wellbore the liquid takes on the temperature of the reservoir. CO2 injected at depths below approximately 800 meters (2,600 feet) is at a pressure and temperature that will allow the CO2 to remain as a supercritical fluid. By maintaining the pressure as presented in the figure below, the volume required for geologic storage is a fraction of what is required for lower pressures.
Illustration of Effect of Pressure on CO2. (Image courtesy of CO2CRC www.co2crc.com.au/imagelibrary/)
1. 0 I nt r o d u c t i o n a n d B a c kg r o u n d G e o l o g y1.0 Introduction and Background Geology

14
stored CO2. Many of these issues will be affected by the different classes of reservoirs that are being targeted for injection.
Time plays an important role in the formation of reservoirs, because rocks have been formed, eroded, and reformed many times in the history of the Earth before reaching the present configuration of continents and oceans. Reservoirs are strongly affected by these changes. Processes such as compaction of the rock, dissolving and enlarging pore spaces, or filling these pore spaces with sediments or new minerals from solution alters the amount of porosity and permeability of potential CO2 storage reservoirs.
Most CO2 geological storage targets are sedimentary rocks (clastics and carbonates), where CO2 storage is in the pore space between grains, which are most often filled with undrinkable saline water. Igneous formations, which cover more of the Earth’s surface than sedimentary formations, offer potentially great geologic storage sites because of their total volume both on continents and under the oceans, but are mostly untested. Coalbeds are a group of rocks that are considered both sedimentary and metamorphic and have their own unique properties. The most important storage mechanism for coal is its preferential ability to adsorb CO2 directly on its surface. This situation differs from other sedimentary and igneous formations where the CO2 occupies the pore space. It is anticipated that CO2 will be injected as a supercritical fluid in the majority of reservoirs. To better understand
how these rocks are formed and their potential for CO2 storage, brief discussions of the different rock types are summarized in the next three sections.
1.2 Igneous RocksIgneous rocks (from the Latin ignis, fire) are formed by the solidification of cooled magma (molten rock). All rocks on Earth originated from igneous sources. Igneous rocks make up approximately 95% of the upper part of the Earth’s crust. Elevated planetary temperatures during the Earth’s formation produced widespread melting that continues today. The melt originates deep within the Earth and is seen in the crust near active plate boundaries or hot spots. Igneous rocks have unique compositions, because the same elements form different minerals and different rock types based on the temperature and pressure of the magma when they solidify.
Figure 1-2 shows the formation and distribution of igneous rock at divergent plate boundaries and subduction zones (where convergent plate boundaries meet). The movement of these different plates is called plate tectonics. The system is powered by heat convection as hot magma moves upward toward the Earth’s crust and then flows out (cools) away from the divergent plate boundary. Cooler rock tends to sink and gets pulled down into large convection cells. The crust floats on the mantle (83% of Earth’s volume) of melted rocks that extends down about 2,900 kilometers.
Figure 1-2. Formation and Distribution of Igneous Rock in the Earth’s Crust. (Fichter, 2000.)
1. 0 I nt r o d u c t i o n a n d B a c kg r o u n d G e o l o g y1.0 Introduction and Background Geology

15
There are two types of igneous rocks: intrusive and extrusive. In particular, extrusive types offer some unique potential for CO2 storage. Their high porosity and mineralogy offer opportunities for high volume storage and reactive chemistry that could convert the CO2 into solid carbonates and essentially trap the CO2 in the rocks forever.
• Intrusive Igneous Rocks (plutonic) are formed from magma that cools and solidifies within the Earth. The most common intrusive rocks are granite (Figure 1-3), which vary considerably in color depending on the minerals present. These rocks may be fractured and have low porosity and permeability, making them unlikely targets as storage formations.
• Extrusive Igneous Rocks (volcanic igneous rock) are produced when magma exits and cools quickly outside of, or near, the Earth’s surface. The quick cooling means that mineral crystals do not have much time to grow, so these rocks have a fine-grained or
Figure 1-5. Distribution of Known Basalt Formations in the United States and Canada (in yellow) Investigated by NETL (2008).
1. 0 I nt r o d u c t i o n a n d B a c kg r o u n d G e o l o g y
Figure 1-3. Cut and polished granite showing pink and white quartz crystals and black mica.
Figure 1-4. Basalt. (Courtesy of USGS Rock Library.)
1.0 Introduction and Background Geology

16
even glassy texture. Hot gas bubbles are often trapped in quenched lava, forming a bubbly, vesicular texture and lots of porosity. In particular, basalts (Figure 1-4) are extrusive igneous rocks that offer opportunities for CO2 storage. Figure 1-5 shows the geographic extents of basalt formations in the United States.
1.3 Metamorphic RocksMetamorphic rocks are formed from pre-existing rocks (igneous, sedimentary, or other metamorphics). Metamorphic rocks are created from these pre-existing rocks through processes that generate heat and pressure resulting from deep burial and tectonic (mountain building) activity (Figures 1-6 and 1-7). For the most part, metamorphic rocks are of little interest as geologic targets for CO2 storage due to their low porosity (little pore space between sediment grains) and low permeability (near zero interconnectivity of these pore spaces that allows fluids to flow through the rock).
Figure 1-6. Slate, a fine-grained, foliated, metamorphic rock that was formerly shale. (Courtesy of USGS Rock Library.)
Figure 1-7. Schist a metamorphic rock where heat and pressure have elongated individual minerals. Elongated quartz crystals are white in photo. (Courtesy of USGS Rock Library.)
Figure 1-6. Slate, a fine-grained, foliated, metamorphic rock
Figure 1-7. Schist a metamorphic rock where heat and pressure
However, a metamorphic rock that has some potential for CO2 storage potential is anthracite coal. Anthracite has progressed through three stages of coalification. Anthracite coal is classed as metamorphic rock, based on the temperatures and pressures required to form this dense coal from softer sedimentary coal. Anthracite is not an abundant form of coal and represents a relatively small opportunity for CO2 storage.
1.4 Sedimentary RocksSedimentary rocks are formed from fragments of pre-existing rocks that are transported and held together (cemented) through natural agents, such as chemical precipitation from solution or secretion by organisms. Over geologic time, weathering or erosion of rock formations at a higher elevation produces sediment that is carried by water, wind, ice, and gravity to lower elevations and deposited as sands and silts intermixed with organic materials as sedimentary deposits. The various environments in which this takes place are depicted in Figure 1-8 for clastic (consisting of fragments) rocks. A comparable schematic representation of the depositional environments for carbonates is provided in Figure 1-9 .
• Clastics, like sandstone (Figures 1-10, 1-11, and 1-12) and shale (Figure 1-13), are deposited as sand, silt, gravels, or with organic materials on beaches (tidal flats, shelfs, and barrier islands), in river channels (fluvial), in lagoons and swamps, in desert dunes (eolian) (Figure 1-11), in lakes (lacustrine), or as offshore submarine fans (turbidite). These deposits can form fans, sand bars, deltas, braided or meandering streams, or dunes, each having a distinct depositional pattern and a unique internal architecture that controls fluid flow within the reservoir body (see Figure 1-8). Bituminous coal is also an important sedimentary rock that offers opportunities for CO2 storage and enhanced coalbed methane (ECBM) recovery.
• Carbonate rocks (Figure 1-9) are the product of both biological and chemical systems (e.g., corals formed in reefs, oyster shell banks, or as chemical precipitates) (Figure 1-14). They are also classified as sedimentary rocks. Carbonate deposition occurs in seawater and is highly dependent on water depth and sunlight, which allow organisms to grow.
1. 0 I nt r o d u c t i o n a n d B a c kg r o u n d G e o l o g y1.0 Introduction and Background Geology

171. 0 I nt r o d u c t i o n a n d B a c kg r o u n d G e o l o g y
Figure 1-8. Environments for Weathering and Deposition of Rocks that can Produce Sedimentary Clastic Deposits. (Courtesy of Professor L. S. Fichter, 2000.)
Figure 1-9. Environments for Formation of Carbonate Rocks. (Courtesy of Professor L. S. Fichter, 2000.)
Figure 1-10. Cut sandstone core (cut horizontal) from Eolian deposit showing banding. (Courtesy of Ken Hammond, USDA Rock Library.)
Figure 1-11. Close-up of coral pink sandstone from Eolian formation where sand grains have been rounded and lightly cemented together. (Courtesy of Professor Mark Wilson.)
1.0 Introduction and Background Geology

18
Most corals that are reef forming species live in shallow water. At shallow water depths, the primary carbonate forming species are microscopic size, one-cell plankton. Carbonate sediments formed in offshore basins and in oceans are the result of tiny shells drifting down and accumulating as thick ooze on the seafloor. The ooze is transformed into carbonate shale or chalk over time. Carbonates also include a subclass of rocks, called “evaporates,” which include salts, gypsum, and anhydrite that are formed when saline water evaporates, leaving layers of dense, low permeability salts that often form seals to other high permeability formations. Water has reacted with carbonate rocks in some areas to create porosity and permeability (solution channels) making these rocks of interest for CCS.
Both clastic and carbonate rocks possess geologic storage potential because of the relatively high porosity and permeability developed during their formation. However, the unique changes that occur as sediments are transformed into today’s rock determine the exact nature and potential of a clastic or carbonate reservoir for fluid flow and storage. Changes that occur following deposition are termed post-deposition or diagenetic changes and can impact the porosity and permeability of the rock and have some impacts on the injectivity, fluid flow, and capacity of the formations. Understanding these changes and their impacts on storage is critical to transferring the results of DOE’s field projects to other portions United States that have similar types of depositional environments.
Figure 1-14. Etched limestone showing shells and calcareous debris (calcium carbonate) from Kope Formation, Ohio. (Courtesy of Jim Stuby.)
1. 0 I nt r o d u c t i o n a n d B a c kg r o u n d G e o l o g y
Figure 1-13. Shale with parallel bands or layers. (Courtesy of USGS Rock Library.)Figure 1-13. Shale with parallel bands or layers. (Courtesy of Figure 1-12. Coarse sandstone showing bedding planes originally
deposited horizontally. (Courtesy of USGS Rock Library.)
1.0 Introduction and Background Geology

19
During the development of the regional characterization for geologic storage sites, NETL through its regional carbon sequestration partners (RCSPs) identified and examined the location of potential injection zones in different basins throughout the United States and Canada. Initial resource estimates were calculated for the primary storage formations and have been reported in the 2008 version of the Carbon Sequestration Atlas of the United States and Canada. These estimates are refined as NETL and the RCSPs continue to validate storage potential in each respective region. Conservative estimates of storage potential in North America show the potential for hundreds of years of CO2 storage in deep geologic formations bearing saline fluids and oil and gas. These geologic formations and reservoirs are made up of the different geologic classes discussed in this report.
These sedimentary formations contain layers of porous or fractured rocks that are saturated with brine, oil, and gas. Brine is a highly saline solution that contains appreciable amounts of salts that have either been leached from the surrounding rocks or from sea water that was trapped when the rock was formed. The U.S. EPA has determined that a saline formation used for CO2 storage must have at least 10,000 parts per million (ppm) of total dissolved solids (TDS, - salts), compared to sea water, which currently has approximately 34,000 ppm of TDS. Most drinking water supply wells contain a few hundred ppm or less of TDS. Any higher concentrations in drinking water would have an unacceptable, salty taste (Price, Allen, and Unwin). Oil and gas reservoirs are often saline formations that have proven traps and seals allowing oil and gas to accumulate in a trap over millions of years. With the exceptions of multiple manmade wellbores, there is little reason to believe that these same formations would leak if the oil and gas was replaced with CO2. Many oil and gas fields containing stacked formations (different reservoirs) have characteristics that make them excellent target locations for geologic storage, including good porosity. The regions of various sedimentary basins where saline formations, oil and gas fields, and unmineable coal seams that have been assessed for storage potential are shown in Figures 1-15 and 1-16.
Figure 1-15. Map of Oil and Gas Fields (red) Superimposed on Saline Basins (blue) of North America. (NATCARB, 2008.)
Figure 1-16. Distribution of Known Coal Basins Investigated by NETL. (NATCARB, 2008.)
1. 0 I nt r o d u c t i o n a n d B a c kg r o u n d G e o l o g y1.0 Introduction and Background Geology

20
2.0 Characteristics of Storage Reservoirs and Confining UnitsReservoir characterization, as applied in this report, is based on the hypothesis that what is learned from the depositional environment of a reservoir can be used to develop a geological/reservoir model. The model will describe (in part) the characteristics and performance of another reservoir deposited in the same type of depositional environment. In general, three types/groups of reservoirs have been historically evaluated for potential geologic storage of CO2: depleted oil and gas reservoirs, deep coalbeds unavailable to conventional mining, and saline formations. Additionally, research is being performed to evaluate the potential for geologic storage in fractured basalts and shales. These reservoirs are made up of multiple depositional environments and have been grouped together based on their reservoir content and geology.
The characteristics of geologic formations or reservoirs that help make them potential geologic storage targets include: porosity; permeability; adequate volume for storage; seals; and a trapping mechanism(s) to confine the CO2 for safe, long-term storage. Porosity and permeability are primarily dependent on the depositional system and post-depositional processes or diagenesis.
Most geologic storage targets are sedimentary rocks where CO2 storage is trapped in the pore space between grains. Igneous formations have great potential for CO2because of their huge expanse, but have only recently started to be studied as potential storage reservoirs. Coalbeds are a group of rocks that have their own unique properties (cleats) that control fluid paths and a rock matrix where physical adsorption in the matrix would be the principal means of capturing CO2.
2.1 Reservoir Properties Rocks are often not as solid as they appear to the naked eye. Microscopically, there are voids or pore spaces among the sediment grains forming a rock, not unlike the space surrounding marbles in a jar. Porosity is the first essential element of a reservoir, shown schematically in Figure 2-1and microscopically in Figure 2-2. Permeability, which involves the interconnectedness of the individual pores, is the second essential element (Figures 2-1 and 2-2). Permeability is the capacity of a rock to transmit fluids through interconnected pores on a microscopic scale. Permeability depends on the size and shape of the pores, especially the pore throats (narrow channels between pores) that control interconnections, and the extent of these interconnections.
2.0 Characteristics of Storage Reservoirs and Confining Units
Figure 2-1. Porosity in Rocks and Rock Permeability.
2.0 Characteristics of Storage Reservoirs and Confining Units

212.0 Characteristics of Storage Reservoirs and Confining Units
There are predictable trends in porosity and permeability in reservoirs related to the depositional environment where sediments were deposited. Reservoirs associated with delta formations, rivers and flood plain deposits (fluvial), submarine canyons and slumps—deltas in deep water (turbidites), and carbonate reefs are known for their good porosity and permeability. Rock units formed by windblown sand (eolian) both along sea shores and in deserts are also good reservoirs. Diagenesis over millions of years tends to alter the trends initially established by their depositional pattern. However, paths of fluid flow follow the path of least resistance. For the most part they are predictable. Thus, injected CO2 would be anticipated to abide by the reservoirs internal architecture. The reservoir is not one large uniform sand box, but rather has defined boundaries and barriers initially defined by the depositional environment in which it was deposited.
Both porosity and permeability (generation, magnitude, and distribution) differ considerably between igneous, metamorphic, and sedimentary (clastic and carbonate) reservoirs. Diagenetic changes can create or destroy the original porosity and permeability, or create barriers to fluid flow. Porosity, usually caused by fracturing and/or dissolution of the original rock matrix, is often referred to as secondary porosity. In some cases, the secondary porosity considerably increases the porosity of the rock
matrix and is the primary mechanism for fluid storage and fluid flow. Geologic storage of CO2, regardless of other factors, must have sufficient areal extent and reservoir volume to hold large volumes, possibly requiring several stacked formations (often deposited over hundreds of thousands of years or millions of years within the same named formation) and their respective trapping mechanisms and seals.
2.2 Sealing and Trapping Mechanisms Since the density of CO2 is less than saline water, it tends to float upward; therefore, a seal (frequently called the caprock) above the storage unit is required. Seals have to significantly retard the movement of fluids (Couples, 2005). Without a seal, hydrocarbons (oil) generated at depth would have long ago migrated toward the surface and either biodegraded to heavier oil or escaped to the atmosphere. In the same manner, injected CO2will not remain in a storage reservoir unless adequate seals are present. Analysis of seals involves assessment of their thickness, lateral extent, permeability, and geomechanical properties (rock mechanics), such that their effectiveness can be quantified. Factors that may influence the integrity of a caprock include lithology (type of sediment), thickness, burial depth, ductility
Figure 2-2. Microscopic Schematic of Rock Porosity and Permeability.
2.0 Characteristics of Storage Reservoirs and Confining Units

22 2.0 Characteristics of Storage Reservoirs and Confining Units
(ability to stretch or flow without breaking), permeability, and lateral continuity (Allen and Allen, 2005). Clays, claystones, shales, chalks, and evaporites formed by evaporation of salt water, such as gypsum, anhydrite, and halite, are favorable lithologies for sealing (Grunau, 1987). A rock that has been drilled from a deposit that was laid down at the bottom of a shallow lake over a few tens of thousands of years is shown in Figure 2-3 (left). Individual bands of fine clay (dark brown) are visible, as well as courser sand (light tan), a high organic content fine sediment (decomposition of years of algae growth - black layer), a grey/white layer of salt (the lake dried out), followed by more sediment deposited
in the lake in more recent time. Fluid flow would be anticipated to flow horizontally through the small zones if the permeability is high enough but would be greatly restricted from moving vertically because of the bedding plains (fine shale and anhydrite) layers. Fluid flow would be anticipated to be higher in the course sand layer than in the layers composed of finer silt and clay. This shale core, if thick enough, may be a seal for geologic storage. Well-sorted beach sand is shown in Figure 2-3 (right) would make an excellent reservoir; reservoirs are rarely as uniform except on a small scale of less than inches as depicted with this photo.
Figure 2-3. Shale, sand, and anhydrite core from Colorado (left) and well-sorted beach sand (right). (Courtesy of USGS.)
2.0 Characteristics of Storage Reservoirs and Confining Units

232.0 Characteristics of Storage Reservoirs and Confining Units
Figure 2-4. Capillary trapping of CO2 occurs in narrow pore throats, which prevents the CO2 from migrating up from the larger pores in the rock matrix. The strength of capillary trapping depends on the width of the pore radii and on the interfacial tension at the interface between the two fluids (water and CO2). (CO2 Capture Project, 2009.)
Figure 2-5. Structural traps: (left) Anticline, (center) Fault, (right) Salt Dome as trap. (Modified from Petroleum Research Institution Website, 2008.)
Trapping mechanisms are primarily stratigraphic or structural depending on the physical processes by which they isolate an area or formation. Stratigraphic traps are the result of lithology (rock type) changes. Common stratigraphic sealing units are thick layers of shales or evaporites, which function as hydraulic resistant seals, as shown on microscopic level in Figure 2-4. Structural traps can be divided into three forms: anticline trap, fault trap, and salt dome traps. Anticline traps are formed by folding, causing isolation of reservoirs in high points (Figure 2-5 – left). Anticlinal traps are important in petroleum exploration and could just as easy be for geologic storage. Fault traps are formed by faulting with parallel rock sections moving so that impermeable rock types trap the migrating fluids within a reservoir (Figure 2-5 – center). Salt dome reservoirs are formed by salt domes or diapirs intruding into sedimentary layers and isolating areas along the flanks of the salt structure (Figure 2-5 – right).
If both the seal and storage unit outcrops at some extended distance from where the CO2 is injected, the “seal” may not provide containment for the time period necessary for CO2 storage.
Seals have been classified into two main types:
• Membranesealsthatrelyoncapillaryprocesses.
• Hydraulic resistance seals that rely on low leakagerates (Brown, 2003).
2.0 Characteristics of Storage Reservoirs and Confining Units

24
3.0 Depositional EnvironmentsThe majority of geologic units being considered for geologic storage are sedimentary, having been formed in freshwater lakes or saline oceans, known as basins. The current rock formation (reservoir) architecture is the result of millions of years of sediment deposition in these basins. The orientation of the original deltas, beaches, reefs; how the basins were filled; and what has happened in the intervening time since the deposition (called diagenetic alteration) influence the flow of fluids like CO2.
Each type of geologic formation has different opportunities and challenges. While geologic formations are infinitely variable in detail, they have been classified by geologists and engineers in the petroleum industry by their trapping mechanism, the hydrodynamic conditions (mechanical forces that produce), lithology (physical characteristics), and more recently by their depositional environment (how they were formed). The depositional environment influences how formation fluids are held in place, how they move, and how they interact with other formation fluids and solids (minerals). These properties may allow the formation to be labeled as reservoirs, which in a broad sense permits the containment of liquids or gases. For the purposes of geologic storage, the geologic formation/reservoir classification system has been expanded to include unconventional reservoirs, such as coalbeds, and igneous formations, such as stacked basalts. By understanding the depositional environments of potential reservoirs, correlations can be drawn from similar depositional environments around the world. This could potentially eliminate some of the site-specific characterization requirements for similar depositional systems. The reservoir classification scheme developed for CO2 storage, based on depositional environments, is presented as Table 3-1. For some systems like granite an igneous rock or metamorphic rocks there is little or no porosity or permeability except occasional fracture systems, which are often solution filled with other minerals, leaving them with little or no storage potential these system are not discussed in this document. The reservoirs internal architecture governing flow characteristics, potential chemical reactions, and geomechanical processes from the injection of CO2 into different types of reservoir depositional environments are summarized in Table 3-2.
For fluid flow in porous media, knowledge of how depositional systems formed and directional tendencies imposed by the depositional environment can influence how fluids flows within these systems today and how CO2 in geologic storage would be anticipated to flow in the future. Although diagenesis has modified fluid flow paths in the intervening millions of years, the basic architectural framework created during deposition remains. Geologic processes that are working today also existed when the sediments were initially deposited. Analysis of modern day depositional analogs, evaluation of core, outcrops, and well logs from ancient subsurface formations provide an indication of how formations were deposited and how fluid flow within the formation is anticipated to flow.
Compartmentalization is graded on how effective the baffles between adjacent areas of deposition are. This is dependent on the permeability of the material and the amount of fluid flow.
3.0 Depositional Environments3.0 Depositional Environments

25
Rock
Cla
ssif
icat
ion
Lith
olog
yG
eosc
ienc
e In
stit
ute
for O
il an
d G
as R
ecov
ery
Rese
arch
Cla
ssif
icat
ion
in 1
991
DO
E’s
Oil
Rese
rvoi
r Cl
assi
fica
tion
from
199
0’s
Sequ
estr
atio
n Fo
rmat
ion
Clas
sifi
cati
on 2
010
Stor
age
Seal
s
Sedi
men
tary
Clas
tic
Rese
rvoi
rs
Del
ta
Del
ta/F
luvi
al-D
omin
ated
Clas
s I R
eser
voirs
Del
taic
Del
ta/W
ave-
Dom
inat
ed
Del
ta/T
ide-
Dom
inat
ed
Coal
/Sha
le
Shal
es
(fine
terr
igen
ous m
ater
ials
—cl
ays
as w
ell a
s fro
m c
arbo
nate
s)
Dep
osite
d in
Lac
ustr
ine,
Flu
vial
, Allu
vial
, Nea
r Sh
ore
and
Ope
n O
cean
Mar
ine
Envi
ronm
ents
Del
ta/U
ndiff
eren
tiate
d
Fluv
ial
Fluv
ial/
Brai
ded
Stre
am
Clas
s 5
Rese
rvoi
rsFl
uvia
lFl
uvia
l/Mea
nder
ing
Stre
am
Fluv
ial/
Und
iffer
entia
ted
Allu
vial
Fan
Allu
vial
Stra
ndpl
ain
Stra
ndpl
ain/
Barr
ier C
ores
an
d Sh
oref
aces
Clas
s 4
Rese
rvoi
rsSt
rand
plai
nSt
rand
plai
n/Ba
ck B
arrie
rs
Stra
ndpl
ain/
Und
iffer
entia
ted
Turb
idite
sSl
ope-
Basi
nCl
ass
3 Re
serv
oirs
Turb
idite
Basi
n
Eolia
n —
Win
d Bl
own:
Cla
stic
s and
/or C
arbo
nate
sEo
lian
Lacu
strin
e —
Lak
e D
epos
ited:
Cla
stic
s, Ca
rbon
ates
, Eva
porit
esLa
cust
rine
Evap
orit
es
(from
var
ious
Lith
olog
y D
epos
ited
in A
rid S
ettin
gs)
Shel
fSh
elf
Carb
onat
e Re
serv
oirs
Carb
onat
e (>
50%
Ca
rbon
ate
cont
ent b
ut
can c
onta
in
Terri
geno
us
mat
erial
s —
sand
, feld
spar
, no
n-ca
rbon
ate
boul
ders
and
evap
orite
s)
Perit
idal
Dol
omiti
zatio
n
Mas
sive
Dis
solu
tion
Oth
er
Shal
low
She
lf/O
pen
Dol
omiti
zatio
n
Clas
s 2
Rese
rvoi
rs
Shal
low
Sh
elf
Mas
sive
Dis
solu
tion
Oth
er
Shal
low
She
lf/Re
stric
ted
Dol
omiti
zatio
n
Mas
sive
Dis
solu
tion
Oth
er
Reef
Dol
omiti
zatio
n
Reef
Mas
sive
Dis
solu
tion
Oth
er
Shel
f Mar
gin
Dol
omiti
zatio
n
Mas
sive
Dis
solu
tion
Oth
er
Slop
e-Ba
sin
Oth
er
Igne
ous
Basa
lts
Basa
ltic
Inte
rflo
w Z
ones
Gra
niti
c
Met
amor
phic
Tabl
e 3-
1. R
eser
voir
Dep
ositi
onal
Cla
ssifi
catio
n Sc
hem
atic
.
3.0 Depositional Environments 3.0 Depositional Environments

26
Table 3-2. Characteristics of Depositional Reservoirs.
ClassificationPrimary Flow Direction of
Injected FluidsComposition
Characteristic Deposition
Pattern
Potential CO2 Interactions
Chemical Interactions
with CO2
Compartmentalization1
Deltaic
Parallel to stream or delta axis when deposited. Fluids flow in high permeability paths
Ranges from course sand in channel bottoms to fine clays in seals, but formed within predictable ranges of deposition for types of deltas
Dependent on delta type and where within delta.
Interaction dependent on carbonate content and clay barrier (shales) within
Moderate chemical reactivity depending on clays
Depends on where in depositional environment
Coal
Parallel to axis of least stress imposed by diagenesis on the cleat network
Highly variable content with organic content showing remains of plant materials, as well as various clays and sand
Highly variable, but deposited in layers
Adsorption dominates
Adsorption dominates, but little chemical reactivity
Controlled by cleat network
Shale
Flow direction controlled by diagenesis after deposition. Little flow- low porosity and permeability
Mostly fine to very fine clays, fine sand, organic matter, and/or fine carbonate fragments
Deposited as layers in low flow environments causing drapes over higher permeability larger sediment
Forms sealsSlow chemical reactions with clays in shale
Few compartments, forms seals and barriers within and between other formations.
Fluvial
Parallel to axis of stream when deposited. Fluids flow in high permeability paths
Ranges from course sand in channel bottoms to fine clays in seals, but formed within predictable ranges of deposition for rivers
Fining upward in channel
Interaction dependent on carbonate content and clay barrier (shales) within
Moderate chemical reactivity depending on clays
Highly variable depending on where within fluvial system
Alluvial
Parallel to axis of alluvial fan when deposited
Wide mix of poorly sorted materials, size, and composition
Fan thinning to distal end
Highly variable based on rock composition
Highly variable based on rock composition
Little
Strandplain Parallel to beach front
Principally quartz sands
Parallel to the beach and perpendicular to the beach
Little interaction
Little chemical reactivity as mostly quartz sand
Moderate
TurbiditeParallel to axis of deposition of fan
Variable composition and ranges from finer carbonate, sand, fine clays to very fine clays
Repeated layers of fining upward. Fine materials toward distal end
Interaction dependent on carbonate content
Chemical reactivity dependent on carbonate, quartz sand, and clay composition
Highly
Eolian
Parallel to prevailing wind direction at time of deposition
Mostly well-rounded quartz sands, few fines
Pattern depends on dune type, but within dune type are usually consistent
Little interaction
Little chemical reactivity as mostly quartz sand
Highly
3.0 Depositional Environments3.0 Depositional Environments

27
ClassificationPrimary Flow Direction of
Injected FluidsComposition
Characteristic Deposition
Pattern
Potential CO2 Interactions
Chemical Interactions
with CO2
Compartmentalization1
Lacustrine
Parallel to horizontally depositional bedding plane Flow direction controlled by diagenesis after deposition. Little flow
Fine clays, silt, sand, organics, windblown fines, evaporites, and carbonates
Highly layered depositional pattern, often reflecting seasonal variations
Interaction dependent on carbonate, evaporite, and clay content within
Highly variable dependent on composition of rock.
Highly layered
Shelf Clastic including
Barrier Island
Highly variable and controlled by diagenesis after deposition
Mix of terrestrial material (quartz, clays, etc.) and <50% carbonate materials
Often highly mixed by tides, waves, currents, and sea dwelling animals
Interaction dependent on carbonate content and clay barrier (shales) within
Chemical reactivity highly dependent on carbonate content and little interaction with quartz, reaction with clays slow
Depends on depositional environment
Shallow Shelf
Restricted and Open Carbonate
Highly variable and controlled by diagenesis after deposition
Highly variable mix of carbonate materials and <50% terrestrial materials quartz sands and clays
No characteristic pattern. Original depositional structure modified by diagenesis
In presence of water dissolved near well carbonate, precipitates form downstream in presence of ions, such as sulfate
Fast reaction with carbonates and then sulfates
No consistent pattern
Reef
Flow direction controlled by diagenesis after deposition
Principally carbonates, limited terrestrial material
Dominated by reef original structure, modified by diagenesis
In presence of water dissolved near well carbonate, precipitates form downstream in presence of ions, such as sulfate
Fast reaction in carbonates No consistent pattern
Basalt
Dominated by flow in interflow zone, little flow through basalt
Composition of MORB is remarkably uniform throughout the world, and different from ocean island basalts (OIB) or LIP, but within LIP similar patterns in basalt flows at different scales. Interflow zones in LIP have highly variable composition
Structure of basalts different for MORB, OIB, or LIP, but within LIP similar patterns in basalt flows at different scales. Interflow zones are highly variable.
CO2 will help seal fractures within basalt.
High chemical reactivity within basalt, but reactions are slow; interflow zone mixed composition, thus variable reactivity
Interflow zone different from within basaltic in LIP and different than MORB
1 Compartmentalization is graded on how effective the baffles between adjacent areas of deposition are. This is dependent on the permeability of the material and the amount of fluid flow.
3.0 Depositional Environments 3.0 Depositional Environments

28
nature of the deposits is dependent on the type of river and the climate. Sediments in fluvial dominated delta environments are usually described as fining upward, meaning that coarse sediments are on the bottom and fine material is deposited on top. These types of deltas tend to form fingers of delta front sands and the general distribution of major sands tends to be perpendicular to the shoreline. The lower delta plane channels become more numerous as they divide into smaller distributaries.
Figure 3-1. Components of a Deltaic System. (Coleman and Prior, p. 139, 1982.)
Figure 3-2. Mississippi River Delta, United States, Lobe Development over the Last 5,000 years. (Frasier, 1967.)
Figure 3-3. Mississippi River Delta, United States. A Recently Developed Elongated Shaped Delta that is River-Dominated. Photo taken by the ASTER Instrument on the Terra Satellite, May 24, 2001. (Courtesy of NASA.)
3.1 Deltaic Reservoir Properties
Deltaic Depositional Environment
Deltas are composed of clastics, which are rock fragments from original geologic units that are re-deposited. There are several groups of deltaic reservoirs, fluvial (river)-dominated, wave-dominated, tide-dominated, and undifferentiated deltas (Fowler, Rawn-Schatzinger, et al., 1995). Each of these different depositional environments will have distinctive fluid flow patterns due to their internal architecture. The components of a delta system are presented in Figure 3-1. Deltaic reservoirs are created by stream or river fed systems that deposit sediments rich in organic matter into standing bodies of water (lakes, bays, lagoons, oceans, etc.), resulting in an irregular expansion of the shoreline. These deltas and rivers meander (move laterally) over time based on the amount and type of deposition, river flow, and flooding (Figure 3-2). In general, all deltas are marked by a thickening wedge of sediment at the interface of land and water. This is formed by the rapid influx and deposition of sediment at a rate that exceeds its removal and redistribution by wave and tidal action.
A fluvial-dominated delta environment is associated with streams and rivers eroding sediments and rocks, the transportation, and deposition of sediments (Figure 3-3). The upper delta plane is the area where fluvial, lacustrine (lake), and swamp sediments occur. The
3.0 Depositional Environments3.0 Depositional Environments

29
A tide-dominated delta is where sedimentation at the delta front is controlled by the high and low tides (Figure 3-6). Multiple small-folded ridges are developed in a linear pattern parallel to the direction of tidal currents, which may be perpendicular or parallel to the delta front. The lower delta plain will have extensive tidal flats where mud is deposited. The tidal-dominated delta
Other depositional features include levees, which are long and narrow ridges on either side or between streams and can develop bays between the channels. In addition, marshes and swamps are usually extensive between the bays and channels. The preferential flow through this depositional environment is along the ancient river channels.
A wave-dominated delta environment is associated with large waves that run over the top of spits or sand bars and down the landward side Figure 3-4 and Figure 3-5. The sands tend to be reworked into numerous coastal barriers that are orientated roughly parallel to the shoreline. Wave-dominated deltas have a broad outer mound of beach material separated by crescent-shaped troughs. A coarsening upward sequence is produced through wave-dominated delta growth, but the sands of the upper part of the sequences should show low-angle cross bedding and planar bedding through wave action on beaches, and some onshore-directed cross bedding from dunes in the shoreface zone. Clear channels are not as evident as river-dominated deltas and sediment is deposited more parallel to the shore than away from the shore and the channel flow is oblique or parallel to the shore.
Figure 3-5. Rhone River, France. A Wave-Dominated Elongated Delta. Flooding in Southern France, the worst in decades carried sediment tinting the otherwise black Mediterranean Sea a bright blue. (Photo from Terre MODIS Satellite, NASA Earth Observation Collection, December 1, 2003, courtesy of NASA.)
Figure 3-4. Nile River Delta, Egypt. A Lobe Shaped Delta that is Wave-Dominated. North is top of image. Photo taken from MISR Satellite, January 30, 2001. (Courtesy of NASA.)
Figure 3-6. Ganges/Brahmaputra River Delta, Bangladesh. This is a Tidal-Dominated Delta - the Largest Inter-Tidal Delta in the World. North is top of image. (Photo from MISR Satellite, November 6, 1994, courtesy of NASA.)
3.0 Depositional Environments 3.0 Depositional Environments

30
should have a thick coarsening upward sequence. Muds should be present in sands showing tidal structures, cut through by major channels filled with sands. Due to the eroding effect of tides, the sands display cross-bedding, the sand ridge field can be truncated through erosion, and the tributary channel sediments contain more slack-water mud drapes than usual. Thus, fluid flow within these sediments shows fewer high-permeability channels and more compartmentalization with fine clays as barriers.
Undifferentiated-deltas may be either a complex combination of any or all of the three major types, or deltas for which insufficient classification information exists.
Coals are deposited over a narrow range of depositional sedimentary environments, including swamps, marshes, and flood plain deposits. In all cases, fresh organic plant material was buried quickly and protected from oxidation (anoxic conditions), otherwise it becomes CO2. The younger sediments rest on the older material.
As coal evolved from soft plant and woody debris into hard coal, the coal ranking increased as the amount of moisture decreased (Figure 3-7). Coal rank is a measure of the maturity of the coal as it changes from peat, to soft coal (bituminous), and eventually hard coal (anthracite). Coal rank increases with heat content, hardness, and carbon content. Maturation is the geological processes of compaction, applying heat, and pressure to the coal over time, which, under suitable conditions, transforms the coal into successively higher ranks. Carbon dioxide storage in coal seams or carboniferous shale is accomplished differently than in other geological settings. Instead of occupying pore space, the CO2 is adsorbed into the matrix of the coal and locked in place. Generally, CO2 that enters coal is held so tight that it will remain in place without caprock(s).
Coal will preferentially adsorb the CO2 and drive out the methane. The practice of using CO2 to boost methane production in Coal Bed Methane (CBM) recovery is called Enhanced Coal Bed Methane (ECBM). The range in the
Figure 3-7. As Time, Heat and Pressure Increase during Coalification, the Lignite Changes into Bituminous and Finally Anthracite Coal. (Courtesy of Steve Greb, Kentucky Geological Survey, 2008.)
3.0 Depositional Environments3.0 Depositional Environments

31
adsorption capacity is based on the exposed surface area of the coal, which is usually governed by diagenetic processes. Coal seams tend to have low permeability and the majority of the porosity and permeability is the result of fracturing/cleats (Figure 3-8). One issue that is still being investigated is coal swelling in the presence of CO2, which may reduce or cutoff the flow of CO2 or methane.
Shale, the most common type of sedimentary rock, is characterized by thin, horizontal layers of rock with low permeability in both the horizontal and vertical direction. Shale is composed of fine clay particles that are packed so closely together that fluids cannot move between the particles. Clays are naturally occurring materials made up of fine-grained minerals derived from igneous rocks. Fluid flow is governed by fractures that could be formed after deposition and other diagenetic processes. In general, vertical fluid flow is negligible when compared to horizontal fluid flow occurring along the bedding plane surfaces. Most of the fluid is transmitted along
fractures parallel to the horizontal bedding planes. In many cases, because of the low permeability of shale, it is considered a caprock or sealing formation for other types of reservoirs.
Many shales contain 1 to 2% organic material in the form of hydrocarbons, which provide an adsorption substrate for storage similar to coal seams. Additional research is needed to focus on achieving economically viable CO2 injection rates, given shale’s low permeability. It is possible that this research may lead to the conclusion that it is not feasible to use fractured, organic-rich shales as reservoirs for geologic storage.
Currently, these tight organic rich shales are being developed as gas and oil shale plays, such as the Marcellus Shale, and are a significant contributor to the domestic natural gas resource. The shale is artificially fractured to allow the release of the natural gas. This may provide a potential storage reservoir for CO2 once the natural gas has been removed.
Figure 3-8. Structure of coal and the cleat system within. The frequency of cleats is generally higher in coal than in the shale layers separating coalbeds. Cleats provide the pathway for fluids to move through the coal. (Tremain et al., 1994; Dallegge and. Barker, 2009.)
3.0 Depositional Environments 3.0 Depositional Environments

32
3.2 Carbonate Reservoir and Reef Reservoir Properties
Carbonate Depositional Systems
Most carbonate material comes from the growth and demise of organisms that live in oceans on continental shelfs. The organisms make their hard parts out of carbonate by extracting calcium and magnesium ions, and CO2 from seawater. Over 90% of carbonates formed in modern environments are thought to be the skeletal remains of biological organisms that formed under marine conditions favorable for their growth. These conditions include light, temperature, salinity, substrate, and presence/absence of clastics high in silicon.
The main controls on carbonate sedimentation are tectonic movement and climate (Tucker and Wright, 1990). The organisms that are the biological building blocks of carbonate reefs have specific tolerances to light, temperature, and water depth. Sea level changes associated with mountain building and glaciers cause sea transgression and regression that can control sedimentary deposits that may cover carbonate generating systems. The wide variety of depositional environments possible for carbonate deposits is shown in Figure 3-9.
Four aspects of carbonate deposition differ from clastic sedimentation: (1) shallow water marine carbonate buildups are similar through geologic time; (2) they form in situ in shallow water with warm tropical conditions; (3) carbonate muds are extensively preserved during compaction; and (4) early diagenesis effects that occur just after deposition. Carbonate buildups have been accumulating in different locations for approximately 545 million years (Demicco and Hardie, 1994).
Shapes of carbonate deposits include:
1) Isolated banks with flat tops and walls that slope steeply down into the ocean. A modern example is the Bahamas Bank.
2) Continental shelf deposits. Modern examples are the shelves of the Belize (Belize) and Great Barrier Reef (Australia).
3) Ramp-like shelves that slope into shallow ocean basins. A modern example is the southern shelf of the Arabian Gulf.
Figure 3-9. Carbonate Depositional System. An idealized block diagram of carbonate depositional environments based on Pennsylvanian carbonates in southeastern Utah. (Modified from Chidsey, 2007.) Figure 3-9. Carbonate Depositional System. An idealized block diagram of carbonate depositional
3.0 Depositional Environments3.0 Depositional Environments

33
As compared to clastic sedimentation, carbonate sedimentation is much more influenced by faulting, fracturing, precipitation, and solution channels after initial deposition. In carbonates, there are far fewer recognizable trends in direction of fluid flow imposed by the initial deposition system (reef, shallow shelf, etc.). Most of the trends in fluid flow are the result of changes to the rock occurring after deposition (Budd, et al., 1995). There are three carbonate depositional environments that are being considered for geologic storage: Peritidal, Shallow Shelf/Open, and Shallow Shelf/Restricted.
Peritidal carbonate depositional environments are defined as the area between the highest tide to the area exposed during the lowest tide. The term peritidal is generally used to describe a variety of carbonate environments associated with low-energy tidal zones, especially tidal flats (Folk, 1973). The orientation and size of these depositional environments is based on the size of the tides and the fluctuation of sea levels. Ancient peritidal carbonates commonly form stratigraphic traps for hydrocarbons as a result of onlap and offlap geometries, creating pinch-out structures (Shinn, 1983a). These carbonate units have usually undergone changes to the rock, including fracturing that causes secondary porosity.
Shallow shelf open and restricted carbonates describe the original carbonate rocks that were deposited either in shallow waters on open shelves, restricted lagoons, deeper water on the shelf margin, or basin slopes as precipitates. As aforementioned, changes in the rock significantly impact the porosity and permeability of the rock over time, which also affects reservoir quality both for oil and gas accumulation and for potential capacity as a CO2 storage reservoir. The flow patterns of water above (vadose zone) and below the water table (phreatic zone) are shown in Figure 3-10; this is important to understanding how secondary porosity controls fluid movement.
Reef Depositional System
The geometry of a reef basin and its tectonic history affect the porosity, permeability, and development of carbonate reservoirs (Klovan, 1974). Reef development corresponds to the overall history of a basin, which is related to tectonic movements and the rise and fall of sea level. Similar controls affect recent and ancient reefs and allow for analogies between depositional settings with similar features. For example, pinnacle reefs developed in response to gradual and continual subsidence, with the reefs growing upward to obtain light as the sea level
Figure 3-10. Groundwater zones. Flow may be through pore networks, or fractures. Dissolution and mixing occurs in the vadose zone and the lower phreatic zones. (Tucker and Wright, 1990, pp 337.)
3.0 Depositional Environments 3.0 Depositional Environments

34
rises. The development of pinnacle reefs found in Alberta is illustrated in Figure 3-11. The restricted basin had barriers that limited water circulation, which prevented development of more massive reefs that result from higher amounts of nutrients.
Isolated banks and reefs form on small up-faulted blocks related to early opening of ocean basins, along the margins of uplifted continental margins, and as fringing reefs on volcanic islands. The huge ancient carbonate continental shelf that rimmed the North American continent during the (Cambrian-Ordovician period, 100 million years BP) is an example of a shelf deposit on a stable, passive margin.
3.3 Turbidites Reservoir Properties
Turbidite Depositional System
Turbidites are downslope gravity flows operating at water depths of greater than 150 feet and form slope, shelf, and basin deposits. Much like alluvial deposits that occur at the base of many mountain ranges, these are the
subsea equivalent, but originate at the margin between shallow water shelf and deeper basins at the continental margins, as shown in Figures 1-8 and 1-9. They can be composed of both clastic- and carbonate-derived rock.
Major rivers do not stop at ocean boundaries, they can continue hundreds of miles out to sea as subsurface rivers (turbidity flows), across the continental shelf, and travel down submarine canyons to the basin floor. Large fluvial inputs beyond river deltas are enhanced during floods of major rivers; the larger flow volume of sediment-laden (i.e. turbid) water scours storm shelfs and lagoons, becoming more and more turbid, carrying dense, sediment-rich water into the ocean where it flows downhill. Turbidites occur in both submarine canyons and on the continental slope. On slopes, they can flow downslope, forming a submarine fan that looks a little like an underwater delta. The place of origin on the continental shelf often refills with sediment and is later scoured off again, causing another layer to be deposited at the base of the slope. Two different shaped of turbidites are formed based on the velocity of the flow, the sediment size, the width of the coastal plane and the basal slope angle (Figure 3-12). Turbidites tend to
Figure 3-11. Pinnacle Reef Development in Alberta. (Alberta Energy Utility Board, 2004.)
3.0 Depositional Environments3.0 Depositional Environments

35
become stacked from repeated sequences of deposition down canyons or from scouring of the continental slope and many form at nearly the same point of origin.
Since the flow of sediment is mostly water, turbidite sediment is well sorted when deposited on the basin floor. Turbidites can be divided into coarse-grained (more sand) and fine-grained (more mud and less sand)
flows where the sand and mud produced different sediment distribution patterns and a different internal architecture as a result. As compared to many other slow geological processes, sand and mud flowing down a submarine canyon causes heavier sediment to fall out faster and lighter sediment to travel farther. Turbidites that separated from their place of origin on the edge of the continental slope and then deposit on the basin floor
Figure 3-12. A. Coarse-Grained, Sand-Rich Turbidite (brown) System, B. Fine-Grained, Mud-Rich Turbidite (brown) System. (Bouma, 2000.)
3.0 Depositional Environments 3.0 Depositional Environments

36
are thickest at the base of the slope and thin as they move outward into the basin (Pratson, et al., 2000). Turbidites at the base of the submarine canyon tend to become stacked from repeated sequences of deposition. The preferential fluid flow path within a turbidite is parallel to the axis of the mass flow (LaBlanc, 1972).
3.4 Strandplain Reservoir Properties
Strandplain Depositional System
Coastal strandplain and barrier island deposits are laid down along a shoreline where wave and tidal forces dominated the transport of sediments (Rawn-Schatzinger and Lawson, 1994). Strandplains typically are created by the redistribution of coarse sediments by waves and long-shore currents on either side of a wave-dominated delta. Tectonics and sediment supply rate control the thickness, lateral extent, and formation of strandplain deposits (modern analogs are shown as Figures 3-13 and 3-14).
Strandplain deposits are formed by sediments moving outward into a sea (the sea level elevation is falling). The shoreface builds seaward and is shaped by waves and currents, which spread out in broad continuous stacked beach deposits along coastlines (DOE/Bartlesville Project Office, 1994). Two forms of strandplain – sand-rich and mud-rich – are distinguished by sediment type. Sand-rich strandplain deposits are continuously deposited parallel and perpendicular to the shoreline and have higher permeability. The sands within mud-rich strandplains are not continuous in the perpendicular direction to the shoreline and have low permeability. Lagoonal deposits (muds and fine silt that form shale) are usually not associated with strandplains because the waves moved fine sediment up the coast and often out to sea. A strandplain with dozens of old beach ridges seen in Figure 3-14 from Kitikmeot Region, Nunavut, Canada can be dated back about 10,000 years when the last glaciers in the area retreated. At the end of the last glaciation, the beach level can be seen in the low, dark cliff line at the foot of the slope of the plateau. The resulting clean sand is often well sorted and has high permeability and porosity. Preferential fluid flow is in the direction paralleling the axis of the deposit.
Figure 3-13. Strandplain Deposit along the South Carolina Coast (infrared satellite image). Note the linear sand ridges building toward the ocean as the strandplain builds through sand brought by long-shore currents. The layered appearance results from the accumulation of new strandlines. (Hayes, 1989.)
Figure 3-14. Strandplain near the mouth of the Kugaryuak River, Coronation Gulf, Southwest Kitikmeot Region, Nunavut, Canada. (Reproduced with the permission of Natural Resources Canada 2010, courtesy of the Geological Survey of Canada. Photo 2002-377 by Daniel Kerr.)
3.0 Depositional Environments3.0 Depositional Environments

37
Barrier Island Depositional System
The depositional processes that influence barrier island formations are a combination of wave/tidal action and long-shore currents (DOE/Bartlesville Project Office, 1994). Sediments are normally carried along the coast by currents; commonly the source of the sediments is from deltas. Wave action sorts the sediments based on grain size and will deposit the larger sized particles on the sea side of the barrier island first and smaller particles later. The deposition is based on the amount of energy generated by tidal influences, the strength of currents, and the strength of the waves. During storms, finer grained sediment may be carried up and over the barrier island to be deposited in the mudflats and lagoons on the land side of the barrier island.
Figure 3-15. Barrier Island with Beach and Back Dune areas visible, South Carolina. (Photo courtesy of Richard Schatzinger, Consulting Carbonate Sedimentologist.)
Figure 3-16. Barrier Island along the Texas Coast with ocean to the left, shoreline, beach and dune ridges, mudflats and lagoon before marshes on mainland on right of photo. (Photo Courtesy of the University of Texas.)
Two modern analogs of barrier island deposition are shown in Figures 3-15 and 3-16. Barrier islands are easily susceptible to storm degradation, which can erode the sand, move the sand in the direction of the current and waves, and overtop the island (they are unstable land masses). Ancient barrier island deposits encountered the same forces (McCubbin, 1982) and preferential fluid flow (highest permeability) within the (Cole, et.al., 1994) barrier island formations is highly variable and controlled by changes to the rock after deposition.
3.0 Depositional Environments 3.0 Depositional Environments

38
3.5 Alluvial and Fluvial Fan Reservoir Properties
Alluvial Depositional Systems
Alluvial depositional systems, like most depositional systems, are gravity driven. In general, an alluvial sediment source comes from higher elevations, such as mountains, and is deposited in valleys. The sediment source and depositional locations are closer together than in other depositional environments. Figures 3-17 and 3-18 show typical alluvial fan system where water has washed sediment from the face of the mountain downhill. Near the heal of the deposit, the material is poorly sorted, coarest grained. The toe of the fan is also poorly sorted, but is finer grained. Prograding fans (where the valley bottom is declining in elevation as compared to the adjacent mountains) lead to a coarsening upward sequence from repeated alluvial deposits. There is no dominant preferential fluid flow path (identifiable and predictable high permeability trend as compared to other depositional environments) in most ancient alluvial deposits.
Fluvial Depositional Systems
Fluvial depositional systems are mechanisms where gravity and water carry sediment from higher to lower elevations. Streams and rivers in the mountains remove material and deposit their sediment load downstream in low lying, flatter terrain. In the lower stretches of rivers, deposition occurs on a temporary basis as streams meander, dropping part of their sediment load only to be picked up and washed farther downstream at a later time. At lower elevations where the river velocity slows, increased deposition occurs (red square in Figure 3-19 and magnified in Figure 3-20), forming braided streams (Figure 3-21).
Fluvial depositional systems often leave characteristic clues of how the sediments are transported, direction of river flow, and the relative velocities of the stream in the subsurface sediments. Heavier sediments fall out first and lighter sediments are carried downstream (to deltas and the ocean) to calmer water where they are deposited. During floods, fine muds are often sent miles away from the normal river channel covering the surrounding lands, while river channels get scoured and redirected by
Figure 3-17. Badwater Fan, Death Valley, California. Oblique air photo looking SSW The Black Mountains in the background provide the source material. Road encircling fan provides scale. (Courtesy of Paul Heller, 2006.)
Figure 3-18. Large alluvial fan (covers an area of 56.6 x 61.3 kilometers) blossoms across an otherwise desolate landscape between the Kunlun and Altun mountains, XinJiang Province, China (image is centered near 37.4o N, 84.3 o E). Right side is the active part of the fan where water currently flows in the many small streams. (Photo by NASA/GSFC/METI/ERSDAC/ JAROS Satellite, May 2, 2002. Courtesy of U.S./Japan ASTER Science Team.)
3.0 Depositional Environments3.0 Depositional Environments

39
higher velocity flows. This leaves characteristic course-grained sediment on the bottom (higher permeability) and fining upwards signature. Over time, the river will start to meander (migrate and form snake-like pattern)(Figure 3-22). The meandering is controlled by the river velocity, sediment load, areas that are being scoured, and areas of deposition.
Ancient fluvial depositional systems have often been reworked and tend to develop individual compartments in portions of the depositional system where the bottom is composed of course sediment that fine upward. This is often sealed by a fine silt/clay layer (future shale) that acts as a barrier to fluid flow. These stacked, compartmentalized sediments may or may not be connected. One would anticipate that injection of CO2 would take the path of least resistance and travel along the higher permeability channels located along the axis of the original river system where the compartmentalization is not as prevalent.
Figure 3-19. Google Earth Image of Bhramapura River System, Bangladesh showing Braided stream system depositing sediment from the Himalayan Mountains. North is top of image. (Google Earth Image modified from Hannes Leetaru, 2009.)
Figure 3-20. Closer Image of Braided River Fluvial Depositional System showing the area in red in previous figure. (Google Earth Image modified from Hannes Leetaru, 2009.)
Figure 3-21. Braided River Flowing on a previously Glaciated Flat near Peyto Lake, Banff National Park, Canadian Rockies, Alberta, Canada. (Google Earth, July 2008.)
3.0 Depositional Environments 3.0 Depositional Environments

40
3.6 Eolian Reservoir Properties
Eolian Depositional Systems
Eolian deposits are unique formations that are formed under arid conditions where wind is the main force that controls the processes and shape of sand formations (Reineck and Singh, 1975). Eolian deposits usually form in interior basins, often in subsiding basins that are dry, coastal areas where a large supply of sand-sized particles exists. The sediments are well sorted, and have the characteristic of coarser stones and larger sand grain sizes between areas of finer grained sand dunes and sand sheets. Dunes are hills of sand with a single summit or crest and a distinct slip face (Figure 3-23). Fine material from the sand dunes is often blown thousands of miles away as is evident from satellite imagery of storms that blow across the Sahara Desert of North Africa and whose clay fines (dust) are deposited downwind as far west as the Caribbean Sea.
Figure 3-22. Block diagram of a meandering stream (a) and braided stream (b) showing lateral migration of channel and point bar sequence and environmental relationships. (Davies, et al., 1996.)
Some eolian deposits also contain carbonate-derived materials (ground coral, limestone, shell), but are normally derived from clastic rock sources. Eolian deposits formed in deserts with no source of water-borne sediments often form large migrating sand dunes with distinct shapes defined by wind patterns. Internal features of these large dunes include horizontal bedding, common on the windward slopes of the dunes and cross-bedded, which are formed by avalanches on the slip face of the dune (Reineck and Singh, 1975). Stratigraphic sequences of sand dunes typically show truncation of one unit and deposition of stacked units as erosion and deposition alternate. The prevalent fluid flow direction within these reservoirs is usually parallel to the wind direction when the unit was deposited.
3.0 Depositional Environments3.0 Depositional Environments

41
3.7 Lacustrine Reservoir Properties
Lacustrine Depositional Systems
Lacustrine depositional systems evolve in hydrologically closed systems, such as freshwater fed lakes. These lakes may become hypersaline with time because there is no outlet to the sea. They generally have depositional rates higher than open systems. They contain clastic sediments washed into the basin by fluvial (river and stream) systems and flooding, where course material is deposited closer to the sediment source and finer-grained sediment (silt and clay) is deposited in deeper areas of the lakes. They may contain carbonates; evaporites, which form when water is evaporated; and organic material from algae. With little turbulence in the lake, sediments are often horizontally deposited.
A lacustrine formation being deposited in a hydrologically closed system is shown in Figure 3-24. Crusts of evaporite salt form at the edge of an intermittent lake in Saline Valley, California. Red algae bloom near shore and clastic sediments get washed into the basin, with course material settling out first in deltas and fine material covering the deeper areas of the lake bottom. Fine airborne dust contributes to the sediment load as most
Figure 3-23. Namib Desert, Southwest Africa. The Namib Desert Dune Ridge System is an analog for the Triassic Wingate Formation, Uinta Basin, Utah. Interdune facies are represented by the flat areas lateral to the dune ridge. (Eckels, et al., 2005. Photo by E. Tad Nichols – in McKee, 1979.)
Figure 3-24. A Lacustrine Formation Being Deposited in a Hydrologically Closed System. Crust of Evaporite Salts Forms at the Edge of a Lake in Saline Valley, California. (Photo courtesy of Tim Lowenstein, SUNY at Binghamton, March, 2004.)
3.0 Depositional Environments 3.0 Depositional Environments

42
3.8 Basalt Reservoir Properties Igneous rocks represent an uncommon formation type for petroleum reservoirs; however, because of their widespread coverage of the Earth’s surface, they represent a large potential CO2 storage formation. There are two different types of basalts: Mid-Ocean Ridge Basalts (MORB) and Large Igneous Provinces (LIP). More study is needed to evaluate the flow in MORB. Studies of LIP flows show that there is a typical internal structure that consists of four sections: the flow top, the entablature, the colonnade, and the flow base (Figure 3-26). The movement of fluid through a basalt formation is governed by numerous factors. For basalts flows, these factors include: the topographic surfaces over which the basalts originally flowed as lava; the erosion that occurred before, during, and after extrusion of the lava; the deposition of interbeds (sediments and materials that were deposited between lava flows); tectonic activity; and diagenetic processes. The lateral continuity, thickness, and composition of individual flows (particularly interflow zones) are highly varied.
Lacustrine formations had an airborne contribution. In the case of the Green River Formation of the western U.S., volcanic eruptions associated with the building of the Rocky Mountains, deposited enormous volumes of ash that settled out of the air and were also washed downstream and eventually filled the large lakes.
Lacustrine formations have little porosity or permeability and are often considered as seals, rather than CO2 storage formations. Being horizontally bedded, the fluid flow would be anticipated to be parallel to the bedding plane. Changes to the rock and compaction may leave zones that have been or are hydraulic aquifers that have dissolved part of the salts contained within the formation, causing preferential flow paths unrelated to the initial deposition (Choquette and Pray, 1970; Tucker, and Wright, 1990).
Evaporites Depositional System
One subclass of carbonate rocks is represented by evaporite deposition (Dean and Schreiber, 1978). Evaporites can be considered a subset of a lacustrine depositional system and are formed when an aqueous solution is totally or largely evaporated (Figure 3-25). Although some evaporites can be formed in inland lakes, most of the world’s extensive evaporite deposits have been formed from seawater. The fundamental constituents of evaporites are from the ions that were dissolved in the evaporated water. These ions form sodium, calcium, chlorine, sulfate, and carbonate. When evaporation takes place, the salts are deposited in a predictable order that is controlled by the solubility of the salts and the composition of the solution. Evaporites are formed in four different depositional environments: (1) craton/continental crust; (2) shallow epeiric sea; (3) stable continental margin/continental crust; and (4) rifted continental margin/oceanic crust.
Evaporites are often considered a seal for more porous formations. Their ability to slowly flow around and encapsulate materials makes them an ideal storage site for sources of low-level nuclear waste. They have little porosity or permeability.
Figure 3-25. Evaporite Deposits being formed on the Caribbean Island of Bonaire. Shallow water salt pans concentrate hypersaline water, which evaporates to form salt. The white line in the middle of the photo is a froth of salt. (Photo courtesy of Richard Schatzinger, Consultant Carbonate Sedimentologist.)
3.0 Depositional Environments3.0 Depositional Environments

43
Basalts form extremely heterogeneous aquifer units that transmit water most readily through the broken vesicular (old gas bubble pockets) and scoriaceous (material that appears like volcanic cinders). Interflow zones that commonly constitute 5 to 10% of the thickness of an individual basalt flow (Saar and Manga, 1999). Interflow zones represent periods between successive basalt flows where the original material is altered and sediments are deposited. The interflow zones are separated by the less transmissive and more massive entablature and colonnade (Figure 3-26), in which fractures are more or less vertical. Lateral groundwater movement in the entablature and colonnade is probably negligible when compared with the volume of water that moves laterally through the interflow zones.
The potential for geologic storage in basalts also depends on the physical and chemical reactions between the CO2 and the host rock mineralogy (Matter, et al., 2007). Basalt consists mainly of calcium and magnesium silicate minerals that have an ability to neutralize acids. The minerals in basalt can form stable carbonate minerals by reaction with CO2. These chemically stable carbonates can form chemical seals to retain CO2 in the basalt (Matter, et al., 2007; Rochelle, et al., 2004). As a result of this property, basalts have the potential to permanently lock away CO2 by forming stable minerals, but these reactions may take hundreds to thousands of years to occur after CO2 exposure.
Few basalt formations in the United States have been examined. NETL and its partners are still calculating the volume of geologic storage potential in these formations. Much larger areas of basalts underlie today’s oceans and are associated with movement of the Earth’s crust (continental drift). Fluid flow studies within these deep sea formations are in its infancy. Uncertainties remain on the hydrology (study of fluid flow) and the reservoir potential in basaltic formations.
Figure 3-26. Major Internal Features of a Columbia River Basalt Group (North America) Lava Flow. (McGrail, et al., 2006.)
3.0 Depositional Environments 3.0 Depositional Environments

44
4.0 The Road to CommercializationNETL is currently gathering data to develop a database of regional reservoir and associated properties for each type of depositional environment. As mentioned earlier, this data will be utilized by site developers and property owners to develop risk assessments and business models for CCS and to better define costs for geologic storage
and determine the type and quality of geological sinks in a region. It is unlikely that a property owner would spend the necessary money to develop this baseline data that is being provided by NETL even though it is required for a risk assessment or business model of CCS. A list of NETL-developed CO2 projects is shown below according to their geological classifications and lithology (Table 4-1).
Table 4-1. CO2 Geosequestration Projects with Lithology and Geologic Classification.
Basin Location Partnership / Operator
Phase Phase ARRA Program
Principal Target
Formation(s)Lithology Geologic
ClassificationII III
Michigan Michigan MRCSP IIBass Island Dolomite/ Bois Blanc
Carbonate Shallow Shelf Restricted
Cincinnati Arch Kentucky MRCSP II Mt. Simon Clastic Strandplain
Appalachian Ohio MRCSP IIOriskany,
Middle Salina, Clinton
Clastic Shelf Clastic, Shallow Shelf
Restricted, Shelf Clastic
Carbonate
Clastic
Michigan Basin Michigan MRCSP III St. Peter Clastic Sandstone Shelf Clastic
Williston North Dakota PCOR II Fort Union Coal Coal
Williston North Dakota PCOR II
Madison Group, Mission Canyon
Carbonate Shallow Shelf Open
Powder River Basin Montana PCOR III Muddy Clastic Fluvial Deltaic
Alberta Basin British Columbia PCOR III Elk Point
Group Carbonate Barrier Reef Complex
Illinois Illinois MGSC II Cypress Sandstone Clastic Delta Tide
Dominated
Illinois Illinois MGSC II Springfield Coal Coal Coal
Illinois Indiana MGSC II Clore Sandstone Clastic Fluvial Channel
Illinois Kentucky MGSC II Jackson Sandstone Clastic Shelf Clastic
Illinois Illinois MGSC III Mt. Simon Clastic
Strandplain in Upper and
Braided Fluvial in Lower
Gulf Coast Mississippi SECARB II
Tuscaloosa Formation Mississippi
Site
Clastic Delta
Appalachian Virginia SECARB II
Coals in the Pocahontas
and Lee Formations
Coal Coal
4.0 The Road to Commercialization4.0 The Road to Commercialization

45
Basin Location Partnership / Operator
Phase Phase ARRA Program
Principal Target
Formation(s)Lithology Geologic
ClassificationII III
Gulf Coast Mississippi SECARB IITuscaloosa Formation
Cranfield SiteClastic Fluvial
Black Warrior Alabama SECARB II
Black Creek, Marry Lee
& Pratt Coal Seams
Coal Coal
Gulf Coast Mississippi SECARB IIILower
Tuscaloosa Formation
Clastic Fluvial/Deltaic
Gulf Coast Alabama SECARB III Paluxy Formation Clastic Fluvial/Deltaic
Paradox Basin Utah SWP IIDesert Creek
& Ismay Formation
Carbonate Shallow Shelf Restricted
Permian Texas SWP II Cisco-Canyon Carbonate Reef
San Juan New Mexico SWP II Fruitland Coal Coal
Uinta Utah SWP III Entrada & Navaho Clastic Eolian
Colorado Plateau 1 Arizona WESTCARB II Tapeats
Sandstone Sandstone Shelf Clastic
Colorado Plateau 2 Arizona WESTCARB II Naco & Martin Carbonate Shallow Shelf
Restricted
Sacramento Valley 1 California WESTCARB II
Domengine Sandstone Fluvial-deltaic
Hamilton Sandstone Shallow Shelf
Anderson Sandstone Deltaic
Martinez Sandstone Shallow Shelf
Martinez 123 Sandstone Shallow Shelf
Newark New York & New Jersey
Sandia Technologies,
LLCX
Stockton & Passaic Clastic Fluvial & Alluvial
Basalts Basalt Interflow Zones in Basalts
Illinois & Michigan
Illinois & Michigan
University of Illinois X
St. Peter Clastic Strandplain
Knox Carbonate Shallow shelf/open
Ozark Plateau Kansas
University of Kansas Center for Research,
Inc.
X
Arbuckle Carbonate Shallow Shelf
Mississippian chert/
dolomiteCarbonate Metamorposed
Shallow Shelf
4.0 The Road to Commercialization4.0 The Road to Commercialization

46
Basin Location Partnership / Operator
Phase Phase ARRA Program
Principal Target
Formation(s)Lithology Geologic
ClassificationII III
Gulf of Mexico
Miocene AgeTexas University of
Texas at Austin X
Multiple within
Fleming Group
including Lagarto & Oakville
Formations
Clastic
Fluvial-deltaic, Strandplain/Barrier Bar, Turbidite
Los Angeles California Offshore
Terralog Technologies
USA Inc.X
Pico
All Clastic Strandplain, TurbiditePuente
Multiple
Green River Colorado University of Utah X
Weber
All Clastic
Eolian
Dakota Strandplain
Entrada Strandplain / Eolian
Black Warrior Alabama University of Alabama X
Pottsville, Parkwood
& Pride Mountain
Sandstone Deltaic / Strandplain
Bangor & Tuscumbia Limestone Shallow Shelf /
Open
Hartselle Sandstone Strandplain
South Georgia
RiftGeorgia
South Carolina Research
FoundationX
Interflow Zones Basalts
Sandstone and Basalt
Fluvial/Alluvial between the Basalt Flows
Rock Springs Uplift &
Moxa ArchWyoming University of
Wyoming X
Tensleep Sandstone Standplain
Weber Sandstone Eolian
Madison Carbonate Shallow Shelf - Open
Bighorn Carbonate Shallow Shelf
Powder River Wyoming
North American
Power Group, Ltd.
XMadison Carbonate Shallow Shelf -
Open
Bighorn Carbonate Shallow Shelf
Michigan Michigan Board of Public Works X Upper
Mt. Simon Clastic Strandplain/Fluvial
Notes:
1 - The Anderson formation is the primary injection horizon. The other formations are secondary formations.
2 - Site Characterization well.
4.0 The Road to Commercialization4.0 The Road to Commercialization

47
NETL’s goal is to characterize the different depositional environments with drilling, subsurface geophysics, chemical analysis, and geomechanical analysis of the rocks and conduct both small- (<500,000 tons) and large-scale (>1,000,000 tons) CO2 injections. The different storage projects that are completed or underway and their associated major geologic depositional environments/classifications are presented in Table 4-1.
As shown above, NETL is investigating a distribution of the different depositional environments, but additional investigations, including reservoir characterizations and small- and large-scale injection tests, are needed on the majority of the depositional environments. This will provide information on the behavior and flow of CO2 in the different reservoirs that can be used to, in general, predict the behavior and flow in similar depositional environments.
The potential of different storage reservoirs are ranked in accordance to the 1990’s Oil Reservoir Classification methodology (Table 3-1), but differ in significant ways. The 1990’s classification grouped the different reservoirs into classes based on estimates of the largest oil in place strata at that time. The CO2 storage classification
is ranked in accordance to potential storage volume, which is controlled by the porosity and permeability of the reservoir material, frequency, and aerial extent of the different reservoir types.
Referring to the matrix (Figure 4-1), reservoir characterization (with the ability to store >30 million tons of CO2) has not been completed for a shelf clastic, reef, and coal environments. Small-scale injection tests (<500,000 tons of CO2) have not been performed on fluvial deltaic, eolian, and turbidite. Large-scale injection tests (>1,000,000 tons of CO2) have not been performed on deltaic, strandplain, shelf carbonate, eolian, turbidite, basalt Large Igneous Providences (LIP), and coal. Three highly experimental reservoirs that are not included on the matrix are fractured shales, basalts (MOR), and offshore turbidites, as they have not been investigated. The projects listed in Figure 4-1 are in various states of completion with some investigations that are completed and some just started. Understanding the impacts of different reservoir classes on CO2 storage will support DOE’s efforts to develop the knowledge and tools necessary for future commercialization of carbon storage technologies throughout the United States.
4.0 The Road to Commercialization
Matrix of Field Activities in Different Formation Classes
Geologic Formation
Classes
High Potential Medium Potential Lower or Unknown Potential
Deltaic Shelf Clastic
Shelf Carbonate Strandplain Reef Fluvial
Deltaic EolianFluvial
& Aluvial
Turbidite Coal Basalt(LIP)
Large Scale – 1 – – 1 3 – 1 – – –
Small Scale 3 2 4 1 2 – – 2 – 5 1
Characterization 1 – 8 6 – 3 3 2 2 – 1
Notes:The number in the cell is the number of investigations per depositional environment.Large Scale Field Tests – Injection of over 1,000,000 tons of CO2.Small Scale Field Tests – Injection of less than 500,000 tons of CO2.Site Characterization – Characterize the subsurface at a location with the potential to inject at least 30,000,000 tons of CO2.Reservoir potentials were inferred from petroleum industry data and field data from the sequestration program.
Figure 4-1. Matrix of NETL CO2 Geosequestration Projects and Depositional Environments.
4.0 The Road to Commercialization

48
References Section 1 ReferencesBaines, S.J. and R.H. Worden, 2004: Geological Storage of Carbon Dioxide. in Geological Storage of Carbon Dioxide
(eds) S.J. Baines and R.H. Worden, Geological Society of London, Special Publication 233, pp. 1-6.
Blakey, R.C., 2008: Website, http://jan.ucc.nau.edu/~rcb7/ Graphics developed under NSF grant used with permission of Dr. Roland C. Blakey, Northern Arizona University, for educational use.
Cook, P.J., 1999: Sustainability and Nonrenewable Resources. Environmental Geosciences, Vol. 6, No. 4, pp. 185-190.
Cooperative Research Centre of Greenhouse Gas Technologies (CO2CRC), 2010, Image library. Available at: www.co2crc.com.au/imagelibrary/
Department of Energy (DOE), 2008: “Carbon Sequestration Atlas of the United States and Canada”, Second Edition. Available at: http://www.netl.doe.gov/technologies/carbon_seq/refshelf/atlasII/index.html
Fichter, Lynn, S., 2000: Igneous Rock Classification, Metamorphic Rock Classification, and Sedimentary Rock Classification; James Madison University, Harrisburg, VA, See also Introduction to Igneous Rock, Metamorphic Rocks, and Sedimentary Rock Website. http://csmres.jmu.edu/geollab/Fichter.
http://www.netl.doe.gov/energy-analyses/pubs/GIS_CCS_retrofit.pdf.
http://www.netl.doe.gov/technologies/coalpower/index.html.
http://tonto.eia.doe.gov/energyexplained/index.cfm?page=coal_prices.
http://www.eia.doe.gov/cneaf/electricity/epa/epa.pdf.
Olsen, D. K., V. Rawn-Schatzinger, B. J. Felber, and T. R. Carr. “Geologic Depositional Systems for CO2 Geosequestration” Version 1.2 a DVD. DOE/NETL-2009/1334, November 2009.
Sections 2 and 3 ReferencesAhr, W. M., 2008: Geology of Carbonate Reservoirs. John Wiley & Sons, Inc. Hoboken, NJ, 277 pp.
Alfredsson, H.A., B.S. Hardarson, H. Franzson, and S.R. Gislason, 2008: CO2 Sequestration in Basaltic Rock at the Hellisheidei Site in SW Iceland: Stratigraphy and Chemical Composition of the Rocks at the Injection Site. Mineralogical Magazine, Vol. 72, No. 1. pp. 1-5.
Allen, P.A., and Allen, J.R., 2005: Basin Analysis: Principles and Applications. 2nd ed., Malden, MA, Blackwell Pub., p. 549.
Becker, K., and E.E. Davis, 2005: A Review of CORK Designs and Operations During the Ocean Drilling Program. Proceedings, Integrated Ocean Drilling Program 301. College Station, TX. IODP 301.1.4.2005, p. 28.
ReferencesReferences

49
Becker, K., E.E. Davis, F.N. Spiess, and C.P. deMoustier, 2004: Temperature and Video Logs from the Upper Oceanic Crust, Holes 504B and 896C, Costa Rica Rift Flank: Implications for the Permeability of the Upper Oceanic Crust. Earth and Planetary Science Letters. Vol. 222, pp. 881-896.
Bouma, Arnold, H., 2000: Fine-grained, Mud-rich Turbidite Systems; Model and Comparison with Coarse-grained, Sand-rich Systems, in Bouma, A.H., and C.G. Stone, eds., Fine-Grained Turbidite Systems. AAPG Memoir 72/ SEPM Special Publication No. 68, pp. 9-20.
Brown, A, 2003: “Capillary Effects on Fault-Fill Sealing“. AAPG Bulletin; March 2003; v. 87; no . 3; p. 381-395; DOI: 10.1306/08010201127© 2003
Budd, D.A., A.H. Saller, and P.M. Harris, 1995: Unconformities and Porosity in Carbonate Strata. AAPG Memoir 63, Tulsa, OK, 313 pp.
Cant, D.J., 1982: Fluvial Facies Models and their Application, in Sholle, P.A., and D. Spearing, eds., Sandstone Depositional Environments. AAPG Memoir 31, pp. 115-137.
Carr-Crabaugh, M., and T.L. Dunn, 1996: Reservoir Heterogeneity as a Function of
Accumulation and Preservation Dynamics, Tensleep Sandstone, Bighorn and Wind River Basin, Wyoming, in Longman, M.W., and M.D. Sonnenfeld, eds., Paleozoic Systems of the Rocky Mountain Region. Rocky Mountain Section, SEPM (Society for Sedimentary Geology), pp. 305-320.
Choquette, P.W. and L.C. Pray, 1970: Geologic Nomenclature and Classification of Porosity in Sedimentary Carbonates. AAPG Bull. Vol. 54, p. 207-250.
Chidsey, T.C. Jr., 2007: Heterogeneous Shallow-Shelf Carbonate Buildups in the Paradox Basin Utah and Colorado. Targets for Increased Oil Production and Reserves Using Horizontal Drilling Techniques; Final Report, Utah Geological Survey, U. S. 258 pp.
Coffin, M.F. and O. Eldholm, 1994: Large Igneous Provinces: Crustal Structure, Dimensions, and External Consequences. Review of Geophysics., Vol. 32, p. 1-36.
Cole, E.L., M.L. Fowler, S.P. Salamy, P.S. Sarathi, and M.A. Young, 1994: Research Needs for Strandplain/Barrier Island Reservoirs in the United States. U.S. Department of Energy, NIPER/BDM-0054, DE-AC22-94PC91008, Bartlesville Project Office, Bartlesville, OK.
Couples, G.D. 2005: Seals: The Role of Geomechanics. In Evaluating Fault and Cap Rock Seals. (eds) P. Boult and J. Kaldi., AAPG Hedberg Series, No. 2, pp. 87-108.
Davis, E.E., and K. Becker, 1998: Borehole Observatories Record Driving Forces for Hydrothermal Circulation in Young Oceanic Crust. EOS Trans Am Geophysical Union Vol. 79, pp. 369–378.
Dean, W. D. and T. D. Fouch, 1983: Lacustrine Environment: Chapter 2: PART 1 AAPG Special Volume M 33, Carbonate Depositional Environments, pp. 97-116.
Dean, W.E. and B.C. Schreiber, 1978: Marine Evaporites. SEPM Short Course #4, Oklahoma City, OK, SEPM, April 8, 1978, Tulsa, OK, p. 188.
Demicco, R.V. and L.A. Hardie, 1994: Sedimentary Structures and Early Diagenetic Features of Shallow Marine Carbonate Deposits. SEPM Atlas Series No. 1, Soc. Of Economic Paleontologists, Tulsa, OK, 265 pp.
References References

50
DOE/Bartlesville Project Office, 1994: Geological and Production Characteristics of Strandplain/Barrier Island Reservoirs in the United States. U.S. Department of Energy, NIPER/BDM-0027, DE-AC22-94PC91008, Bartlesville Project Office, Bartlesville, OK.
DOE/Bartlesville Project Office, 1993: A Review of Slope-Basin & Basin Clastic Reservoirs in the United States. U.S. Department of Energy, DE-AC22-93BC14964, Bartlesville Project Office, Bartlesville, OK.
Eldholm, O., and M.F. Coffin, 2000: Large Igneous Provinces and Plate Tectonics. In The History and Dynamics of Global Plate Motions. Geophysics. Monogram Ser., (Eds) M. A. Richards, et al. Vol. 121, pp. 309-326.
Ernst, R.E., K.L. Buchan, L.B. Aspler, and T. Barry, 2008: Large Igneous Provinces Commission. Website, http://www.largeigneous20provinces.org, 8pp.
Fisher A.T., 1998: Permeability within Basaltic Oceanic Crust. Review Geophysics, Vol. 36, pp. 143-182.
Fisher, A.T., E.E. Davis, and K. Becker, 2008: Borehole-to-Borehole Hydrologic Response across 2.4 km in the Upper Oceanic Crust: Implications for Crustal-Scale Properties. J. Geophysical Research, Vol. 113, B07106, p. 15.
Fowler, M. L., V. Rawn-Schatzinger, S.P. Salamy, M.A. Young, S.R. Jackson, E.L. Cole, M. P. Madden, and P. Sarathi, 1995: Reservoir Characteristics, Production Characteristics, and Research Needs for Fluvial/Alluvial Reservoirs in the United States. U.S. Department of Energy, NIPER/BDM-0133, DE-AC22-94PC91008, Bartlesville Project Office, Bartlesville, OK, p. 213.
Frazier, D. E., 1967. Delta Complexes of Mississippi River, Their Development and Chronology. Gulf Coast Association of Geological Societies Transactions, Vol. 27, p. 287-315.
Goldberg, D., and A.L. Slagle, 2009: A Global Assessment of Deep-Sea Basalt Sites for Carbon Sequestration. Presented at Greenhouse Gas Technologies—GHGT-9, October 2008, Energy Procedia (2009) pp. 3675-3682.
Goldberg, D., T. Takahashi, and A.L. Slagle, 2008: Carbon Dioxide Sequestration in Deep-Sea Basalts. Proceeding of National Academy of Science, Vol.105, No. 29, pp. 9920-9925.
Grunau, H.R., 1987: A Worldwide Look at the Cap Rock Problem. Journal of Petroleum Geology, 10, pp. 245-266.
Hayes, M.O., 1989: Modern Clastic Depositional Environment. South Carolina, 28th International Geologic Congress, Charleston, SC, July 20-25, 1989. International Ocean Drilling Program, 2008: Reports accessible at: www.iodp.org.
Jones, M.A., and J.J. Vaccaro, 2008: Extent and Depth to Top of Basalt and Interbed Hydrogeologic Units, Yakima River Basin Aquifer System, Washington. USGS Scientific Investigations Report 2008–5045, 128 pp.
Kinzler, R.J., and T.L. Grove, 1992a: Primary Magmas of Mid-Ocean Ridge Basalts, 1, Experiments and Methods. J. Geophysical Research, Vol. 97, pp. 6885-6906.
Kinzler, R.J., and T.L. Grove, 1992b: Primary Magmas of Mid-Ocean Ridge Basalts, 2, Applications. J. Geophysical Research, Vol. 97, pp. 6907-6926.
LaBlanc, R. J., 1972: Geometry of Sandstone Reservoir Bodies, Underground Waste Management and Environmental Implications, AAPG Memoir 18, pp. 133-190.
Leopold, L.B. and M.G. Wolman, 1957: River Channel Patterns: Braided, Meandering, and Straight. USGS Professional Paper 282-B, p. 47.
ReferencesReferences

51
Link, P.K., 1982: Basic Petroleum Geology. Tulsa, OK, Oil and Gas Consultants International, Inc., p. 425.
Manga, M., 1997: A Model for Discharge in Spring-Dominated Streams and Implications for the Transmissivity and Recharge of Quaternary Volcanics in the Oregon Cascades. Water Resources Research, Vol. 33, pp.1813-1822.
Matter, J.M., T. Takahashi, and D. Goldberg, 2007: Experimental evaluation of in situ CO2-water-rock reactions during CO2 injection in basaltic rocks: Implications for geological CO2 sequestration. G3 Geochemistry Geophysics Geosystems, Vol. 8, No. 2. pp. 1-19.
Matter, J. M., W.S. Broecker, M. Stute, S.R. Gislason, E.H. Oelkers, A. Stefánsson, D. Wolff-Boenisch, E. Gunnlaugsson, G. Axelsson, and G. Björnsson, 2009: Permanent Carbon Dioxide Storage into Basalt: The CarbFix Pilot Project, Iceland. Presented at Green House Gas Technologies—GHGT-9, October 2008, Energy Procedia (2009) pp. 3641-3646.
McCubbin, D.G., 1982: Barrier Island and Strand-Plain Facies. in P.A. Scholle, and D. Spearing, eds., pp. 247-279., Sandstone Depositional Environments: American Association of Petroleum Geologists Memoir No. 31, American Association of Petroleum Geologists, Tulsa, OK.
McGrail, B.P., H.T. Schaef, A.M. Ho, Y.-J. Chien, J.J. Dooley, and C.L. Davidson, 2006: Potential for Carbon Dioxide Sequestration in Flood Basalts. Journal of Geophysical Research, Vol. 111, B12201, pp. 1-13.
McGrail, B.P, E. C. Sullivan, F. A. Spane, D. H. Bacon, G. Hund, P. D. Thorne, C. J. Thompson, S. P. Reidel and F. S. Colwell, 2009: Preliminary Hydrological Characterization Results from the Wallula Basalt Pilot Study. Battelle Pacific Northwest Division, PNWD-4129.
Neuendorf, K. K. E, J. P. Mehl, Jr, and J. A. Jackson, 2005: Glossary of Geology (Fifth Edition). American Geological Institute, Alexandria, VA, 779 pp.
Nuckols, E. B., 1992: Review of Shallow-Shelf Carbonate Reservoirs in the United States. U.S. Department of Energy, DE-AC22-91BC14839, ICF Resources Incorporated, Metairie Site Office, New Orleans, LA.
Nuri, Roy D., 1978: Use of Well Logs in Evaporite Sequences, in Dean, W. E. and B. C. Schreiber, eds., Marine Evaporites. SEPM Short Course #4, OK City, OK, SEPM, April 8, 1978, Tulsa, OK, p. 144-176.
Olariu, C, and J. P. Bhattacharya, 2006. Terminal Distributary Channels and Delta Front Architecture of River-Dominated Delta Systems. J. Sedimentary Research, Vol. 76, p.212-233.
Olsen, D. K. and W. I. Johnson. “Feasibility Study of Heavy Oil Recovery in the Midcontinent Region (Kansas, Missouri, Oklahoma),” DOE Report NIPER-560, April 1993.
Olsen, D. K. and W. I. Johnson. “Feasibility Study of Heavy-Oil Recovery in the Midcontinent Region (Oklahoma, Kansas, Missouri).” Proceedings of a symposium held March 26-27, 1991, in Norman, OK, Oklahoma Geological Survey Circular 95, 1993, pp. 163-172.
Opportunities to Improve Oil Production in Unstructured Deltaic Reservoirs, technical Summary and Proceedings of the Technical Symposium, DOE.
Pratson, L.F.J. Imran, G. Parker, J.P.M. Syvitske, and E. Hutton, 2000: Debris Flows vs. Turbidity Currents: a Modeling Comparison of their Dynamics and Deposits, in A.H. Bouma and C.G. Stone, eds., Fine-Grained Turbidite Systems. AAPG Memoir 72/ SEPM Special Publication No. 68, pp. 57-72.
References References

52
Rawn-Schatzinger, V., and D. Lawson, 1994: Comparison of Shoreline Barrier Island Deposits from Wyoming, California, and Texas. U.S. Department of Energy, NIPER/BDM-0066, DE-AC22-94BC91008, Bartlesville Project Office, Bartlesville, OK, p. 60.
Read, F., and T. Smith, 2005: Basic Carbonate Geology. A One-Day Course for Geologists and Engineers, Petroleum Technology Transfer Council and Pittsburgh Association of Petroleum Geologists, West Virginia University, Morgantown, WV.
Reineck, H.E., and I.B. Singh, 1975: Depositional Sedimentary Environments. Springer-Verlag, New York, Heidelberg, Berlin, p. 439.
Reineck, H.E., and I.B. Singh, 1980: Depositional Sedimentary Environments with References to Terrigenous Clastics. Springer-Verlag, New York, Heidelberg, Berlin, 549 pp.
Rochelle, C.A., I. Czernichowski-Lauriol, and A.E. Milodowski, 2004: The Impact of chemical reactions on CO2 storage in geological formations: a brief review. In Geological Storage of Carbon Dioxide, (eds) S. J. Baines and R. H. Worden, Geological Society of London, Special Publication 233, pp. 87-106.
Saar, M.O., and M. Manga, 1999: Permeability-Porosity Relationship in Vesicular Basalts. Geophysical Research Letters, Vol. 26, No. 1. pp. 111-114.
Saunders, A.D., 2005: Large Igneous Provinces: Origin and Environmental Consequences, Elements, Vol. 1, pp. 259-263.
Sedimentary Petrology an introduction to the origin of sedimentary rocks Second edition, Blackwell Scientific Publications pg 75
Sherman, D.J., 1978: Evaporites of Coastal Sabkhas, in Dean, W. E. and B. C. Schreiber, eds., Marine Evaporites. SEPM Short Course #4, OK City, OK, SEPM, April 8, 1978, Tulsa, OK, p. 6-20.
Smith D.K., and J.R. Cann, 1998: Mid-Atlantic Ridge Volcanic Processes—How Erupting Lava Forms Earth’s Anatomy. Oceanus, March 1998.
Spinelli, G.A. A.L. Zühlsdorff, A.T. Fisher, C.G. Wheat, M. Mottl, V. Spieß, and E.R. Giambalvo, 2004: Hydrothermal Seepage Patterns above a Buried Basement Ridge, Eastern Flank of the Juan de Fuca Ridge. J. Geophysical Research, Vol. 109, B10012, pp. 19.
Steinkampf, W.C, 1989: Water-Quality Characteristics of the Columbia Plateau Regional Aquifer System in parts of Washington, Oregon, and Idaho. USGS Water-Resources Investigations Report 87-4242, 32 pp.
Steinkampf, W.C.and P.P. Hearn, Jr., 1996: Ground-Water Geochemistry of the Columbia Plateau Aquifer System, Washington, Oregon, and Idaho. USGS Open-File Report 95-467, 67 pp.
Steinkampf, W.C.; Bortleson, G.C.; Packard, F.A., 1985: Controls on Ground-Water Chemistry in the Horse Heaven Hills, South-Central Washington. USGS Water-Resources Investigations Report 85-4048. 26 pp.
Stelting, C. F., A. H. Bouma and C. G. Stone, 2000: Fine–Grained Turbidite Systems: Overview, in Bouma, A.H., and C.G. Stone, eds., Fine-Grained Turbidite Systems. AAPG Memoir 72/ SEPM Special Publication No. 68, pp. 1-8.
Tissot, B.P. and D.H. Welte, 1978: Petroleum Formation and Occurrence. Springer-Verlag, Berlin, Heidelberg, New York, 538 pp.
ReferencesReferences

53
Tucker, M.E. and V.P. Wright, 1990: Carbonate Sedimentology. Blackwell Scientific
Publications, Oxford and London, p. 482.
Undershultz, J., 2007: Hydrodynamics and membrane seal capacity. GeoFluids, Vol. 7, No. 2, pp. 148-158.
Vaccaro, J.J. M.A. Jones, D.M. Ely, M.E. Keys, T.D. Olsen, W.B. Welch, and S.E. Cox, 2009: Hydrogeologic Framework of the Yakima River Basin Aquifer System, Washington. USGS Scientific Investigations Report 2009-5152.
Watts, N.L. 1987: Theoretical aspects of cap-rock and fault seals for single- and two-phase hydrocarbon columns. Marine and Petroleum Geology, Vol. 4, pp. 274-307.
Watts, N.L. 1987: Theoretical aspects of cap-rock and fault seals for single- and two-phase hydrocarbon columns. Marine and Petroleum Geology, Vol. 4, pp. 274-307.
Whiteman, K.J., J.J. Vaccaro, J.B. Gonthier, and H.H. Bauer, 1994: The Hydrogeologic Framework and Geochemistry of the Columbia Plateau Aquifer System, Washington, Oregon, and Idaho, USGS Professional Paper 1413-B, p. B31.
Wikipedia, Large Igneous Province, 2008: Website, Wikipedia.org/wiki/Large_igneous-province, 4 pp.
Section 4 ReferencesAyers, W.B., 2002: Coalbed Gas Systems, Resources and Production and a Review of Contrasting Cases from the San Juan
and Powder River Basins, AAPG Bulletin Vol. 86, No. 11, pp 1853-1890.
Bethke, C.M., 2002: The Geochemist’s Workbench—A User’s Guide to Rxn, Act2, Tact, React, and Gtplot; 4.0 ed.; University of Illinois: Urbana, IL..
Bowers, T.S., and H. C. Helgeson, 1983: Calculation of the Thermodynamic and Geochemical Consequences of Nonideal Mixing in the System H2O-CO2-NaCl on Phase Relations in Geologic Systems: Equation of State for H2O-CO2-NaCl Fluids at High Pressures and Temperatures, Geochim. Cosmochim. Acta, Vol. 47, pp. 1247-75.
Dallegge, T. A. and C. E. Barker, 2009: Coal-Bed Methane Gas-In-Place Resource Estimates Using Sorption Isotherms and Burial History Reconstruction: An Example from the Ferron Sandstone Member of the Mancos Shale, Utah. USGS Professional Paper 1625–B.
EIA, 2008; U.S. DOE Energy Information Administration U.S. Natural Gas Storage Fields http://www.eia.doe.gov/pub/oil_gas/natural_gas/analysis_publications/ngpipeline/undrgrnd_storage.html.
EIA, 2010: U.S. DOE Energy Information Administration http://tonto.eia.doe.gov/oog/info/ngw/ngupdate.asp.
Freund, P., S. Bachu, D. Simbeck, K. K. Thambimuthu and M. Gupta, 2007: Annex I, Properties of CO2 and Carbon Based Fuels, IPCC Special Report on Carbon Dioxide Capture and Storage, pp. 383-400.
Geologic Storage of Carbon Dioxide Staying Safely Underground, IEA Greenhouse Gas R&D Program
http://www.eia.doe.gov/cneaf/electricity/epa/epa.pdf
http://www.globalurban.org/Environmental%20and%20Energy%20Study%20Institute%20Fact%20Sheet%20on%20Jobs%20from%20Renewable%20Energy%20and%20Energy%20Efficiency.pdf
References References

54
http://www.netl.doe.gov/energy-analyses/pubs/GIS_CCS_retrofit.pdf
http://www.netl.doe.gov/technologies/coalpower/index.html
http://tonto.eia.doe.gov/energyexplained/index.cfm?page=coal_prices
Jarrell, P. C. Fox, M. Stein, and S. Webb, 2002: Practical Aspects of CO2 Flooding, SPE Monograph 22, 212 pp.
Price, Michael, George Allen & Unwin (publishers), Introducing Groundwater, 1985, pg 162.
Prutton, C. F. and R. L. Savage, 1945: The Solubility of Carbon Dioxide in Calcium Chloride-Water Solutions at 75, 100, 120° and High Pressures; J. Am. Chem. Soc. Vol. 67, p.1550-1554.
Reeves, S. R., 2001: Geologic Sequestration of CO2 in Deep, Unmineable Coalbeds: An Integrated Research and Commercial-Scale Field Demonstration Project, SPE 71749, presented at SPE Annual Technical Conference and Exhibition, New Orleans, LA, 10 pp.
Reeves, S. and A. Oudinot, 2005, The Allison Unit CO2-ECBM Pilot- A Reservoir and Economic Analysis. 2005 International Coalbed Methane Symposium, Paper 0522, 16 pp.
Stalkup, F. I., 1983: Miscible Displacements. Monograph 8, Society of Petroleum Engineers, AIME, N.Y.
Tremain, C.M., Laubach, S.E., and Whitehead, N.H,.III., 1994: Fracture (cleat) Patterns in Upper Cretaceous Fruitland Formation Coal Seams, San Juan Basin, in Coalbed Methane in the Upper Cretaceous Fruitland Formation, San Juan Basin, New Mexico and Colorado. Ayers, W.B., and Kaiser, W.R., eds. New Mexico Bureau of Mines and Mineral Resources Bulletin 146, p. 87-102.
U.S. Oil Production Potential From Accelerated Deployment of Carbon Capture and Storage, March 10, 2010 White Paper Advanced Resources International, Inc.
USGS, 2008: PHREEQC (Version 2.15) - A Computer Program for Speciation, Batch-Reaction, One-Dimensional Transport, and Inverse Geochemical Calculations. February 2008, available at: http://wwwbrr.cr.usgs.gov/projects/GWC_coupled/phreeqc/.
Wiebe, R.and V. L. Gaddy, 1939: The Solubility in Water of Carbon Dioxide at 50, 75 and 100o, at Pressures to 700 Atmospheres; J. American Chemical Soc. Vol. 61, p. 315-318.
Wiebe, R. and V. L. Gaddy, 1940: The Solubility of Carbon Dioxide in Water at Various Temperatures from 12 to 40o and at Pressures to 500 Atmospheres. Critical Phenomena; J. American Chemical. Soc. Vol. 62, p. 815-817.
ReferencesReferences

NETL Contacts
Brian Dressel, P.G.
Physical Scientist
Sequestration Division
Bruce Brown, P.G.
Physical Scientist
Sequestration Division
John Litynski, P.E.
Carbon Sequestration Division Director
Strategic Center for Coal
Sean Plasynski, PhD
Sequestration Technology Manager
Strategic Center for Coal
Document Prepared by:
Brian Dressel – Sequestration Division
Dr. David Olsen – IBM NISC

3610 Collins Ferry Road P.O. Box 880
Morgantown, WV 26507-0880 304-285-4764
2175 University Avenue South, Suite 201
Fairbanks, AK 99709 907-452-2559
1450 Queen Avenue SW Albany, OR 97321-2198
541-967-5892
September 2010
626 Cochrans Mill Road P.O. Box 10940
Pittsburgh, PA 15236-0940 412-386-4687
13131 Dairy Ashford, Suite 225
Sugar Land, TX 77478 281-494-2516
WEBSITE: www.netl.doe.gov
CUSTOMER SERVICE: 1-800-553-7681