geographies of knowledge sourcing and the value of
TRANSCRIPT
http://peeg.wordpress.com
Geographies of Knowledge Sourcing
and the Value of Knowledge in Multilocational Firms
Anthony Frigon & David L. Rigby
Papers in Evolutionary Economic Geography
# 21.32

Geographies of Knowledge Sourcing and the Value of Knowledge in Multilocational Firms
Anthony Frigon1 and David L. Rigby2 Abstract A growing body of research in economic geography, international business management and related fields focuses on geographies of knowledge sourcing. This work examines the organizational structure of innovation activities within the firm, the mechanisms by which knowledge is extracted from various external sources and the geography of these different activities. We augment this literature by exploring knowledge sourcing within multilocational firms operating in the US using a unique dataset matching patent records to firm-level ownership and geographical data. The results add value to existing research in three ways. First, the establishments of multilocational corporations are shown to produce different kinds of knowledge in different locations. Second, the patents generated within a firm’s establishments are linked to the knowledge stocks of the cities where they operate, supporting a vision of geographical knowledge sourcing. Third, the complexity of knowledge produced within the firm as a whole is positively related to the number of establishments in which multilocational firms undertake innovation activities. In sum these data suggest that multilocational firms distribute their innovation activities across locations in order to secure access to local pools of tacit knowledge. The complexity value of firms’ knowledge production is enhanced as a result of this spatial strategy.
1 Department of International Business, HEC Montréal 2 Department of Geography, UCLA

1. Introduction Exploiting spatial variations in markets and in the quality and availability of factors of production remain critical to competition in the modern global economy. While classical perspectives in international economics and management view the geographical diversification of firms on the basis of market adaptation and access to productive capital, modern theories of international business dedicate considerable attention to the exploitation of localized sources of knowledge as the basis for competitive advantage (Cantwell, 2017; Papanastassiou et al., 2020). Combined, these perspectives regard the locational portfolio of the multilocational firm as a major source of heterogeneity in the economy, as each organization manages its value chain in a distinctive fashion with a mix of market, cost-reducing, and knowledge-seeking motives (Yeung, 2018). Within international business research, the geographical structure of multilocational firms has predominantly been assessed at the international level (Beugelsdijk and Mudambi, 2014). However, as argued by Mudambi et al. (2018), the locational patterns of different value chain segments have to be understood at different geographical scales. Downstream processes related to market access and distribution should be assessed at a broader geographical scale for the motivations underlying these activities tend to have a global reach. Conversely, knowledge-intensive activities operate at a smaller spatial scale, as firms seek to access localized sources of knowledge that are locked among the agents of particular subnational regions. While it is acknowledged that more attention should be given to inter-regional (subnational) knowledge sourcing and innovation strategies within multilocational firms, empirical research has remained somewhat limited (Iammarino and McCann, 2013; Mudambi et al., 2018). In parallel, the literature in economic geography has by now gathered robust evidence that subnational regions vary in terms of the composition of their knowledge stocks and the character of their knowledge bases (Rigby and Essletzbichler, 1997; Asheim and Gertler, 2005; Martin and Moodysson, 2011; Kogler et al., 2013), in terms of the trajectories of knowledge diversification (Boschma et al., 2015; Rigby 2015), and in the character of their innovation systems (Lundvall and Johnson 1994; Isaksen and Trippl, 2017). Furthermore, a rich contemporary debate on local versus non-local forms of knowledge sourcing and different mechanisms of knowledge flow is adding much to the field (Bathelt et al., 2004; Storper and Venables, 2004; Trippl et al., 2009; Tödtling et al., 2013; Fitjar and Rodriguez-Pose, 2014). Unlike the literature in management, however, this research tends to treat organizations as fixed in space, accessing various sources of knowledge from a unique establishment. Greater integration of these perspectives would surely contribute to furthering our understanding of the spatial organization of knowledge sourcing and innovation activities within multilocational firms. With the most valuable forms of complex and tacit knowledge trapped in particular places (Sorenson et al., 2006; Balland and Rigby, 2017), the ability of firms to tap into multiple localized sources of knowledge represents a significant opportunity to expand the possibilities for knowledge recombination and technological development. Although the mechanisms for accessing knowledge are many, it is clear that multilocational firms have broader sets of opportunities for knowledge extraction than single-plant firms (Dunning, 1988; Cantwell, 1989). However, it remains unclear how multilocational firms operate within a variegated landscape of

knowledge opportunities and whether they are able to take advantage of their organizational structure. This paper engages with these issues and asks three specific research questions: 1) Do multilocational firms produce different technologies within the plants that they operate? 2) Does the knowledge developed within specific establishments of multilocational firms reflect the broader knowledge stocks of the cities or regions in which they are located? 3) Do multilocational firms that source knowledge from different locations produce more valuable knowledge, on average? We make a series of contributions to work in economic geography and management in this study. First, the literature on multilocational knowledge sourcing has predominantly looked at competence creation (e.g. Phene and Tallman, 2018; Qiu and Cantwell, 2018) or external knowledge sourcing (e.g. Berry and Kaul, 2015; Berry, 2018) in affiliates, without directly testing whether the overall technological portfolio of organizations differs meaningfully across space. In this article, patent records linked to ownership and geographical data for firms operating in the United States are used to test whether the character of knowledge production varies between the establishments of multilocational organizations. Our data covers all organizations that have innovation activities in more than one location within the US, regardless of whether they are additionally engaged in cross-border operations or not. Although multinationals and multiplant domestic firms differ in many respects (Iammarino and McCann, 2013), there are no strong reasons to believe that their knowledge sourcing strategies within the same national context would diverge in meaningful ways. This motivates our use of the more general term ‘multilocational firms’ in this paper. Using permutational multivariate analysis of variance statistics, results indicate that more than 50 percent of the firms investigated produce technologies that differ across the locations in which they operate. This share increases to over 90 percent as the number of establishments within firms exceeds 10. Second, we show that the patents generated within the establishments of multilocational organizations reflect the broader technological character of the metropolitan areas in which they are located. This adds to the body of evidence that multi-unit firms strategically locate their plants in order to access place-specific stocks of knowledge. Third, we revisit previous claims that multilocational knowledge sourcing does not significantly impact the quality of innovative output (Singh, 2008; Scalera et al. 2018; though see also Phene and Almeida, 2008 and Lahiri, 2010). Our first set of results are consistent with those of Singh (2008), indicating that the number of locations across which a firm is active is negatively correlated with forward citations on patents, a standard measure of patent quality. We argue, however, that forward citations may not fully capture the production of knowledge that is more tacit, which would theoretically be of greater value to the firm. Using a measure of knowledge complexity, we find a significant and positive relationship between the geographical dispersion of innovation activities and the complexity of patents produced by firms. Multilocational organizations are seemingly able to exploit specialized local knowledge stocks and successfully integrate the ideas that they mine from different locations to generate competitive advantages in terms of the complexity of knowledge produced. The rest of this paper is divided into 4 sections. Section 2 reviews the literatures on geographies of knowledge sourcing within economic geography and international business. In Section 3 the source data on which the empirical analysis is based is documented and a series of descriptive
statistics presented. Section 4 presents the empirical analysis of the core research questions and Section 5 provides a brief conclusion. 2. Literature Review For many firms and regions within the contemporary market economy, competitive advantage increasingly rests on the production of non-ubiquitous, tacit knowledge (Maskell and Malmberg, 1999; Asheim and Gertler, 2005). Within the firm, knowledge mainly originates from processes of research and development (Pavitt, 1991) and learning (Arrow, 1971). For Von Hippel (1988) and Chesborough (2003), technological knowledge is also acquired outside the firm through market-based interaction, formal and informal exchanges and learning from others. Cohen and Levinthal (1990) lay the foundations of firm knowledge development within the intersection of internal and external knowledge sources. There is growing evidence that the knowledge produced in particular places, within or between firms and other organizations, is not easily moved (Jaffe et al., 1993; Audretsch and Feldman, 1996; Sonn and Storper, 2008), especially that which is complex (Sorenson et al., 2006; Balland and Rigby, 2017). The result is a geographical knowledge landscape that is highly uneven, a low-level surface of widely available codified knowledge interspersed by jagged peaks representing concentrations of complex and tacit knowledge that are broadly aligned with larger cities (Balland et al., 2020). With new technological development viewed as a process of recombination (Weitzman, 1998; Fleming and Sorenson, 2001), the spatial concentration of valuable knowledge is likely to persist, so long as centers of knowledge production maintain sufficient technological heterogeneity. At this time, it is relatively clear that different sites of innovation produce different sets of knowledge (Rigby and Essletzbichler 1997; 2006; Kogler et al., 2013), influenced by the heterogeneous combinations of economic actors and their networks, by their industrial histories and by the place-based evolution of institutions and capabilities. To varying degrees, these arguments sustain a long literature within economic geography from Marshall’s (1890) agglomerations and Porter’s (1990, 1998) clusters, to the industrial districts and milieu of Brusco (1986), Beccatini (1990) and Camagni (1991), through to learning regions (Lundvall and Johnson 1994; Morgan, 2007). The takeaway from much of this literature is that firms and other economic agents who are part of an innovative cluster are advantaged in ways that outsiders are not. ‘Being there’, as Gertler (2003) notes, smoothes the sharing of ideas, whether they are generated by ‘local buzz’ (Storper and Venables, 2004), or delivered in the form of spillovers, through worker mobility (Almeida and Kogut, 1999) or more formal collaboration. For Saxenian (1994) and Storper (1997), following Brown and Duguid (1991), place-specific communities of practice and institutional development foster collective learning (Lawson and Lorenz, 1999) and shared capabilities that evolve relatively slowly. More recent work challenges the primacy of the local in tacit knowledge exchange (Bathelt et al., 2004). Increasing levels of local and non-local interaction, in the form of ‘buzz and pipelines’, is argued to raise innovation, though Esposito and Rigby (2019) show that there is not a monotonic relationship between interaction and innovation. Related questions about the importance of geographical proximity are raised by Boschma (2005), extending the claims of Breschi and Lissoni (2001) and Torre and Rallet (2005) to ask how different forms of proximity complement or

substitute for one another. In empirical tests of a subset of these claims, Owen-Smith and Powell (2004) and Whittington et al. (2009) explore the extent to which network forms of proximity obviate the need for geographical clustering. To our mind, the answers to these questions remain unresolved, at least in part, because of the endogeneity that plagues separation of spatial propinquity and network formation. That access to external knowledge plays a central role in firm innovation is the foundation for a vibrant literature in economic geography on knowledge sourcing. Combining arguments from the regional innovation systems literature (Asheim and Gertler, 2005) and from knowledge-base ideas (Asheim and Coenen, 2005 and Martin and Moodysson, 2011), this work explores how firms acquire external knowledge, focusing on the sources of that knowledge, the mechanisms through which it is obtained and the geographical scale at which those mechanisms operate (Tödtling et al., 2006; Trippl et al. 2009; Grillitsch and Trippl, 2014; Isaksen and Trippl, 2017). Across a relatively large number of case studies, results illustrate the heterogeneity of knowledge sourcing practices and their combination, and the varying geographical levels at which they take place. Fitjar and Rodriguez-Pose (2014) extend these debates in a relatively large survey linking different forms of interaction and innovation across firms in Norway. They push beyond the buzz and pipeline distinction to examine how different forms of interaction are related to one another and how modes of interaction are influenced by firm characteristics. The knowledge sourcing literature within economic geography is very much focused upon the acquisition of external knowledge by firms that are considered, at least implicitly, fixed in space. This literature says relatively little about how the structure of the firm might evolve to exploit the geography of technological heterogeneity, and how certain forms of external knowledge might be captured within the firm. A relatively large literature in international business and management explores how multilocational firms (typically those operating across national borders) can embed themselves within different innovative regions, gathering, generating and spilling new technological information at multiple spatial scales simultaneously. In a series of papers, Cantwell and Piscitello (1999, 2000) discuss how geographical and technological diversification within large firms, primarily multinational enterprises (MNEs), were initially viewed as substitute growth strategies. This changed with the broad acceptance of the resource-based model of the firm and a vision of the MNE as an organization that diversifies over space both as a way of exploiting markets and as a way of integrating knowledge gathered across geographically dispersed units (Ghoshal and Bartlett, 1988). Multilocational knowledge sourcing strategies are being adopted by an increasing number of organizations, extending the number of locations in which they carry out high value-added activity (Mudambi, 2008; Dunning, 2013; Forsgren, 2017). These locations are target rich in the sense that they tend to be relatively dense clusters of knowledge production (Berry, 2015; Li and Bathelt, 2018) with high potential for agglomeration externalities (Alcacer and Chung, 2014; Jindra et al., 2016). They are often well-connected global city-regions (Goerzen et al. 2013; Iammarino and McCann, 2013; Castellani et al., 2021). This ability to embed themselves within multiple knowledge environments is what provides multilocational firms an advantage over single-plant units. Embedding within local agglomerations of knowledge producers facilitates the creation of social bonds, trust, and shared

institutional norms that can raise the quantity and quality of interaction (Brown and Duguid, 1996; Storper, 1997; Lawson and Lorenz, 1999; and for the case of MNEs see Cantwell and Iammarino, 2005). At the same time, co-location rather than collaboration with non-local partners is crucial for the serendipitous capture of local buzz and for the appropriation of tacit knowledge (Gertler, 2003; Maskell and Malmberg, 1999; Storper and Venables, 2004). While operating within their respective knowledge environments, the units of the multilocational firm are also embedded in the corporate network, inheriting a set of routines, norms and values that maintain a certain level of coherence across the different activities of the firm, in turn facilitating knowledge flows within the corporate network (Mudambi et al., 2014). The resulting structure of the multilocational firm is thus one of multiple embeddedness (Figueiredo, 2011; Meyer et al., 2011), where the firm can source knowledge from multiple locations and at the same time facilitate inter-unit knowledge flows through various intraorganizational channels (Nohria and Ghoshal, 1997; Forsgren, 2017). Multilocational knowledge sourcing can therefore expand the possibilities for recombinant innovation (Dunning, 1988; Cantwell, 1989) while also lowering the risk of core technological knowledge appropriation by sequestering different subsets of a firm’s knowledge assets in different locations (Alcacer and Zhao, 2012; Kramer and Revilla Diez, 2012; Wang and Zhao, 2018). It is important to note, however, that not all establishments within the firm will fulfill the same role. The activities of subunits can be categorized in two different types: competence-exploiting units, which serve diverse markets with the core technological knowledge of the main firm, and competence-creating units, which gather and develop knowledge that is further absorbed and integrated within the multilocational organization (Cantwell and Piscitello, 2000, Cantwell and Mudambi 2005, and Mudambi et al. 2014). For Nohria and Ghoshal (1997), the mandate assigned to a given subunit will be contingent upon the resources and capabilities of the unit, the nature of the host environment, and the global strategy of the firm. Empirical research on this issue has shown that a higher degree of autonomy is positively associated with the development of innovation capabilities in subunits (Cantwell and Piscitello, 2015; Belderbos et al., 2015; Berry, 2015; Qiu and Cantwell, 2018). External networks within the host location were also shown to impact innovation (Almeida and Phene, 2004, 2008; Song et al., 2011; Iammarino et al., 2012; Berry, 2018; Phene and Tallman, 2018). For Cantwell and Mudambi (2005) this has meant a flattening of the organizational structure of multilocational firm, granting affiliates more flexibility to engage in entrepreneurial activities that raise the competence of the firm as a whole (Birkinshaw, 1997). While the literature on innovation activities at the subunit level has grown rapidly, important questions remain with regards to the level of technological differentiation across the firm’s locations and whether a multilocational knowledge sourcing strategy truly enhances the innovation performance of the corporation as a whole. Partly addressing these issues, Frost (2001) reveals that the subsidiaries of foreign firms do generate distinctive technological capabilities linked to local sources of knowledge. In his conclusion, Frost (2001) asks how multilocational firms as a whole can leverage external knowledge into proprietary technology and generate competitive advantage. For Singh (2008), the answer is related to the geographical dispersion of MNE knowledge sourcing practices and the ability of the firm to successfully integrate diverse knowledge sets. However, in a broad study of MNEs operating in different sectors and countries, Singh (2008) reports a negative relationship between the geographical dispersion of a firm’s R&D activities and the average value

of firm patents. He attributes this to the difficulty of integrating knowledge sourced from different countries. Lahiri (2010), Lecocq et al. (2012), and Scalera et al. (2018) report inverted U-shaped relationships between the geographical scope of R&D and innovation quality. They note that distributed R&D expands knowledge collection, but that the cost of search rises rapidly as the number of innovating units in the firm increases. Lahiri (2010) also explores linkages between the units of the multiplant firm that encourage knowledge sourced in one location to be used elsewhere. Using firm-level data on R&D in Finland, Leiponen and Helfat (2010) show that firms with multiple R&D locations outperform those with single sites of R&D in terms of innovative output. However, this finding is limited to imitative forms of innovation. More work is required to understand the ambiguity in these results. In this paper we focus on multilocational firms operating in the US. Some of these firms are multinational enterprises, but not all. At this time, investigation of knowledge sourcing by multilocational firms within a single country remains relatively rare. We explore whether these firms generate different kinds of knowledge across the locations in which they engage in innovation activities. We further link the knowledge they produce within their plants to the broader knowledge communities in which they operate. Finally, we ask whether and how these firms benefit from a spatially distributed pattern of R&D. 3. Data Construction and Descriptive Statistics Innovation activity in multilocational firms is explored using patent records from the United States Patent and Trademark Office (USPTO) and Orbis data. The Orbis data track connections between firms and establishments linked by ownership, while USPTO patent data are used to capture the structure of technology developed within firms and cities. Granted utility patents are the focus of the analysis, disaggregated into 652 classes of the Cooperative Patent Classification (CPC). Patent ownership is indicated by assignee information. While the USPTO makes available disambiguated assignee information through the PatentsView website, qualitative analysis of organization names revealed some duplicates due to slight differences in the name or variations in the assignee’s corporate identifier (e.g. Corp., Inc., Co.). Thus, assignee names were further disambiguated through fuzzy matching using the Jaro-Wingler algorithm from the package ‘stringdist’ in R. To determine the location of an invention, researchers generally use the address of the inventors rather than the assignee, since the latter often records the location of the headquarters or the intellectual property department of a multilocational organization instead of the site of invention. USPTO records do not provide any information allowing a direct link between the affiliation of inventors and an organization’s subunits. This is problematic in instances where inventors live in a geographical area different from that of the assignee listed on the patent record. To more accurately match the location of inventors and assignee organizations, geographical and ownership information for corporations with at least 2 plants operating in the United States were extracted from the Bureau Van Dijk’s Orbis database. Because of data limitations, the sample was limited to directly owned branches of firms, thereby excluding joint ventures and subsidiaries3. Orbis records were linked to USPTO patent assignee names using the same fuzzy matching algorithm referenced above. To construct the final sample, patents were assigned to a specific establishment
3 Branches are distinct from subsidiaries and joint ventures as they do not represent separate legal entities and are considered a direct extension of a parent corporation

of an assignee if the location of the inventor coincided with the headquarters or one of the branch locations of the assignee organization. In cases where a patent was assigned to firm X, and when the inventor on the patent was located in city A, if city A contained no establishment associated with firm X, the patent record was dropped from the analytical sample. Since Orbis only provides recent company data, analysis was restricted to the years 2001-2015. The data series was truncated in 2015 due to right censoring in the granted patent data that occurs because of the time lag between patent filing and approval. The geographical matching was performed across the 381 metropolitan statistical areas (MSAs) of the United States. Research focused on firms (assignees) that patented from at least two establishments located in different metropolitan areas. In rare cases where a multilocational firm operated two plants in the same city in a given year, the data were combined to generate an aggregate plant. Patent counts were fractionally split across metropolitan areas when co-inventors were located in different MSAs. The data cover almost 330,000 patents and comprise 1,020 unique multilocational firms (of which 191 do not have their headquarters in the US) and 4,528 establishments. These firms represent approximately 5 percent of all assignees in USPTO records and they are responsible for 20 to 25 percent of all US patents in any given year over the period 2001-2015. Inventive intensity varies markedly across firm assignees, with some firms producing only two patents between 2001 and 2015, while the most inventive firm generated in excess of 50,000 patents. On average, firms generated patents in 27.6 different (Cooperative Patent Classification 4-digit) technological classes. Table 1 reports descriptive statistics on patents and the number of branches for multilocational firms split into 5 size categories. The median number of firm establishments in the sample is 2, while the mean is 4.4. If we look at domestic and foreign firms separately, the mean and median for domestic companies are 2 and 4.6, while the values for foreign organizations are 2 and 3.8. Not surprisingly, the median number of patents increases as the number of establishments within a firm grows, expanding from 17 for the first category to 863 for firms with 11-20 ‘innovative’ locations, and 2,119 for the 22 firms with over 20 establishments. Innovation activity is also increasingly dispersed as the number of establishments rises: in the first category, the median percentage of patents coming from the largest location (most often the headquarters) is 76, while it is under 60 for firms with 6-10 and 11-20 establishments. The same trend is also observed for technological specializations, as larger firms tend to be active in a broader range of (4-digit CPC) patent classes. We illustrate patterns of geographical knowledge sourcing through representative case studies of the firms Ericsson, Amgen and Corning. The panels of Figures 1-3 report differences in the class structure of patents at different R&D locations within each firm. Multidimensional scaling, based on the values of co-class relatedness between all pairs of patents, is employed to map data points (patents) around their centroids for each firm location. The distance between points represents the technological dissimilarity of different patents, and the distances between points and the place centroids captures the within-group variance. The greater the distance between the patent centroids for different locations, the greater the overall technological dissimilarity between two establishments of the same firm.
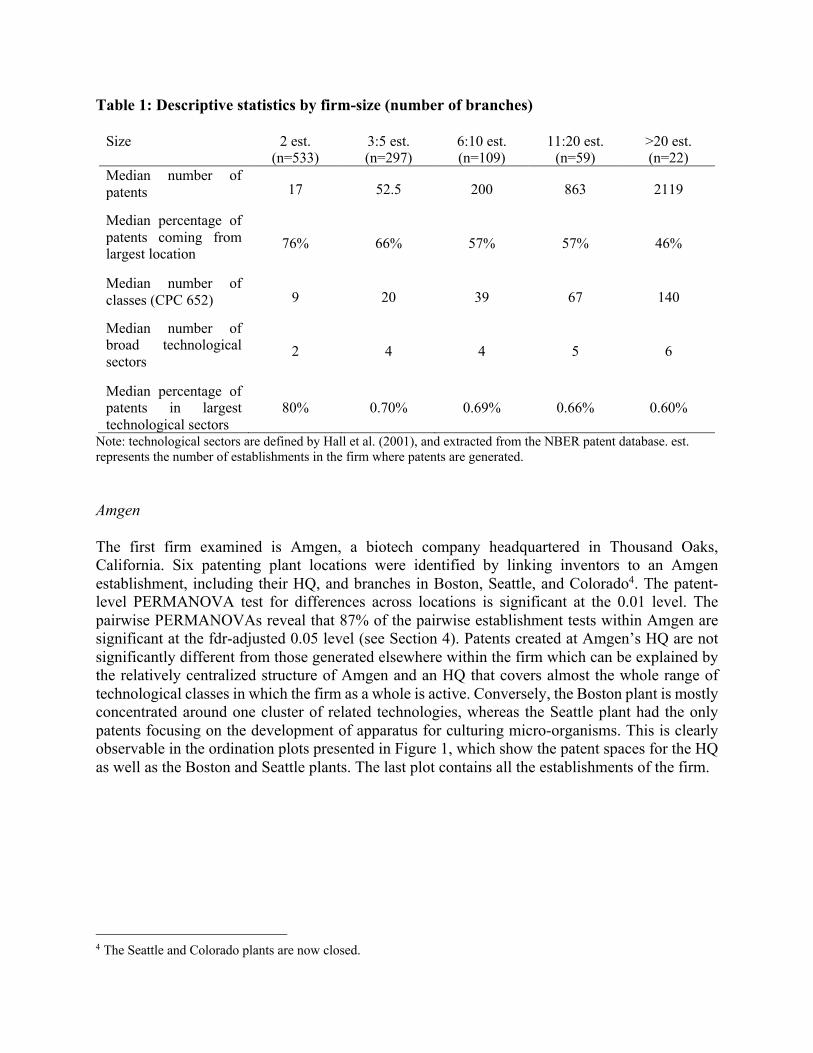
Table 1: Descriptive statistics by firm-size (number of branches)
Size 2 est. (n=533)
3:5 est. (n=297)
6:10 est. (n=109)
11:20 est. (n=59)
>20 est. (n=22)
Median number of patents 17 52.5 200 863 2119
Median percentage of patents coming from largest location
76% 66% 57% 57% 46%
Median number of classes (CPC 652) 9 20 39 67 140
Median number of broad technological sectors
2 4 4 5 6
Median percentage of patents in largest technological sectors
80% 0.70% 0.69% 0.66% 0.60%
Note: technological sectors are defined by Hall et al. (2001), and extracted from the NBER patent database. est. represents the number of establishments in the firm where patents are generated. Amgen The first firm examined is Amgen, a biotech company headquartered in Thousand Oaks, California. Six patenting plant locations were identified by linking inventors to an Amgen establishment, including their HQ, and branches in Boston, Seattle, and Colorado4. The patent-level PERMANOVA test for differences across locations is significant at the 0.01 level. The pairwise PERMANOVAs reveal that 87% of the pairwise establishment tests within Amgen are significant at the fdr-adjusted 0.05 level (see Section 4). Patents created at Amgen’s HQ are not significantly different from those generated elsewhere within the firm which can be explained by the relatively centralized structure of Amgen and an HQ that covers almost the whole range of technological classes in which the firm as a whole is active. Conversely, the Boston plant is mostly concentrated around one cluster of related technologies, whereas the Seattle plant had the only patents focusing on the development of apparatus for culturing micro-organisms. This is clearly observable in the ordination plots presented in Figure 1, which show the patent spaces for the HQ as well as the Boston and Seattle plants. The last plot contains all the establishments of the firm.
4 The Seattle and Colorado plants are now closed.
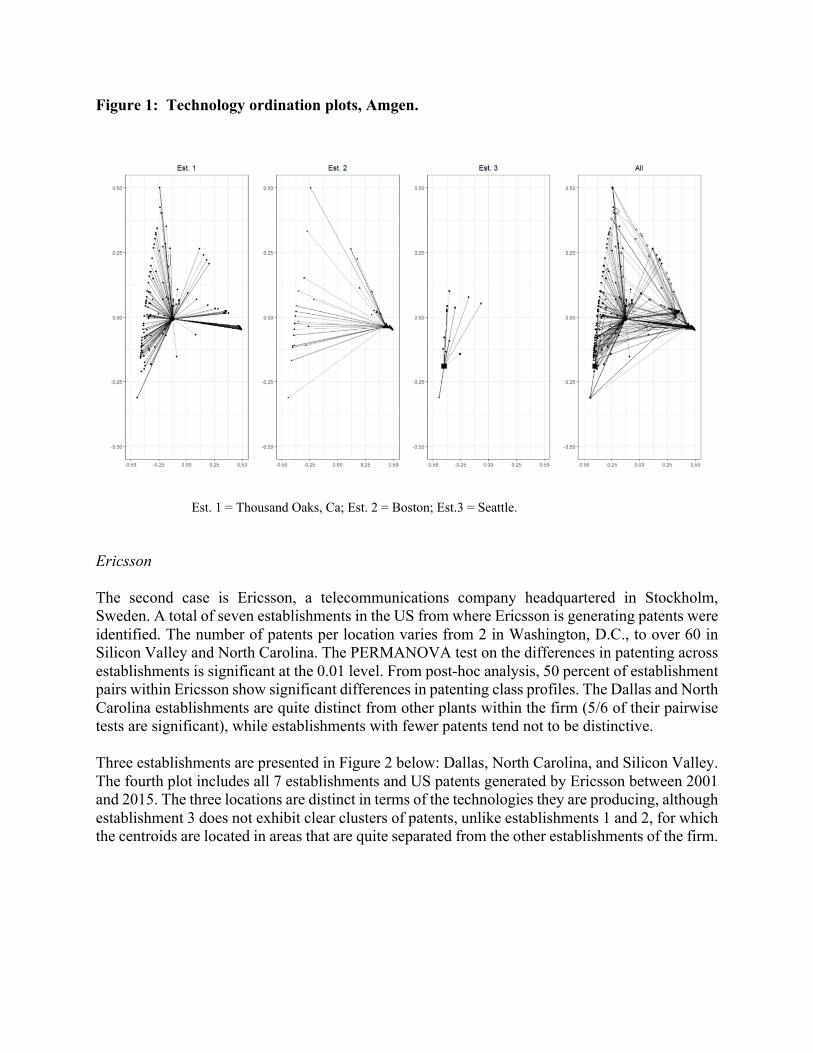
Figure 1: Technology ordination plots, Amgen.
Est. 1 = Thousand Oaks, Ca; Est. 2 = Boston; Est.3 = Seattle.
Ericsson The second case is Ericsson, a telecommunications company headquartered in Stockholm, Sweden. A total of seven establishments in the US from where Ericsson is generating patents were identified. The number of patents per location varies from 2 in Washington, D.C., to over 60 in Silicon Valley and North Carolina. The PERMANOVA test on the differences in patenting across establishments is significant at the 0.01 level. From post-hoc analysis, 50 percent of establishment pairs within Ericsson show significant differences in patenting class profiles. The Dallas and North Carolina establishments are quite distinct from other plants within the firm (5/6 of their pairwise tests are significant), while establishments with fewer patents tend not to be distinctive. Three establishments are presented in Figure 2 below: Dallas, North Carolina, and Silicon Valley. The fourth plot includes all 7 establishments and US patents generated by Ericsson between 2001 and 2015. The three locations are distinct in terms of the technologies they are producing, although establishment 3 does not exhibit clear clusters of patents, unlike establishments 1 and 2, for which the centroids are located in areas that are quite separated from the other establishments of the firm.

Figure 2: Technology ordination plots, Ericsson.
Est. 1 = Dallas ; Est. 2 = North Carolina; Est. 3 = Silicon Valley
Corning The last case reported is Corning, a company operating in materials science and headquartered in the town of Corning, New York. Corning has 13 establishments generating patents, the most important ones being the HQ, Boston, New York City and Rochester, NY. Similar to the case of Amgen, the headquarters is active in most technological classes in which the firm as a whole operates. The general PERMANOVA is significant at the 0.01 level for Corning, and the pairwise tests show 83% of establishments reporting significant difference at the fdr-adjusted 0.05 level. The HQ has significant differences with all establishments except for one, similar to the Rochester and Boston plants. The ordination plots below cover these two plants as well as the HQ. We can see from the plots in Figure 3 that the centroid of the Rochester plant is pulled up from the Boston centroid due to clusters of related patents in the middle-right and upper-left areas of the dissimilarity space. While the HQ seems to be active in multiple areas technological areas, its centroid is pulled to the left due to a more important number of patents located in the left part of the quadrant. In sum, these case studies offer visualizations of the disparities in technological production across different establishments of multi-locational firms. While the differences do not always arise from exclusive specialization areas in certain establishments, there are clear differences in the relative importance of certain technology clusters between different locations.

Figure 3: Technology ordination plots, Corning.
e Est1 = Boston; Est2= Corning, NY; Est. 3 = Rochester, NY.
4. Empirical Analysis 4.1 Do multilocational firms produce different technologies across their locations? This first stage of the empirical analysis explores whether the establishments of multilocational firms produce different technologies across the locations in which they operate. For all firm locations, we collect detailed technology class data on patents generated. A standard test would be some variant of analysis of variance to explore how the patent distribution within plants varies about the firm mean distribution. In this case, the patents are allocated across 652 classes of the CPC demanding use of multivariate analysis of variance (MANOVA). However, the large number of zeros in the data at the establishment by class level violates assumptions of MANOVA and so a permutation based MANOVA (PERMANOVA) is employed. PERMANOVA is a non-parametric test that operates over a geometric partitioning of the variation in a dataset that may be linked to multiple factors. The geometric partitioning is defined in the space of a given dissimilarity measure, a measure of distance between technologies generated within the establishments of multilocational firms. Statistical inference is obtained by the permutation of patent observations across a firm’s plants, from which we obtain a distribution of randomly generated F- (test) statistics. The null hypothesis is that the observed differences between the technology centroids of a firm’s establishment are not statistically different than what would be observed if the technology class observations were randomly distributed across establishments (Anderson, 2017). In all the statistical analysis, firm and establishment technology class count data were aggregated across three-year periods (2001-03, 2004-06,…, 2013-15) to dampen annual fluctuations in patenting behavior. The temporal dimension in the data provides the variance of technology within individual establishments.

To operationalize the PERMANOVA we require a measure of the distance between patent classes. The measure employed is based on the technological relatedness between classes (Breschi et al., 2003; Kogler et al., 2013). A relatedness score is generated for each pair of technology classes based on the co-occurrence of those classes across USPTO patent records. The co-classification counts for CPC classes i and j ("!") are standardized, in the form of a cosine index, yielding a measure of the relatedness or technological proximity between classes i and j in a given period:
$!" ="!"
&"! ∗ ""(
The standardized proximity matrix ($!") is subsequently used to calculate a dissimilarity score between all pairs of establishments within the firm by measuring the average relatedness distance between the patents they generate across different CPC classes. An establishment-level dissimilarity matrix is generated for each of the five periods examined between 2001 and 2015. The within-group variance for a given establishment is given by the technological dissimilarity between time periods, while the between-group variance is represented by the distance between the centroids of the establishments of a given multi-locational firm. The simulated distribution of F-statistics is estimated through permutations: the model randomly assigns the firm’s patent class observations to the establishments of a firm repeatedly, each time generating a new F-statistic. The observed F-statistic is compared to the distribution of simulated F-statistics to obtain a p-value. To get a clearer picture of the extent to which firms differentiate their technological production across locations, we performed separate PERMANOVA tests for each individual firm. Because repeated hypothesis testing is performed, the raw p-value as well as an adjusted p-value are reported (following the False Discovery Rate approach, “FDR”, which is similar to generating Bonferroni statistics). The PERMANOVA tests were performed using the ‘vegan’ package in R (Oksanen et al., 2020). Table 2 presents the results of the PERMANOVA tests by firm-size groups. The percentage of tests in each group yielding significant results at the 0.1, 0.05 and 0.01 confidence levels are shown. The right-hand side columns present the results with p-values adjusted for repeated hypothesis testing. (Results grouped by technology class can be found in Appendix 1.) The results are displayed only for firms where the overall number of patents allowed 999 permutations to be performed. In summary, using the adjusted p-values, slightly more than half the firms in the sample produce different kinds of technologies across their establishments. However, there are important differences by firm size, measured by the number of locations across which they patent. Almost 75% of firms with more than two plants report significant differences in the type of patents produced within their plants, and this share exceeds 90% for firms with more than 5 locations. Looking at foreign firms (not reported in the table of results), approximately 40% produce significantly different technologies across their US plants. This relatively small proportion reflects the fact that foreign firms, on average, have fewer plants operating in the US than their domestic counterparts. In sum, these results suggest that larger firms are more effectively able to exploit and mobilize different sets of technological capabilities across the establishments that they control.
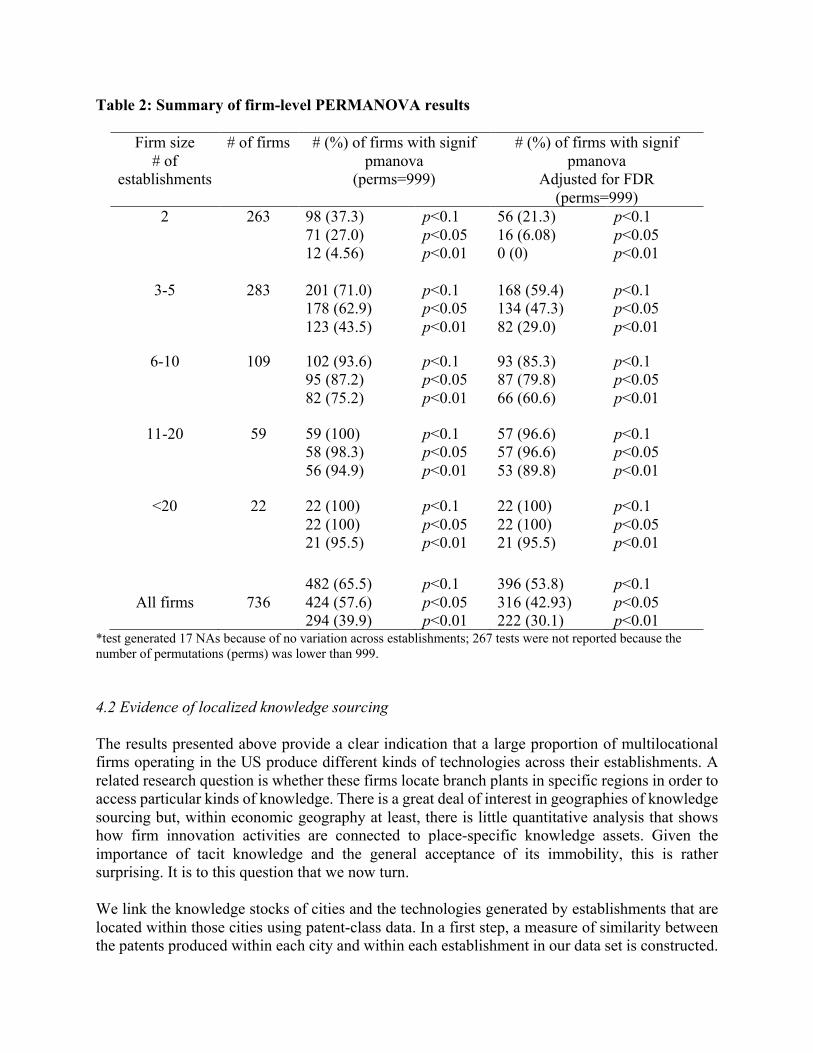
Table 2: Summary of firm-level PERMANOVA results
Firm size # of
establishments
# of firms # (%) of firms with signif pmanova
(perms=999)
# (%) of firms with signif pmanova
Adjusted for FDR (perms=999)
2 263 98 (37.3) 71 (27.0) 12 (4.56)
p<0.1 p<0.05 p<0.01
56 (21.3) 16 (6.08) 0 (0)
p<0.1 p<0.05 p<0.01
3-5 283 201 (71.0) 178 (62.9) 123 (43.5)
p<0.1 p<0.05 p<0.01
168 (59.4) 134 (47.3) 82 (29.0)
p<0.1 p<0.05 p<0.01
6-10 109 102 (93.6) 95 (87.2) 82 (75.2)
p<0.1 p<0.05 p<0.01
93 (85.3) 87 (79.8) 66 (60.6)
p<0.1 p<0.05 p<0.01
11-20 59 59 (100) 58 (98.3) 56 (94.9)
p<0.1 p<0.05 p<0.01
57 (96.6) 57 (96.6) 53 (89.8)
p<0.1 p<0.05 p<0.01
<20 22 22 (100) 22 (100) 21 (95.5)
p<0.1 p<0.05 p<0.01
22 (100) 22 (100) 21 (95.5)
p<0.1 p<0.05 p<0.01
All firms
736
482 (65.5) 424 (57.6) 294 (39.9)
p<0.1 p<0.05 p<0.01
396 (53.8) 316 (42.93) 222 (30.1)
p<0.1 p<0.05 p<0.01
*test generated 17 NAs because of no variation across establishments; 267 tests were not reported because the number of permutations (perms) was lower than 999. 4.2 Evidence of localized knowledge sourcing The results presented above provide a clear indication that a large proportion of multilocational firms operating in the US produce different kinds of technologies across their establishments. A related research question is whether these firms locate branch plants in specific regions in order to access particular kinds of knowledge. There is a great deal of interest in geographies of knowledge sourcing but, within economic geography at least, there is little quantitative analysis that shows how firm innovation activities are connected to place-specific knowledge assets. Given the importance of tacit knowledge and the general acceptance of its immobility, this is rather surprising. It is to this question that we now turn. We link the knowledge stocks of cities and the technologies generated by establishments that are located within those cities using patent-class data. In a first step, a measure of similarity between the patents produced within each city and within each establishment in our data set is constructed.

The similarity index counts the number of technology classes in which a city and an establishment both exhibit revealed technological advantage (RTA) and then standardizes this observed count with an expected count based on the probability of observing RTA technology matches (see van Eck and Waltman, 2009). An index value of 1 indicates that a city and an establishment have the expected number of shared technology classes given the distribution of RTA values across all cities and establishments. An index value of 2 suggests that a city and establishment pair have about twice as many shared technology classes as you would expect given the overall distribution of RTA values, etc. In a second step, we take all the establishments within one firm and build a binary dependent variable that indicates whether or not the individual establishments of the firm are placed in the city where they are found5. We repeat these observations for all firms and then use the technological similarity between all establishment-city pairings to predict the correct location of the establishment using a simple logit model. The technological similarity measures are built using patent data for the entire study period 2001-15. The results from this exercise are presented in Table 3. Firm fixed effects are employed in the logistic regression and standard errors are clustered by firm. The index of technological similarity is a significant predictor of the correct location for each establishment. Indeed, using the probability of 0.5 as a threshold, this model correctly predicts over 92% of establishment locations. This result provides strong support that the establishments of multilocational firms absorb the technological know-how of the cities in which they are located. Whether or not these establishments are strategically located in different cities to access the tacit knowledge that may be embedded in particular places remains to be seen. However, these results surely hint at that possibility. Table 3: Logit model predicting city-establishment pairings based on technological similarity
Dependent variable: location Coefficient (s.e.) obs
Technological similarity 0.0832*** (0.0096) 56,326
constant -0.2827*** (0.0324)
Notes: Firm fixed effects included and standard errors clustered within the firm. *** significant at the 0.01 level.
5 Imagine a firm with 5 plants. Each of these plants is associated with five observations, where the dependent variable takes the value 0 in four of those observations where the plant is assigned to the wrong city and the dependent variable takes the value 1 for one observation where the plant is allocated to the city in which it is actually located.

4.3 Does multilocational knowledge sourcing increase the value of firm innovation Our analysis so far has shed light on the spatial distribution of innovation activity within multilocational firms in the US. The first set of results indicates that the majority of multilocational firms, especially larger ones, produce different technologies across the locations in which they operate. Our second model suggests that this differentiation might, in part, be driven by the establishments’ local knowledge sourcing activities, which we observe through the strong relationship between the technologies the establishment produces and the knowledge base of their host location. If multilocational firms are strategic in their knowledge sourcing activity, we might expect to see economic returns to their actions, returns that may highlight their ability to gather distant knowledge assets and recombine them in productive ways. In a well-known paper in the international business field, Singh (2008) explores whether spatially distributed R&D within MNEs raises the quality of the knowledge they produce. He measures knowledge quality using forward citations and examines the relationship between knowledge quality and the geographical dispersion of R&D within a sample of more than 1100 firms. Singh (2008) reports that increases in the spatial separation of a firm’s R&D activity are negatively associated with the number of forward citations generated by firm patents on average. The potential gains from accessing diverse ideas generated in different locations are seen as offset by the difficulty of integrating disparate knowledge subsets. In the analysis below, we revisit Singh’s (2008) analysis. Because the focus here is largely on domestic multilocational firms operating in a relatively standardized institutional environment, it is possible that the difficulties of knowledge integration may be lower. However, we also seek to distance this work from that of Singh (2008) in two important ways. First, our dispersion indicator reflects the number of locations in which a firm has operations, whereas Singh (2008) and much of the literature in general base their measure solely on the locations (addresses) of the inventors. Secondly, while Singh (2008) recognizes the value of tacit knowledge and its relative immobility, he does not have a good measure of that value. While this is a significant problem for us all, using forward citations to measure the quality of tacit knowledge is problematic because tacit knowledge belies the imitation that patent citations track. The alternative concept of knowledge complexity, recently introduced by Hidalgo and Hausmann (2009), has been used to measure the value of knowledge by Balland and Rigby (2017). They argue that knowledge that is complex also tends to be rare, so this concept appears to fit better with the idea of knowledge that is tacit. If access to multiple pools of knowledge is beneficial for firms, and if multilocational firms are able to recombine that knowledge effectively, they should generate knowledge that is more valuable. We develop the two measures of knowledge quality or value discussed above, the number of forward citations on patents and the complexity of patents, and we regress those measures against the number of establishments in the firms that produce those patents in our sample. We hypothesize that patent quality or value should be positively related to the number of establishments in the multilocational firm. We do not average patent values by each firm; that averaging process likely adding noise. So the units of observation in this analysis are individual patents produced by at least one of the 1,020 firms in our sample covering the period 2001 to 2015. Forward citations for each patent are measured for 7 years after their filing date. Jaffe and
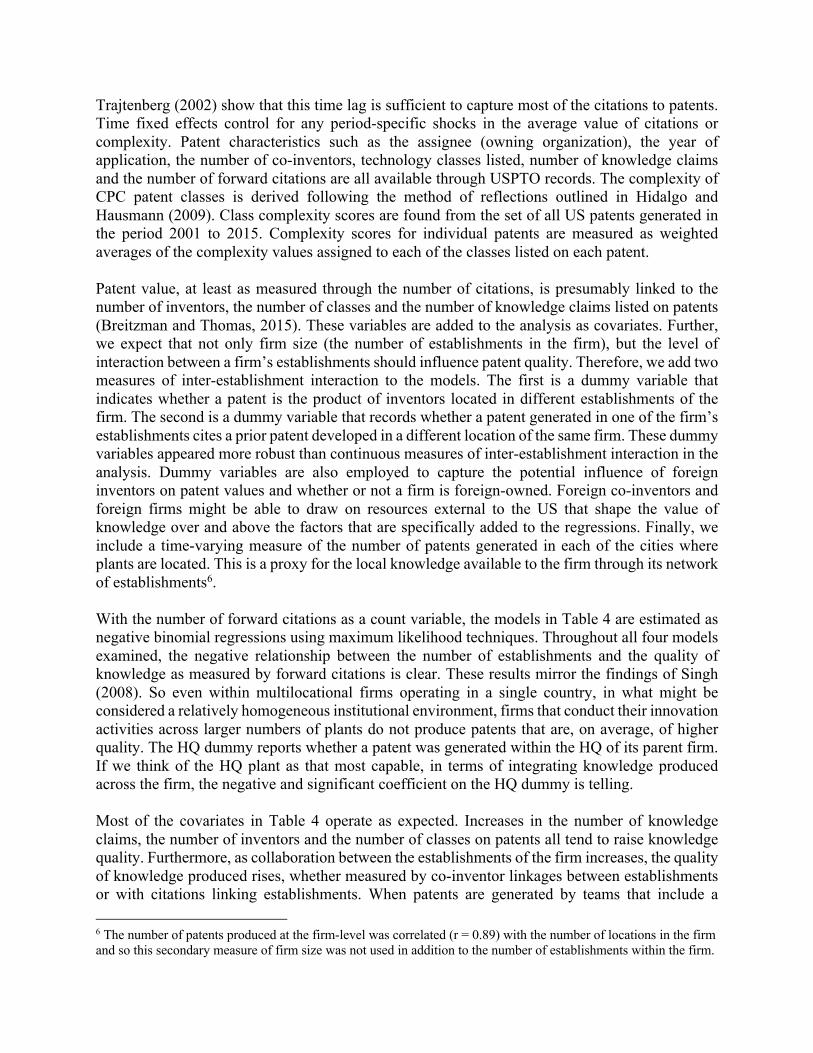
Trajtenberg (2002) show that this time lag is sufficient to capture most of the citations to patents. Time fixed effects control for any period-specific shocks in the average value of citations or complexity. Patent characteristics such as the assignee (owning organization), the year of application, the number of co-inventors, technology classes listed, number of knowledge claims and the number of forward citations are all available through USPTO records. The complexity of CPC patent classes is derived following the method of reflections outlined in Hidalgo and Hausmann (2009). Class complexity scores are found from the set of all US patents generated in the period 2001 to 2015. Complexity scores for individual patents are measured as weighted averages of the complexity values assigned to each of the classes listed on each patent. Patent value, at least as measured through the number of citations, is presumably linked to the number of inventors, the number of classes and the number of knowledge claims listed on patents (Breitzman and Thomas, 2015). These variables are added to the analysis as covariates. Further, we expect that not only firm size (the number of establishments in the firm), but the level of interaction between a firm’s establishments should influence patent quality. Therefore, we add two measures of inter-establishment interaction to the models. The first is a dummy variable that indicates whether a patent is the product of inventors located in different establishments of the firm. The second is a dummy variable that records whether a patent generated in one of the firm’s establishments cites a prior patent developed in a different location of the same firm. These dummy variables appeared more robust than continuous measures of inter-establishment interaction in the analysis. Dummy variables are also employed to capture the potential influence of foreign inventors on patent values and whether or not a firm is foreign-owned. Foreign co-inventors and foreign firms might be able to draw on resources external to the US that shape the value of knowledge over and above the factors that are specifically added to the regressions. Finally, we include a time-varying measure of the number of patents generated in each of the cities where plants are located. This is a proxy for the local knowledge available to the firm through its network of establishments6. With the number of forward citations as a count variable, the models in Table 4 are estimated as negative binomial regressions using maximum likelihood techniques. Throughout all four models examined, the negative relationship between the number of establishments and the quality of knowledge as measured by forward citations is clear. These results mirror the findings of Singh (2008). So even within multilocational firms operating in a single country, in what might be considered a relatively homogeneous institutional environment, firms that conduct their innovation activities across larger numbers of plants do not produce patents that are, on average, of higher quality. The HQ dummy reports whether a patent was generated within the HQ of its parent firm. If we think of the HQ plant as that most capable, in terms of integrating knowledge produced across the firm, the negative and significant coefficient on the HQ dummy is telling. Most of the covariates in Table 4 operate as expected. Increases in the number of knowledge claims, the number of inventors and the number of classes on patents all tend to raise knowledge quality. Furthermore, as collaboration between the establishments of the firm increases, the quality of knowledge produced rises, whether measured by co-inventor linkages between establishments or with citations linking establishments. When patents are generated by teams that include a
6 The number of patents produced at the firm-level was correlated (r = 0.89) with the number of locations in the firm and so this secondary measure of firm size was not used in addition to the number of establishments within the firm.
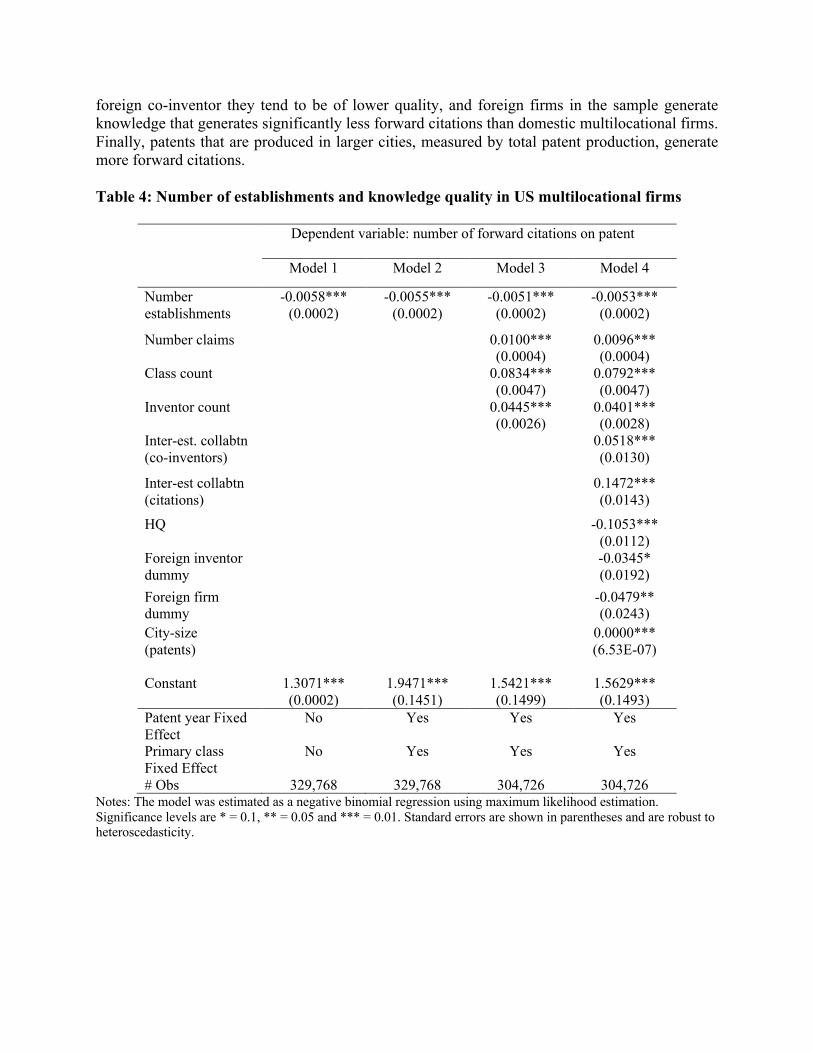
foreign co-inventor they tend to be of lower quality, and foreign firms in the sample generate knowledge that generates significantly less forward citations than domestic multilocational firms. Finally, patents that are produced in larger cities, measured by total patent production, generate more forward citations. Table 4: Number of establishments and knowledge quality in US multilocational firms
Dependent variable: number of forward citations on patent
Model 1 Model 2 Model 3 Model 4
Number establishments
-0.0058*** (0.0002)
-0.0055*** (0.0002)
-0.0051*** (0.0002)
-0.0053*** (0.0002)
Number claims 0.0100*** (0.0004)
0.0096*** (0.0004)
Class count 0.0834*** (0.0047)
0.0792*** (0.0047)
Inventor count 0.0445*** (0.0026)
0.0401*** (0.0028)
Inter-est. collabtn (co-inventors)
0.0518*** (0.0130)
Inter-est collabtn (citations)
0.1472*** (0.0143)
HQ -0.1053*** (0.0112)
Foreign inventor dummy
-0.0345* (0.0192)
Foreign firm dummy
-0.0479** (0.0243)
City-size (patents)
0.0000*** (6.53E-07)
Constant 1.3071***
(0.0002) 1.9471*** (0.1451)
1.5421*** (0.1499)
1.5629*** (0.1493)
Patent year Fixed Effect
No Yes Yes Yes
Primary class Fixed Effect
No Yes Yes Yes
# Obs 329,768 329,768 304,726 304,726 Notes: The model was estimated as a negative binomial regression using maximum likelihood estimation. Significance levels are * = 0.1, ** = 0.05 and *** = 0.01. Standard errors are shown in parentheses and are robust to heteroscedasticity.

Turning to the measure of patent complexity in Table 5, the key finding is that firms with more establishments tend to produce significantly more complex patents, on average. Unlike the previous results showing that dispersed innovation activity had a negative impact on patent quality, or forward citations, the results obtained in the complexity models support the view that multilocational firms are able to exploit specialized local knowledge stocks and successfully integrate the ideas that they gather in different locations. Patent characteristics impact complexity in ways we would anticipate with more complex patents requiring more inventors and making more knowledge claims. The class count has a negative relationship with complexity unlike knowledge quality. This can be explained by the fact that combining highly complex classes is extraordinarily difficult and not that common. Combining complex and less complex Table 5: Number of establishments and knowledge complexity in US Multilocational firms
Dependent variable: patent complexity
Model 1 Model 2 Model 3 Model 4 Number establishments
0.0025*** (0.0001)
0.0001*** (8.12E-06)
0.0001*** (8.45E-06)
0.0001*** (8.87E-06)
Number claims 0.0001*** (0.0000)
0.0001*** (0.0000)
Class count -0.0210*** (0.0003)
-0.0211*** (0.0003)
Inventor count 0.0004*** (0.0001)
0.0002* (0.0001)
Inter-est. collabtn (co-inventors)
0.0029*** (0.0005)
Inter-est collabtn (citations)
0.0011** (0.0005)
HQ 0.0029*** (0.0004)
Foreign inventor dummy
0.0022*** (0.0007)
Foreign firm dummy
-0.0042*** (0.0007)
City-size (patents)
3.62E-07*** (2.53E-08)
Constant 0.6594*** (0.0006)
0.2817*** (0.0062)
0.3105*** (0.0068)
0.3077*** (0.0068)
Patent year Fixed Effect
No Yes Yes Yes
Primary class Fixed Effect
No Yes Yes Yes
# Obs 329,768 329,768 304,726 304,726 Notes: The model was estimated as OLS. Significance levels are * = 0.1, ** = 0.05 and *** = 0.01. Standard errors are shown in parentheses and are robust to heteroscedasticity.
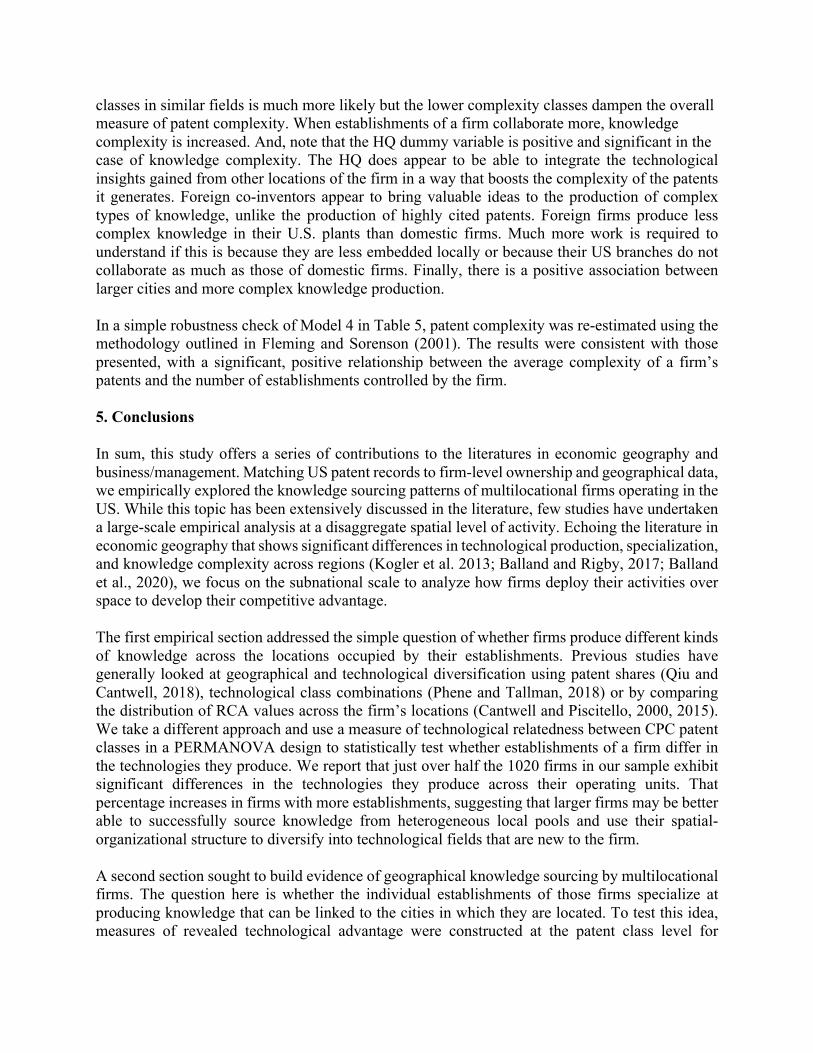
classes in similar fields is much more likely but the lower complexity classes dampen the overall measure of patent complexity. When establishments of a firm collaborate more, knowledge complexity is increased. And, note that the HQ dummy variable is positive and significant in the case of knowledge complexity. The HQ does appear to be able to integrate the technological insights gained from other locations of the firm in a way that boosts the complexity of the patents it generates. Foreign co-inventors appear to bring valuable ideas to the production of complex types of knowledge, unlike the production of highly cited patents. Foreign firms produce less complex knowledge in their U.S. plants than domestic firms. Much more work is required to understand if this is because they are less embedded locally or because their US branches do not collaborate as much as those of domestic firms. Finally, there is a positive association between larger cities and more complex knowledge production. In a simple robustness check of Model 4 in Table 5, patent complexity was re-estimated using the methodology outlined in Fleming and Sorenson (2001). The results were consistent with those presented, with a significant, positive relationship between the average complexity of a firm’s patents and the number of establishments controlled by the firm. 5. Conclusions In sum, this study offers a series of contributions to the literatures in economic geography and business/management. Matching US patent records to firm-level ownership and geographical data, we empirically explored the knowledge sourcing patterns of multilocational firms operating in the US. While this topic has been extensively discussed in the literature, few studies have undertaken a large-scale empirical analysis at a disaggregate spatial level of activity. Echoing the literature in economic geography that shows significant differences in technological production, specialization, and knowledge complexity across regions (Kogler et al. 2013; Balland and Rigby, 2017; Balland et al., 2020), we focus on the subnational scale to analyze how firms deploy their activities over space to develop their competitive advantage. The first empirical section addressed the simple question of whether firms produce different kinds of knowledge across the locations occupied by their establishments. Previous studies have generally looked at geographical and technological diversification using patent shares (Qiu and Cantwell, 2018), technological class combinations (Phene and Tallman, 2018) or by comparing the distribution of RCA values across the firm’s locations (Cantwell and Piscitello, 2000, 2015). We take a different approach and use a measure of technological relatedness between CPC patent classes in a PERMANOVA design to statistically test whether establishments of a firm differ in the technologies they produce. We report that just over half the 1020 firms in our sample exhibit significant differences in the technologies they produce across their operating units. That percentage increases in firms with more establishments, suggesting that larger firms may be better able to successfully source knowledge from heterogeneous local pools and use their spatial-organizational structure to diversify into technological fields that are new to the firm. A second section sought to build evidence of geographical knowledge sourcing by multilocational firms. The question here is whether the individual establishments of those firms specialize at producing knowledge that can be linked to the cities in which they are located. To test this idea, measures of revealed technological advantage were constructed at the patent class level for

individual plants and for each of the 381 US metropolitan areas where those plants were located. A logistic regression was used to predict the correct allocation of a firm’s establishments across the subset of cities where the firm was present. The key independent variable in the regression was a standardized measure of the technological similarity between establishment and city pairs. The coefficient on the key variable was positive and significant. This result supports the claim that geographical diversification of innovation activities in multilocational firms is, at least in part, motivated by knowledge seeking. A last component of the analysis extends research in the international business literature that examines whether MNEs benefit from the geographical separation of their R&D activities. The logic here is that by embedding plants in different locations, firms can generate more diverse knowledge sets that will be more valuable if successfully integrated. Papers by Singh (2008) and Scalera et al. (2018) found no statistical support for this claim. In the former case, geographically dispersed R&D is shown to have a negative relationship with the quality of innovation; in the latter case, the results take the form of a curvilinear relationship between the number of domestic R&D locations and the average technological scope of patents produced by the firm. Singh (2008) references the difficulties of integrating knowledge sourced from different countries as key to the negative result reported. We had two ideas underlying our re-examination of this question. First, looking at the operations of plants within a single country might lessen the cost of knowledge integration. Second, we had concerns regarding the measure of patent quality that Singh employed in his analysis. Forward citations are, without doubt, a reasonable indicator of the quality of patents, yet they appear to us to be a poor proxy for tacit knowledge. Hence, alongside measures of the forward citations of patents we use measures of patent complexity (Balland and Rigby, 2017) to index the value of patents. In a first set of results, we replicate Singh’s (2008) findings that increases in the geographical distribution of a firm’s R&D activities is negatively related with the average quality of a firm’s patents as measured by forward citations. The interesting question here is why should the cost of knowledge integration within a single country, such as the US, be large enough to offset the potential gains from geographical knowledge sourcing? While not wishing to be overly critical, this result raises questions about the utility of forward citations as a measure of knowledge quality and, more especially, that which is tacit. A second set of results used patent complexity as a measure of the value of knowledge produced in the form of patents by multilocational firms. We found a significant, positive relationship between the number of locations at which firms engaged in knowledge production and the complexity value of that knowledge. This result suggests that there are gains to the firm of distributing knowledge production across a larger number of source regions. Finally, across all the models in this final stage of analysis, results confirmed that higher levels of integration between the establishments of the firm were positively related to more complex forms of knowledge development. This is in line with other research showing that collaboration between the establishments of a firm exert a positive impact on innovation outcomes (Berry, 2014, 2015). Overall, this research provides robust empirical evidence that multilocational firms operating in the US produce different kinds of knowledge across their establishments, that they locate branches in particular locations to source specific sets of knowledge, and that firms benefit from such practices. At this point, we note some limitations to our work that point toward future research
possibilities. First, our analytical sample is limited to the headquarters and the branches of corporations and therefore excludes subsidiaries and joint ventures. Including these entities in similar models is likely to reinforce the findings presented here given that subsidiaries often operate in sectors that are slightly different from those in which the core of the firm is vested. Nevertheless, including these other types of establishments controlled by the firm would offer a more comprehensive picture of knowledge sourcing patterns in multilocational organizations. Second, this study did not incorporate other firm-level or regional characteristics that could possibly affect technological diversification. This is due largely to the difficulty of accessing detailed firm-level information for private corporations in the US. Finally, there are many possibilities to extend this research in the future. A broader empirical perspective on knowledge diversification at the multinational scale would add much to the literature. In addition, a similar investigation within other national spaces would also be useful. Finally, we did not explore differences across industries and forms of corporations. Disaggregating the data would likely unearth important sources of heterogeneity between organizations.

References
Alcácer, J. & Chung, W. 2014. Location strategies for agglomeration economies. Strategic Management Journal 35(12): 1749-1761. Alcácer, J. & Zhao, M. 2012. Local R&D strategies and multilocation firms: The role of internal linkages. Management Science 58(4): 734-753. Almeida, P. & Kogut, B. 1999. Localization of knowledge and the mobility of engineers in regional networks. Management Science 45(7): 905-917. Almeida, P. & Phene, A. 2004. Subsidiaries and knowledge creation: the influence of the MNC and host country on innovation. Strategic Management Journal 25(89): 847–864. Anderson, M.J. 2017. Permutational Multivariate Analysis of Variance (PERMANOVA). In Wiley StatsRef: Statistics Reference Online Balakrishnan,N., Colton, T., Everitt, B., Piegorsch, , W., Ruggeri, F. and Teugels, J. (eds.). Arrow, K.J. 1974. The economic implications of learning by doing. In Hahn, F. (ed.) Readings in the Theory of Growth. London: Palgrave Macmillan. Asheim, B.T. & Coenen, L. 2005. Knowledge bases and regional innovation systems: Comparing Nordic clusters. Research Policy 34(8): 1173-1190. Asheim, B.T. & Gertler, M.S. 2005. The geography of innovation: regional innovation systems. In Fagerberg, J., Mowery, D.C. and Nelson, R.R. (eds.), The Oxford Handbook of Innovation. Oxford: Oxford University Press., 291-317. Audrestsch, D.B. & Feldman, M.P. 1996. R&D spillovers and the geography of innovation and production. American Economic Review 86(3) 630-640. Balland, P. A. & Rigby, D.L. 2017. The geography of complex knowledge. Economic Geography 93(1): 1-23. Balland, P. A., Jara-Figueroa, C., Petralia, S. G., Steijn, M. P., Rigby, D. L. & Hidalgo, C. A. 2020. Complex economic activities concentrate in large cities. Nature Human Behaviour 4(3): 248-254. Bathelt, H., Malmberg, A. & Maskell, P. 2004. Clusters and knowledge: local buzz, global pipelines and the process of knowledge creation. Progress in Human Geography 28(1): 31-56. Beccatini, G. 1990. The Marshallian industrial district as a socio-economic notion. In Pyke, F., Beccatini, G. & Sengenberger, W. (eds.) Industrial Districts and Inter-Firm Co-operation in Italy. Geneva: International Institute for Labour Studies, pp.37-51. Belderbos, R., Lokshin, B. & Sadowski, B. 2015. The returns to foreign R&D. Journal of International Business Studies 46(4): 491-504.
Berry, H. 2014. Global integration and innovation: multicountry knowledge generation within MNC s. Strategic Management Journal 35(6): 869-890. Berry, H. 2015. Knowledge inheritance in global industries: The impact of parent firm knowledge on the performance of foreign subsidiaries. Academy of Management Journal 58(5): 1438-1458. Berry, H. 2018. The Influence of Multiple Knowledge Networks on Innovation in Foreign Operations. Organization Science 29(5): 855-872. Berry, H. & Kaul, A. 2015. Global sourcing and foreign knowledge seeking. Management Science 61(5): 1052-1071. Beugelsdijk S. & Mudambi R. 2014. MNEs as border-crossing multi-location enterprises: The role of discontinuities in geographic space. In: Cantwell J. (ed.) Location of International Business Activities. London: Palgrave Macmillan, pp8-34. Birkinshaw, J. 1997. Entrepreneurship in multinational corporations: The characteristics of subsidiary initiatives. Strategic Management Journal 18(3): 207-229. Boschma, R. 2005. Proximity and innovation: A critical assessment. Regional Studies 39(1): 61-74. Boschma, R., Balland, P.A. & Kogler, D. 2015. Relatedness and technological change in cities: the rise and fall of technological knowledge in US metropolitan areas from 1981 to 2010. Industrial and Corporate Change 24: 223-250. Breitzman, A. & Thomas, P. 2015. Inventor team size as a predictor of the future impact of patents. Scientometrics 103: 631-647. Breschi, S. & Lissoni, F. 2001. Knowledge spillovers and local innovation systems: A critical survey. Industrial and Corporate Change 4(1): 975-1005. Breschi, S., Lissoni, F. & Malerba, F. 2003. Knowledge-relatedness in firm technological diversification. Research Policy 32(1): 69-87. Brown, J.S. & Duguid, P. 1991. Organizational learning and communities of practice: Toward a unified view of working, learning and innovation. Organization Science 2(1): 40-57. Brusco, S. 1986. Small firms and industrial district: the experience of Italy. In Keeble, D. & Wever, E. (eds.) New Firms and Regional Development. London: Croom Helm, pp184-202. Camagni, R. (ed.) 1991. Innovation Networks: Spatial Perspectives. London and New York: Belhaven Press.
Cantwell, J. 1989. Technological Innovation and Multinational Corporations. Oxford: Blackwell. Cantwell, J. 2017. Innovation and international business. Industry and Innovation 24(1): 41-60. Cantwell, J. & Iammarino, S. 2005. Multinational Corporations and European Regional Systems of Innovation. London: Routledge. Cantwell, J. & Mudambi, R. 2005. MNE competence-creating subsidiary mandates. Strategic Management Journal 26(12): 1109-1128. Cantwell, J. & Piscitello, L. 1999. The frontier of international technology networks: sourcing abroad the most highly tacit capabilities. Information Economics and Policy 11(1): 101-123. Cantwell, J. & Piscitello, L. 2000. Accumulating technological competence: its changing impact on corporate diversification and internationalization. Industrial and Corporate Change 9(1): 21-51. Cantwell, J. & Piscitello, L. 2015. New competence creation in multinational company subunits: The role of international knowledge. The World Economy 38(2): 231-254. Castellani, D., Lavoratori, K., Perri, A. & Scalera, V. G. 2021. International connectivity and the location of multinational enterprises' knowledge-intensive activities: Evidence from US metropolitan areas. Global Strategy Journal https://doi.org/10.1002/gsj.1404 Chesborough, H. 2003. Open Innovation. Cambridge, MA: Harvard University Press. Cohen, W. M. & Levinthal, D. A. 1990. Absorptive capacity: A new perspective on learning and innovation. Administrative science quarterly 35(1): 128-152. Collinson, S. C. & Wang, R. 2012. The evolution of innovation capability in multinational enterprise subsidiaries: Dual network embeddedness and the divergence of subsidiary specialisation in Taiwan. Research Policy 41(9): 1501-1518. Dunning, J. H. 2013. Multinationals, Technology, and Competitiveness. London: Routledge. (Original work published in 1988). Esposito, C. R. & Rigby, D. L. 2019. Buzz and pipelines: the costs and benefits of local and nonlocal interaction. Journal of Economic Geography 19(3): 753-773. Figueiredo, P.N. 2011. The role of dual embeddedness in the innovative performance of MNE subsidiaries: Evidence from Brazil. Journal of Management Studies 48(2): 417-440. Fitjar, R. and Rodriguez-Pose, A. 2014. When local interaction does not suffice: sources of firm innovation in urban Norway. Environment and Planning A 43: 1248-1267.

Fleming, L. & Sorenson, O. 2001. Technology as a complex adaptive system: evidence from patent data. Research Policy 30(7): 1019-1039. Forsgren, M. 2017. Theories of the Multinational Firm: A Multidimensional Creature in the Global Economy. Cheltenham, UK: Edward Elgar. Frost, T.S. 2001. The geographic sources of foreign subsidiaries’ innovations. Strategic Management Journal 22(2): 101-123. Gertler, M. S. 2003. Tacit knowledge and the economic geography of context, or the undefinable tacitness of being (there). Journal of Economic Geography 3(1): 75-99. Ghoshal, S. & Bartlett, C. 1988. Creation, adoption and diffusion of innovations by subsidiaries of multinational corporations. Journal of International Business Studies 19: 365-388. Goerzen, A., Asmussen, C. G. & Nielsen, B. B. 2013. Global cities and multinational enterprise location strategy. Journal of International Business Studies 44(5): 427-450. Grilitsch, M. & Trippl, M. 2014. Combining knowledge from different sources, channels and geographical scales. European Planning Studies 22(11): 2305-2325. Hidalgo, S. & Hausmann, R. 2009. The building blocks of economic complexity. Proceedings of the National Academy of Sciences 106(26) 10570-10575 Iammarino, S. & McCann, P. 2013. Multinationals and Economic Geography: Location, Technology and Innovation. Cheltenham, UK: Edward Elgar. Iammarino, S., Piva, M. Vivarelli, M. & Von Tunzelmann, N. 2012. Technological capabilities and patterns of innovative cooperation of firms in the UK regions. Regional Studies 46(10): 1283-1301. Isaksen, A. and Trippl, M. 2017. Innovation in space: the mosaic of regional innovation patterns. Oxford Review of Economic Policy 33: 122-140. Jaffe, A.B. & Trajtenberg, M. 2002. Patents, Citations & Innovations: a Window on the Knowledge Economy. Cambridge, MA: The MIT Press. Jaffe, A.B., Trajtenberg, M. & Henderson, R. 1993. Geographic localization of knowledge spillovers as evidenced by patent citations. The Quarterly Journal of Economics 108 (3): 577–98. Jindra, B., Hassan, S. S. & Cantner, U. 2016. What does location choice reveal about knowledge-seeking strategies of emerging market multinationals in the EU?. International Business Review 25(1): 204-220. Kogler, D. F., Rigby, D. L. & Tucker, I. 2013. Mapping knowledge space and technological relatedness in US cities. European Planning Studies 21(9): 1374-1391.

Kramer, J.-P. & Revilla Diez, J. 2012. Catching the local buzz by embedding? Empirical insights on the regional embeddedness of multinational enterprises in Germany and the UK. Regional Studies 46(10): 1303-1317.. Lahiri, N. 2010. Geographic distribution of R&D activity: How does it affect innovation quality? Academy of Management Journal 53(5): 1194-1209. Lawson, C. & Lorenz, E. 1999. Collective learning, tacit knowledge and regional innovative capacity. Regional Studies 33(4): 305-317. Lecocq, C., Leten, B., Kusters, J. & Van Looy, B. 2012. Do firms benefit from being present in multiple technology clusters? An assessment of the technological performance of biopharmaceutical firms. Regional Studies 46(9): 1107-1119. Leiponen, A. & Helfat, C.E. 2010. Innovation objectives, knowledge sources, and the benefits of breadth. Strategic Management Journal 31: 224-236. Li, P. & Bathelt, H. 2018. Location strategy in cluster networks. Journal of International Business Studies 49(8): 967-989. Lundvall, B. & Johnson, B. 1994. The learning economy. Journal of Industry Studies 1(2): 23-43. Marshall, A. 1890. Principles of Economics. London: Macmillan. Martin, R. & Moodysson, J. 2011. Innovation in symbolic industries: The geography and organization of knowledge sourcing. European Planning Studies 19: 1183-1203. Maskell, P. & Malmberg, A. 1999. Localised Learning and Industrial Competitiveness. Cambridge Journal of Economics 23 (2): 167–85. Meyer, K. Mudambi, R. & Narula, R. 2011. Multinational Enterprises and Local Contexts: The Opportunities and Challenges of Multiple Embeddedness. Journal of Management Studies 48 (2): 235–52. Morgan, K. 1997. The learning region: institutions, innovation and regional renewal. Regional Studies 31(5): 491–503. Mudambi, R. 2002. Knowledge management in multinational firms. Journal of International Management 8(1): 1–9. Mudambi, R. 2008. Location, control and innovation in knowledge-intensive industries. Journal of Economic Geography 8(5): 699-725. Mudambi, R., Piscitello, L., & Rabbiosi, L. (2014). Reverse knowledge transfer in MNEs: subsidiary innovativeness and entry modes. Long Range Planning 47(1-2): 49-63.

Mudambi, R., Li, L., Ma, X., Makino, S., Qian, G. & Boschma, R. 2018. Zoom in, zoom out: Geographic scale and multinational activity. Journal of International Business Studies 49: 929–941 Nohria, N. & Ghoshal, S. 1997. The Differentiated Network: Organizing Multinational Corporations for Value Creation. San Francisco: Jossey-Bass Publishers. Owen-Smith, J. & Powell, W.W. 2004. Knowledge networks as channels and conduits: The effects of spillovers in the Boston biotechnology community. Organization Science 15(1): 5-21. Papanastassiou, M., Pearce, R. & Zanfei, A. 2020. Changing perspectives on the internationalization of R&D and innovation by multinational enterprises: A review of the literature. Journal of International Business Studies 51(4): 623-664. Pavitt, H. 1991. Key characteristics of the large innovating firm. British Journal of Management 2(1): 41-50. Phene, A, & Almeida, P. 2008. Innovation in multinational subsidiaries: The role of knowledge assimilation and subsidiary capabilities. Journal of International Business Studies 39(5): 901-919. Phene, A. & Tallman, S. 2018. Subsidiary development of new technologies: managing technological changes in multinational and geographic space. Journal of Economic Geography 18(5): 1121-1148. Porter, M.E. 1990. The Competitive Advantage of Nations. New York: Free Press. Porter, M.E. 1998. Clusters and the new economics of competition. Harvard Business Review 76 (November-December): 77-90. Qiu, R. & Cantwell, J. 2018. The international geography of general purpose technologies (GPTs) and internationalisation of corporate technological innovation. Industry and Innovation 25(1): 1-24. Rigby, D.L. & Essletzbichler, J. 1997. Evolution, process variety, and regional trajectories of technological change in US manufacturing. Economic Geography 73: 269-284. Rigby, D.L. & Essletzbichler, J. 2006. Technological variety, technological change and a geography of production techniques. Journal of Economic Geography 6(1): 45-70. Rigby, D. L. 2015. Technological relatedness and knowledge space: entry and exit of US cities from patent classes. Regional Studies 49(11): 1922-1937. Saxenian, A.L. 1994. Regional Advantage: Culture and Competition in Silicon Valley and Route 128. Cambridge, MA: Harvard University Press.

Scalera, V. G., Perri, A. & Hannigan, T. J. 2018. Knowledge connectedness within and across home country borders: Spatial heterogeneity and the technological scope of firm innovations. Journal of International Business Studies 49(8): 990-1009. Singh, J. 2008. Distributed R&D, cross-regional knowledge integration and quality of innovative output. Research Policy 37(1): 77-96. Song, J., Asakawa, K. & Chu, Y. 2011. What determines knowledge sourcing from host locations of overseas R&D operations? A study of global R&D activities of Japanese multinationals. Research Policy 40(3): 380-390. Sonn, J. W., & Storper, M. 2008. The increasing importance of geographical proximity in knowledge production: an analysis of US patent citations, 1975–1997. Environment and Planning A 40(5): 1020-1039. Sorenson, O., Rivkin, J. and Fleming, L. 2006. Complexity, networks and knowledge flow. Research Policy 35: 994-1017. Storper, M. 1997. The Regional World: Territorial Development in a Global Economy. New York: Guilford. Storper, M., & Venables, A. J. 2004. Buzz: Face-to-face contact and the urban economy. Journal of Economic Geography 4(4): 351–370. Tödtling, F., Asheim, B. & Boschma, R. 2013. Knowledge sourcing, innovation and constructing advantage in regions of Europe. European Urban and Regional Studies 20: 161-169. Tödtling, F., Lehner, P. & Trippl, M. 2006. Innovation in knowledge intensive industries: The nature and geography of knowledge links. European Planning Studies 14(8): 1035-1058. Torre, A. & Rallet, A. 2005. Proximity and Localization. Regional Studies 39(1): 47-59. Trippl, M., Tödtling, F. & Lengauer, L. 2009. Knowledge sourcing beyond buzz and pipelines: Evidence from the Vienna software sector. Economic Geography 85: 443-462.
Van Eck, N. J. & Waltman, L. 2009. How to normalize cooccurrence data? An analysis of some well‐known similarity measures. Journal of the American Society for Information Science and Technology 60(8): 1635-1651. Van der Loo, M. P. 2014. The stringdist package for approximate string matching. The R Journal 6(1): 111-122. Von Hippel, E. 1988. The Sources of Innovation. New York: Oxford University Press. Wang, S. & Zhao, M. 2018. A tale of two distances: a study of technological distance, geographic distance and multilocation firms. Journal of Economic Geography 18(5) 1091-1120.

Weitzman, M.L. 1998. Recombinant growth. The Quarterly Journal of Economics 113(2): 331-360. Whittington, K., Owen-Smith, J. & Powell, W.W. 2009. Networks, propinquity, and innovation in knowledge-intensive industries. Administrative Science Quarterly 54: 90-122. Yeung, H. W. C. 2018. Economic geography and international business. In Cook, G., Johns, J., McDonald, F., Beaverstock, J. & Pandit, N. (eds.) The Routledge Companion to the Geography of International Business. Abingdon: Routledge. pp 177-189.
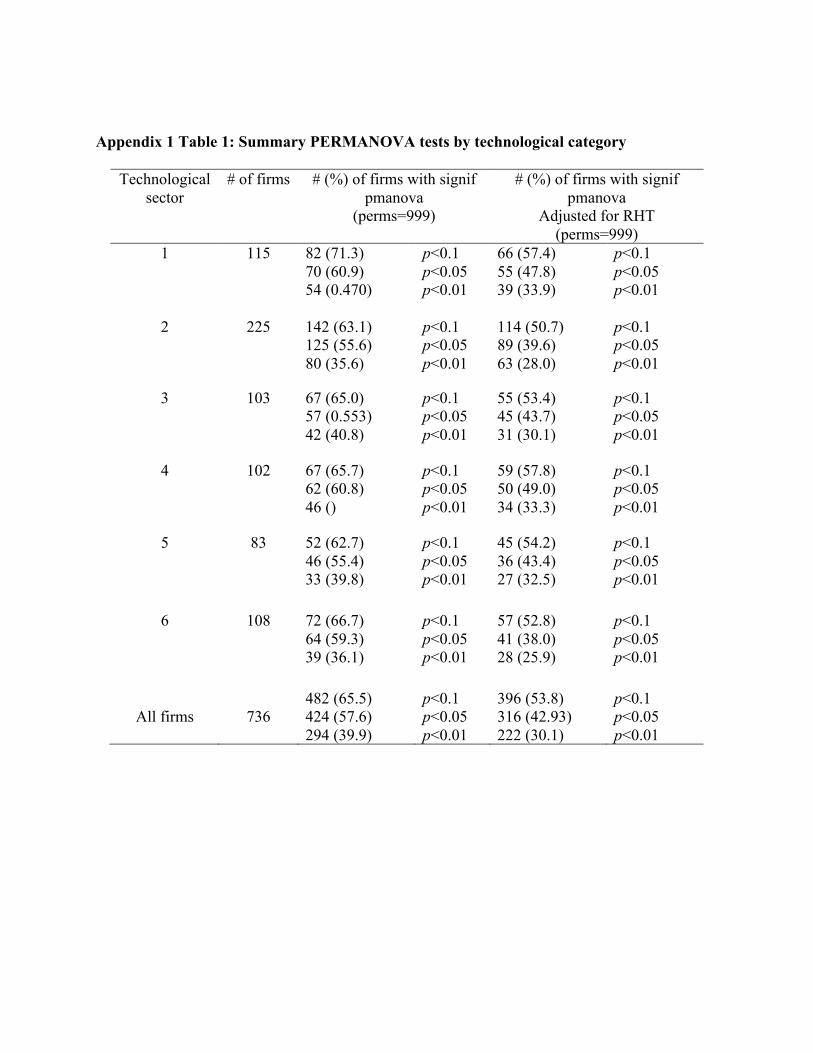
Appendix 1 Table 1: Summary PERMANOVA tests by technological category
Technological sector
# of firms # (%) of firms with signif pmanova
(perms=999)
# (%) of firms with signif pmanova
Adjusted for RHT (perms=999)
1 115 82 (71.3) 70 (60.9) 54 (0.470)
p<0.1 p<0.05 p<0.01
66 (57.4) 55 (47.8) 39 (33.9)
p<0.1 p<0.05 p<0.01
2 225 142 (63.1) 125 (55.6) 80 (35.6)
p<0.1 p<0.05 p<0.01
114 (50.7) 89 (39.6) 63 (28.0)
p<0.1 p<0.05 p<0.01
3 103 67 (65.0) 57 (0.553) 42 (40.8)
p<0.1 p<0.05 p<0.01
55 (53.4) 45 (43.7) 31 (30.1)
p<0.1 p<0.05 p<0.01
4 102 67 (65.7) 62 (60.8) 46 ()
p<0.1 p<0.05 p<0.01
59 (57.8) 50 (49.0) 34 (33.3)
p<0.1 p<0.05 p<0.01
5 83 52 (62.7) 46 (55.4) 33 (39.8)
p<0.1 p<0.05 p<0.01
45 (54.2) 36 (43.4) 27 (32.5)
p<0.1 p<0.05 p<0.01
6 108 72 (66.7) 64 (59.3) 39 (36.1)
p<0.1 p<0.05 p<0.01
57 (52.8) 41 (38.0) 28 (25.9)
p<0.1 p<0.05 p<0.01
All firms
736
482 (65.5) 424 (57.6) 294 (39.9)
p<0.1 p<0.05 p<0.01
396 (53.8) 316 (42.93) 222 (30.1)
p<0.1 p<0.05 p<0.01