geographical analysis of eateries: a case of ibadan north, oyo … · geographical analysis of...
TRANSCRIPT

Brazilian Geographical Journal: Geosciences and Humanities research medium, Ituiutaba, v. 4,
n. 2, p. 561-583, jul./dec. 2013
561
ARTICLES/ARTIGOS/ARTÍCULOS/ARTICLES
Geographical Analysis of Eateries: a case of Ibadan North, Oyo state, Nigeria Doctor Ojo-Kolawole A. Olumide Human Resource Person, Total Nigeria Plc. 4, Afribank Street Victoria Island, Lagos, Nigeria. E-mail: [email protected] Doctor Amanambu C. Amobichukwu Department of Geography, University of Ibadan, Ibadan, Oyo state, Nigeria. E-mail: [email protected]
ABSTRACT Eateries are business franchises which predominantly deal in the sale of prepared food. The paper examines the spatial pattern of eateries in Ibadan North Local Government Area of Oyo-State. Also, the nature of patronage was examined and explained within the context of this research work. The Nearest Neighbour Analysis (NNA) was used to analyze the distribution of eateries within the study area and it was observed that the distribution of eateries within the local government area assumed a clustered pattern as against what was hypothetically stated. An Rn value of 0.38815 (P <0.05) indicates a clustered pattern of distribution. Frequency tables and mean rank values were used to reveal the most important factor that determines the location of eateries in space and it was discovered that proximity to customers was the most important factor of location. The mean rank value for this factor was 6.79 being the closest to the maximum of 8. The result of the correlation analysis which was used to test for the relationship between the frequency of patronage of eateries and the
Brazilian Geographical Journal: Geosciences and Humanities research
medium
UFU
ARTICLE HISTORY
Received: 10 Octuber 2013 Accepeted: 22 December 2013
PALAVRAS-CHAVE: Padrão espacial Correlação localização

Brazilian Geographical Journal: Geosciences and Humanities research medium, Ituiutaba, v. 4,
n. 2, p. 561-583, jul./dec. 2013
562
distance of patrons form the eateries envisaged that there is a significant relationship between the frequency of patronage and the distance of patrons form the eateries. The R value of -0.251 (P < 0.05) shows that an inverse relationship exists between the two variables of interest. In addition to this, the chi-square value of 39.187 (P < 0.05) indicates that there is significant relationship between the frequency of patronage and the occupation of patrons. Also, the X2 value of 22.030 (P < 0.05) indicates that there is a significant association between marital status and the frequency of patronage. RESUMO: ANÁLISE GEOGRÁFICA DE RESTAURANTES: UM CASO DE IBADAN NORTE, ESTADO DE OYO, NA NIGÉRIA. Restaurantes são franquias de negócios que lidam predominantemente na venda de alimentos preparados . O artigo examina o padrão espacial de restaurantes em Ibadan Norte área do governo local de Oyo - Estado . Além disso , a natureza de patrocínio foi examinado e explicado no contexto do presente trabalho de pesquisa . A análise utilizada foi da denominada de Neighbour Analysis( NNA) que apresenta a distribuição de restaurantes na área de estudo e onde foi possível observar que a distribuição de restaurantes dentro da área assume um padrão de cluster. Um valor Rn de 0,38815 ( P < 0,05 ) indica um padrão agrupado de distribuição. As tabelas de freqüência e média valores de classificação foram usadas para revelar o fator mais importante que determina a localização de restaurantes no espaço e aferiu-se que a proximidade com os clientes foi o fator mais importante de sua localização. O valor de classificação média para este fator foi de 6,79 sendo o mais próximo do máximo de 8. O resultado da análise de correlação , que foi usado para testar a relação entre a frequência de patrocínio de restaurantes e da distância dos patronos formar os restaurantes previsto que existe uma relação significativa entre a freqüência de patrocínio ea distância dos patronos formar a restaurantes. O valor de R de -0,251 ( P < 0,05 ) mostra que existe uma relação inversa entre as duas variáveis de interesse . Além disso , o valor do qui-quadrado de 39,187 (P < 0,05) indica que existe relação significativa entre a freqüência de patrocínio ea ocupação de clientes. Além disso, o valor de X2 de 22,030 (P < 0,05) indica que há uma associação significativa entre o estado civil ea freqüência de patrocínio.
KEY-WORDS: Padrão espacial Correlação Locação

Brazilian Geographical Journal: Geosciences and Humanities research medium, Ituiutaba, v. 4,
n. 2, p. 561-583, jul./dec. 2013
563
RESUMEN: ANÁLISIS GEOGRÁFICO DE RESTAURANTES: UM CASO DEL NORTE DE IBADAN, PROVINCIA DE OYO, NIGERIA. Los restaurantes son franquicias de negocios que se ocupan principalmente en la venta de alimentos preparados. El artículo examina el modelo espacial de restaurantes en “Ibadan Norte” área del gobierno local de Oyo – Estado. Además de eso, la naturaleza de patrocinio ha sido examinada y explicada en el contexto del presente trabajo de investigación. El análisis utilizado fue de la denominada de “Neighbour Analysis( NNA)” que muestra la distribución de restaurantes en el área de estudio y donde se observó que la distribución de los restaurantes en la zona Adquiere un modelo “cluster”. Un valor Rn de 0,38815 ( P < 0,05 ) indica un modelo de distribución agrupado. Las tablas de frecuencia y media de valores de clasificación se utilizaron para revelar el factor más importante que determina la ubicación de los restaurantes de la zona y se señaló que la proximidad con los clientes fue el factor más importante de su ubicación. El valor de clasificación media para este factor fue de 6,79 siendo lo más próximo al máximo de 8. El resultado del análisis de correlación, que se utilizó para probar la relación entre la frecuencia de patrocinio de los restaurantes y la distancia de los patronos en formar los restaurantes previstos, comprobó que existe una relación significativa entre la frecuencia de patrocinio y la distancia de los patronos para formar los restaurantes. El valor de R de -0,251 ( P < 0,05 ) muestra que hay una relación inversa entre las dos variables de interés . Además de eso, el valor del qui-cuadrado de 39,187 (P < 0,05) indica que existe relación significativa entre la frecuencia de patrocinio y la ocupación de clientes. Por otra parte, el valor de X2 de 22,030 (P < 0,05) indica que existe una asociación significativa entre el estado civil y la frecuencia de patrocinio.
Introduction
The pace of modern life is fast. We seek fast transportation, fast communication, fast computers, fast photos, fast music, fast repairs, and fast services from the businesses we patronize. It is from the recent of these thatfast food which is served at various eatery centers all around the world was discovered. The fast food revolution was a quick success and within
PALABRAS CLAVE: Modelo espacial Correlación Ubicación
Brazilian Geographical Journal: Geosciences and Humanities research medium, Ituiutaba, v. 4,
n. 2, p. 561-583, jul./dec. 2013
564
several decades after its evolution, it was conquering the world at a prolific rate (Iziren, 2007).
Eateries are specialized retail outlets which deal specifically in the sale of prepared food items, commonly called fast foods. These retail outlets existed in earlier periods, but their significance and growth only became pronounced and rapid in recent times. The unexpected growth of the eatery industry can be attributed to the emerging and the contagious spread of urbane lifestyle. This spread of lifestyle can however be associated to globalization of the world economy. Eateries in this broad sense will encompass all retail outlets known to sell prepared food, but to achieve the purpose of this study and justify its aims and objectives, an operational definition goes thus:
“Eateries are fast food retails centers which are characterized by a relatively high level of hygiene, a comfortable eating environment, planned and aesthetic architectural design, uniformed personnel and a registered trade name’’
The definition given above will be used to streamline the focus and narrow the scope of the academic project.
The phenomenal growth of eateries is an evidence of the current trend of urbanization in the modern world. Food centers where fast foods are served in minutes are speedily becoming the ideal way of feeding especially for the well to do urban dwellers (Iziren, 2007). The sudden rise of the fast food business can be attributed to the demand for ready-made food for fast consumption which suits the fast lifestyle that is obtainable in the busy urban centers of the world. The growth and spread of eateries has captured geographic interest and therefore there is a need for geographic analysis. This project tries to explore the various factors that affect the location of these eateries in space as well as analyzing the nature of their patronage.
Although, fast foods and eateries are often viewed as a representation of modern technology, the concept of "ready-cooked food" is as old as cities themselves; unique identifications of fast foods are historically identifiable in various cultures. It should be noted however that what we refer to as eateries in this present day had long existed in some form or the other before modernization stepped into it. Despite the fact that there are no records that chronicles the initial existence of these eateries in Nigeria, it should be noted that the eatery business had existed in some initial form.
Moreover, it should be noted that these eatery centers are mostly located around key functions that could supply the needed amount of population necessary to sustain the trade through consistent and regular demand for food e.g. around major facilities and residential or commercial areas. The subsequent expansion of eatery business from the sale of local snacks to the sale of foreign cuisines ushered the industry into another stage of growth. Ever since, the eatery or simply put the fast food industry has metamorphosed into a more sophisticated industry where expatriates are

Brazilian Geographical Journal: Geosciences and Humanities research medium, Ituiutaba, v. 4,
n. 2, p. 561-583, jul./dec. 2013
565
taking over the trade in ready made food and taking it to standards where continental cuisine were included.
Geographic literature has shown that there has been several works on the location and spatial pattern of facilities in space. However due to the nature of the eatery industry as a contemporary phenomenon, there has been little effort to explain its spatial pattern and distribution.This study is an academic attempt to provide explanations to several geographic questions about the spatial pattern of eateries within the study area. Therefore, this study explains why eateries are located where they are and also the possible factors that affect their location. The study also provides explanation on the nature and pattern of patronage. In exploring the nature of patronage, the study tries to shed light on matters such as; who patronizes, how often, preferences, frequency of patronage and other indices on which patronage can be analyzed.
This study is therefore a pragmatic attempt to examine and provide possible explanations to the spatial patterns, the factors responsible for the evolving spatial pattern and the nature of patronage.
Purpose of the study The prolific growth of eateries in Nigeria is gradually becoming a
phenomenon of interest. Over short periods, growth and expansion occurs in the fast food industry as newer entrants are taking their own place in the pool of fast food competition. It can assumed that not all urban dwellers can afford to pay for the relatively high cost services that these eateries render, yet it should be noted that the patronage of these centers is steadily increasing. Despite health specification that fast foods may cause serious health complications in human, the well-to-do urban dwellers still find it a pleasure to patronize eateries for most of what they eat.A mere observation of the spatial pattern and distribution of the eateries within the study areawill show that the most eateries are located around and towards areas of high industrial activities and areas of high or medium class residential. It is intellectual to mention at this juncture that the location of eateries may not be by chance or by the toss of a fair die. Several factors would have been considered before the location of these eateries where selected hence the emerging spatial pattern.It will indeed be crude and unscientific to say that the location of these eateries is by chance; hence, the location of these eateries is somehow patterned and characterized by certain location factors. Geography is a discipline of spatial variation; hence, every phenomenon whose distribution varies over space will and would always attract geographic interest. It will be interesting and geographically relevant to know and explain where, how and why eateries are located in space. Therefore, there is an evidence of a geographic flavour in the spatial distribution of eateries thus, it is worthy of a geographical analysis.
The problem statement of this academic project will then include; the necessity to provide adequate explanations to the spatial pattern of eateries

Brazilian Geographical Journal: Geosciences and Humanities research medium, Ituiutaba, v. 4,
n. 2, p. 561-583, jul./dec. 2013
566
and the nature of patronage within the study area. Efforts in this study would be directed towards the discovery of the various factors that brought about the resulting spatial pattern of eateries and also the revelation of the nature of patronage.
Aims and objectives This study aims at explaining the spatial pattern of eateries in Ibadan
North Local Government Area of Oyo-State and the nature and pattern of patronage. The objectives includes;
1. To explain the spatial distribution of eateries in the study
area. 2. To determine the factors that influences the location of
eateries. 3. To explain the pattern of patronage.
Research hypotheses
1 The distribution of eateries within the study area is random. 2 There is a significant relationship between the distance of
patrons from eateries and the frequency of their patronage. The study área
Ibadan is located near the forest grassland boundary of South-western Nigeria. Akinola (1963) defined it asan area extending for about 55km from Asejire in the east to Agemo in the west and about 70km from Iroko in the north to Mamu in the south. It has an estimated areal extent of 130.5km2
and an estimated population of about 2.28 million people (Population census results, 2006). Ibadan is approximately 150km from Lagos by the most direct route.The city has a mean annual rainfall of 1259 mm per annum with a mean minimum temperature of 25.8°C and a mean maximum temperature of 29.5°C (Filani et al. 1994). Ibadan is the capital of Oyo-.Ibadan has eleven local government áreas. It is interesting to know that the local government area has twelve wards in it.The Ibadan north local government was created by the Federal Military Government on September 27th 1991. It was carved out of the defunct Ibadan Municipal Government (IMG) along with four others. The jurisdiction of Ibadan north local government covers the areas between Beere round about to Gate, Idi-ape to Bashorun and Lagos-Ibadan Expressway. It also covers the State secretariat, University of Ibadan through Sango and Mokola roundabout.
The headquarters of the local government is Bodija, but due to accommodation problems, the local government started using quarter 87 Agodi GRA as its temporary secretariat before moving to its present location

Brazilian Geographical Journal: Geosciences and Humanities research medium, Ituiutaba, v. 4,
n. 2, p. 561-583, jul./dec. 2013
567
at the former second mechanized division Agodi Ibadan. The local government area being close to the inner city and within the metropolis has the entire characteristics of an urban center. The major occupational categories of the inhabitant of the local government include: Civil servants, Private entrepreneurs, Professionals, Private sector employees and Traders. It is quite fascinating to know that one of the most important food stuff market (i.e. Bodija) is located within the local government area. Being one of the largest local government areas in Ibadan, the local government is well networked with two important transport artery of Nigerian transportation system. These include both the Lagos - Ibadan express road and the Lagos - Kano railway system.
Residential areas of the local government are of differentiated categories. Figure 4 show that there are areas of high, medium and low class residential. The high class residential area spans across Agodi G.R.A., New Bodija, Kongi, Ikolaba, Ashi and some part of Old Bodija which is already experiencing commercial transformation. The medium class residential areas include Mokola and Sango, while the low class residential encapsulates Agbowo, Beere, Oke-Aremo, Yemetu, Oke-Are and parts of old Ashi. Major public facilities within the local government includes the University of Ibadan, the University College Hospital (U.C.H.), the Federal Polytechnic, the State’s Secretariat and the State’s House.
In terms of physical and social characteristics, it has a land area of 38.92km2 which is approximately 4.7% of the total land area of the city. It is one of the most populated local government area with an estimate of 306,795 inhabitants.Majority of the population within the study area are private sector employed (National population census 2006). A good number of its Civil Servants live predominantly around Bodija estate, Agbowo, Sango, Mokola and the University of Ibadan Quarters. It is also interesting to know that the local government is characterized by a relatively high level of industrial growth, which is as a result of the industrial waves from the central business district (CBD) i.e. Dugbe that is close to it. Recreational centers that falls into the local government area includes the Zoological Garden in the University of Ibadan, the Botanical Garden in the University of Ibadan as well as the Trans Amusement. Methodology
This research employed two major types of data; primary and secondary data.
Primary data
The primary data encompass all data extracted from the field which include observations, interviews and questionnaires. However, the questionnaires were in two parts. The fist type of questionnaire targets the Owners/Managers of eateries, with the expectation of deriving information such as the factors of location, description of location, reasons for the

Brazilian Geographical Journal: Geosciences and Humanities research medium, Ituiutaba, v. 4,
n. 2, p. 561-583, jul./dec. 2013
568
choice of location and nature of services rendered etc. On the other hand, the second class of questionnaires was targeted at the end users of these eateries, Data pertaining to the socio-economic status of respondents, reasons for patronage and frequency of patronage was sourced using this second questionnaire. It should be mentioned here that the questionnaires was a hybrid of the open-ended questionnaire and the close-ended questionnaire. Primary data was also sourced from field measurement and observation using a global positioning system
Secondary data:
Secondary data consist of information obtained from secondary sources. These secondary data include administrative maps of the study area which was sourced from secretariat of the Local government headquarters, the Department of Geography (University of Ibadan) and other institutions such as the International Institute of Tropical Agriculture (IITA). Others were sourced from Articles, Journals from the library archives and the several other web - based academic archives.
Data collection procedure
The study area was delineated into axes based on the relative concentration of eateries. Questionnaires were administered at each eatery located within the study area. A total of 230 questionnaires were used on the end-users while a questionnaire was administered on each of the managers at the 14 branded eateries captured in the studies. The delineation of the study area resulted into two major axes which are;
1. U.I. - Agbowo - Bodija - Agodi Axis. 2. Samonda – Mokola roundabout Axis. The basis of the amount of questionnaire used was due to the fact that
majority of residents within the local government may not be able to patronize eateries thus the amount of questionnaires used will be a good representation of those who can afford the service of an eatery. The delineation was due to the fact that the eateries are located along these areas of the local government while majority of the other areas are low class residential areas whose population cannot give an eatery franchise a chance to break - even.
The questionnaires were administered to owners/managers of eateries found within the delineation of the study area. Also, a GPS field survey was carried out so as to obtain the coordinates of these eateries. The northings and the eastings values were recorded and transferred into Microsoft excel format for further analysis.
Data analysis techniques
The data analysis techniques for this project involves the use of descriptive statistics such as Tables, Percentages, Frequencies and Charts (such as the Bar and Pie charts) and line graphs. All these were used to

Brazilian Geographical Journal: Geosciences and Humanities research medium, Ituiutaba, v. 4,
n. 2, p. 561-583, jul./dec. 2013
569
analyze the data collected. In addition to this, inferential statistical tests such as the chi-square (x2), Correlation analysis, Z-test and the Nearest Neighbor Analysis (NNA) was used to test the data collected in tune with the set hypotheses.
The chi-square analysis was used to compare the expected and the observed frequency of occurrence and hence, test if significant association exists among the variables to be tested.
X2 = (O-E) 2
E
Where; X2 = Chi-square Value O = observed variable. E = expected variable.
The chi-square analysis was used to reveal the level of significance that
each factors of location posses in determining the location of an eatery as well as the association between several other variables.
Correlation analysis was used to explain the relationships between variables of interest. It was used to unravel the relationship between the frequency of patronage and the distance of patrons from these eateries. The correlation analysis was used to determine and express the type of relationship between two variables which usually includes a dependent variable and an independent variable. The relationship could either be positive or negative in nature. A negative relationship results when the R value returned has a negative sign thus; the relationship is inverse. However, a positive relationship implies that the R value is not negative hence a direct relationship between the two variables.
To calculate the R value, the formula below is used:
R= 1 (Y- ) (X- ) N Y Y
Where Y is the dependent variable, X is the independent variable,
is the mean value of Y, is the mean value of X.
is the standard deviation.
Also, the Nearest Neighbor Analysis (NNA) was used to calculate and test the distributional pattern of these eateries in space. Before this analysis was carried out, Geographic information system (Arc View 3.3) was used to analyze data collected with the global positioning system (GPS). The data collected using the global positioning system was imported into the arc view environment and then superimposed on a geo-referenced administrative map of the local government area, thereby revealing a visual understanding of the distribution of these eateries within the local government area. The
Brazilian Geographical Journal: Geosciences and Humanities research medium, Ituiutaba, v. 4,
n. 2, p. 561-583, jul./dec. 2013
570
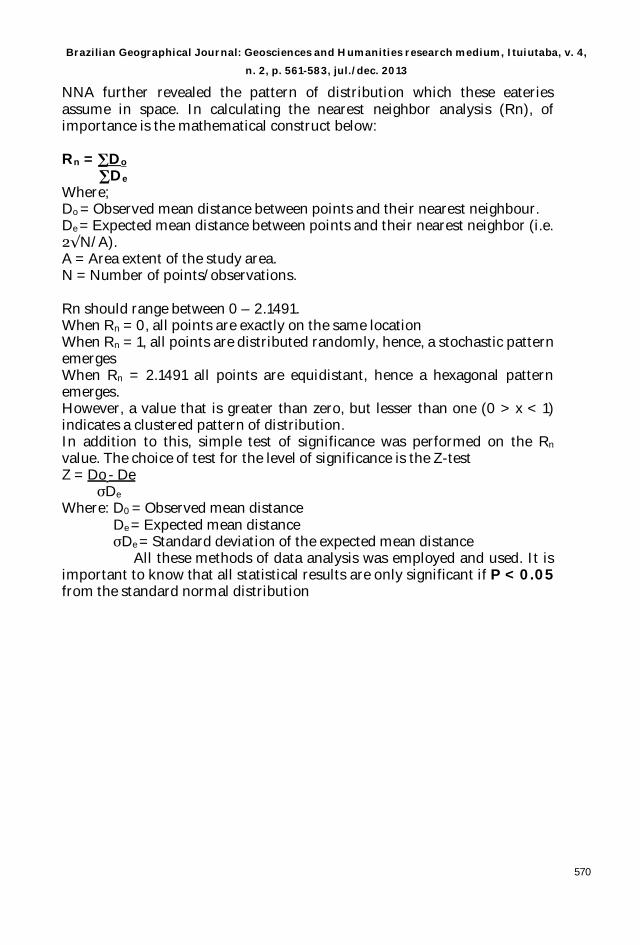
NNA further revealed the pattern of distribution which these eateries assume in space. In calculating the nearest neighbor analysis (Rn), of importance is the mathematical construct below:
Rn = Do
De
Where; Do = Observed mean distance between points and their nearest neighbour. De = Expected mean distance between points and their nearest neighbor (i.e.
N/A). A = Area extent of the study area. N = Number of points/observations. Rn should range between 0 – 2.1491. When Rn = 0, all points are exactly on the same location When Rn = 1, all points are distributed randomly, hence, a stochastic pattern emerges When Rn = 2.1491 all points are equidistant, hence a hexagonal pattern emerges. However, a value that is greater than zero, but lesser than one (0 > x < 1) indicates a clustered pattern of distribution. In addition to this, simple test of significance was performed on the Rn value. The choice of test for the level of significance is the Z-test Z = Do - De De
Where: D0 = Observed mean distance De = Expected mean distance De = Standard deviation of the expected mean distance
All these methods of data analysis was employed and used. It is important to know that all statistical results are only significant if P < 0.05 from the standard normal distribution

Brazilian Geographical Journal: Geosciences and Humanities research medium, Ituiutaba, v. 4,
n. 2, p. 561-583, jul./dec. 2013
571
Results and Discussions Spatial pattern of eateries
This section presents the results of the data analysis on the locational pattern of eateries within the study area. It features the summary of the nearest neigbour analysis of eateries within the study area and the explanation of the factors that determine location. This section also presents the result of the analysis carried out on the relative significance of the factors of industrial location on the locational decisions of eateries. The analysis reveals the level of importance these factors of location impact on the final locational decision of the eateries. The relative importance of the factors of location was determined using the responses and rankings supplied by the managers of these fast food outlets.
Hypothesis 1 H0 - The distribution of eateries within the study area is random.
Figure 1: The spatial distribution of eateries within the local government area.

Brazilian Geographical Journal: Geosciences and Humanities research medium, Ituiutaba, v. 4,
n. 2, p. 561-583, jul./dec. 2013
572
To test for hypothesis 2, table 1 below gives a summary of nearest neigbour
analysis for the fourteen eateries located within the local government area.
Table 1: Summary of Nearest Neighbour Analysis of Eateries
Rn = Do
De
Where Do is 0.03989
De is 0.1049999
Thus, the nearest neighbour values as follows
Rn = 0.03989
0.1049999
Rn = 0.379905 (clustered pattern) The implication of the Rn = 0.379905 is that there is that there is a Clustered distribution of eateries within the study area. Thus we reject Ho and accept H1 which says that the distribution of eateries within the local government is not random.
Hence; H0 rejected H1 accepted To further test for the level of significance of this nearest neighbour result,
the Z-test of significance was applied. The Z-score was 4.37965 (P < 0.05). This implies that The Z-test of significance further reiterate that Rn value of 0.379905is significant.
The distribution of eateries in the study area is clustered and not random. The result of the nearest neighbour analysis can be attributed to the fact that eateries tend to locate in area that can guarantee a sustainable level of customers hence patronage that will induce profitability. From figure 1 above, it can be observed that most of these eateries were located in the high class residential areas of study area. Areas such as New Bodija, Old Bodija, Ikolaba, and Kongi had a relatively high amount of these eateries. It can also be deducted that these eateries tend to gravitate towards major facilities such as Universities, State houses and Bank streets as the case is in Old Bodija. The clustered pattern can be attributed to the market oriented nature of the fast food industry. Therefore, eateries within the study area clustered around
N Area of study (km2)
Do (km) De (km) Rn value Description Z-score
14 38.92 0.03989 0.1049999 0.379905 Clustered 4.43867

Brazilian Geographical Journal: Geosciences and Humanities research medium, Ituiutaba, v. 4,
n. 2, p. 561-583, jul./dec. 2013
573
places where they can obtain the threshold population which will enable profitability. This is in consonance the concept of threshold which the central place theory posits. Factors of location
Certain factors of industrial location have played their part in the locational pattern of eateries. These factors and their level of importance shall be revealed in subsequent paragraphs of this research.
Table 2 Mean rank of the factors of location
Descriptive Statistics
14 6.79 .80 1 414 1.29 1.86 1 814 2.64 1.39 3 814 4.79 1.12 2 514 5.14 1.03 2 514 1.86 1.03 4 814 .86 .95 5 814 4.79 1.19 2 6
0 . . . .
proiximity to potential customers rankproximinty to raw materials rankavailability of affordable land rankgood road network rankcloseness to a major facility rankpersonal consideration ranknearness to competitors ranknature and style of menu rankother, please specify rank
N Mean Std. Deviation Minimum Maximum
Table 2 above shows a summary of mean rank values of the factors of
production. The rationale behind the mean rank table is that the highest mean value of 8 will be recorded for the factor which was ranked 1st by all the respondents. This means that mean rank values that are closest to 8 represent the most important factor of location. The table shows that proximity to potential customers has the highest mean of 6.79, followed closely followed by closeness to a major facility which had the mean value of 5.14. Table 2 is a summary of the mean rank ofproximity to potential customers (6.79) as a factor that influences the location of eateries. It is obvious that this factor contributed to their location. This is majorly due to the fact that the eatery industry is a market oriented sector. At such, the closeness and proximity to customers play a very vital role in determining the location of the eatery and more importantly ensure profitability. This response explains why most if not all of these eateries were located around places that could generate a high amount of patronage
Closeness to a major facility is very important in explaining the location of 12 of the eateries within the local government area due to the fact that it is acknowledged it as a factor that influenced their decision. These facilities include Shopping malls, Banks, Academic Institutions, and Secretariats. The

Brazilian Geographical Journal: Geosciences and Humanities research medium, Ituiutaba, v. 4,
n. 2, p. 561-583, jul./dec. 2013
574
facilities in question are essentially those that are capable of generating potential customers hence, sales.
Other factors that were successful enough to make the average mean rank value of 4.00 are the availability of good road network and nature & style of menu which both had a mean value of 4.79 respectively. Most of these eateries are located at road junctions and road side. Therefore, the availability of a good road network is a factor that affects their location. The implication of this is that good road network is a factor of location. Other factors have their mean rank value below the average of 4.00. However, it can be explained that despite the spatial agglomeration of some of these eateries, proximity to potential competition is not a factor of location of choice by the eatery managers. In essence, this result is antithesis to what Hotelling’s locational interdependence theory explains. Though he professed that firms seeks to maintain a location closest to the competitor so as to guarantee a good portion of the market and secure profit; but these eateries did not accept that fact. It is quite obvious despite the managers’ claim of non-concern with the closeness to competitors that these eateries are located near each other; possibly to ensure a share of the market.
The availability of affordable land (2.64) is not a major factor influencing location. The implication of this is that land is required for location but the issue of affordability is not necessarily a factor which influences the location of these eateries. To explain further, it can be noticed that most of these eateries were located in areas where the land rent is relatively high. This implies that the eatery franchise can afford to pay a high economic rent compared to some other commercial activities hence, its location. Availability of affordable land is not an important factor in the location of eateries.
The result also shows a clear indication that the proximity to raw materials (1.29) is not an important factor of location. This is likely due to the fact that what these eateries sell are mostly prepared at a main source location from where it is later transported to all the branches at various location across the study area. In essence, the fast foods are prepared at a central location. Each retail outlet is well equipped with heating systems and large microwaves which are used to reheat prepared food. It can thus be concluded that proximity to raw materials is not a factor of location.
The implication of this is that proximity to potential customers is the most important factor of location. To further stress this finding, figure 4.2 below shows the mean values of the factors of location.

Brazilian Geographical Journal: Geosciences and Humanities research medium, Ituiutaba, v. 4,
n. 2, p. 561-583, jul./dec. 2013
575
Pro
x.to
cus
tom
ers
Pro
x. to
raw
mat
.
Affo
rdab
le la
nd
Goo
d ro
ad n
et.
Pro
x.to
maj
or fa
cilit
y
Per
sona
l con
side
ratio
n
Prox
.to c
ompe
titor
s
Nat
ure&
styl
e of
men
u
Locational Factors
0.00
2.00
4.00
6.00
Mea
n R
ank
Figure 2 Bar chart showing the mean rank value of Factors of location
Figure 3: Age structure of patrons

Brazilian Geographical Journal: Geosciences and Humanities research medium, Ituiutaba, v. 4,
n. 2, p. 561-583, jul./dec. 2013
576
Figure 3 above shows the frequency of the age distribution of the respondents. 28.3% of the respondents were 22-25 years, followed closely by 24.8% of those between the age group of 26-30 years. Also, 11.7% were 15-21 years, 7.8% were less than 15 years of age while 13.0% were within the age range of 31-35 years.In addition to this, 14.3% were above 35 years of age. The descriptive table and the bar chart have shown that proximity to potential customers is the most important factor of location. Due to the market oriented nature of the eatery industry, proximity to potential customers becomes a very crucial factor of location. According to a field survey carried out by the author in 2008, almost all these eateries are located around large customer clusters such as residential areas which include New Bodija estate and the Ikolaba estate; major facilities such as the University of Ibadan and the government secretariat; other institutions such as the several financial institutions, telecommunication firms, insurance firms, shopping malls and consultant firms that lines up the Agbowo-Bodija-secretariat axis of the local government area. All these facilities generate a large amount of customers who are capable of affording the cost of fast foods. The fast food industry is essentially market oriented and customer attached; due to the fact that it requires a good amount of customer base to break even and ensure future profitability. The pattern of patronage The pattern of patronage focuses on the socio-economic characteristics of end-users and the nature of patronage. The result reflects these characteristics by the use of graphs, charts, frequencies, percentages etc. Also, it shows the impact of patrons’ socio-economic and demographic characteristics on the frequency of patronage using the chi-square test of statistical significance. In addition to these, the impact of distance on patronage was determined using correlation analysis. The hypotheses on the stake here is hypothesis 3 which is given below as:
H0 - There is a significant relationship between the distance of patrons from eateries and the frequency of patronage.
Based on the results of the analysis, this hypothesis will be subjected to either acceptance or rejection just as the case may be.
Before the explanation of the pattern of patronage of these eateries, it will be fair enough to briefly appreciate the socioeconomic characteristics of patrons. Captured in this study is the Age structure, Marital Status, Occupation, Gender and the Educational status.
Brazilian Geographical Journal: Geosciences and Humanities research medium, Ituiutaba, v. 4,
n. 2, p. 561-583, jul./dec. 2013
577
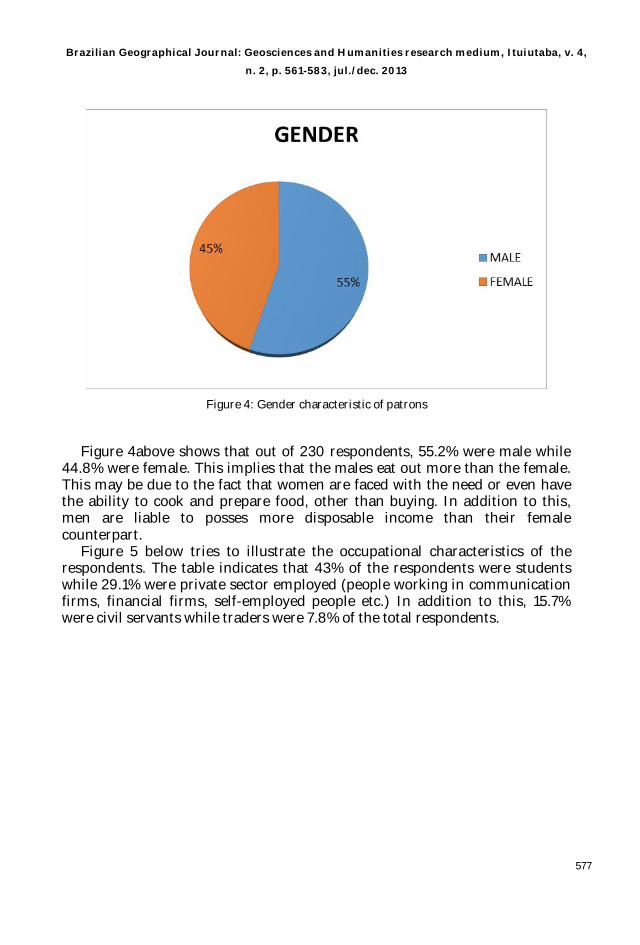
Figure 4: Gender characteristic of patrons
Figure 4above shows that out of 230 respondents, 55.2% were male while 44.8% were female. This implies that the males eat out more than the female. This may be due to the fact that women are faced with the need or even have the ability to cook and prepare food, other than buying. In addition to this, men are liable to posses more disposable income than their female counterpart. Figure 5 below tries to illustrate the occupational characteristics of the respondents. The table indicates that 43% of the respondents were students while 29.1% were private sector employed (people working in communication firms, financial firms, self-employed people etc.) In addition to this, 15.7% were civil servants while traders were 7.8% of the total respondents.

Brazilian Geographical Journal: Geosciences and Humanities research medium, Ituiutaba, v. 4,
n. 2, p. 561-583, jul./dec. 2013
578
43,0%
15,7%
29,1%
7,8%
4,3%
0,0% 10,0% 20,0% 30,0% 40,0% 50,0%
STUDENT
CIVIL SERVANT
PRIVATE SECTOR EMPLOYED
TRADE
OTHERS
OCCUPATION (%)
Figure 5: Occupational characteristics of patrons
Figure 6: Educational characteristics of the patron
Figure 6 above explains the educational status of respondents in which a whooping 78.3% of the respondents were educated to the tertiary levels (higher education). Followed by this were 17.0% of respondentsthat was educated to the secondary school level. Other educational characteristic that was discovered was 3% for primary education level and 0.9% of those who had no education and those who had other educational experiences respectively.

Brazilian Geographical Journal: Geosciences and Humanities research medium, Ituiutaba, v. 4,
n. 2, p. 561-583, jul./dec. 2013
579
Figure 7: Marital characteristics of patrons
The marital status of respondents was also explained in figure 7 above. 62.6% of the patrons were single while 30% were married. In addition to this 5.2% were widow/widower while 2.2% were divorced. The implication of this result means that unmarried singles patronize eateries more than other people within the marital categories.
Figure 8: Frequency of patronage by patrons

Brazilian Geographical Journal: Geosciences and Humanities research medium, Ituiutaba, v. 4,
n. 2, p. 561-583, jul./dec. 2013
580
Figure 8 above depicts the frequency of patronage of these eateries by the patrons. 29.6% of the patrons patronize at weekends while 16.1% patronize daily. In addition to this, 10.9% patronize once a week while 10.4% only patronize during public holidays. Also, 8.7% patronize fortnightly compared to 8.3% each for those who patronize monthly and twice a week respectively. 7.8% patronize thrice in a week.
Table 3: Distance of patrons to eateries
61 26.5 26.5 26.576 33.0 33.0 59.693 40.4 40.4 100.0
230 100.0 100.0
<500 meters500 - 1000 metersabove 1 kilometerTotal
Valid
Frequency Percent Valid PercentCumulative
Percent
Table3 above seeks to illustrate the distance of these patrons to the eateries they patronize. 40.4% said they came from a distance that is above 1 kilometer compared to 33.0% who claimed they stayed within the range of 500-1000 meters from the eatery they patronize. However, 26.5% said they came from a distance of less than 500 meters to the eatery.
Table 4: Summary of Correlation analysis result between frequency of
patronage and the distance of patrons from eateries
Correlations
1.000 -.251**. .000
230 230-.251** 1.000.000 .
230 230
Pearson CorrelationSig. (2-tailed)N
Pearson CorrelationSig. (2-tailed)N
how far is the eatery fromyour residence/work place
how often do you patronize
how far isthe eateryfrom yourresidence/work place
how often doyou patronize
Correlation is significant at the 0.01 level (2-tailed).**.
Table4 shows the result of the correlation analysis that was carried out between the distances of patrons from the eateries (x) and the frequency of patronage (y) by the patrons. The R coefficient value of -0.251 (P < 0.05)

Brazilian Geographical Journal: Geosciences and Humanities research medium, Ituiutaba, v. 4,
n. 2, p. 561-583, jul./dec. 2013
581
indicates that there is very significant negativecorrelation between the variables of interest.
The implication of this is that we accept Ho which says there is a significant relationship between the distance of patrons from eateries and the frequency of their patronage.
Hence, Ho Accepted H1 Rejected It should be noted that the R value shows that there is an inverse
relationship between distance and the frequency of patronage. Eateries close to patrons enjoy higher frequency of patronage from patrons than those farther away. The relationship is further depicted in the figure below.
Figure 9: Relationship between distance and frequency of patronage
Figure 9 above further illustrate that as distance increase from the eateries, patronage reduces. Therefore, there is an inverse relationship between the two variables. The results depicts that the intensity of patronage tend to decrease with increasing distance from the eatery. Patrons are less willing to patronize eateries that are far from them hence, eateries that are closer to thepatrons enjoy their patronage. This is a further reinforcement of the fact that the eatery industry is essentially customer oriented so it needs to consider proximity to potential customers in location. The relationship portrayed here agrees to the propositions of the distance decay effect that interaction decreases with increasing distance from the point of interaction in this case eateries.
Brazilian Geographical Journal: Geosciences and Humanities research medium, Ituiutaba, v. 4,
n. 2, p. 561-583, jul./dec. 2013
582
Conclusions
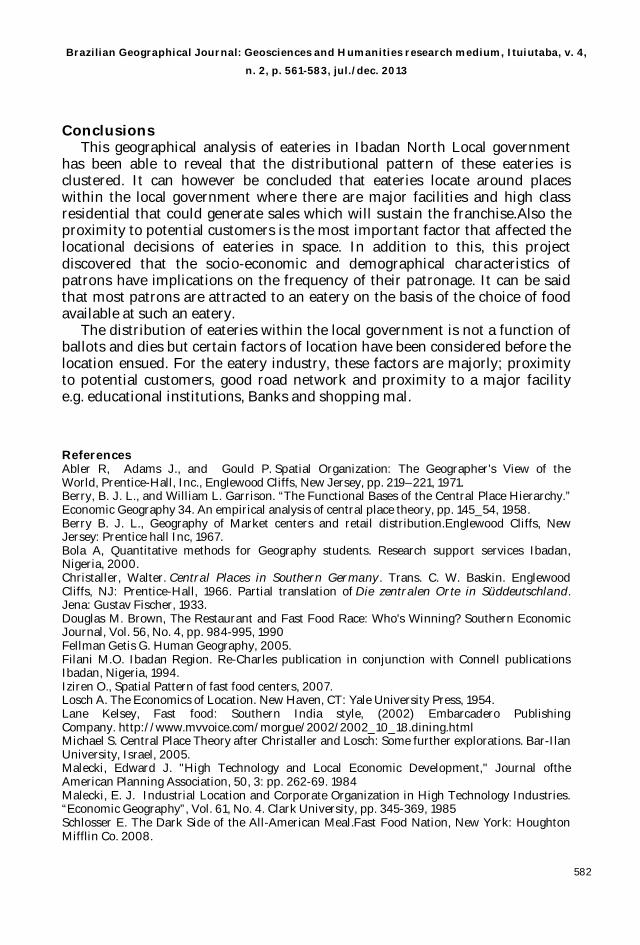
This geographical analysis of eateries in Ibadan North Local government has been able to reveal that the distributional pattern of these eateries is clustered. It can however be concluded that eateries locate around places within the local government where there are major facilities and high class residential that could generate sales which will sustain the franchise.Also the proximity to potential customers is the most important factor that affected the locational decisions of eateries in space. In addition to this, this project discovered that the socio-economic and demographical characteristics of patrons have implications on the frequency of their patronage. It can be said that most patrons are attracted to an eatery on the basis of the choice of food available at such an eatery.
The distribution of eateries within the local government is not a function of ballots and dies but certain factors of location have been considered before the location ensued. For the eatery industry, these factors are majorly; proximity to potential customers, good road network and proximity to a major facility e.g. educational institutions, Banks and shopping mal. References Abler R, Adams J., and Gould P. Spatial Organization: The Geographer's View of the World, Prentice-Hall, Inc., Englewood Cliffs, New Jersey, pp. 219–221, 1971. Berry, B. J. L., and William L. Garrison. “The Functional Bases of the Central Place Hierarchy.” Economic Geography 34. An empirical analysis of central place theory, pp. 145_54, 1958. Berry B. J. L., Geography of Market centers and retail distribution.Englewood Cliffs, New Jersey: Prentice hall Inc, 1967. Bola A, Quantitative methods for Geography students. Research support services Ibadan, Nigeria, 2000. Christaller, Walter. Central Places in Southern Germany. Trans. C. W. Baskin. Englewood Cliffs, NJ: Prentice-Hall, 1966. Partial translation of Die zentralen Orte in Süddeutschland. Jena: Gustav Fischer, 1933. Douglas M. Brown, The Restaurant and Fast Food Race: Who's Winning? Southern Economic Journal, Vol. 56, No. 4, pp. 984-995, 1990 Fellman Getis G. Human Geography, 2005. Filani M.O. Ibadan Region. Re-Charles publication in conjunction with Connell publications Ibadan, Nigeria, 1994. Iziren O., Spatial Pattern of fast food centers, 2007. Losch A. The Economics of Location. New Haven, CT: Yale University Press, 1954. Lane Kelsey, Fast food: Southern India style, (2002) Embarcadero Publishing Company. http://www.mvvoice.com/morgue/2002/2002_10_18.dining.html Michael S. Central Place Theory after Christaller and Losch: Some further explorations. Bar-Ilan University, Israel, 2005. Malecki, Edward J. "High Technology and Local Economic Development," Journal ofthe American Planning Association, 50, 3: pp. 262-69. 1984 Malecki, E. J. Industrial Location and Corporate Organization in High Technology Industries. “Economic Geography”, Vol. 61, No. 4. Clark University, pp. 345-369, 1985 Schlosser E. The Dark Side of the All-American Meal.Fast Food Nation, New York: Houghton Mifflin Co. 2008.

Brazilian Geographical Journal: Geosciences and Humanities research medium, Ituiutaba, v. 4,
n. 2, p. 561-583, jul./dec. 2013
583
Smith D.M. Industrial Location and Economic Geographical Analysis, 2nd edition. John Wiley and sons, 1981. Weber, A. Theory of the Location of Industries, translated by C. Friedrich. Chicago: University of Chicago Press, 1929.