geoelectricity - sgcobinsus.files.wordpress.com · 05/08/2017 · 3 electrical surveying •exploit...
TRANSCRIPT

1
Geoelectricity
ieso 2010
2
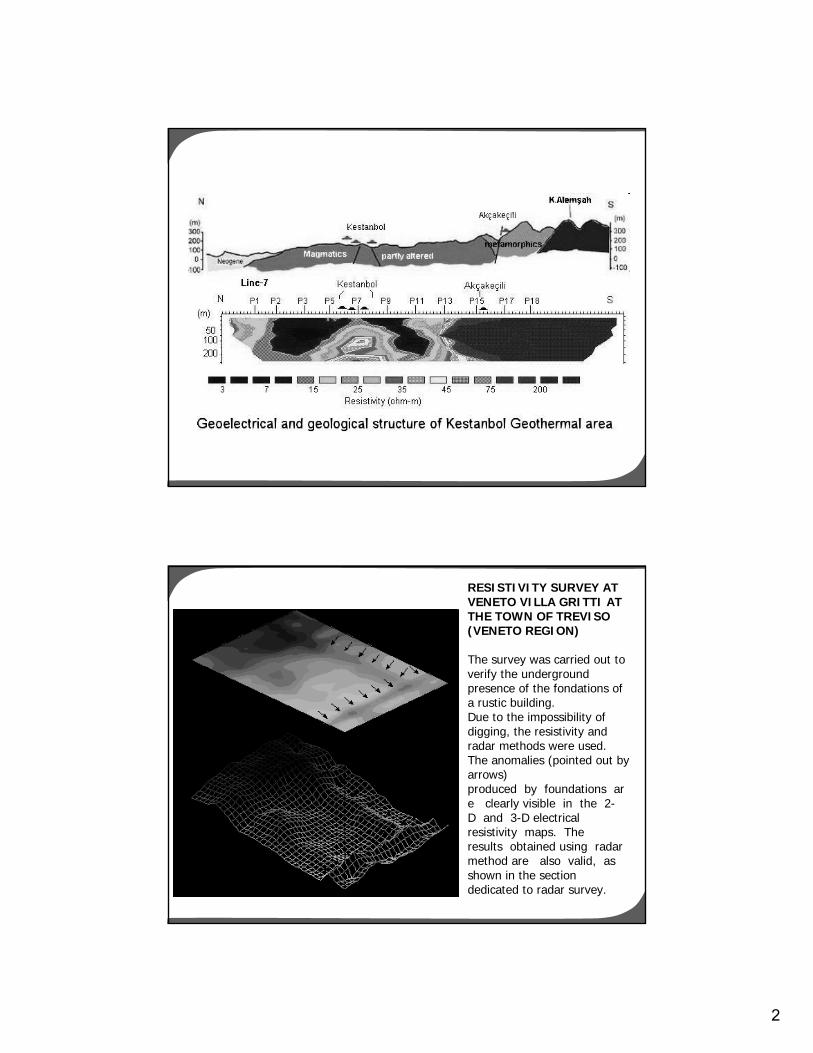
RESISTIVITY SURVEY AT VENETO VILLA GRITTI AT THE TOWN OF TREVISO (VENETO REGION)
The survey was carried out to verify the underground presence of the fondations of a rustic building. Due to the impossibility of digging, the resistivity and radar methods were used. The anomalies (pointed out by arrows) produced by foundations are clearly visible in the 2-D and 3-D electrical resistivity maps. The results obtained using radar method are also valid, as shown in the section dedicated to radar survey.
3
Electrical Surveying•Exploit the differences of various electrical properties of rock and minerals.
•Resistivity method
•Detects horizontal and vertical discontinuities in the electrical properties of the ground.
•Detects 3-D bodies of anomalous conductivity.
•Hydrogeology and engineering applications for the shallow subsurface.
•Induced Polarization
•Makes use of the capacitive action of the subsurface to located zones where conductive materials are disseminated within host rock.
•Self Potential
•Uses natural currents generated by electrochemical processes to locate shallow bodies of anomalous conductivity.

4
Resistivity•Resistivity usually depends on the amount of groundwater present, and on the amount of salts dissolved in it
•Resistivity is often used for mapping the presence of rocks with different porosities.
•Hydrogeology – aquifers, contaminant transport, saline pollution
•Mineral prospecting
Artificially generated currents are introduced into the ground and the resulting potential differences are measured at the surface.
Basic Electrical QuantitiesElectrical charges flow around a circuit – current flows from positive to negative
Electrical current is measured in amperes (amp) –the amount of electric charge that passes any point in the circuit in 1 second.
The current flows due to a potential difference (Voltage). A 1.5 volt battery produces a potential difference of 1.5 volts.
For most materials, the current increases in proportion to the potential difference – double the potential difference, the current doubles. Ohm’s Law
The amount of current flowing when the potential difference is 1 volt is called the resistance of the piece, and is equal to the slope of the graph to the right
)( Ω= RIV
From
: Mus
sett
& Kh
an.,
2000
5
Basic Electrical QuantitiesResistance depends on the material and its shape:
•A wire of copper has less resistance than one of lead with the same dimensions.
•A long thin wire has greater resistance than a short, fat one of the same material
•Doubling the length doubles the resistance
•Doubling the area of cross-section halves the resistance (similarly to water flow).
Resistivity (the quantity investigated by resistivity surveying) characterizes the material independent of its shape – it is measure in ohm-m (inverse of resistivity is conductivity)
lengtharea sectional-cross * resistance y resistivit
area sectional-crosslength *y resistivit resistance
=
=
From
: Mus
sett
& Kh
an.,
2000
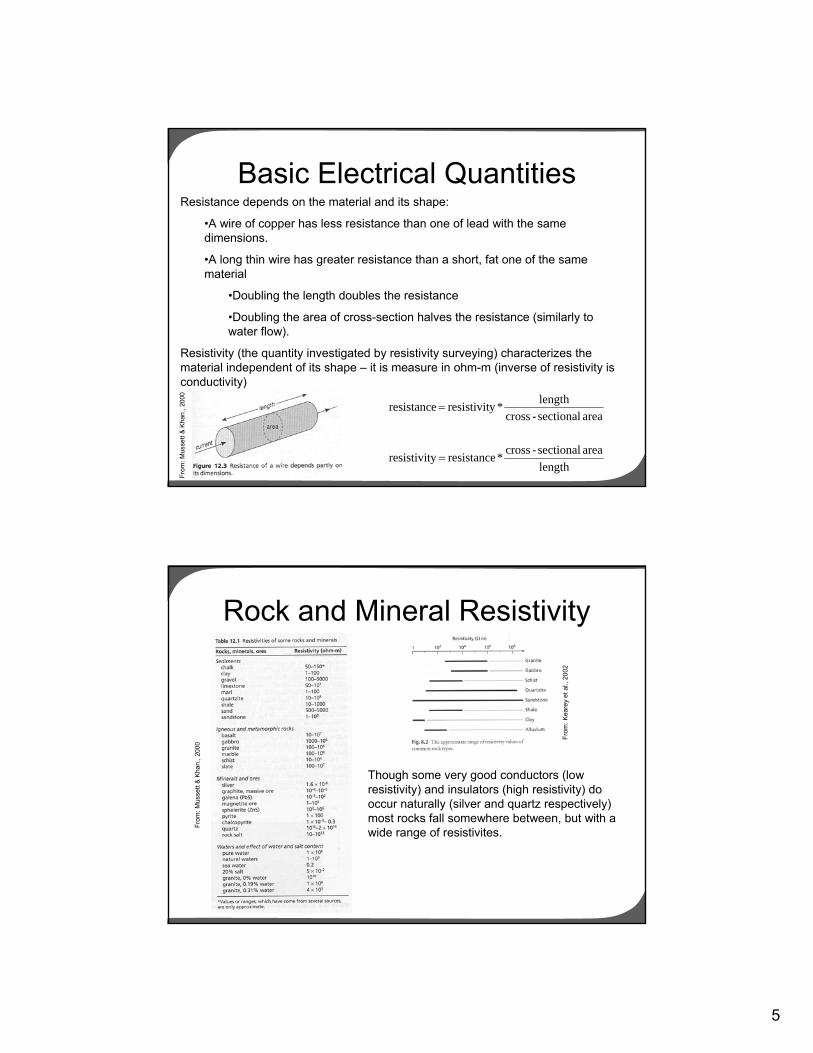
Rock and Mineral Resistivity
Though some very good conductors (low resistivity) and insulators (high resistivity) do occur naturally (silver and quartz respectively) most rocks fall somewhere between, but with a wide range of resistivites.
From
: Mus
sett
& Kh
an.,
2000
From
: Kea
rey
et a
l., 2
002

6
Rock and Mineral ResistivityMost rock forming minerals, i.e. quartz, feldspar, mica, olivine, are good insulators.
Pores and cracks contain groundwater (fairly low resistivity) – resistivity of rock is therefore a function of porosity and pore saturation.
Water varies from pure (insulator) to salty (good conductor).
Salts dissociate into positive and negative ions – common salt dissociates into Na+ and Cl- -- these move through the water forming a current
= Ionic conduction (electronic conduction is due only to electrons –occurs in metals and some ores).
As the resistivity of a rock is largely due to the pore waters, a single rock can have a large range of resistivites, making lithological identification problematic.
From
: Mus
sett
& Kh
an.,
2000
Rock and Mineral Resistivity•The resistivity of porous, water bearing sediments (formation resistivity, Pp) can be approximated from the porosity (Ф), the water saturation (Sw) and the resistivity of the pore water (ρw) – Archie’s Law
nw
mwn
wm
wt Sasaφρφρρ == −−
Where a, m, and n are constants determined from field of lab measurements – used commonly in the hydrocarbon industry.
•Archie’s law does not hold for clay minerals – the fine particles trap a layer of electrolyte around them – clay has low resistivity.
•Resistivity decreases as temperature rises – needs to be accounted for in borehole logging.

7
Electrical Flow in RocksElectrical connections are made through electrodes – metal rods pushed a few cm into the ground
The current does not travel by the most direct route – as a thin layer has the most resistance, the current instead spreads out, both downwards and sideways, though there is a concentration near the electrodes.
In uniform ground only about 30% of the current penetrates below a depth equal to the separation of the electrodes.
From
: Mus
sett
& K
han.
, 200
0
Why 4 Electrodes?•So far we have only used two electrodes. In this case the potential difference is measured between the ends of the resistance.
•This is not done in resistivity surveys because there is a large and unknown extra resistance between the electrode and the ground.
•The potential difference is instead measured between two other two potential electrodes – the voltmeter draws negligible current, therefore the contact potential difference is negligible.
•Power supply usually run from batteries.
•Wires have small resistances.
•Applied voltage ~100 volts, current ~mA
•Potential difference typically volts to mV.
•As ions accumulate on the electrodes, they are dispersed by reversing the current flow a few times a second.
From
: Mus
sett
& Kh
an.,
2000

8
Vertical Electric SoundingVertical electric sounding is used when the subsurface approximates to a series of horizontal layers.
•The electrode array is expanded from a fixed center.
•If the electrode spacing is much less than the thickness of the top layer, nearly all will remain in that layer.
•As the electrode spacing is expanded beyond the thickness of the top layer, a significant amount of the current will be flowing through the lower layer.
From
: Mus
sett
& Kh
an.,
2000
Refraction of Current PathsIn a uniform layer the current paths are smooth
The current paths refract towards the normal as they cross into a rock of higher resistivity, and away when they cross into a rock of lower resistivity. The angles are related by:
2211 tantan θρθρ =
As refraction changes the distribution of current in a layered subsurface, compared to uniform ground, the ratio of the potential difference to the current changes, making it possible to measure the change of resistivity with depth.
From
: Mus
sett
& Kh
an.,
2000
From
: Mus
sett
& Kh
an.,
2000

9
Apparent ResistivityIn a VES survey the ratio of current to potential difference changes because:
•Change of resistivity with depth
•Because electrodes are moving further apart
The second effect has to be removed
•As current travels through the ground the current paths diverge from one current electrode before converging on the other.
•Resistance of “bundle of paths” is proportional to length, but inversely proportional to cross-sectional area
From
: Mus
sett
& Kh
an.,
2000
Apparent Resistivity
•If the current electrode separation is doubled, the cross-sectional area quadruples, so the resistance halves.
•The ratio of potential difference to current, ΔV/I has to be multiplied by a geometrical factor that depends on the electrode separation:
IV
aΔ
= *factor lgeometrica ρ
The factor is such that, for a uniform subsurface, ρa remains constant as the separation is changed and equals the resistivity of the ground
From
: Mus
sett
& Kh
an.,
2000

10
Wenner ArrayIn a Wenner array, the electrodes are equally spaced (spacing = a).
•Geometrical factor = 2πa, therefore ρa = 2πa ΔV/I
•In uniform ground doubling a halves ΔV/I , with ρa remaining constant.
•If the subsurface is layered, the value of ρa depends on the resistivities of the layers – the value calculated is the apparent resistivity. As the electrode separation is expanded ρa changes as more current flows into deeper layers.
From
: Mus
sett
& K
han.
, 200
0
Wenner VES Survey•Two measuring tapes laid end to end.
•Four electrodes pushed into the ground symmetrically about the junction of the tapes.
•Electrode separation progressively increased – not incrementally as the same increment at a wide spacing would produce little or no change in reading – ie 1, 1.5, 2, 3, 4, 6, 8.
•Stopped when current is deep enough.
From
: Mus
sett
& Kh
an.,
2000

11
Wenner VES Survey•Apparent resistivity is calculated for each spacing, using ρa = 2πa ΔV/I
•Graph is plotted of log10ρ vs log10a.
From
: Mus
sett
& K
han.
, 200
0
Modeling the Data•The curves are both for two layer cases – same resistivities but different thickness upper layer.
•At small electrode spacing the current only penetrates the upper layer. The apparent resistivity at small spacing is therefore the resistivity of the upper layer.
•At the largest spacing the curve flatten – here most of the current is spending most of its time in the lower layer. Therefore the resistivity of the lower layer approximates the apparent resistivity at large spacing.
•The fact that the upper layer is thicker in the right-hand plot is apparent from the longer time spent at low apparent resistivity.
From
: Mus
sett
& Kh
an.,
2000

12
Modeling the Data•In practice the thickness of the layers and the resistivities are found by comparing the actual plot with master curves calculated for different values of thickness and resistivity.
•Electrode spacing is plotted as a ratio to the thickness of the top layer, a/h1, and the apparent resistivity as a ration to the resistivity if the top layer ρa / ρ1, with different curves labeled by the value of the ratio of the resistivities.
•The master curve and apparent resistivity curves must be on the same scale.
From
: Mus
sett
& K
han.
, 200
0
Modeling the Data•The apparent resistivity plot is slid over the master curve until a match is found.
•In this case it would be the ρa / ρ1 = 6.
•The horizontal part of the curve cuts the y-axis at 1.27, giving a value of 18.9 ohm-m for layer 1 (ρ1).
•The value for layer 2 is thus 6 * 18.9 = 113 ohm-m (ρ2).
•The thickness of the top layer is found from where the a/h1 curve of the master curve cuts the x –axis on the apparent resistivity curve –in this case 0.2 m.
From
: Mus
sett
& Kh
an.,
2000

13
Multiple LayersIn the case of multiple layers, the curve never reaches the resistivity of layer 2 as the current is penetrating into yet deeper layers.
•The number of layers can be determined by the number of changes from concave to convex, or vice versa – kinks.
•This is the minimum number of layers.
•In reality, modeling for multiple layers is usually done on a computer, where a theoretical master curve can be compared actual data and a depth vs. resistivity curve created.
From
: Mus
sett
& K
han.
, 200
0
Limitation of VES•Thin layers, or layers with negligible resistivity contrast are said to be suppressed.
•No hard guidelines on the limits of thickness of a detectable layer – usually estimated by modeling.
•Anisotropic layers have resistivities that vary perpendicular to lamination (shale).
•The method assumes that layers are horizontal – if they are dipping, are series of VES profiles should be carried out.
•Ambiguity
From
: Mus
sett
& Kh
an.,
2000
14
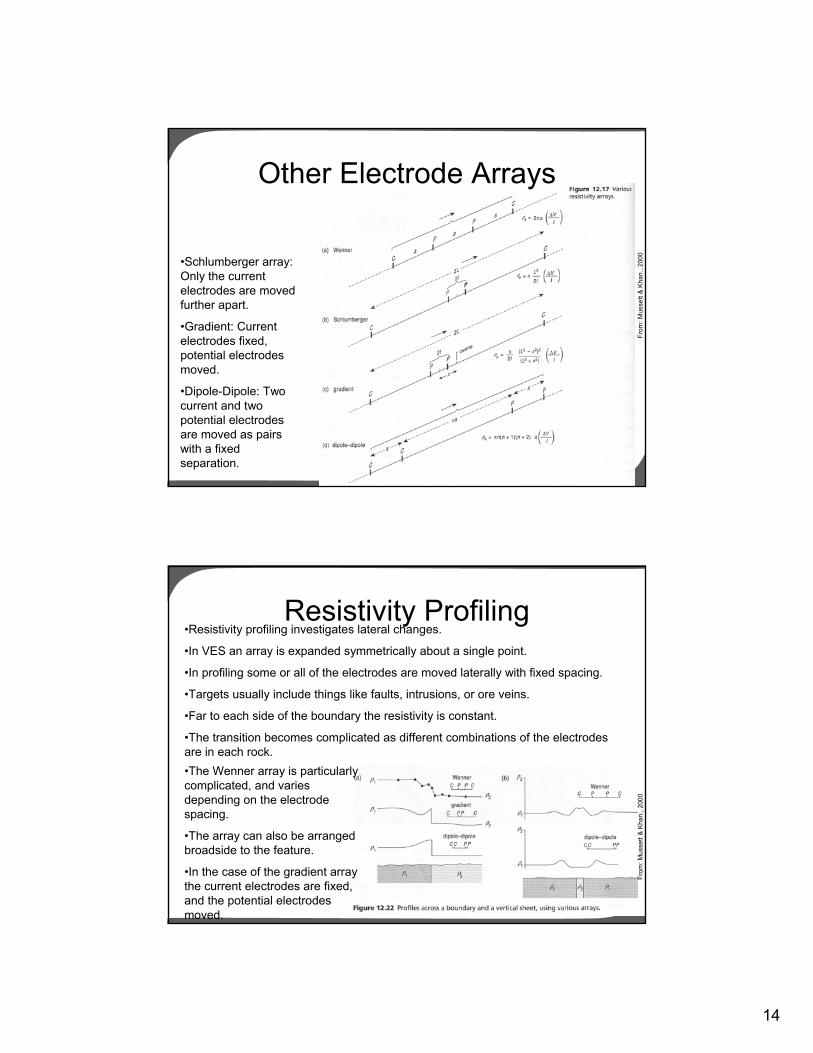
Other Electrode Arrays
•Schlumberger array: Only the current electrodes are moved further apart.
•Gradient: Current electrodes fixed, potential electrodes moved.
•Dipole-Dipole: Two current and two potential electrodes are moved as pairs with a fixed separation.
From
: Mus
sett
& K
han.
, 200
0
Resistivity Profiling•Resistivity profiling investigates lateral changes.
•In VES an array is expanded symmetrically about a single point.
•In profiling some or all of the electrodes are moved laterally with fixed spacing.
•Targets usually include things like faults, intrusions, or ore veins.
•Far to each side of the boundary the resistivity is constant.
•The transition becomes complicated as different combinations of the electrodes are in each rock. •The Wenner array is particularly complicated, and varies depending on the electrode spacing.
•The array can also be arranged broadside to the feature.
•In the case of the gradient array the current electrodes are fixed, and the potential electrodes moved.
From
: Mus
sett
& Kh
an.,
2000

15
Mise-à-la-Masse Method•If an ore reserve has be proven in a borehole, one current electrode can be put in the borehole in contact with the ore.
•Another current electrode is put on the surface beyond the extent of the ore.
•One potential electrode is fixed on the surface above the body.
•The second potential electrode is moved around (over the surface an/or down the borehole).
•The apparent resistivity is measured and contoured to indicate the extent of the body.
From
: Mus
sett
& K
han.
, 200
0Electrical Imaging
Resistivity may vary both vertically and horizontally, so to create a complete image of the subsurface arrays have to be expanded and moved laterally.
•If the body is very elongated horizontally (veins, faults, layers), a pseudosection can be used.
•Repeated profiles along the same traverse crossing the body with a range of electrode separations
•In (a) the electrodes are first moved across the area with a constant separation.
• The value of resistivity is plotted between the electrodes at the point of intersection of 45o lines drawn down from the midpoint of each pair.
•The spacing is changed, and the process repeated.
•Values are plotted and contoured to create a pseudosection
From
: Mus
sett
& Kh
an.,
2000

16
Electrical ImagingA common distortion is a small area of low resistivity such as a massive sulphide giving rise to an inverted V, or ‘pant legs’.
A Wenner array can also be used, with the values plotted below the midpoint of the array at a depth equal to the electrode spacing.
From
: Mus
sett
& K
han.
, 200
0
Electrical ImagingIt is now possible to convert a pseudosection into to ‘true’ resistivity section using tomographic theory.
In the example to the right the ‘pant legs’ have been replaced by an oval area much closer to the size of the target
From
: Mus
sett
& Kh
an.,
2000

17
References Used1. Kearey, P., M. Brooks, and I. Hill, An Introduction to Geophysical
Exploration, 2002.2. Mussett, A.E. and M.A. Khan, Looking into the Earth: An introduction to
geological geophysics, 2000.