gentamicin renal excretion in rats: probing …file.scirp.org/pdf/pp_2016012114071380.pdf ·...
TRANSCRIPT

Pharmacology & Pharmacy, 2016, 7, 43-55 Published Online January 2016 in SciRes. http://www.scirp.org/journal/pp http://dx.doi.org/10.4236/pp.2016.71007
How to cite this paper: Dontabhaktuni, A., Taft, D.R. and Patel, M. (2016) Gentamicin Renal Excretion in Rats: Probing Strategies to Mitigate Drug-Induced Nephrotoxicity. Pharmacology & Pharmacy, 7, 43-55. http://dx.doi.org/10.4236/pp.2016.71007
Gentamicin Renal Excretion in Rats: Probing Strategies to Mitigate Drug-Induced Nephrotoxicity Aruna Dontabhaktuni1, David R. Taft1, Mayankbhai Patel1,2* 1Long Island University, Brooklyn, USA 2Current Address: Takeda Pharmaceuticals International Co., Cambridge, USA
Received 23 November 2015; accepted 18 January 2016; published 21 January 2016
Copyright © 2016 by authors and Scientific Research Publishing Inc. This work is licensed under the Creative Commons Attribution International License (CC BY). http://creativecommons.org/licenses/by/4.0/
Abstract The renal excretion of gentamicin, an aminoglycoside antibiotic, was studied in the isolated per-fused rat kidney (IPRK) model. Dose-linearity experiments were carried out at four doses (400, 800, 1600, 3200 μg), targeting initial perfusate levels of 5, 10, 20 and 40 μg/ml. Additionally, gen-tamicin was co-perfused with sodium bicarbonate (0.25 mM) and/or cimetidine (2 mM) to eva-luate the effect of urinary alkalization and secretory inhibition on gentamicin excretion and kid-ney accumulation. Gentamicin displayed net reabsorption in the IPRK, consistent with extensive luminal uptake. Kinetic analysis indicated that luminal transport of gentamicin (kidney → urine) is the rate-determining step for gentamicin urinary excretion. Clearance and cumulative excretion decreased with increased gentamicin dose. Gentamicin kidney accumulation, estimated by mass balance, ranged from ~20% - 30%. Urinary alkalization significantly increased gentamicin excre-tion, with no effect on kidney accumulation. Conversely, cimetidine co-administration did not af-fect gentamicin clearance in the IPRK, but kidney accumulation was significantly reduced. When both sodium bicarbonate and cimetidine were administered together, gentamicin kidney accu-mulation decreased ~80% with corresponding increases in clearance and excretion ratio (XR) compared to gentamicin alone. A main strategy to reduce the incidence of nephrotoxicity with gentamicin therapy (up to ~25%) involves reducing kidney accumulation of the compound. The results of this research suggest that the combination of urinary alkalization and inhibition of ba-solateral secretion (blood → kidney) may be a viable approach to mitigate aminoglycoside toxicity, and warrants further investigation.
Keywords Gentamicine, Isolated Perfused Kidney Component, Nephrotoxicity, pH Effect, Cimetidine
*Corresponding author.

A. Dontabhaktuni et al.
44
1. Introduction Aminoglycosides have been used for many decades to treat serious infections [1]. Gentamicin is the most com-monly prescribed aminoglycoside, in part due to its low resistance levels and low cost [1]. Gentamicin is active against most strains of gram negative and some gram positive bacteria, with relatively low incidences of toler-ance [2]. The therapeutic use of gentamicin has generally been restricted to life threatening infections, as the compound is nephrotoxic at therapeutic doses [3] [4]. The incidence of aminoglycoside nephrotoxicity in pa-tients is approximately 25% [5]. However, because of the emergence of multi-drug resistance of bacteria to less toxic antimicrobial medications, clinicians are forced to consider aminoglycoside therapy for nosocomial infec-tions in hospitalized patients and enterococcal endocarditis [6]. Thus, gentamicin is frequently used as a first or second choice drug in the clinic [4]. Given its continued use in drug therapy, considerable research has been aimed at developing approaches to reduce aminoglycoside toxicity in patients.
Despite significant research in this field, the molecular mechanism associated with gentamicin nephrotoxicity is not completely understood. Gentamicin is a hydrophilic cationic compound that does not readily penetrate cell membranes [7]. In vivo, approximately 90% of a gentamicin dose is recovered in the urine [8]. However, the drug selectively accumulates in the proximal tubule at concentrations much higher than those measured in plas-ma, and with a longer half-life in the tubular cell [1]. Once inside the kidney cell, gentamicin concentrates in ly-sosomes, endosomes and within the Golgi complex [9]. As drug concentrations rise, gentamicin empties into the cytosol, where it induces apoptosis and necrosis and inhibits various kidney membrane transporters leading to altered tubular reabsorption and reduced cellular viability [5].
The mechanisms of gentamicin uptake and accumulation in the kidney have been the subject of numerous published reports [1] [7] [10]-[17]. Elucidation of these pathways can provide insight into the mechanism of aminoglycoside nephrotoxicity. A study comparing renal accumulation in filtering and non-filtering kidneys demonstrated that gentamicin uptake proceeded via reabsorption across the luminal membrane of the proximal tubular cell [18]. Subsequently, it was established that aminoglycoside uptake involves absorptive endocytosis mediated by megalin [10], although other reports suggest that other transport pathways may be involved that do not require endocytosis [7] [17]. Thus, it appears that gentamicin uptake and accumulation may involve multiple processes.
Two general strategies have been proposed to protect against aminoglycoside nephrotoxicity [4] [9]. The first strategy involves reducing drug accumulation in the kidney. Administering gentamicin as a single daily dose has been suggested to be less nephrotoxic, due to saturation of luminal uptake resulting in reduced concentrations in the kidney [1] [5] [9] [19]. Alternatively, inhibitions of megalin-mediated endocytosis or other transport path-ways through direct competition or other approaches have also been tested [10] [20]. A second strategy aims to reduce toxicity through co-administration of renoprotective compounds, including antioxidants [21]-[23].
The objective of this investigation was to explore alternative methods to reduce gentamicin uptake into the proximal tubule cell, the critical step leading to aminoglycoside nephrotoxicity. Experiments were performed using the isolated perfused rat kidney (IPRK) model. The IPRK can be used to study numerous aspects of renal drug disposition. Applications of the model include elucidating renal excretion mechanisms, screening for po-tential drug-drug interactions, and assessing renal drug metabolism [24]. Thus, it is a useful preclinical tool for the current investigation.
The specific aims of the research were: 1) to assess the dose-linearity of gentamicin excretion over a range of clinically-relevant concentrations; and 2) to probe potential strategies for reducing the kidney accumulation of gentamicin, including urinary alkalization and transporter-inhibition. Urinary alkalization was induced through administration of sodium bicarbonate (NaHCO3), and the effect of increased urine pH on gentamicin excretion was determined. Transport inhibition studies were carried out using cimetidine, a known inhibitor of organic ca-tion transport in the kidney [25].
2. Material and Methods 2.1. Chemicals Fraction V bovine serum albumin (molecular weight range 69,000 to 78,000 D), dextran (clinical grade, mole-cular weight range 60,000 to 90,000 D), inulin (from chicory root), amino acids, potassium chloride, sodium chloride, sodium bicarbonate, magnesium sulfate, calcium chloride, glucose, sodium bicarbonate (NaHCO3), cimetidine and gentamicin (sulfate salt) were purchased from Sigma-Aldrich (St. Louis, MO). Sodium hydrox-

A. Dontabhaktuni et al.
45
ide and pH calibration standards were obtained from VWR Scientific Products (West Chester, PA). Solvents used for HPLC were obtained from J & H Berge Co. (Plainfield, NJ). Amicon Centrifree YM-30 (molecular weight cut off 30 K) centrifugal filter devices were obtained from Millipore Corporation (Billerica, MA).
2.2. Animals Male Sprague Dawley rats (250 - 350 g) were used for perfusion experiments. The rats were purchased from Harlan Laboratories (Indianapolis, IN). All rats were caged in stainless steel cages and fed standard chow and water ad libitum. The Institutional Animal Care and Usage Committee (IACUC) of Long Island University ap-proved the experimental protocol for this investigation.
2.3. Isolated Perfused Rat Kidney Preparation IPRK experiments were carried out as described previously [24] [26]. The surgical procedure involved cannula-tion of the right kidney via the superior mesenteric artery, using a technique that maintained a continuous flow of perfusate to the kidney, thereby decreasing the possibility of ischemia during the isolation of the kidney [26]. The perfusate consisted of Krebs-Henseleit buffer (pH 7.4) containing BSA (4%), dextran (1.67%), glucose (0.1%), inulin (GFR marker, 0.06%) and amino acids.
Anesthesia was induced with an intraperitoneal injection of sodium pentobarbital (40 mg/kg). A midline inci-sion was made and the renal segment of the aorta exposed. A ligature was passed under the right renal artery close to the aorta, and distal and proximal ligatures placed around the superior mesenteric artery. The right ure-ter was catheterized with polyethylene (PE-10) tubing in order to facilitate urine collection. A cannula was then threaded through the mesenteric artery, across the aorta, and into the right renal artery in situ. The ligatures were tied, securing the cannula in place. The right kidney was then excised from the animal, trimmed of adhering tis-sue and transferred to the in vitro recirculating perfusion apparatus.
2.4. Treatment Groups Control perfusions were conducted to test system suitability and viability of the study model, and to assess ef-fects of treatments on kidney function. The renal excretion of gentamicin was determined over a range of doses targeting initial perfusate concentrations between 5 and 40 µg/ml. A total of four doses were studied (5, 10, 20 and 40 µg/ml). Three additional study groups were carried out to determine the effect of urinary alkalization and/or transport inhibition on gentamicin excretion: 1) Gentamicin (10 µg/ml) co-administered with NaHCO3 (0.25 mM); 2) Gentamicin (10 µg/ml) co-administered with cimetidine (2 mM) (OCT inhibitor); and 3) Genta-micin co-administered with NaCO3 (0.25 mM) and cimetidine (2 mM). A total of five perfusion experiments were conducted for each study group.
2.5. Experimental Design Each IPRK experiment was conducted over a 2-hour period. Once the kidney was placed in the perfusion appa-ratus, a stabilization period (10 minutes) preceded any pharmacokinetic experimentation. For the dose linearity experiments, a bolus dose of vehicle (KHS buffer, dose linearity perfusions), NaHCO3 or cimetidine (or both) was administered following the stabilization period. After a ten minute distribution phase, gentamicin was then added to the perfusion reservoir as a bolus dose. The time was denoted as time zero for pharmacokinetic calcu-lations.
A perfusate sample was collected 5 minutes post-dose and every 10 minutes thereafter for a total of 100 mi-nutes. Urine was collected in 10-minute intervals throughout the experiment. After each collection interval, urine volume was determined gravimetrically and pH was measured. Perfusate and urine samples were analyzed for electrolytes (sodium, chloride) and glucose using a Beckman Synchron CX-3 Clinical Chemistry Analyzer (Beckman-Coulter, Brea CA). Inulin (GFR marker) was measured using colorimetric method [27]. Urine and perfusate samples were stored at −20˚C prior to the analysis of gentamicin.
During the course of the experiment, the perfusion pressure was maintained at 100 ± 10 mm Hg by adjusting the perfusate flow rate as needed. The volume of the recirculating perfusate (80 mL) was maintained constant by addition of the replenishing solution that was prepared with a 1:1 dilution of the perfusate and deionized water. At the end of the experiment, the kidney was removed, blotted dry, and weighed. Kidney function and viability

A. Dontabhaktuni et al.
46
was assessed by the following parameters: GFR, reabsorption of electrolytes and glucose, urine flow rate, and urine pH.
2.6. Perfusate Binding of Gentamicin Perfusate binding of gentamicin was measured by ultrafiltration. Four concentrations of gentamicin were studied: 1, 5, 10, and 40 µg/ml. Perfusate samples were incubated at 37˚C under constant stirring for 60 min to ensure binding equilibrium. After incubation, an aliquot of sample was collected for the determination of total drug perfusate concentration. A second aliquot (1 ml) was added to an Amicon Centrifree Micropartition System (Millipore Corporation, Bedford, MA) and the device was centrifuged at 1500 × g for 15 min. After centrifuga-tion, the resulting ultrafiltrate was stored at −20˚C for subsequent determination of free drug concentration. Pre-liminary studies determined that the drug binding to the device was negligible. All studies were performed in triplicate. The fraction of gentamicin unbound in perfusate (fu) was calculated as the ratio of unbound and total concentration.
Further studies were performed to evaluate nonspecific binding to IPRK apparatus for all gentamicin doses used in current investigation. These studies were performed using KHS buffer and gentamicin was added as a bolus dose. Samples were collected 5 min post-dose and every 10 min thereafter over 2 hour.
2.7. HPLC Analysis Structurally, gentamicin does not possess ultraviolet light absorbing properties, and therefore the compound cannot be analyzed directly by UV or fluorescence detection. Consequently, HPLC methods for gentamicin typ-ically include pre-column or post-column derivatization. There are a number of published methods for gentami-cin involving various derivatizing agents [28]-[33], which were used by other investigators. In the present inves-tigation new HPLC method was developed and validated [34]. The method utilized in this investigation involves pre-column derivatization of gentamicin with O-phthalaldehyde (OPA) and 2-mercaptoethanol (MPE). In con-trast to published gentamicin HPLC assays, 1) this assay requires a low sample volume; 2) involves simple and less time-consuming derivatization process, 3) the derivative produced is more stable (up to 4 hours) at room temperature and 4) the sensitivity of assay is higher, thus it can be used to measure gentamicin concentrations at therapeutic doses.
Gentamicin was quantified using an HPLC method with fluorescence detection. Test samples (perfusate, urine, ultrafiltrate) were treated with 1% ZnSO4 (1:1 ratio) to precipitate proteins. Derivatizing agents were spiked di-rectly into the resulting sample extract. Analyte separation was accomplished using a Hypersil ODS C18 column (150 mm × 4.6 mm, 5 um particle size). The mobile phase consisted of 0.02 M sodium heptanesulfonic acid in methanol-glacial acetic acid-water (70:5:25) (pH 3.4). Analysis was conducted at ambient temperature at a con-stant flow rate of 2.0 mL/min using isocratic elution. Gentamicin was detected at an excitation maximum of 360 nm and emission maximum of 430 nm.
A standard addition method [35] was used to increase the sensitivity of the assay in perfusate. The method involved the addition of known quantities of gentamicin to multiple aliquots of a perfusate sample. The standard samples were analyzed, and the concentration of gentamicin in the sample was determined from a plot of detec-tor response (peak height) versus gentamicin concentration.
2.8. Data Analysis For each urine collection period, the renal clearance of inulin (GFR) was calculated using the following equa-tion:
inulin
inulin
UGFR UFR
P= × (1)
where UFR represents the urine flow rate, Uinulin is the concentration of inulin in urine, and Pinulin is the perfusate concentration of inulin sampled at the midpoint of the urine collection interval.
The following equation was used to calculate clearance (Cl) of gentamicin in the IPRK:
Cl uXAUC
= (2)
A. Dontabhaktuni et al.
47
Xu refers to the cumulative urinary excretion of gentamicin and AUC is the area under the curve over the du-ration of the perfusion experiment (100 minutes). AUC was estimated using the trapezoidal rule.
Renal excretion ratio (XR) is a parameter used to determine net mechanisms of renal excretion. XR was cal-culated as follows:
u
ClXRf GFR
=×
(3)
Kidney accumulation of gentamicin was estimated using mass balance analysis; that is, as the difference be-tween the administered dose and the total amount of drug remaining in the perfusate and recovered in the urine at the end of the perfusion experiment.
2.9. Statistical Analysis Estimates of IPRK viability parameters for control and drug treatment groups were compared using analysis of variance (ANOVA). Post-hoc analysis (Dunnett’s Test) was utilized to identify study groups that differed from control perfusions in terms of viability criteria. Consequently, alterations in kidney functions induced by drug administration or NaHCO3 were determined. Likewise, mean values for gentamicin pharmacokinetic parameters were compared using ANOVA. Post-hoc analysis (Tukey HSD) was once again used to identify differences am- ong the various treatment groups in an effort to identify differences in gentamicin excretion as a function of dose or co-administration of NaHCO3 and/or cimetidine.
3. Results 3.1. Quantification of Gentamicin In current investigation, pre-column derivatization with 2-mercaptoethanol (MPE) with OPA was used to im-prove assay sensitivity. The derivative was found to be stable in the mobile phase for up to 4 hours at room temperature. The variability of the method with regard to reproducibility, accuracy, and precision was within acceptable limits (Table S1, Table S2). Nearly complete recovery of the drug from the matrix was obtained. Limit of detection (LOQ) of the HPLC assay method was high (10 μg/ml). In order to measure gentamicin per-fusate concentration in the clinically relevant range, a standard addition method was employed. The method in-volved the addition of known quantities of gentamicin to multiple aliquots of a plasma sample. The standard samples were analyzed, and the concentration of gentamicin in the sample was determined from a plot of detec-tor response (peak height) versus gentamicin concentration. This approach lowered the LOQ of the method in perfusate to 1 μg/ml. Gentamicin was stable in all matrices for 24 hr at room temperature and up to 1 month at −20˚C.
3.2. Gentamicin Perfusate Binding Gentamicin binding in IPRK perfusate was constant over the range of concentrations tested (5 - 40 µg/ml). Bin- ding was estimated as 12% ± 0.9% (fu = 0.88). In a separate experiment, gentamicin was not found to undergo non-specific binding of gentamicin to the IPRK apparatus.
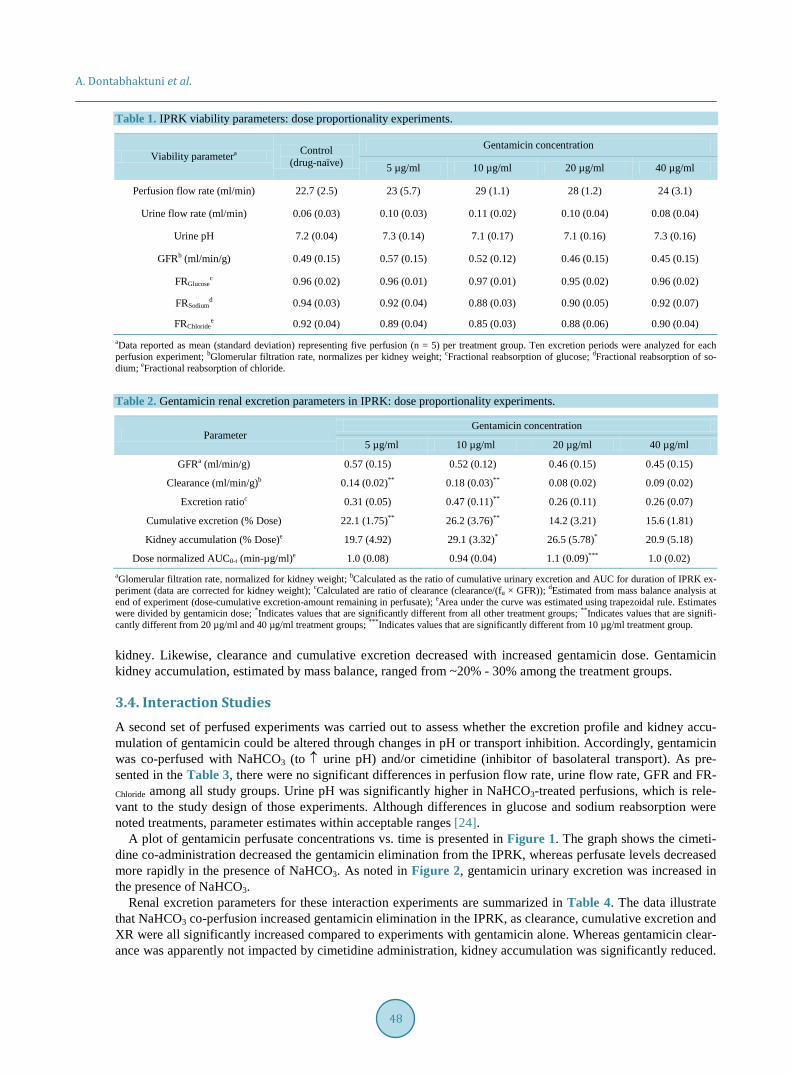
3.3. Dose Linearity Assessment A summary of the parameters used to assess IPRK suitability is presented in Table 1. Control (drug-naive) stu-dies were performed to establish the viability of the preparation and to assess the effect of varying doses of gen-tamicin on kidney function. The data presented in the table are consistent with published values [24] [26] [36] [37]. There were no significant differences in parameter estimates among any of the treatment groups compared to control (p-value > 0.05), indicating that that kidney function was well preserved in the presence of varying doses of gentamicin over the duration of the IPRK experiments.
Estimates for gentamicin renal excretion parameters are provided in Table 2. To correct for inter-kidney va-riability, GFR and clearance estimates were normalized for kidney weight. Although the drug appeared to exhi-bit dose-linearity with respect to AUC, the data indicate a non-linear renal excretion profile with increasing dose. Gentamicin excretion ratio (XR) was less than one across all groups, consisted with net reabsorption by the
A. Dontabhaktuni et al.
48
Table 1. IPRK viability parameters: dose proportionality experiments.
Viability parametera Control (drug-naïve)
Gentamicin concentration
5 µg/ml 10 µg/ml 20 µg/ml 40 µg/ml
Perfusion flow rate (ml/min) 22.7 (2.5) 23 (5.7) 29 (1.1) 28 (1.2) 24 (3.1)
Urine flow rate (ml/min) 0.06 (0.03) 0.10 (0.03) 0.11 (0.02) 0.10 (0.04) 0.08 (0.04)
Urine pH 7.2 (0.04) 7.3 (0.14) 7.1 (0.17) 7.1 (0.16) 7.3 (0.16)
GFRb (ml/min/g) 0.49 (0.15) 0.57 (0.15) 0.52 (0.12) 0.46 (0.15) 0.45 (0.15)
FRGlucosec 0.96 (0.02) 0.96 (0.01) 0.97 (0.01) 0.95 (0.02) 0.96 (0.02)
FRSodiumd 0.94 (0.03) 0.92 (0.04) 0.88 (0.03) 0.90 (0.05) 0.92 (0.07)
FRChloridee 0.92 (0.04) 0.89 (0.04) 0.85 (0.03) 0.88 (0.06) 0.90 (0.04)
aData reported as mean (standard deviation) representing five perfusion (n = 5) per treatment group. Ten excretion periods were analyzed for each perfusion experiment; bGlomerular filtration rate, normalizes per kidney weight; cFractional reabsorption of glucose; dFractional reabsorption of so-dium; eFractional reabsorption of chloride.
Table 2. Gentamicin renal excretion parameters in IPRK: dose proportionality experiments.
Parameter Gentamicin concentration
5 µg/ml 10 µg/ml 20 µg/ml 40 µg/ml
GFRa (ml/min/g) 0.57 (0.15) 0.52 (0.12) 0.46 (0.15) 0.45 (0.15)
Clearance (ml/min/g)b 0.14 (0.02)** 0.18 (0.03)** 0.08 (0.02) 0.09 (0.02)
Excretion ratioc 0.31 (0.05) 0.47 (0.11)** 0.26 (0.11) 0.26 (0.07)
Cumulative excretion (% Dose) 22.1 (1.75)** 26.2 (3.76)** 14.2 (3.21) 15.6 (1.81)
Kidney accumulation (% Dose)e 19.7 (4.92) 29.1 (3.32)* 26.5 (5.78)* 20.9 (5.18)
Dose normalized AUC0-t (min-µg/ml)e 1.0 (0.08) 0.94 (0.04) 1.1 (0.09)*** 1.0 (0.02) aGlomerular filtration rate, normalized for kidney weight; bCalculated as the ratio of cumulative urinary excretion and AUC for duration of IPRK ex-periment (data are corrected for kidney weight); cCalculated are ratio of clearance (clearance/(fu × GFR)); dEstimated from mass balance analysis at end of experiment (dose-cumulative excretion-amount remaining in perfusate); eArea under the curve was estimated using trapezoidal rule. Estimates were divided by gentamicin dose; *Indicates values that are significantly different from all other treatment groups; **Indicates values that are signifi-cantly different from 20 µg/ml and 40 µg/ml treatment groups; ***Indicates values that are significantly different from 10 µg/ml treatment group.
kidney. Likewise, clearance and cumulative excretion decreased with increased gentamicin dose. Gentamicin kidney accumulation, estimated by mass balance, ranged from ~20% - 30% among the treatment groups.
3.4. Interaction Studies A second set of perfused experiments was carried out to assess whether the excretion profile and kidney accu-mulation of gentamicin could be altered through changes in pH or transport inhibition. Accordingly, gentamicin was co-perfused with NaHCO3 (to ↑ urine pH) and/or cimetidine (inhibitor of basolateral transport). As pre-sented in the Table 3, there were no significant differences in perfusion flow rate, urine flow rate, GFR and FR-Chloride among all study groups. Urine pH was significantly higher in NaHCO3-treated perfusions, which is rele-vant to the study design of those experiments. Although differences in glucose and sodium reabsorption were noted treatments, parameter estimates within acceptable ranges [24].
A plot of gentamicin perfusate concentrations vs. time is presented in Figure 1. The graph shows the cimeti-dine co-administration decreased the gentamicin elimination from the IPRK, whereas perfusate levels decreased more rapidly in the presence of NaHCO3. As noted in Figure 2, gentamicin urinary excretion was increased in the presence of NaHCO3.
Renal excretion parameters for these interaction experiments are summarized in Table 4. The data illustrate that NaHCO3 co-perfusion increased gentamicin elimination in the IPRK, as clearance, cumulative excretion and XR were all significantly increased compared to experiments with gentamicin alone. Whereas gentamicin clear- ance was apparently not impacted by cimetidine administration, kidney accumulation was significantly reduced.

A. Dontabhaktuni et al.
49
Table 3. IPRK viability parameters: interaction experiments.
Viability parameter
Treatment groups
Control drug naïve NaHCO3
Gentamicin 10 µg/ml
Gentamicin + NaHCO3
Gentamicin + Cimetidine
Gentamicin + Cimetidine +
NaHCO3 Perfusion flow rate (ml/min) 22.7 (2.50) 24.8 (3.74) 29.0 (1.10) 23.5 (4.87) 23.7 (7.21) 28.9 (4.97)
Urine flow rate (ml/min) 0.06 (0.03) 0.12 (0.05) 0.11 (0.02) 0.12 (0.01) 0.08 (0.02) 0.11 (0.01)
Urine pH 7.2 (0.04) 8.1 (0.58)* 7.1 (0.17) 8.1 (0.05)* 7.0 (0.08) 8.2 (0.04)*
GFRa (ml/min/g) 0.49 (0.15) 0.51 (0.09) 0.52 (0.12) 0.48 (0.04) 0.43 (0.03) 0.32 (0.01)
FRGlucoseb 0.96 (0.02) 0.94 (0.01) 0.97 (0.01) 0.93 (0.01) 0.95 (0.01) 0.88 (0.01)**
FRSodiumc 0.94 (0.03) 0.86 (0.03)* 0.88 (0.03) 0.85 (0.02)* 0.94 (0.03) 0.84 (0.01)*
FRChlorided 0.92 (0.04) 0.86 (0.06) 0.85 (0.03) 0.87 (0.03) 0.91 (0.01) 0.85 (0.01)
aGFR normalized per kidney weight; bFraction reabsorption of glucose; cFraction reabsorption of sodium; dFraction reabsorption of chloride; *Indicates values that are significantly different from control, gentamicin and gentamicin + cimetidine treatment groups; **Indicates values that are significantly different from all other treatment groups.
Figure 1. Plot of gentamicin perfusate concentration vs. time in the IPRK: Effect of co- administration of NaHCO3 and/or cimetidine.
When both NaHCO3 and cimetidine were administered together, gentamicin kidney accumulation decreased ~80%, with corresponding increases in clearance and XR compared to gentamicin alone.
4. Discussion Despite their toxicity profile, the clinical use of aminoglycosides has increased in recent years following the emergence of multidrug resistant pathogens [38]. Since the incidence of aminoglycoside nephrotoxicity is ~25%, various strategies have been proposed to circumvent this toxicity either by reducing drug accumulation in the kidney or by co-administering renoprotective compounds [1] [4].
It is well established that aminoglycosides are substrates for megalin, a multiligand endocytotic receptor in the luminal membrane of the kidney, and this is thought to be a major pathway for accumulation of aminoglyco-sides on the kidney [7] [39]. Accordingly, this pathway is a proposed target to prevent aminoglycoside toxicity, and research has showed that gentamicin binding can be inhibited by megalin ligands and small peptides [10]. However, concern has been raised about the clinical consequences of interfering with megalin-mediated

A. Dontabhaktuni et al.
50
Figure 2. Plot of gentamicin cumulative urinary excretion vs. time in the IPRK: Effect of co-administration of NaHCO3 and/or cimetidine.
Table 4. Gentamicin renal excretion parameters in IPRK: interaction experiments.
Parameter Gentamicin 10 µg/ml
Interactant (concentration)
NaHCO3 (0.25 mM) Cimetidine (2 mM) Cimetidine (2 mM) + NaHCO3 (0.25mM)
GFRa (ml/min/g) 0.52 (0.12) 0.48 (0.04) 0.43 (0.03) 0.32 (0.01)
Clearance (ml/min/g)b 0.18 (0.03) 0.40 (0.09)*,*** 0.16 (0.03)** 0.25 (0.04)*
Excretion ratioc 0.47 (0.11) 0.94 (0.22)* 0.41 (0.05)**,*** 0.89 (0.16)*
Cumulative excretion (% Dose) 26.2 (3.76) 47.7 (7.24)* 21.7 (4.43)**,*** 36.0 (5.55)
Kidney accumulationd (% Dose) 29.10 (3.32) 25.50 (7.34)*** 14.30 (1.22)*,** 6.16 (0.74)* AUC0-t
e (min∗µg/ml) 708 (32.0) 636 (16.1) 780 (27.1)** 695 (72.2)
aGlomerular filtration rate, normalized for kidney weight; bCalculated as the ratio of cumulative urinary excretion and AUC for duration of IPRK ex-periment (data are corrected for kidney weight); cCalculated are ratio of clearance (Clearance/(fu × GFR)); dEstimated from mass balance analysis at end of experiment (dose-cumulative excretion-amount remaining in perfusate); eArea under the curve was estimated using trapezoidal rule; *Indicates values that are significantly different from gentamicin alone; **Indicates values that are significantly different from NaHCO3 treatment group; ***Indicates values that are significantly different from Cimetidine + NaHCO3 treatment group. endocytosis [4]. Additionally, several preclinical studies have demonstrated reduced aminoglycoside nephrotox-icity through co-administration of antioxidants [21]-[23], so this is an avenue for further exploration.
In the present study, gentamicin excretion was evaluated in the IPRK model, a versatile ex vivo technique that can be used to study numerous aspects of renal drug disposition. Some of the earliest evidence that luminal up-take was responsible for the renal tubular uptake of gentamicin came from IPRK experiments in filtering and non-filtering kidneys [18]. The present work extended application of the IPRK to assess dose-linearity of gen-tamicin excretion and to probe ways to reduce kidney accumulation.
Dose linearity experiments were carried at four doses (400, 800, 1600 and 3200 µg) targeting initial concen-trations from 5 - 40 µg/ml. These concentrations encompass the clinical range of expected peak levels of genta-micin following a conventional dosing regimen (1 - 2 mg/kg every 8 hours, targeting peak serum concentrations of 5 - 10 µg/ml) or a “once daily” dosing regimen (5 - 7.5 mg/kg every 24 hours, targeting peak serum concen-trations as high as 30 - 40 µg/ml) [40] [41].
Estimates of gentamicin clearance in the IPRK have been reported by Bekersky et al. (0.25 - 0.30 ml/min, reference 25) and Collier et al. (0.32 ml/min, reference 18). These findings are based on studies performed at an

A. Dontabhaktuni et al.
51
initial drug concentration of 10 µg/ml. The results of the present investigation are consistent with these values. The mean gentamicin clearance (not kidney weight corrected, 10 µg/ml dosing group) was 0.29 ± 0.033 ml/min.
Approximately 50% - 60% of the administered gentamicin dose was eliminated from the perfusate over the duration of the IPRK experiment (100 minutes). Comparing the temporal profiles of urinary excretion rate with perfusate concentrations (Figure 3), there is a distributional delay in the renal excretion of gentamicin; that is, the luminal transport of gentamicin (kidney ⇒ urine) appears to be the rate-determining step for drug excretion. However, this observation is consistent with slow removal of drug from the proximal tubule [7], and would therefore lead to renal accumulation with successive dosing.
Gentamicin displayed nonlinear excretion in the IPRK, with significant decreases in clearance and cumulative excretion with increasing dose (Table 2). However, kidney accumulation (% dose) did not decrease with dose. Although “once a day” dosing is thought to decrease kidney accumulation through saturation of aminoglycoside reabsorption [1] [5] [9], the nonlinear behavior seen in the present study does not support this hypothesis. Ami-noglycoside uptake into the kidney involves pathways other than absorptive endocytosis [7], and it appears that one of these pathways is responsible for the nonlinearity in gentamicin excretion in the IPRK.
One of the goals of this investigation was to test potential strategies to decrease the kidney accumulation of gentamicin: urinary alkalization and co-administration of cimetidine. Administration of NaHCO3 (0.25 mM) to the IPRK caused a significant increase in urine pH from ~7.1 to ~8.1, and this effect was constant for the dura-tion of the experiment. Under these conditions, gentamicin excretion was significantly increased, as reflected in differences in clearance (0.40 ml/min/g vs. 0.18 ml/min/g), excretion ratio (0.47 to 0.94) and cumulative excre-tion (47.7% vs. 26.2%) compared to gentamicin alone.
Gentamicin tubular uptake has been studied extensively in the last decade. Ionized gentamicin binds to the acidic phospholipids on brush-border membrane of the renal tubular cell. Thus, altering the ionized fraction of gentamicin can ameliorate its nephrotoxicity. Gentamicin is weak base with a pKa = 7.4. Thus, increasing urine pH to 8.1 decreased the ionization of gentamicin to ~17%. Since luminal reabsorption of gentamicin is an elec-trostatic process [42], altering the cationic charge on the molecule adversely impacted epithelial uptake of gen-tamicin by reduced charged affinity for the luminal membrane. However, increased gentamicin excretion was not associated with decreased kidney accumulation (Table 4).
The effect of urinary alkalization on gentamicin kidney uptake and nephrotoxicity has previously been studied in rats. Whereas Chiu et al. observed a decrease in gentamicin accumulation in the kidney cortex when urine pH was increased [43], Elliott reported that pre-treatment with NaHCO3 was not associated with reduced gentamicin nephrotoxicity [44]. The results from these IPRK experiments suggest that while gentamicin excretion is increased
Figure 3. Comparison of the temporal changes in gentamicin perfusate concentration and urinary excretion rate following bolus dosing (800 µg) in the IPRK.

A. Dontabhaktuni et al.
52
when co-administered with NaHCO3, this strategy would likely not reduce the risk of nephrotoxicity, as kidney accumulation was not altered with this treatment.
IPRK experiments also investigated the effect of co-administration of cimetidine on gentamicin excretion and kidney accumulation. Although luminal transport has been the principle target for reducing aminoglycoside ac-cumulation in the kidney, there is evidence to suggest that gentamicin is secreted across the basolateral mem-brane [45] [46]. Cimetidine is a known inhibitor of basolateral organic cation transport (OCT2). Although cime-tidine had no apparent effect on gentamicin clearance and urinary excretion in the IPRK (Table 4), there was a slight increase in AUC (Figure 1) and a significant reduction in kidney accumulation (~50%). These results in-dicate that basolateral transport (blood → kidney) is a promising target for reducing aminoglycoside accumula-tion. Whereas tubular secretion may contribute significantly to the urinary excretion of aminoglycosides (i.e., inhibition of basolateral transport would not alter renal clearance), the pathway appears to be an important de-terminant of aminoglycoside toxicity.
In a final set of experiments, the effect of both basolateral transport inhibition and urinary alkalization on gentamicin disposition in the IPRK was explored. Co-administration with both cimetidine and NaHCO3 not only increased renal excretion of gentamicin, but kidney accumulation was also reduced 80% (Table 4). Thus, it ap-pears that urinary alkalization combined with basolateral transport inhibition is a potential strategy to limit the renal accumulation of gentamicin and to reduce the risk of drug-induced nephrotoxicity.
5. Conclusion While further studies are needed to confirm the results of this investigation and to evaluate the synergistic pro-tective effect of NaHCO3 and cimetidine, an advantage of this approach over other proposed strategies is that both compounds are clinically available. A recent clinical study found that oral administration of sodium bicar-bonate (4 g every 8 hours) was able to achieve a urine pH above 8 with no apparent adverse effects, although the authors acknowledge that more research is needed to investigate efficacy of longer periods of treatment [46]. Cimetidine is a commercially available medication used to treat gastric ulcers, gastroesophegeal reflux disease, and other conditions. While further studies are needed to confirm that kidney accumulation of gentamicin can be reduced at therapeutic doses of cimetidine, the findings of the present investigation are promising and merit con-tinued exploration.
Funding Information This research received no specific grant from any funding agency in the public, commercial, or not-for-profit sectors.
References [1] Nagai, J. and Takano, M. (2004) Molecular Aspects of Renal Handling of Aminoglycosides and Strategies for Prevent-
ing the Nephrotoxicity. Drug Metabolism and Pharmacokinetics, 19, 159-170. http://dx.doi.org/10.2133/dmpk.19.159 [2] Weinstein, M.J., Luedemann, G.M., Oden, E.M., Wagman, G.H., Rosselet, J.P., Marquez, J.A., Coniglio, C.T., Char-
ney, W., Herzog, H.L. and Black, J. (1963) Gentamicin, a New Antibiotic Complex from Micromonospora. Journal of Medicinal Chemistry, 6, 463-464. http://dx.doi.org/10.1021/jm00340a034
[3] Ali, B.H. (1995) Gentamicin Nephrotoxicity in Humans and Animals: Some Recent Research. General Pharmacology, 26, 1477-1487. http://dx.doi.org/10.1016/0306-3623(95)00049-6
[4] Lopez-Novoa, J.M., Quiros, Y., Vicente, L., Morales, A.I. and Lopez-Hernandez, F.J. (2011) New Insights into the Mechanism of Aminoglycoside Nephrotoxicity: An Integrative Point of View. Kidney International, 79, 33-45. http://dx.doi.org/10.1038/ki.2010.337
[5] Wargo, K.A. and Edwards, J.D. (2014) Aminoglycoside-Induced Nephrotoxicity. Journal of Pharmacy Practice, 27, 573-577. http://dx.doi.org/10.1177/0897190014546836
[6] Destache, C.J. (2014) Aminoglycoside-Induced Nephrotoxicity—A Focus on Monitoring: A Review of Literature. Journal of Pharmacy Practice, 27, 562-566. http://dx.doi.org/10.1177/0897190014546102
[7] Nagai, J. and Takano, M. (2014) Entry of Aminoglycosides into Renal Tubular Epithelial Cells via Endocytosis- Dependent and Endocytosis-Independent Pathways. Biochemical Pharmacology, 90, 331-337. http://dx.doi.org/10.1016/j.bcp.2014.05.018
[8] Triggs, E. and Charles, B. (1999) Pharmacokinetics and Therapeutic Drug Monitoring of Gentamicin in the Elderly.
A. Dontabhaktuni et al.
53
Clinical Pharmacokinetics, 37, 331-341. http://dx.doi.org/10.2165/00003088-199937040-00004 [9] Mingeot-Leclercq, M.P. and Tulkens, P.M. (1999) Aminoglycosides: Nephrotoxicity. Antimicrobial Agents and Che-
motherapy, 43, 1003-1012. [10] Nagai, J., Saito, M., Adachi, Y., Yumoto, R. and Takano, M. (2006) Inhibition of Gentamicin Binding to Rat Renal
Brush-Border Membrane by Megalin Ligands and Basic Peptides. Journal of Controlled Release, 112, 43-50. http://dx.doi.org/10.1016/j.jconrel.2006.01.003
[11] Feldman, S., Wang, M.Y. and Kaloyanides, G.J. (1982) Aminoglycosides Induce a Phospholipidosis in the Renal Cor-tex of the Rat: An Early Manifestation of Nephrotoxicity. Journal of Pharmacology and Experimental Therapeutics, 220, 514-520.
[12] Ghosh, P. and Chatterjee, S. (1987) Effects of Gentamicin on Sphingomyelinase Activity in Cultured Human Renal Proximal Tubular Cells. Journal of Biological Chemistry, 262, 12550-12556.
[13] Inui, K., Saito, H., Iwata, T. and Hori, R. (1988) Aminoglycoside-Induced Alterations in Apical Membranes of Kidney Epithelial Cell Line (LLC-PK1). American Journal of Physiology, 254, C251-C257.
[14] Kosek, J.C., Mazze, R.I. and Cousins, M.J. (1974) Nephrotoxicity of Gentamicin. Laboratory Investigation, 30, 48-57. [15] Moriyama, T., Nakahama, H., Fukuhara, Y., Horio, M., Yanase, M., Orita, Y., Kamada, T., Kanashiro, M. and Miyake,
Y. (1989) Decrease in the Fluidity of Brush-Border Membrane Vesicles Induced by Gentamicin. A Spin-Labeling Study. Biochemical Pharmacology, 38, 1169-1174. http://dx.doi.org/10.1016/0006-2952(89)90264-5
[16] Silverblatt, F.J. and Kuehn, C. (1979) Autoradiography of Gentamicin Uptake by the Rat Proximal Tubule Cell. Kidney International, 15, 335-345. http://dx.doi.org/10.1038/ki.1979.45
[17] Karasawa, T., Wang, Q., Fu, Y., Cohen, D.M. and Steyger, P.S. (2008) TRPV4 Enhances the Cellular Uptake of Ami-noglycoside Antibiotics. Journal of Cell Science, 121, 2871-2879. http://dx.doi.org/10.1242/jcs.023705
[18] Collier, V.U., Lietman, P.S. and Mitch, W.E. (1979) Evidence for Luminal Uptake of Gentamicin in the Perfused Rat Kidney. Journal of Pharmacology and Experimental Therapeutics, 210, 247-251.
[19] Rybak, M.J., Abate, B.J., Kang, S.L., Ruffing, M.J., Lerner, S.A. and Drusano, G.L. (1999) Prospective Evaluation of the Effect of an Aminoglycoside Dosing Regimen on Rates of Observed Nephrotoxicity and Ototoxicity. Antimicrobial Agents and Chemotherapy, 43, 1549-1555.
[20] Watanabe, A., Nagai, J., Adachi, Y., Katsube, T., Kitahara, Y., Murakami, T. and Takano, M. (2004) Targeted Preven-tion of Renal Accumulation and Toxicity of Gentamicin by Aminoglycoside Binding Receptor Antagonists. Journal of Controlled Release, 95, 423-433. http://dx.doi.org/10.1016/j.jconrel.2003.12.005
[21] Koyner, J.L., Sher Ali, R. and Murray, P.T. (2008) Antioxidants. Do They Have a Place in the Prevention or Therapy of Acute Kidney Injury? Nephron Experimental Nephrology, 109, e109-e117. http://dx.doi.org/10.1159/000142935
[22] Sardana, A., Kalra, S., Khanna, D. and Balakumar, P. (2015) Nephroprotective Effect of Catechin on Gentamicin- Induced Experimental Nephrotoxicity. Clinical and Experimental Nephrology, 19, 178-184. http://dx.doi.org/10.1007/s10157-014-0980-3
[23] Morsy, M.A., Ibrahim, S.A., Amin, E.F., Kamel, M.Y., Rifaai, R.A. and Hassan, M.K. (2014) Sildenafil Ameliorates Gentamicin-Induced Nephrotoxicity in Rats: Role of iNOS and eNOS. Journal of Toxicology, 2014, Article ID: 489382. http://dx.doi.org/10.1155/2014/489382
[24] Taft, D.R. (2004) The Isolated Perfused Rat Kidney Model: A Useful Tool for Drug Discovery and Development. Current Drug Discovery Technologies, 1, 97-111. http://dx.doi.org/10.2174/1570163043484824
[25] Urakami, Y., Kimura, N., Okuda, M. and Inui, K. (2004) Creatinine Transport by Basolateral Organic Cation Trans-porter hOCT2 in the Human Kidney. Pharmaceutical Research, 21, 976-981. http://dx.doi.org/10.1023/B:PHAM.0000029286.45788.ad
[26] Bekersky, I. (1983) Use of the Isolated Perfused Kidney as a Tool in Drug Disposition Studies. Drug Metabolism Re-views, 14, 931-960. http://dx.doi.org/10.3109/03602538308991417
[27] Poola, N.R., Bhuiyan, D., Ortiz, S., Savant, I.A., Sidhom, M., Taft, D.R., Kirschenbaum, H. and Kalis, M. (2002) A Novel HPLC Assay for Pentamidine: Comparative Effects of Creatinine and Inulin on GFR Estimation and Pentami-dine Renal Excretion in the Isolated Perfused Rat Kidney. Journal of Pharmacy and Pharmaceutical Sciences, 5, 135-145.
[28] Barends, D.M., van der Sandt, J.S. and Hulshoff, A. (1980) Micro Determination of Gentamicin in Serum by High- Performance Liquid Chromatography with Ultraviolet Detection. Journal of Chromatography B: Biomedical Sciences and Applications, 182, 201-210. http://dx.doi.org/10.1016/S0378-4347(00)81624-2
[29] Larsen, N.E., Marinelli, K. and Heilesen, A.M. (1980) Determination of Gentamicin in Serum Using Liquid Column Chromatography. Journal of Chromatography B: Biomedical Sciences and Applications, 221, 182-187. http://dx.doi.org/10.1016/S0378-4347(00)81023-3

A. Dontabhaktuni et al.
54
[30] Maitra, S.K., Yoshikawa, T.T., Hansen, J.L., Nilsson-Ehle, I., Palin, W.J., Schotz, M.C. and Guze, L.B. (1977) Serum Gentamicin Assay by High-Performance Liquid Chromatography. Clinical Chemistry, 23, 2275-2278.
[31] Walker, S.E. and Coates, P.E. (1981) High-Performance Liquid Chromatographic Methods for Determination of Gen-tamicin in Biological Fluids. Journal of Chromatography B: Biomedical Sciences and Applications, 223, 131-138. http://dx.doi.org/10.1016/S0378-4347(00)80075-4
[32] White, L.O., Lovering, A. and Reeves, D.S. (1983) Variations in Gentamicin C1, C1a, C2, and C2a Content of Some Preparations of Gentamicin Sulphate Used Clinically as Determined by High-Performance Liquid Chromatography. Therapeutic Drug Monitoring, 5, 123-126. http://dx.doi.org/10.1097/00007691-198303000-00014
[33] Yusuf, A., Al-Rawithi, S., Raines, D., Frayha, H., Toonsi, A., Al-Mohsen, I. and El-Yazigi, A. (1999) Simplified High-Performance Liquid Chromatographic Method for the Determination of Gentamicin Sulfate in a Microsample of Plasma: Comparison with Fluorescence Polarization Immunoassay. Therapeutic Drug Monitoring, 21, 647-652. http://dx.doi.org/10.1097/00007691-199912000-00012
[34] Dontabhaktuni, A., Sidhom, M.B. and Taft, D.R. (2005) An Alternative HPLC Assay for Gentamicin. AAPS Annual Meeting, Nashville, 6-10 November 2005.
[35] Bader, M. (1980) A Systematic Approach to Standard Addition Methods in Instrumental Analysis. Journal of Chemi-cal Education, 57, 703. http://dx.doi.org/10.1021/ed057p703
[36] Maack, T. (1980) Physiological Evaluation of the Isolated Perfused Rat Kidney. American Journal of Physiology, 238, F71-F78.
[37] Ajavon, A.D., Bonate, P.L. and Taft, D.R. (2010) Renal Excretion of Clofarabine: Assessment of Dose-Linearity and Role of Renal Transport Systems on Drug Excretion. European Journal of Pharmaceutical Sciences, 40, 209-216. http://dx.doi.org/10.1016/j.ejps.2010.03.014
[38] Poulikakos, P., Tansarli, G.S. and Falagas, M.E. (2014) Combination Antibiotic Treatment versus Monotherapy for Multidrug-Resistant, Extensively Drug-Resistant, and Pandrug-Resistant Acinetobacter Infections: A Systematic Re-view. European Journal of Clinical Microbiology & Infectious Diseases, 33, 1675-1685. http://dx.doi.org/10.1007/s10096-014-2124-9
[39] Schmitz, C., Hilpert, J., Jacobsen, C., Boensch, C., Christensen, E.I., Luft, F.C. and Willnow, T.E. (2002) Megalin De-ficiency Offers Protection from Renal Aminoglycoside Accumulation. The Journal of Biological Chemistry, 277, 618- 622. http://dx.doi.org/10.1074/jbc.M109959200
[40] Schentag, J.J., Meagher, A.K. and RW, J. (2006) Aminoglycosides. In: Burton, M.E., Shaw, L., Schentag, J.J. and Evans, E., Eds., Applied Pharmacokinetics & Pharmacodynamics: Principles of Therapeutic Drug Monitoring, Lip-pincott Williams & Wilkins, New York, 306.
[41] Freeman, C.D., Nicolau, D.P., Belliveau, P.P. and Nightingale, C.H. (1997) Once-Daily Dosing of Aminoglycosides: Review and Recommendations for Clinical Practice. Journal of Antimicrobial Chemotherapy, 39, 677-686. http://dx.doi.org/10.1093/jac/39.6.677
[42] Sastrasinh, M., Knauss, T.C., Weinberg, J.M. and Humes, H.D. (1982) Identification of the Aminoglycoside Binding Site in Rat Renal Brush Border Membranes. Journal of Pharmacology and Experimental Therapeutics, 222, 350-358.
[43] Chiu, P.J., Miller, G.H., Long, J.F. and Waitz, J.A. (1979) Renal Uptake and Nephrotoxicity of Gentamicin during Urinary Alkalinization in Rats. Clinical and Experimental Pharmacology and Physiology, 6, 317-326. http://dx.doi.org/10.1111/j.1440-1681.1979.tb01253.x
[44] Elliott, W.C., Parker, R.A., Houghton, D.C., Gilbert, D.N., Porter, G.A., DeFehr, J. and Bennett, W.M. (1980) Effect of Sodium Bicarbonate and Ammonium Chloride Ingestion in Experimental Gentamicin Nephrotoxicity in Rats. Research Communications in Chemical Pathology and Pharmacology, 28, 483-495.
[45] Pastoriza-Munoz, E., Bowman, R.L. and Kaloyanides, G.J. (1979) Renal Tubular Transport of Gentamicin in the Rat. Kidney International, 16, 440-450. http://dx.doi.org/10.1038/ki.1979.149
[46] Cohen, B., Laish, I., Brosh-Nissimov, T., Hoffman, A., Katz, L.H., Braunstein, R., Sagi, R. and Michael, G. (2013) Ef-ficacy of Urine Alkalinization by Oral Administration of Sodium Bicarbonate: A Prospective Open-Label Trial. The American Journal of Emergency Medicine, 31, 1703-1706. http://dx.doi.org/10.1016/j.ajem.2013.08.031

A. Dontabhaktuni et al.
55
Supplementary Table S1. Summary of calibration curve of gentamicin HPLC method in IPRK perfusate and KHS buffer.
Matrix Concentration range (µg/ml) Correlationa ( r2 ) Slopea Intercepta
Perfusateb 1 - 40 0.99 ± 0.01 21.5 ± 1.46 1.20 ± 1.33
KHS buffer 10 - 100 0.99 ± 0.01 3.96 ± 0.12 0.91 ± 3.96 aData presented as mean ± standard deviation of six calibration curves; bData obtained after the application of standard addition method. Table S2. Precision of gentamicin quantification method by HPLC in IPRK perfusate and KHS buffer.
Matrix Concentration (µg/ml) Concentration predicteda (µg/ml)
Mean prediction error (%) CV%
Perfusateb
1 1.17 ± 0.10 17.50 9.31
2 2.18 ± 0.22 9.23 10.00
3 3.04 ± 0.09 1.37 3.03
5 4.56 ± 0.29 −8.77 6.50
10 9.64 ± 0.66 −3.57 6.84
20 20.6 ± 1.00 2.94 4.88
40 40.6 ± 0.94 1.43 2.32
KHS buffer
10 10.6 ± 1.15 6.59 10.80
15 15.5 ± 0.35 3.45 2.27
20 20.8 ± 1.04 3.74 4.99
40 39.2 ± 1.35 −2.04 3.45
60 59.3 ± 1.88 −1.12 3.17
80 79.3 ± 2.09 −0.82 2.63
100 103 ± 2.74 3.15 2.65 aData presented as mean ± standard deviation of six replicate injections at each concentration; bData obtained after standard addition method was uti-lized.