genome-wide comparison of phage m13-infected vs...
TRANSCRIPT

LUND UNIVERSITY
PO Box 117221 00 Lund+46 46-222 00 00
Genome-wide comparison of phage M13-infected vs. uninfected Escherichia coli
Karlsson, Fredrik; Malmborg Hager, Ann-Christin; Albrekt, Ann-Sofie; Borrebaeck, Carl
Published in:Canadian Journal of Microbiology
DOI:10.1139/W04-113
Published: 2005-01-01
Link to publication
Citation for published version (APA):Karlsson, F., Malmborg Hager, A-C., Albrekt, A-S., & Borrebaeck, C. (2005). Genome-wide comparison of phageM13-infected vs. uninfected Escherichia coli. Canadian Journal of Microbiology, 51(1), 29-35. DOI:10.1139/W04-113
General rightsCopyright and moral rights for the publications made accessible in the public portal are retained by the authorsand/or other copyright owners and it is a condition of accessing publications that users recognise and abide by thelegal requirements associated with these rights.
• Users may download and print one copy of any publication from the public portal for the purpose of privatestudy or research. • You may not further distribute the material or use it for any profit-making activity or commercial gain • You may freely distribute the URL identifying the publication in the public portalTake down policyIf you believe that this document breaches copyright please contact us providing details, and we will removeaccess to the work immediately and investigate your claim.

Download date: 12. Sep. 2018

Genome-wide comparison of phage M13-infectedvs. uninfected Escherichia coli
Fredrik Karlsson, Ann-Christin Malmborg-Hager, Ann-Sofie Albrekt,and Carl A.K Borrebaeck
Abstract: To identify Escherichia coli genes potentially regulated by filamentous phage infection, we usedoligonucleotide microarrays. Genome-wide comparison of phage M13-infected and uninfected E. coli, 2 and 20 min af-ter infection, was performed. The analysis revealed altered transcription levels of 12 E. coli genes in response to phageinfection, and the observed regulation of phage genes correlated with the known in vivo pattern of M13 mRNA spe-cies. Ten of the 12 host genes affected could be grouped into 3 different categories based on cellular function, suggest-ing a coordinated response. The significantly upregulated genes encode proteins involved in reactions of the energy-generating phosphotransferase system and transcription processing, which could be related to phage transcription. Nogenes belonging to any known E. coli stress response pathways were scored as upregulated. Furthermore, phage infec-tion led to significant downregulation of transcripts of the bacterial genes gadA, gadB, hdeA, gadE, slp, and crl. Thesedownregulated genes are normally part of the host stress response mechanisms that protect the bacterium during condi-tions of acid stress and stationary phase transition. The phage-infected cells demonstrated impaired function of the oxi-dative and the glutamate-dependent acid resistance systems. Thus, global transcriptional analysis and functional analysisrevealed previously unknown host responses to filamentous phage infection.
Key words: filamentous phage infection, global transcriptional analysis, AR, Escherichia coli.
Résumé : Afin d’identifier les gènes de Escherichia coli (E. coli) potentiellement régulés par l’infection d’un phage fi-lamenteux, nous avons employé des microréseaux à oligonucléotides. Nous avons donc effectué une comparaison baséesur tout le génome de E. coli infecté ou non avec le phage M13, 2 et 20 minutes post-infection. Les résultats des ana-lyses ont révélé des changements dans les niveaux de transcription de 12 gènes de E. coli en réponse à l’infection parle phage; la régulation observée des gènes de phage a corrélé avec les profils in vivo connus des ARNm de M13. Dixdes douze gènes de l’hôte influencés ont pu être regroupés en 3 catégories fonctionnelles, indiquant une réponse coor-donnée. Les gènes significativement modulés à la hausse codent des protéines impliquées dans les réactions du systèmede phosphotransférases (SPT) générateur d’énergie ainsi que dans la transcription reliée au phage. Nous n’avons notéaucun gène modulé à la hausse appartenant à des voies de stress connues chez E. coli. De plus, l’infection par lephage a mené à une régulation à la baisse significative des transcrits des gènes bactériens gadA, gadB, hdeA, gadE, slpet crl. Ces gènes régulés à la baisse fort normalement partie des mécanismes de réponse aux stress de l’hôte qui pro-tège la bactérie dans des conditions de stress acide et de transition en phase stationnaire. Les cellules infectées par desphage démontraient des déficiences dans le fonctionnement de leurs systèmes de résistance au stress oxydatif et austress acide dépendant du glutamate. Ainsi, l’analyse transcriptionnelle globale et l’analyse fonctionnelle ont mis enévidence des réponses à l’infection par un phage filamenteux auparavant inconnues.
Mots clés : infection par un phage filamenteux, analyse transcriptionnelle globale, résistance à l’acide (RA), Escherichia coli.
[Traduit par la Rédaction] Karlsson et al. 35
Introduction
The bacterium Escherichia coli can become infected by anumber of different bacteriophages, i.e., viruses that infectonly bacteria. Most bacteriophages that have been studiedare temperate and have the ability to remain essentially qui-escent with their viral DNA integrated in the host chromo-
some, whereas others are virulent, causing the host cell toburst (lyse) at the terminal release of new phage particles.However, some phages are released without lysis of theirhost cell. The filamentous phages (e.g., M13, fd, or f1) donot kill their E. coli hosts but establish a symbiotic relation-ship in which new virions are continually released by a se-cretory mechanism. The biological features of the
Can. J. Microbiol. 51: 29–35 (2005) doi: 10.1139/W04-113 © 2005 NRC Canada
29
Received 22 June 2004. Revision received 1 October 2004. Accepted 22 October 2004. Published on the NRC Research Press Website at http://cjm.nrc.ca on 17 March 2005.
F. Karlsson, A.-C. Malmborg-Hager,1 A.-S. Albrekt, and C.A.K. Borrebaeck.2 Department of Immunotechnology, LundUniversity, SE-220 07 Lund, Sweden.
1Present address: Alligator Bioscience AB, SE-223 70 Lund, Sweden.2Corresponding author (e-mail: [email protected]).
filamentous bacteriophage have essentially been covered, in-cluding its infection mechanism, genome organization, andDNA replication and assembly process, leading to the secre-tion of progeny phage (Model and Russel 1988; Raschedand Oberer 1986; Webster 1996). It is also known that in thephage life cycle different host proteins are engaged, as ex-emplified by the bacterial TolQRA proteins involved in theinfection process (Click and Webster 1997, 1998), the bacte-rial stress protein PspA induced by the phage gene IV pro-tein during assembly and release of new phage particles(Brissette et al. 1990; Weiner and Model 1994), and the hostendonuclease RNase E involved in processing phage mRNA(Goodrich and Steege 1999; Kokoska and Steege 1998;Kokoska et al. 1990). However, given the available newtechnologies, such as microarrays, it is now possible to ex-plore the entire transcription profile of infected bacteria tolook for transcriptional changes that might reveal other hostproteins affected by the presence of filamentous phage.
Therefore, we studied host cell responses to phage infec-tion by comparing the transcription profiles of bacteria in-fected with M13 bacteriophage for 2 or 20 min with those ofuninfected bacteria, using oligonucleotide microarrays.Thus, for each of the 2 time points there was an uninfectedcontrol. We also compared cells infected for 20 min to cellsinfected for 2 min. The time points were carefully chosen todetect transcriptional changes that arise early after infection.The phage infection process and the following reproductionphase are rapid events. Phage transcripts are detected after2 min (Blumer and Steege 1984; Steege 2000), and the ma-jor phage mRNAs are generated sequentially over a 10-minperiod after infection (Blumer and Steege 1984). The firstrelease of phage progeny occurs 15–20 min after infection(Blumer and Steege 1984; Hofschneider and Preuss 1963).Thus, at this early phase after infection one can expect thelevel of adaptation within the infected cells to be the great-est.
Methods
We used Top10F′ E. coli (F′{lacIq Tn10 (TetR)} mcrA∆(mrr-hsdRMS-mcrBC) φ80lacZ∆M15 ∆lacX74 deoRrecA1 araD139 ∆(ara-leu) 7697 galU galK rpsL endA1 nupG)(Invitrogen Corp. Carlsbad, Calif.) as host strain for the phageinfection. Cells were grown in 2× yeast–tryptone (YT) medium(Sambrook et al. 1989) containing 10 µg tetracycline·mL–1 tolog-phase (OD600 = 0.6). The growing culture was split inhalves, of which 1 was subjected to phage infection and theother, not receiving any phage, served as a control. VCSM13phage (Stratagene, La Jolla, Calif.) was used to infect thepili-expressing bacteria (multiplicity of infection ratio100:1). Infection was allowed to proceed for 2 and 20 minbefore isolation of RNA. Phage infection was monitoredboth by titration of the cells resistant to kanamycin, themarker carried by the VCSM13 phage, on YT-agar plates,and by the protocol of Rapoza et al. (Rapoza and Webster1995) with slight modifications. Briefly, after 2 (or 20) minthe infection was stopped by rapid chilling to 0 °C. The in-fected culture was then filtered through an ice-cold Milliporetype HA (0.45 µm) filter to remove free phage. The cellswere washed with 2 volumes of cold media and then re-
moved from the filter in 1 volume of cold media. Cells werediluted and plated onto YT-agar. The resulting colonies werepicked onto lawns of Top10F′ to determine the rates of in-fection.
The Affymetrix (Affymetrix Inc., Santa Clara, Calif.)sense array GeneChip® contains 7312 probe sets comple-mentary to 4285 protein coding genes plus 116 RNAs of theE. coli genome. The M13 bacteriophage genes gI, gII 5′, gII3′, gIII, gIV, gV, gVI, gVII, gVIII, and gIX are also repre-sented on the chips. A probe set is made up of 20 differentprobe pairs of a perfect match (PM) sequence and a mis-match (MM) sequence. The PM is complementary to the ref-erence sequence, while the MM contains a single,homomeric base change at position 13 of the 25-mer oligo-nucleotide (Selinger et al. 2000).
Enrichment, fragmentation, and labelling of samplemRNA and subsequent microarray analysis were performedaccording to the Affymetrix Expression Analysis TechnicalManual (available at: www.affymetrix.com). Of note is thatmRNA was prepared from samples and controls simulta-neously using the same protocol throughout, allowing us toperform the subsequent comparative analysis without intro-ducing asymmetric experimental errors. Fragmented and la-belled mRNA (3.6 µg) was hybridized for 16 h at 45 °C tothe E. coli GeneChip® arrays according to the AffymetrixTechnical manual. The hybridized chips were washed andstained in the GeneChip® fluidics station (Affymetrix Inc.).The probe arrays were scanned with the Gene Array Scannerand analyzed.
For statistical analysis of the genechip results, we pre-pared mRNA samples from infected and uninfected cells on2 separate occasions, thus obtaining 2 biological replicatesfor each time point (2 and 20 min) and experimental condi-tion (±phage infection). We used MAS 5.0 New StatisticalAlgorithm from Affymetrix to generate lists of genes withsignificantly altered transcription. Each chip file was sub-jected to comparison analysis, i.e., 2 samples are comparedwith each other in order to detect and quantify changes ingene expression. One array is designated as the baseline andthe other as the experiment. The analysis compares the dif-ference values (between PM and MM) of each probe pair inthe baseline array to its matching probe pair on the experi-mental array. A change algorithm generates a Change pvalue and an associated Change call, using statistically rele-vant tests (www.affymetrix.com). The p values range inscale from 0.0 to 1.0 and provide a measure of the likelihoodof change and direction. Values close to 0.0 indicate an in-crease compared with the baseline, whereas values close to1.0 indicate a decrease in transcript expression level. In thisstudy, we set the average Change p value threshold for in-crease to p ≤ 0.005 and the threshold for decrease to p ≥0.995.
We first compared transcription 2 and 20 min after phageinfection with corresponding uninfected controls. Then wemonitored transcriptional changes within infected cells overtime by comparing transcription in infected cells 2 and20 min after infection. The control comparison between un-infected samples from the 2 time points showed that therewas no significant change in gene transcription in the unin-fected bacteria over the 20-min period. The duplicate sam-
© 2005 NRC Canada
30 Can. J. Microbiol. Vol. 51, 2005
ples (biological replicates) for each time point and conditiongave 4 comparison files for each of the 4 situations understudy (Tables 1 and 2).
Results
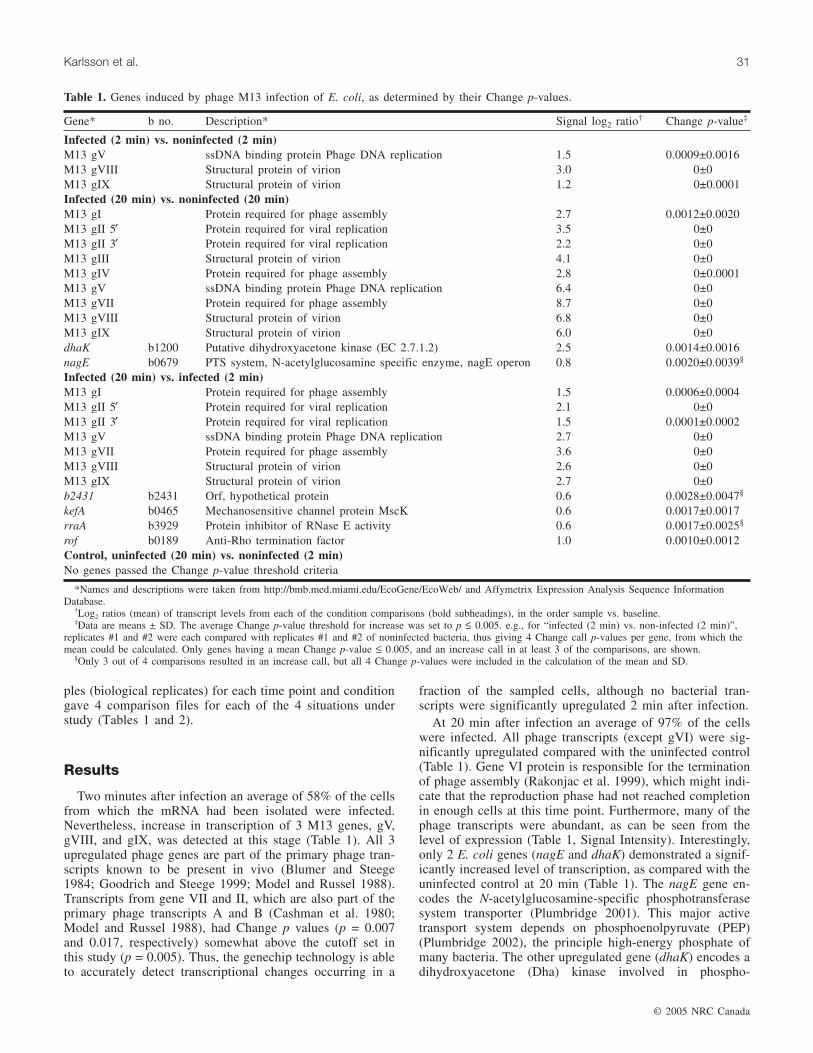
Two minutes after infection an average of 58% of the cellsfrom which the mRNA had been isolated were infected.Nevertheless, increase in transcription of 3 M13 genes, gV,gVIII, and gIX, was detected at this stage (Table 1). All 3upregulated phage genes are part of the primary phage tran-scripts known to be present in vivo (Blumer and Steege1984; Goodrich and Steege 1999; Model and Russel 1988).Transcripts from gene VII and II, which are also part of theprimary phage transcripts A and B (Cashman et al. 1980;Model and Russel 1988), had Change p values (p = 0.007and 0.017, respectively) somewhat above the cutoff set inthis study (p = 0.005). Thus, the genechip technology is ableto accurately detect transcriptional changes occurring in a
fraction of the sampled cells, although no bacterial tran-scripts were significantly upregulated 2 min after infection.
At 20 min after infection an average of 97% of the cellswere infected. All phage transcripts (except gVI) were sig-nificantly upregulated compared with the uninfected control(Table 1). Gene VI protein is responsible for the terminationof phage assembly (Rakonjac et al. 1999), which might indi-cate that the reproduction phase had not reached completionin enough cells at this time point. Furthermore, many of thephage transcripts were abundant, as can be seen from thelevel of expression (Table 1, Signal Intensity). Interestingly,only 2 E. coli genes (nagE and dhaK) demonstrated a signif-icantly increased level of transcription, as compared with theuninfected control at 20 min (Table 1). The nagE gene en-codes the N-acetylglucosamine-specific phosphotransferasesystem transporter (Plumbridge 2001). This major activetransport system depends on phosphoenolpyruvate (PEP)(Plumbridge 2002), the principle high-energy phosphate ofmany bacteria. The other upregulated gene (dhaK) encodes adihydroxyacetone (Dha) kinase involved in phospho-
© 2005 NRC Canada
Karlsson et al. 31
Gene* b no. Description* Signal log2 ratio† Change p-value‡
Infected (2 min) vs. noninfected (2 min)M13 gV ssDNA binding protein Phage DNA replication 1.5 0.0009±0.0016M13 gVIII Structural protein of virion 3.0 0±0M13 gIX Structural protein of virion 1.2 0±0.0001Infected (20 min) vs. noninfected (20 min)M13 gI Protein required for phage assembly 2.7 0.0012±0.0020M13 gII 5′ Protein required for viral replication 3.5 0±0M13 gII 3′ Protein required for viral replication 2.2 0±0M13 gIII Structural protein of virion 4.1 0±0M13 gIV Protein required for phage assembly 2.8 0±0.0001M13 gV ssDNA binding protein Phage DNA replication 6.4 0±0M13 gVII Protein required for phage assembly 8.7 0±0M13 gVIII Structural protein of virion 6.8 0±0M13 gIX Structural protein of virion 6.0 0±0dhaK b1200 Putative dihydroxyacetone kinase (EC 2.7.1.2) 2.5 0.0014±0.0016nagE b0679 PTS system, N-acetylglucosamine specific enzyme, nagE operon 0.8 0.0020±0.0039§
Infected (20 min) vs. infected (2 min)M13 gI Protein required for phage assembly 1.5 0.0006±0.0004M13 gII 5′ Protein required for viral replication 2.1 0±0M13 gII 3′ Protein required for viral replication 1.5 0.0001±0.0002M13 gV ssDNA binding protein Phage DNA replication 2.7 0±0M13 gVII Protein required for phage assembly 3.6 0±0M13 gVIII Structural protein of virion 2.6 0±0M13 gIX Structural protein of virion 2.7 0±0b2431 b2431 Orf, hypothetical protein 0.6 0.0028±0.0047§
kefA b0465 Mechanosensitive channel protein MscK 0.6 0.0017±0.0017rraA b3929 Protein inhibitor of RNase E activity 0.6 0.0017±0.0025§
rof b0189 Anti-Rho termination factor 1.0 0.0010±0.0012Control, uninfected (20 min) vs. noninfected (2 min)No genes passed the Change p-value threshold criteria
*Names and descriptions were taken from http://bmb.med.miami.edu/EcoGene/EcoWeb/ and Affymetrix Expression Analysis Sequence InformationDatabase.
†Log2 ratios (mean) of transcript levels from each of the condition comparisons (bold subheadings), in the order sample vs. baseline.‡Data are means ± SD. The average Change p-value threshold for increase was set to p ≤ 0.005. e.g., for “infected (2 min) vs. non-infected (2 min)”,
replicates #1 and #2 were each compared with replicates #1 and #2 of noninfected bacteria, thus giving 4 Change call p-values per gene, from which themean could be calculated. Only genes having a mean Change p-value ≤ 0.005, and an increase call in at least 3 of the comparisons, are shown.
§Only 3 out of 4 comparisons resulted in an increase call, but all 4 Change p-values were included in the calculation of the mean and SD.
Table 1. Genes induced by phage M13 infection of E. coli, as determined by their Change p-values.

transferase system reactions, in which Dha is phosphorylatedat the expense of PEP (Gutknecht et al. 2001). Thus, phageinfection upregulated 2 genes that, during the initial steps ofcellular energy generation, are involved in carbohydrate-dependent phosphotransfer of the high-energy carrier mole-cule PEP.
Over time, the infected bacteria were found to upregulaterraA, rof, kefA, and b2431 transcripts (Table 1). The genekefA encodes MscK, a protein forming a mechanosensitivechannel (McLaggan et al. 2002), and b2431 seems to be anE. coli-specific open reading frame of unknown function.However, it was recently proven that rraA encodes apolypeptide that binds to the essential E. coli endonucleaseRNase E, inhibiting its RNA processing activity (Lee et al.2003). Overexpression of rraA stabilizes numerous tran-scripts (Lee et al. 2003), and it has been shown that filamen-tous phage primary transcripts are subject to both RNase E-dependent and RNase E-independent cleavage (Goodrichand Steege 1999; Kokoska and Steege 1998; Kokoska et al.1990). The products of rof bind to and inhibit the transcrip-tion termination factor Rho, giving Rof antiterminator activ-ity (Pichoff et al. 1998). The phage genome contains 2 Rho-dependent terminators, but phage transcription of the mostfrequently transcribed region is followed by Rho-independent termination at a common site (Model and Rus-sel 1988).
Nevertheless, both RraA and Rof are involved in tran-scription processing and affect the function of proteins re-lated to phage transcription, and may thus play importantroles in processing phage transcripts. Furthermore, as RraAinhibits the major E. coli endonuclease RNase E, known toprocess transcripts prominently encoding proteins involvedin energy-generating pathways (Bernstein et al. 2002; Lee etal. 2002), it may provide a possible regulatory link to theupregulated nagE and dhaK genes. RNase E is intimatelycoupled to RNA processing of filamentous phage mRNA(Kokoska and Steege 1998; Kokoska et al. 1990; Stump andSteege 1996), and inactivation of its function leads to differ-
ential stabilization of primary phage transcripts and 10-foldlower phage titres (Kokoska and Steege 1998). Therefore,the RNase E-inhibiting capacity of RraA can represent a po-tential host defence mechanism. Another possibility is thatthe upregulation of rraA can account for the differentsteady-state levels of mRNAs and proteins observed for fila-mentous phages, by stabilizing the primary phage transcriptRNA A.
The reason why the phage shock protein A (pspA) genewas not induced by the phage infection is at present notclear, but our results were obtained using cells in mid log-phase in contrast to the late log-phase cells used by Brissetteet al. (1990). Moreover, since Model et al. (1997) haveshown that it is the insertion of pIV into the membrane dur-ing phage assembly that triggers pspA induction, it appearsthis stage was not reached in enough cells to allow detectionof the host response. Neither the control samples nor the in-fected samples analyzed after 2 min generated any bacterialgenes with altered transcription levels. However, this doesnot imply that the transcription level of an individual gene isidentical in the 2-min infected sample and the 20-min unin-fected control.
The comparative analysis also detected downregulation inthe transcription of bacterial genes in response to phage in-fection, albeit not at 2 min after infection (Table 2). After20 min of infection, the transcripts of 4 bacterial genes(gadA, gadB, hdeA, and gadE) were detected as significantlydownregulated compared with uninfected cells (Table 2).The function of all these downregulated genes is related toacid resistance (AR) (De Biase et al. 1996; Gajiwala andBurley 2000; Hartl and Martin 1995; Hersh et al. 1996;Hommais et al. 2004), demonstrating that phage infectiondownregulated genes with closely related functions.
Furthermore, in infected cells, we identified transcriptsdownregulated over time. This procedure revealed 2 bacte-rial genes (slp and crl) having downregulated transcription(Table 2). Both slp and crl have been implicated in the genesinvolved in the stress response induced by transition into sta-
© 2005 NRC Canada
32 Can. J. Microbiol. Vol. 51, 2005
Gene* b no. Description* Signal log2 ratio† Change p-value‡
Infected (2 min) vs. non-infected (2 min)No genes passed the Change p-value threshold criteriaInfected (20 min) vs. non-infected (20 min)gadA b3517 Glutamate decarboxylase A –2.8 0.9990±0.0021gadB b1493 Glutamate decarboxylase B –3.0 1.0±0hdeA b3510 Periplasmic chaperone of acid-denatured proteins –1.5 1.0±0gadE b3512 Required for stationary phase-, pH- and EvgA-induced acid resistance –1.5 0.9991±0.0013Infected (20 min) vs. infected (2 min)crl b0240 Transcriptional regulator of cryptic csgA gene for curli surface fibers –1.0 0.9968±0.0064§
slp b3506 Outer membrane protein, starvation and stationary phase inducible –1.2 0.9997±0.0004Control, uninfected (20 min) vs. uninfected (2 min)No genes passed the Change p-value threshold criteria
*Names and descriptions were taken from http://bmb.med.miami.edu/EcoGene/EcoWeb/ and Affymetrix Expression Analysis Sequence InformationDatabase.
†Log2 ratios (mean) of transcript levels from each of the condition comparisons (bold subheadings), in the order sample vs. baseline. A negative valuedenotes a decrease in transcription, compared to the baseline file.
‡Data are means ± SD. The average Change p-value threshold for Decrease was set to p ≥ 0.995. e.g., for “infected (2 min) vs. non-infected (2 min)”,the replicates #1 and #2 were each compared to the replicates #1 and #2 of non-infected bacteria, thus giving 4 Change call p-values per gene from whichthe mean could be calculated. Only genes having a mean Change p-value ≥ 0.995, and a Decrease call in at least 3 of the comparisons, are shown.
§Only 3 out of 4 comparisons resulted in a Decrease call, but all 4 Change p-values were included in the calculation of the mean and SD.
Table 2. Genes suppressed by phage M13 infection of E. coli, as determined by their Change p-values.

tionary phase (Alexander and St. John 1994; Pratt andSilhavy 1998; Tao et al. 1999). In addition, the gene slp isupregulated during acid stress (Tucker et al. 2002), and Crlhas been shown to stimulate the activity of a general stressresponse regulator involved in AR (Pratt and Silhavy 1998).
Thus, all of the genes found to be downregulated in re-sponse to phage infection have been implicated in acid stressresponses. The interpretation of this is not clear at present,but we still decided to confirm the downregulation of theseAR genes at the protein level. We therefore tested whetherphage-infected cells were less tolerant to conditions of lowpH, by way of AR assays. Detailed studies of AR mecha-nisms in E. coli have exposed 3 systems that can protectcells against pH as low as 2.0 (Hersh et al. 1996; Lin et al.1995, 1996). The first of these AR systems is termed theRpoS-dependent oxidative system and involves the alterna-tive sigma factor RpoS, an RNA polymerase subunit ex-pressed by the rpoS gene (Lin et al. 1995). Expression of theRpoS-dependent AR system is induced by Luria–Bertani(LB) medium and repressed by glucose (Castanie-Cornet etal. 1999). The glucose repression of the oxidative AR systemis necessary for testing of the second, glutamate-dependentAR system, which requires growth in LB–glucose. The third,arginine-dependent, AR system requires growth in brainheart infusion broth before the pH-shock treatment(Castanie-Cornet et al. 1999). Furthermore, the last 2 ARsystems require the addition of glutamate or arginine, re-spectively, during acid challenge to survive the low pH(Castanie-Cornet et al. 1999; Hersh et al. 1996; Lin et al.1995).
Phage infection negatively affected 2 E. coli AR systemsat pH ≤ 3 (Fig. 1). The RpoS-dependent AR system exposeda minimum 75-fold difference in acid survival between in-fected and uninfected cells, and the glutamate-dependent ARsystem exposed an average 25-fold difference in acid sur-vival. In comparison, deletion of gadE, a gene imperative inacid survival, has been shown to result in a 25-fold decreasein survival relative to that of wild type cells (Tucker et al.2002). Thus, acid shock survival was considerably reducedby phage infection. The level of survival for glutamate-dependent AR, reported in Fig. 1, is comparable to that ofprevious reports (Castanie-Cornet et al. 1999; Lin et al.1995). None of the acid-sensitive control samples survivedthe AR assays (data not shown), demonstrating that the lev-els of response to acid challenge were dependent on the re-spective AR system. Furthermore, the difference in survivalbetween infected and uninfected cells is pH-dependent, inthat challenge at pH ≥ 3.5 did not produce any difference inAR between infected and uninfected cells (data not shown).The arginine-dependent AR, for which we did not detect anytranscriptional changes, was included as a control, showingno difference in the response to acid challenge for infectedand uninfected cells.
The increased acid sensitivity of phage-infected cells pre-sented here is likely to depend on the downregulation of ARgenes. The AR assays used in this study only affect a groupof proteins involved in these specific pathways of E. coliAR. The protein products of all the genes we founddownregulated by phage infection belong to this group.However, a recent study, in which E. coli cell division was
© 2005 NRC Canada
Karlsson et al. 33
Fig. 1. Three independent experiments showing the cell survival of uninfected (black) and phage-infected (grey) E. coli Top10F′ cells,following 2 h of challenge at acidic pH. The test for the oxidative, RpoS-dependent, acid resistance (AR) system involved overnightgrowth in Luria–Bertani (LB)–morpholineethanesulfonic acid (pH 5.5), followed by dilution to 5 × 10⁵ to 1 × 10⁶ CFU·mL–1 in E me-dium with glucose (EG) (pH 3.0). The glutamate and arginine systems required overnight growth in LB–glucose (glutamate system) orbrain heart infusion broth (arginine system) cultures, which were diluted to 5 × 10⁵ to 1 × 10⁶ CFU·mL–1 in EG (pH 2.5) containing1.5 mmol·L–1 glutamate or EG (pH 3.0) containing 0.6 mmol·L–1 arginine, respectively. Percent survival is calculated as the number ofCFU⋅mL–1 remaining after the acid treatment, divided by the initial CFU⋅mL–1 at time zero. Error bars represent SD of the mean.

inhibited, also reported the downregulation of the same AR-related genes (Arends and Weiss 2004). The authors madethe interpretation that these genes are exquisitely sensitive tochanges in cell physiology. Consequently, the link betweenphage infection and acid sensitivity may be indirect, illus-trating that further investigations are needed.
In summary, this genome-wide analysis of the dynamicinteraction of 2 genomes at the early phase of phage infec-tion demonstrates that host genes associated with transcrip-tion processing and phosphotransferase reactions areupregulated and that those associated with AR aredownregulated. Furthermore, the host response to phage in-fection was limited, lacking immediate upregulation ofknown stress genes.
Acknowledgement
This work was supported by grant # 285-1999-630 fromthe Swedish National Council for Engineering Sciences(TFR). We thank Ann-Charlott Olsson and HeleneThuresson for excellent technical assistance.
References
Alexander, D.M., and St. John, A.C. 1994. Characterization of thecarbon starvation-inducible and stationary phase-inducible geneslp encoding an outer membrane lipoprotein in Escherichia coli.Mol. Microbiol. 11: 1059–1071.
Arends, S.J., and Weiss, D.S. 2004. Inhibiting cell division inEscherichia coli has little if any effect on gene expression. J.Bacteriol. 186: 880–884.
Bernstein, J.A., Khodursky, A.B., Lin, P.H., Lin-Chao, S., and Co-hen, S.N. 2002. Global analysis of mRNA decay and abundancein Escherichia coli at single-gene resolution using two-color flu-orescent DNA microarrays. Proc. Natl. Acad. Sci. USA, 99:9697–9702.
Blumer, K.J., and Steege, D.A. 1984. mRNA processing in Esche-richia coli: an activity encoded by the host processesbacteriophage f1 mRNAs. Nucleic Acids Res. 12: 1847–1861.
Brissette, J.L., Russel, M., Weiner, L., and Model, P. 1990. Phageshock protein, a stress protein of Escherichia coli. Proc. Natl.Acad. Sci. USA, 87: 862–866.
Cashman, J.S., Webster, R.E., and Steege, D.A. 1980. Transcrip-tion of bacteriophage fl. The major in vivo RNAs. J. Biol.Chem. 255: 2554–2562.
Castanie-Cornet, M.P., Penfound, T.A., Smith, D., Elliott, J.F., andFoster, J.W. 1999. Control of acid resistance in Escherichia coli.J. Bacteriol. 181: 3525–3535.
Click, E.M., and Webster, R.E. 1997. Filamentous phage infection:required interactions with the TolA protein. J. Bacteriol. 179:6464–6471.
Click, E.M., and Webster, R.E. 1998. The TolQRA proteins are re-quired for membrane insertion of the major capsid protein of thefilamentous phage f1 during infection. J. Bacteriol. 180: 1723–1728.
De Biase, D., Tramonti, A., John, R.A., and Bossa, F. 1996. Isola-tion, overexpression, and biochemical characterization of thetwo isoforms of glutamic acid decarboxylase from Escherichiacoli. Protein Expr. Purif. 8: 430–438.
Gajiwala, K.S., and Burley, S.K. 2000. HDEA, a periplasmic pro-tein that supports acid resistance in pathogenic enteric bacteria.J. Mol. Biol. 295: 605–612.
Goodrich, A.F., and Steege, D.A. 1999. Roles of polyadenylationand nucleolytic cleavage in the filamentous phage mRNA pro-cessing and decay pathways in Escherichia coli. RNA. 5: 972–985.
Gutknecht, R., Beutler, R., Garcia-Alles, L.F., Baumann, U., andErni, B. 2001. The dihydroxyacetone kinase of Escherichia coliutilizes a phosphoprotein instead of ATP as phosphoryl donor.EMBO J. 20: 2480–2486.
Hartl, F.U., and Martin, J. 1995. Molecular chaperones in cellularprotein folding. Curr. Opin. Struct. Biol. 5: 92–102.
Hersh, B.M., Farooq, F.T., Barstad, D.N., Blankenhorn, D.L., andSlonczewski, J.L. 1996. A glutamate-dependent acid resistancegene in Escherichia coli. J. Bacteriol. 178: 3978–3981.
Hofschneider, P.H., and Preuss, A. 1963. M 13 bacteriophage liber-ation from intact bacteria as revealed by electron microscopy. J.Mol. Biol. 20: 450–451.
Hommais, F., Krin, E., Coppee, J.Y., Lacroix, C., Yeramian, E.,Danchin, A., et al. 2004. GadE (YhiE): a novel activator in-volved in the response to acid environment in Escherichia coli.Microbiology, 150: 61–72.
Kokoska, R.J., and Steege, D.A. 1998. Appropriate expression offilamentous phage f1 DNA replication genes II and X requiresRNase E-dependent processing and separate mRNAs. J.Bacteriol. 180: 3245–3249.
Kokoska, R.J., Blumer, K.J., and Steege, D.A. 1990. Phage flmRNA processing in Escherichia coli: search for the upstreamproducts of endonuclease cleavage, requirement for the productof the altered mRNA stability (ams) locus. Biochimie, 72: 803–811.
Lee, K., Bernstein, J.A., and Cohen, S.N. 2002. RNase Gcomplementation of rne null mutation identifies functional inter-relationships with RNase E in Escherichia coli. Mol. Microbiol.43: 1445–1456.
Lee, K., Zhan, X., Gao, J., Qiu, J., Feng, Y., Meganathan, R. et al.2003. RraA: a protein inhibitor of RNase E activity that globallymodulates RNA abundance in E. coli. Cell, 114: 623–634.
Lin, J., Lee, I.S., Frey, J., Slonczewski, J.L., and Foster, J.W. 1995.Comparative analysis of extreme acid survival in Salmonellatyphimurium, Shigella flexneri, and Escherichia coli. J.Bacteriol. 177: 4097–4104.
Lin, J., Smith, M.P., Chapin, K.C., Baik, H.S., Bennett, G.N., andFoster, J.W. 1996. Mechanisms of acid resistance inenterohemorrhagic Escherichia coli. Appl. Environ. Microbiol.62: 3094–3100.
McLaggan, D., Jones, M.A., Gouesbet, G., Levina, N., Lindey, S.,Epstein, W. et al. 2002. Analysis of the kefA2 mutation suggeststhat KefA is a cation-specific channel involved in osmotic adap-tation in Escherichia coli. Mol. Microbiol. 43: 521–536.
Model, P., and Russel, M. 1988. Filamentous bacteriophage. In Thebacteriophages. Edited by R. Calendar. Plenum, New York, NY.pp. 375–456.
Model, P., Jovanovic, G., and Dworkin, J. 1997. The Escherichiacoli phage-shock-protein (psp) operon. Mol. Microbiol. 24:255–261.
Pichoff, S., Alibaud, L., Guedant, A., Castanie, M.P., and Bouche,J.P. 1998. An Escherichia coli gene (yaeO) suppresses tempera-ture-sensitive mutations in essential genes by modulating Rho-dependent transcription termination. Mol. Microbiol. 29: 859–869.
Plumbridge, J. 2001. DNA binding sites for the Mlc and NagC pro-teins: regulation of nagE, encoding the N-acetylglucosamine-specific transporter in Escherichia coli. Nucleic Acids Res. 29:506–514.
© 2005 NRC Canada
34 Can. J. Microbiol. Vol. 51, 2005

Plumbridge, J. 2002. Regulation of gene expression in the PTS inEscherichia coli: the role and interactions of Mlc. Curr. Opin.Microbiol. 5: 187–193.
Pratt, L.A., and Silhavy, T.J. 1998. Crl stimulates RpoS activityduring stationary phase. Mol. Microbiol. 29: 1225–1236.
Rakonjac, J., Feng, J., and Model, P. 1999. Filamentous phage arereleased from the bacterial membrane by a two-step mechanisminvolving a short C-terminal fragment of pIII. J. Mol. Biol. 289:1253–1265.
Rapoza, M.P., and Webster, R.E. 1995. The products of gene I andthe overlapping in-frame gene XI are required for filamentousphage assembly. J. Mol. Biol. 248: 627–638.
Rasched, I., and Oberer, E. 1986. Ff coliphages: structural andfunctional relationships. Microbiol. Rev. 50: 401–427.
Sambrook, J., Fritsch, E.F., and Maniatis, T. 1989. Molecular clon-ing: a laboratory manual. Cold Spring Harbor Laboratory Press,New York, NY.
Selinger, D.W., Cheung, K.J., Mei, R., Johansson, E.M., Rich-mond, C.S., Blattner, F.R., et al. 2000. RNA expression analysisusing a 30 base pair resolution Escherichia coli genome array.Nat. Biotechnol. 18: 1262–1268.
Steege, D.A. 2000. Emerging features of mRNA decay in bacteria.RNA. 6: 1079–1090.
Stump, M.D., and Steege, D.A. 1996. Functional analysis of fila-mentous phage f1 mRNA processing sites. RNA. 2: 1286–1294.
Tao, H., Bausch, C., Richmond, C., Blattner, F.R., and Conway, T.1999. Functional genomics: expression analysis of Escherichiacoli growing on minimal and rich media. J. Bacteriol. 181:6425–6440.
Tucker, D.L., Tucker, N., and Conway, T. 2002. Gene expressionprofiling of the pH response in Escherichia coli. J. Bacteriol.184: 6551–6558.
Webster, R.E. 1996. Biology of the filamentous bacteriophage. InPhage display of peptides and proteins: a laboratory manual.Edited by B.K. Kay, J. Winter, and J. McCafferty. AcademicPress Inc., San Diego, Calif. pp. 1–16.
Weiner, L., and Model, P. 1994. Role of an Escherichia coli stress-response operon in stationary-phase survival. Proc. Natl. Acad.Sci. USA, 91: 2191–2195.
© 2005 NRC Canada
Karlsson et al. 35