generation of electronic waste in india: current scenario
TRANSCRIPT
Vol. 7(9), pp. 899-910, September 2013
DOI: 10.5897/AJEST2013.1505
ISSN 1996-0786 © 2013 Academic Journals
http://www.academicjournals.org/AJEST
African Journal of Environmental Science and Technology
Full Length Research Paper
Generation of electronic waste in India: Current scenario, dilemmas and stakeholders
Anwesha Borthakur* and Kunal Sinha
Centre for Studies in Science, Technology and Innovation Policy, School of Social Sciences, Central University of Gujarat, Gandhinagar-382030, Gujarat, India.
Accepted 1 August, 2013
This paper tries to quantify the amount of E-waste generated in India with the related stakeholder involvement. Electronic waste (E-waste) or waste electrical and electronic equipments (WEEE), which is relatively a recent addition to the hazardous waste stream, is drawing rapid attention across the globe as the quantity being generated is rising rapidly. All electrical and electronic equipments (EEE), on completion of their useful life, contribute to the E-waste stream. However, the current estimation of the amount of E-waste generated in India is extremely hazy. In this paper, an attempt has been made to formulate an inventory of E-waste in the country in terms of both internal or domestic generation and illegal import. Different methods of estimation of E-waste have been evaluated. Furthermore, the paper tries to identify the whole range of diverse stakeholders involved in the generation of E-waste in the country. It has been observed that actual and reliable data on the generation of E-waste, both domestic and import of E-waste, is currently unavailable in India. Few studies have been conducted to identify the involvement of different stakeholders in E-waste generation in the country. Urgent needs arise to document the issues related to E-waste generation and management in the country in order to deal with this important and toxic waste stream. Key words: E-waste generation, inventory, domestic generation, illegal import, stakeholders.
INTRODUCTION At present, E-waste is mainly generated in countries of the Organization for Economic Cooperation and Development (OECD), which have highly saturated markets for electrical and electronic equipment (EEE) (Widmer et al., 2005). Although, the market penetration of EEE in industrializing countries is not very high, these countries show the fastest growing consumption rates for EEE, and thus large quantities of domestically generated E-waste would become part of the waste stream in the near future (ibid). Moreover, the global E-waste production keeps on changing due to the economic growth and the available technologies. Almost all the countries in the world, today, depend immensely on Information and Communication Technology (ICT) and
other EEEs for their growth and development. As a result, new EEEs are introduced frequently in the global market. It implies that the amount of E-waste being produced will definitely increase in the near future. With new innovative technologies, the nature and mass of E-waste produced may change. As correctly put up by Robinson (2009), changes in technology will affect the global mass of E-waste produced. For example, the mass of a laptop is much lesser than the mass of a desktop computer. Specific changes in the technology and the consumption habits will decrease the mass of global E-waste production, since consumers will turn to less weighed EEEs. For example, consumers will turn more to portable PC solutions having 1 to 3 kg average weight as
*Corresponding author. E-mail: [email protected].
900 Afr. J. Environ. Sci. Technol. compared to the stationary computer weighing 25 kg.
India is one of the fastest growing economies of the world. Although, the penetration of India’s market for consumer durables is substantially lower than that of developed countries, the size of India’s market in absolute terms is larger than that of many high-income countries (Sinha-Khetriwal, Kraeuchi and Schwaninger, 2005). Emerging economies such as China and India are large generators of WEEE and have the fastest growing markets for electrical and electronic equipment (Widmer et al., 2005). The useful life of consumer electronic products is relatively short, and decreasing as a result of rapid changes in equipment features and capabilities (Kang and Schoenung, 2004). The country of India, today, is burdened with the colossal problem of E-waste which is either internally generated or illegally imported, causing serious problems to human health and environment.
Since 1990, the first phase of economic liberalisation, the problems associated with E-waste in India have started manifesting (Wath, 2010). The Indian information technology (IT) industry has been one of the major drivers of change in the economy in the last decades and has contributed significantly to the “digital revolution” being experienced by the world. At the same time, it is responsible for the generation of the bulk of E-waste in the country (Pinto, 2008). The rapid uptake of information technology around the world coupled with the availability of new design and technology in the electronic sector is causing the early obsolescence of many electronic items used around the world today (Widmer et al., 2005). Till 2006, the world's production of E-waste was estimated at 20 to 50 million tonnes per year, representing 1 to 3% of the global municipal waste production of 1636 million tonnes per year (Robinson, 2009). In the year 2008, Ladou and Lovegrove estimated that one billion computers will stop working in the next five years. Short innovation cycles of hardware have led to a high turnover of devices. The lifespan of central processing units in computers dropped from 4 to 6 years in 1997 to 2 years in 2005 (Babu et al., 2007). Thus, with the decrease in the average lifespan of EEEs, planet Earth will certainly have to take the load of more and more volume of E-waste in the coming years.
Objectives of the research 1. To identify the proposed methods for quantification of E-waste in India. 2. To formulate an inventory of E-waste in India both in terms of internal generation and illegal import. 3. To identify the stakeholders involved in the generation of E-waste in the country. METHODOLOGY
Secondary sources of data like recent newspaper and journal
articles, authentic internet resources, etc were evaluated for the purpose of this study. Through such resources, attempt has been made to formulate an inventory of E-waste in Indian context, which in turn helped in identifying the wide range of diverse stakeholders in the E-waste generation. Secondary sources of data were preferred in order to accommodate the current scenario and research related to E-waste in India which are highly dispersed and diversified. RESULTS AND DISCUSSION Proposed methods of estimation of E-waste The credit for conducting a pioneering study on the accumulation of E-waste goes to Carnegie-Mellon University (1991) (Saphores et al., 2009). It examines the waste stream generation of three products (personal computers, refrigerators and telephones) to develop design strategies that would foster the reuse, remanufacturing, or recycling of these items. A follow up study by Matthews et al. (1997) focuses on personal computers; it revises the assumptions underlying the 1991 study to better reflect then market conditions (Widmer et al., 2005). The method of estimation developed again at Carnegie Mellon University by Matthews et al. (1997) based exclusively on sales data. Although it focuses only on computers, it includes the reuse and storage parameters for obsolete machines, which in reality delay their entry into the waste stream (Widmer et al., 2005). However, the model is only for the US and cannot be universally applied (ibid).
However, in the due course of time, several methods have been suggested and used to estimate possible global quantities of WEEE. Lohse et al. (1998) described three estimation methods as follows (ibid):
1. The “consumption and use method”, which takes the average equipment of a typical household with electrical and electronic appliances as the basis for a prediction of the potential amount of WEEE (used in the Netherlands to estimate the potential amount of WEEE); 2. The “market supply method”, which uses data on production and sales figures in a given geographical region (used by the German Electrical and Electronic Industries Association to estimate WEEE) and 3. The Swiss Environmental Agency’s estimates based on the assumption that private households are already saturated and for each new appliance bought, an old one reaches its end-of-life.
In the first two methods, assumptions need to be made on the average life-time of EEE products as well as their average weight (from which to derive WEEE generation in tonnes) and under the third method, however, the assumption of the average life-time of the appliances is irrelevant, as it assumes a completely saturated market (Widmer et al, 2005).
According to Robinson (2009), the contribution of an item to the annual E-waste production, E (kg/year) depends

on the mass of the item, M (kg), the number of units in service, N, and its average lifespan, L (years). E = MN/L However, all the factors mentioned here are difficult to calculate. These factors may differ across different stakeholders and countries. For example, the lifespan of the same computer in an IT industry or at a household will drastically differ. Similarly, the useful life of the same electrical or electronic appliance in a developed and developing country will vary greatly. Hence to establish a country’s E-waste profile with the help of such calculations is a difficult task. Moreover, calculating global E-waste production requires information on the number of items in service (ibid). Such kind of data is generally available in rich countries, but not in poor countries.
According to the United Nations Environment Programme’s (UNEP) Inventory Assessment Manual on E-waste (Volume I) (2007), the generation of E-waste or WEEE is defined by the consumption of EEE as both of them are directly proportional. In the model of “Phase wise Life Cycle of Electrical and Electronic Equipment”, mass/number of pieces of equipment bought and used by the consumers is considered. After a certain time span (average life time, t) the end-of-life goods are passed on for collection. It is assumed that in the consumption period no losses occur and no conversion of material takes place. The model does not consider the servicing of the equipment, the replacement of parts, etc. It has been assumed that the EEE purchased by a consumer will end up being WEEE or E-waste after a specific period of time.
Therefore, Input = Output, where Input (t) = Mass/number of pieces of equipment bought by the customer (t). Output (t) = WEEE/ E-waste generated (t)
Widmer et al. (2005) has truly pointed out that the results of WEEE estimation studies differ extensively and comparisons of the studies are difficult because both methods used and basic assumptions made differ from one study to another. Nevertheless, as argued by Ongondo et al. (2011), the reported global quantities of WEEE seem to be grossly underestimated. The Indian scenario on E-waste Due to the rapid developmental activities, countries like India, today, face a fast increasing load of WEEE originating from both inland and through illegal imports (Streicher-Porte et al., 2005). Moreover, as one of the fastest growing economies of the world, demand for consumer durables in the country has been on a rapid rising trend (Sinha, 2004). E-waste is one of the fastest growing waste streams in the world due to increasing “market penetration” in developing countries, “replacement market” in developed countries and “high
Borthakur and Sinha 901 obsolescence rate”. In India, it has been argued that due to low market penetration rate in the past, the stock of EEE already put on the market has not been as large as that in OECD countries and the market of most products is far from saturated (Ongondoet al., 2011). According to Sepúlveda et al. (2010), in India, domestic E-waste is significant in addition to illegal imports. Over the last few decades, India has become a major destination for E-waste exports from the developed nations. Moreover, Indians have been generating rapidly increasing amounts of E-waste domestically (Skinner, 2010). A review of E-waste generation in India Actual and reliable data on the generation, both domestic and import of E-waste, is not currently available in India. Several studies have been conducted by various agencies to devise an inventory of E-waste in the country. Most of these studies are based on the model of obsolescence of electronic products, which needs to be validated with the field data.
The preliminary estimates carried out by National WEEE task force in 2005 suggest that total E-waste or WEEE generation in India is approximately 146,000 tonnes per year (Wath et al., 2010). Again, a survey conducted by the Central Pollution Control Board (CPCB) during 2005, estimated that 1.347 lakh MT of E-waste was generated in the country in the year 2005, which is expected to increase to about 8.0 lakh MT by 2012 (ibid).
A more recent study by GTZ (Deutsche Gesellschaft für Technische Zusammenarbeit)-MAIT (2007) had put a much higher number of E-waste generated in India (ibid). It estimated the amount to be 3,30,000 tonnes
1 for the
year 2007. Complementing this, Cobbing (2008) put the estimation in India as 0.33 million tonnes of E-waste in 2007. Wath (2010) has put the figures as 420,000 tonnes in the year 2009. Skinner (2010) argued that of the estimated 382,979 tonnes of E-waste generated in India, 144,143 tonnes entered the waste stream in the year 2007. However, the complexity of E-waste flows within India and inadequate record-keeping by industry participants make an estimation of the quantities of E-waste within India difficult (Streiche-Porte et al., 2007). In India, E-waste is becoming a crucial waste stream in terms of both quantity and toxicity (Dwivedy and Mittal, 2010). However, a persistent outlook of E-waste as a commodity causes an unwillingness to dispose of E-waste immediately (Sinha, 2008). Brigden et al. (2005) have pointed out that as the expansion of the global market for electrical and electronic products continues to 1
The study carried out by GTZ-MAIT in 2007 further estimates the total
quantities of generated, recyclable and recycled E-waste to be 3,32,979,
000, 1,44,43 000 and 19,000,000 kg, respectively. Further, the study
conducted by GTZ-MAIT (2007) states that about 14 million mobile
handsets had been replaced in 2007.
902 Afr. J. Environ. Sci. Technol. accelerate, the lifespan of the products is dropping, resulting in the corresponding explosion of electronic scraps.
UNEP (2010) listed the equipment-wise E-waste generation in the country as over 100,000 tonnes from refrigerators, 275,000 tonnes from TVs, 56,300 tonnes from personal computers, 4700 tonnes from printers and 1700 tonnes from mobile phones. A study limited to an examination of computers, mobile phones and televisions reckoned that 3,82,979 tonnes of E-waste were generated in 2007, 50,000 (approximately 13%) of which were imported illegally (Skinner, 2010). However, a major loophole in the data of most of the studies related to E-waste generation is that it only includes equipment generated nationally. The import of the waste (both legal and illegal) which are substantial in emerging economies like India and China, were not considered. Sinha (2004) mentioned that from 1998 to 2002, there was a 53.1% growth in the sales of domestic household appliances, both large and small. Chatterjee and Kumar (2009) estimated that the E-waste processed in 2007 consisted of 12000 000 kg of computers and 7000 000 kg of televisions. As stated by Agarwal et al. (2005), the report by Toxics Link, a New Delhi based NGO, estimated that in India business and individual households make approximately 1.38 million personal computers obsolete every year. Schluep et al. (2009) stated that the amount of EEE (computers, printers, washing machines, mobile phones and TVs) put on the market in 2007 was estimated to be 823.6 K tonnes. In the same year of 2007, the estimated domestic WEEE arising for computers, printers, washing machines, mobile phones, and TVs was 439 K tonnes.
Despite the problem of domestic WEEE in India being relatively small until recently, it is postulated that the continual EEE market penetration and increasing consumer demand for EEE will soon change this situation (Manomaivibool, 2009). Assuming an Indian population of 1.12 billion in 2007, Manomaivibool (2009) calculates the E-waste generation in India as 0.4 kg per capita. Nevertheless, although the per-capita waste production in populous countries such as India is still relatively small and estimated to be less than 1 kg E-waste per capita per year as shown above, the total absolute volume of WEEE generated in the countries is massive (Widmer et al., 2005). The country tends to have the fastest growing markets for EEE, ones that are far from saturation (Streicher-Porte et al., 2005). For example, India had only 82 television sets for every 1000 persons in 2001, as compared to 554 per 1000 persons in Switzerland. Contrarily, the active base of TV’s in India was 85 million as compared to only 4 million in Switzerland (Sinha, 2004).
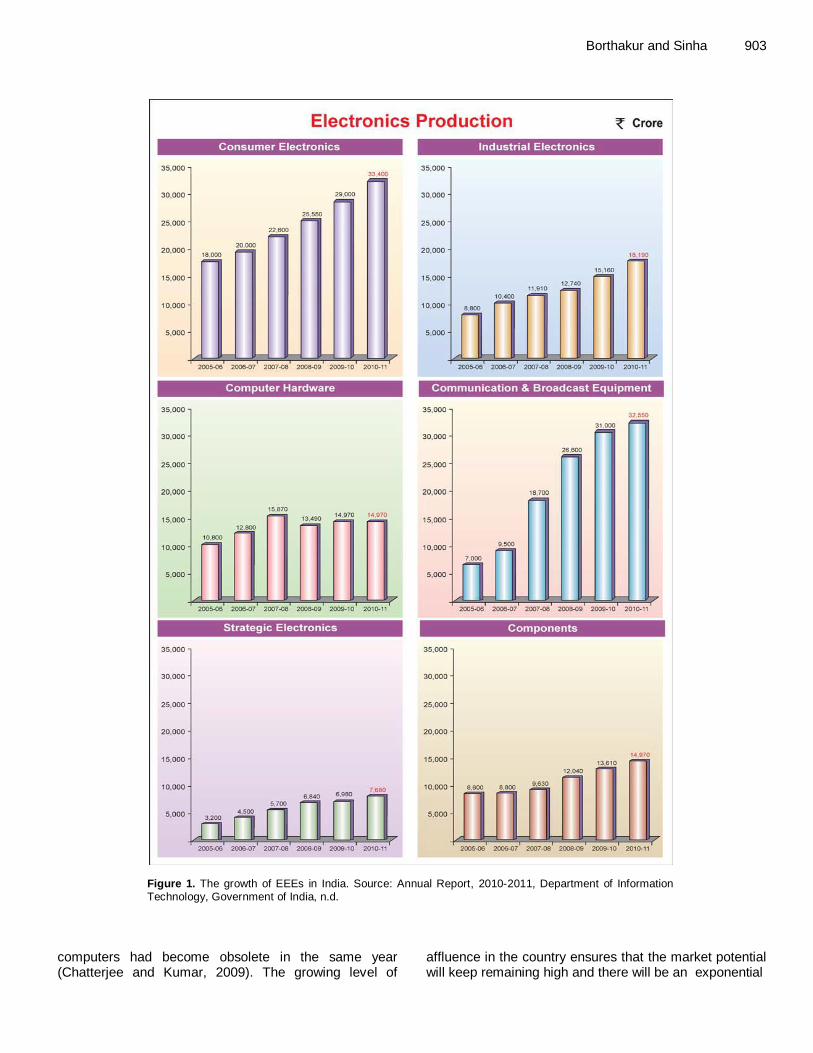
Figure 1 shows the growth of some EEEs in India during the last six years. Consumer electronics, industrial electronics and communication and broadcast equipments show considerable growth during the last six
years from 2005-2006 to 2010-2011. In the Indian scenario, the convergence of information, communication and entertainment is bringing new momentum in the consumer electronics industry. Changing life styles, higher disposable income and greater affordability is fuelling this growth. Consumer preference has shifted towards products and devices that come with smart technology, innovative designs and aesthetic looks. The growth of industrial electronics, which involves critical hardware technologies and systems with built-in software, could be attributed to the significant growth of electronics and IT industries in the country. It is a very challenging area which is multi-disciplinary in nature requiring high level of technical skill in designing systems for applications in a variety of industrial sectors of the economic growth and development. India has been emerging as an expert in this sector with a number of globally recognised IT industries rooted in the country. Likewise, information and broadcasting technology, as a key driver in the growth and development of the country, has observed a significant growth over the past few years. Personal computer (PC) obsolescence in India The Indian electronics industry has emerged as a fast growing sector in terms of production, internal consumption and export (Dwivedy and Mittal, 2010). Solid waste management, which is already a massive task in India, is becoming more complicated by the invasion of E-waste particularly in the form of computer waste as it contains a number of hazardous substances. India’s rate of PC obsolescence is growing dangerously. Of the nearly 8 million installed PCs in India, 2 million are either of the generation represented by the chip Intel 486 or lower. As upgradation beyond a point becomes uneconomical and incompatible with new software, a vast amount of hardware will soon be added to the waste stream (Toxics Link, 2004).
In India, the per capita PC ownership between 1993 and 2000 has grown by 604% as against the world average of 181% during the same period (Sinha-Khetriwal et al., 2005). The total PC base during this period has grown from an estimated 450,000 to 4,200,000 PCs (Sinha, 2004). However, Dwivedy and Mittal (2010) stated that contrary to the world average of 27 computers per 1000 people and over 500 computers per 1000 people in the US, India in the year 2004 had one of the lowest PC penetration rate at just 9 computers per 1000 people. Nonetheless, the size of India’s market in absolute terms is larger than most of the high income countries (Sinha-Khetriwal et al., 2005) and hence although considered among the countries with lowest PC penetration rate, the generation of E-waste in the form of computer-waste could be significant. For example, India had about 20 million computers in 2007 and 2.2 million
Borthakur and Sinha 903
Figure 1. The growth of EEEs in India. Source: Annual Report, 2010-2011, Department of Information Technology, Government of India, n.d.
computers had become obsolete in the same year (Chatterjee and Kumar, 2009). The growing level of
affluence in the country ensures that the market potential will keep remaining high and there will be an exponential
904 Afr. J. Environ. Sci. Technol. growth in the sales of electronics and electrical products (Sinha, 2004). The result of a forecasting activity conducted by Yu et al. (2010) on the global generation of obsolete PCs shows that PCs generated in developing regions will exceed that of developed regions by 2016-2018 and by the year 2030, the obsolete PCs from developing regions will reach 400-700 million units, far more than from developed regions at 200-300 million units. It is an interesting finding considering that the developing nations always fault the developed nations for rapid generation of obsolete electronics.
Dwivedy and Mittal (2010) tries to evaluate the future trends in computer waste generation in India utilizing their first lifespan distribution and historical sales data. The results of the study indicate that in the year 2020, about 41 to 152 million units of computers will become obsolete. E-waste generation in some of the major Indian cities A study was conducted in Hyderabad and Bangalore to access the generation of E-waste in the two cities by Environment Protection Training and Research Institute (EPTRI) and sponsored by World Health Organization, (WHO), India Country Office, New Delhi. The study has been carried out through field work in two cities: Hyderabad and Bangalore. The total E-waste generated in Hyderabad, due to computers, printers, television and mobile phones usage by 246 surveyed samples is 36,027.90 kg and in Bangalore by 148 surveyed samples is 48,254.55 kg. The annual E-waste generation has been estimated for Hyderabad and Bangalore as 3,263.994 and 6,743.87 MT, respectively from com-puters, printers, television and mobile phones. The projected E-waste generation restricting to above items from house hold sector alone was 95,120 MT in 2009 and expected to reach 1,07,886 MT in 2013 in Hyderabad and 1,21,410 MT in 2009 and expected to reach 1,30,383 MT in 2013 in Bangalore. However, no follow up studies have been found in the recent years if the projected generation of E-waste in the two cities in the year 2009 has been complimented. Total WEEE waste generation in Maharashtra is 20270.6 tonnes, out of this Navi Mumbai contributes 646.48 tonnes, Greater Mumbai 11017.06 tonnes, Pune 2584.21 tonnes and Pimpri-Chinchwad 1032.37 tonnes. The GTZ (Deutsche Gesellschaft für Technische Zusammenarbeit) estimated the total amount of E-waste in India is about 3, 30,000 tonnes in 2007 (GTZ-MAIT, 2007).
MoEF (2008) stated that ten states generate 70% of the total E-waste generated in India. Maharashtra ranks first in the list of E-waste generating states in India followed by Tamil Nadu, Andhra Pradesh, Uttar Pradesh, West Bengal, Delhi, Karnataka, Gujarat, Madhya Pradesh and Punjab. Moreover, it has been reported in the document that sixty-five cities in India generate more
than 60% of the total E-waste generated in India. Further, it listed ten major E-waste generator cities in the country. Among them, Mumbai ranks first followed by Delhi, Bangalore, Chennai, Kolkata, Ahmedabad, Hyderabad, Pune, Surat and Nagpur. Complementing this, a study conducted by MPCB (2007) states that Mumbai and Pune fall under the top ten cities that are generating maximum quantities and Mumbai alone generates maximum among all the cities of India. Import of E-waste into India The country has been one of the main destinations of used EEE and WEEE from OECD countries with an estimated 50 K tonnes of WEEE imported every year (Manomaivibool, 2009). Same figure was depicted by GTZ-MAIT (2007) which estimates that about 50,000 tonnes of WEEE were imported to India every single year. India is becoming a big market for imported E-waste. PCs imported to Delhi in 2003 were nearly 3,600, 000 kg per year and studies predict that the nearly 50,000 to 70,000 tonnes of E-waste is being imported annually to India (Chaterjee and Kumar, 2009). A study limited to an examination of computers, mobile phones and televisions reckoned that 382,979 tonnes (t) of E-waste were generated in 2007, 50,000 t (approximately 13%) of which were imported illegally (Skinner, 2010). Of the E-waste imported into India, it is estimated that approximately 80% is imported from the US, while the remaining 20% is predominantly imported from the EU (Skinner, 2010). Nonetheless, as the import of E-waste is illegal and E-waste is often shipped via third countries, it is unrealistic to expect these statistics to be exact. Anecdotal evidence on E-waste exported by USA to Asia reveals that substantial percentages of their E-waste moves quickly off-shore. What cannot be recycled readily or economically is sent to markets in Asia.
In a report by Toxics Link (2004), at the recycling units in New Delhi (India) itself, 70% of the total electronic waste collected was actually exported or dumped by developed countries (Toxic Link, 2004). Most developed countries, find it financially profitable to send E-waste for reuse or recycling in developing countries (ibid). It is because the cost of recycling of a single computer in the United States is $ 20 while the same could be recycled in India for only US $ 2, a gross saving of US $ 18 if the computer is exported to India (Chaterjee and Kumar, 2009). Involvement of stakeholders in E-waste generations There are a number of stakeholders involved in the process of generation of E-waste. Often in the case of the personal computers, TVs, etc. the consumers discard their old items for the sake of latest version, features and
Borthakur and Sinha 905
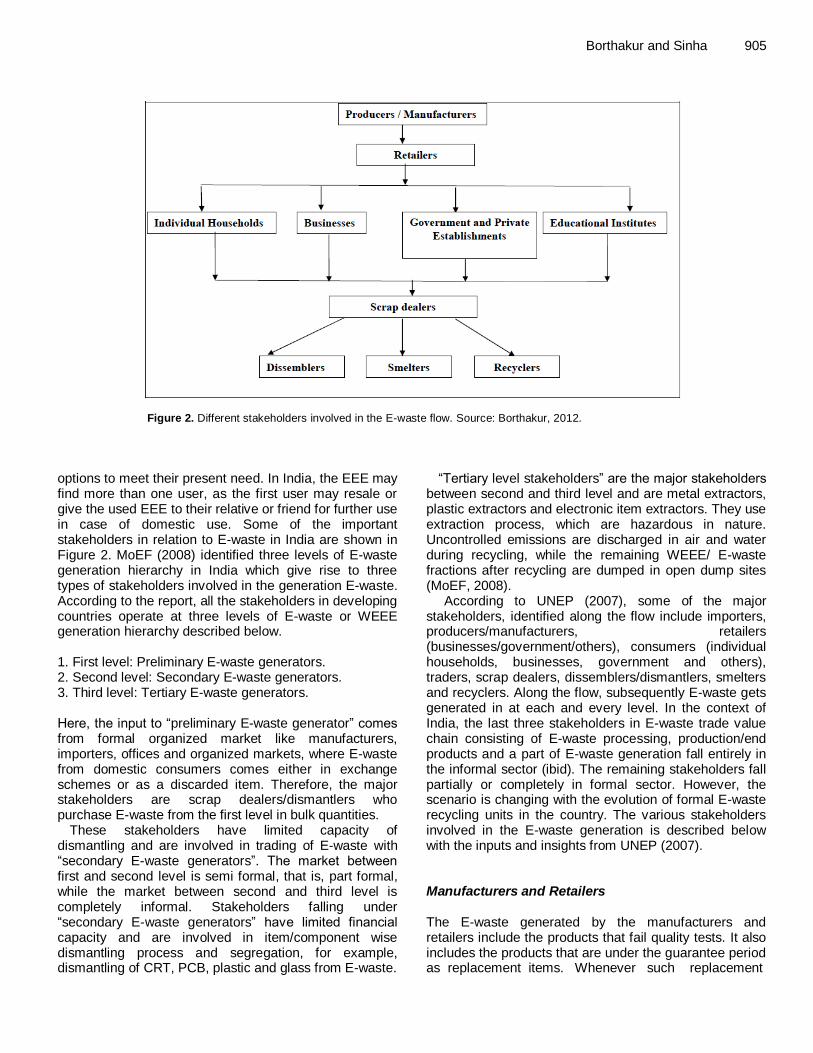
Figure 2. Different stakeholders involved in the E-waste flow. Source: Borthakur, 2012.
options to meet their present need. In India, the EEE may find more than one user, as the first user may resale or give the used EEE to their relative or friend for further use in case of domestic use. Some of the important stakeholders in relation to E-waste in India are shown in Figure 2. MoEF (2008) identified three levels of E-waste generation hierarchy in India which give rise to three types of stakeholders involved in the generation E-waste. According to the report, all the stakeholders in developing countries operate at three levels of E-waste or WEEE generation hierarchy described below. 1. First level: Preliminary E-waste generators. 2. Second level: Secondary E-waste generators. 3. Third level: Tertiary E-waste generators. Here, the input to “preliminary E-waste generator” comes from formal organized market like manufacturers, importers, offices and organized markets, where E-waste from domestic consumers comes either in exchange schemes or as a discarded item. Therefore, the major stakeholders are scrap dealers/dismantlers who purchase E-waste from the first level in bulk quantities.
These stakeholders have limited capacity of dismantling and are involved in trading of E-waste with “secondary E-waste generators”. The market between first and second level is semi formal, that is, part formal, while the market between second and third level is completely informal. Stakeholders falling under “secondary E-waste generators” have limited financial capacity and are involved in item/component wise dismantling process and segregation, for example, dismantling of CRT, PCB, plastic and glass from E-waste.
“Tertiary level stakeholders” are the major stakeholders between second and third level and are metal extractors, plastic extractors and electronic item extractors. They use extraction process, which are hazardous in nature. Uncontrolled emissions are discharged in air and water during recycling, while the remaining WEEE/ E-waste fractions after recycling are dumped in open dump sites (MoEF, 2008).
According to UNEP (2007), some of the major stakeholders, identified along the flow include importers, producers/manufacturers, retailers (businesses/government/others), consumers (individual households, businesses, government and others), traders, scrap dealers, dissemblers/dismantlers, smelters and recyclers. Along the flow, subsequently E-waste gets generated in at each and every level. In the context of India, the last three stakeholders in E-waste trade value chain consisting of E-waste processing, production/end products and a part of E-waste generation fall entirely in the informal sector (ibid). The remaining stakeholders fall partially or completely in formal sector. However, the scenario is changing with the evolution of formal E-waste recycling units in the country. The various stakeholders involved in the E-waste generation is described below with the inputs and insights from UNEP (2007). Manufacturers and Retailers The E-waste generated by the manufacturers and retailers include the products that fail quality tests. It also includes the products that are under the guarantee period as replacement items. Whenever such replacement
906 Afr. J. Environ. Sci. Technol. happens, the replaced product end up as E-waste. The peripheral electronic and electrical items produced during the manufacturing of EEE add up as the E-waste stream produced by manufacturer or retailer. For example, in the case of computers, E-waste generated from this sector comprises defective IC chips, motherboards, CRTs, other peripheral items produced during the production process (UNEP, 2007).
Imports
Import of E-waste by some of the developing countries like China and India is a major concern. Over the last few decades, India has become a major destination for E-waste exports from the developed nations. Huge quantities of E-waste like monitors, printers, keyboards, CPUs, typewriters, projectors, mobile phones, PVC wires, etc are imported to India from OECD countries in the names of charitable or reusable items (ibid).
IT Industries
It is a universally acceptable fact that IT companies are one of the largest generators of E-waste. Industries that provide IT services exclusively depend on the working of ICT and hence a large number of ICT equipments are in function in these industries. The field study conducted in Pune shows that almost 98-100% employees of these companies (especially in bigger companies like Tata Technologies Limited, Hewlett Packard and Tech Mahindra) are provided with personal computers. At the same time, hardwares are very frequently replaced in this sector because of the introduction of newer and modified versioned software every few months as the company always prefers the latest software version. Most of the times, old hardwares are not compatible with new softwares. The average life of computers in the IT giants was found to be four to five years. Hence, it could be concluded that the generation of E-waste in this sector is enormous.
India is fast emerging as an IT hub of the world. Looking at the potential of India to be grown as an IT hub, large number of global IT giants has established their branches in the country. Many of such giants are still coming to the country. Cities like Bangalore, Pune and Hyderabad are the promising IT hubs within the country. Bangalore has even acquired the name as the “Silicon Valley” of India. With the advent of IT industries, the pile of E-waste is growing at an alarming rate. However, till date, the management of E-waste in the country is rudimentary. No proper management measures are considered to address the ever increasing volume of E-waste, India has the potential to soon become the “E-waste hub” of the world.
Public and private sector, government departments, corporate and business establishments The business sector (government departments, public or private sector, MNC offices, etc) was the earliest users of IT and IT products and today they account for a sizable amount of total installed ICT equipment (UNEP, 2007). The field study conducted in the banking sector in Pune shows that with the computerized banking system all across the country, today, the banks need to compulsorily set up a large numbers of computers in their branches. Similar to the IT sector, the incompatibility of old systems to cater for the present needs and requirements, prompts them to pass the obsolete electrical and electronic equipment to dismantlers/recyclers, who pick up these items based on auction or other standard business practices. Educational Institutes Right from the kindergarten stage to the university level, the use of ICT equipments is omnipresent in the schools across the country. The study conducted in the sixteen higher educational institutes in Pune shows significant use of computers. The use of computers in this sector is uprising at a rapid pace. Individual households Individual households contribute the least to the E-waste generation, being only 20% of the overall market (Toxics Link, 2004). However, it is on an increasing trend today. The field study in Pune shows that in the middle to high income group societies, the amount of E-waste generated is rising rapidly. People are attracted to the EEEs with new and modified feature. With the attractive and smart discount and exchange offers in the major Indian cities (which are advertised in the local news papers, local TV channels and other media), people are purchasing more EEEs. Moreover, a persistent view of E-waste as a commodity causes reluctance among people to dispose of E-waste immediately (Sinha, 2008). Traders/scrap dealers/dissemblers/dismantlers These are very important agents in relation to E-waste. Most of the stakeholders here operate as a part of the informal sector. Hence, the amount of E-waste processed by them is extremely tricky to measure. These stakeholders are responsible for treatment of E-waste received from other stakeholders like importers, producers or manufacturers, retailers, consumers like individual households, businesses, government, etc. Scrap dealer or “kawariwalas” in India are responsible for
collecting the E-waste. Immediately after securing E-waste from various sources, scrap dealers decide which item ought to be dismantled and which to be retained for resale. This decision is based on the resale of second hand products. The not-to-be-resold WEEE/ E-waste item/components find their way to the store houses for dismantling.
Rather than generating E-waste, these stakeholders are responsible for recycling and treating the existing E-waste generated by other stakeholders. E-waste gene-rated by these stakeholders includes all the peripheral electronic and electrical components produced during dissembling and dismantling activities. Recyclers/smelters Recycling activity is a major concern for the developing countries including India as most of such activities are carried in the informal sector with a lot of potential for environmental and occupational health hazards. Usually, these stakeholders are not concentrated in a single place, but spread over different areas, each handling a different aspect of recycling. The general practices observed in case of recycling in developing countries are open roasting, smelting and acid bath in informal sector to recover different metals.
These stakeholders play important role in managing the E-waste and have negligible role in the generation of E-waste. Whatever E-waste generated include peripheral electronic and electrical components produced during the recycling operations.
Conclusions During the course of the study, it has been observed that E-waste or WEEE estimation studies differ extensively and comparisons of such studies are difficult because both methods used and basic assumptions made differ from one study to another. Moreover, there is lack of authentic data on global scenario of E-waste production. The situation is the particularly worrisome in Indian context. UNEP (2006) estimated the world's production of E-waste to be at 20 to 50 million tonnes per year. However, few studies have been done in the recent years on the global production of E-waste. Representative countries of all the five continents inhabited by humans are considered for the purpose of the study. It has been observed that in the non-OECD or developing countries production of EEE and thus E-waste is enormous. This is a major cause of concern as the E-waste management practices in these countries are still at an developing stage.
Regarding the E-waste generation in India, it has been observed that although the penetration of India’s market for consumer durables is substantially lower than that of developed countries, the size of India’s market in
Borthakur and Sinha 907 absolute terms is larger than that of many high-income countries (Sinha-Khetriwal et al., 2005). For example, India had only 82 television sets for every 1000 persons in 2001, as compared to 554 per 1000 persons in Switzerland. Contrarily, the active base of TV’s in India was 85 million as compared to only 4 million in Switzerland (Sinha, 2004). Emerging economies such as China and India are large generators of WEEE and have the fastest growing markets for electrical and electronic equipment (Streicher-Porte et al., 2005; Widmer et al., 2005). The domestic demand for consumer durables in India has been skyrocketing (Sinha-Khetriwal et al., 2005). It is evident from the study that the quantity of E-waste generated in India is on rapid rise, both in terms of domestic or internal generation and illegal import. Nevertheless, as argued by Ongondo et al. (2011), not only Indian but also the global quantities of E-waste or WEEE seem to be grossly underestimated.
Major stakeholders involved in the E-waste production in India have been considered as a part of the study. The stakeholders involved in the generation of E-waste in the country were found to be Manufacturers and Retailers, Imports, IT Industries Educational Institutes, Public and Private Sector, Government Departments, Corporate and Business Establishments, Individual Households, Traders/Scrap dealers/Dissemblers/ Dismantlers, Recyclers/ melters. Among these Manufacturers and Retailers, Imports, IT Industries Educational Institutes, Public and Private Sector, Government Departments, Corporate and Business Establishments and Individual Households are the major contributors to the E-waste stream in the country. The remaining stakeholders are more significant in the management of E-waste.
There is an urgent need to decide a strategy for E-waste problem in developing country like India. UNEP (2010) report predicts that by 2020, E-waste from old computers in India will increase to 500%; from discarded mobile phones will be about 18 times high; from televisions will be 1.5 to 2 times higher; from discarded refrigerators will double or triple; than its respective 2007 levels. Considering the growth rate, studies show that the volume of E-waste will reach nearly 0.7 million MT by 2015 and 2 million MT by 2025.
The lack of authentic and comprehensive data on E-waste in India is further exaggerating the problems associated with E-waste management in the country. Although, various State Pollution Control Boards have initiated the exercise to collect data on E-waste generation (MoEF, 2008), such exercises are not practiced with utmost sincerity.
REFERENCES
Agamuthu P, Khidzir KM, Hamil FS, 2009. Drivers of sustainable waste management in Asia. Waste Manage. Res. 27:625-633.
Agarwal Singhmar A, Kulshrestha M , Mittal AK (2005). Municipal
solid waste recycling and associated markets in Delhi, India. Resources Conservation and Recycling. 44(1):73-90.
Aizawa H, Yoshida H, Sakai S (2008). Current results and future
908 Afr. J. Environ. Sci. Technol.
perspectives for Japanese recycling of home electrical appliances. Resource, Conserv. Recycling 52(12):1399-1410.
Anomanyo ED (2004). Integration of Municipal Solid Waste
Management in Accra (Ghana): Bioreactor Treatment Technology as an Integral Part of the Management Process. (Master’s Thesis, Lund University, 2004).
Babu BR, Parande AK, Basha CA (2007). Electrical and electronic waste:a global environmental problem. Waste Manage. Res. 25:307-318.
Baud I Grafakos S, Hordijk M, Post J (2001). Quality of life and alliances in solid waste management: Contributions to Urban Sustainable Development. 18(1):3-12.
Betts K (2008). Producing usable materials from e-waste. Environ. Sci. Technol. 42:6782-6783.
Binder CR, Mosler HJ, (2007). Waste-resource flows of short-lived
goods in households of Santiago de Cuba. Resour. Conserv. Recycling 51:265-283.
Borthakur A (2012). Generation, Management and Policy Implications of
Electronic Waste in India. M.Phil Dissertation. Central University of Gujarat. Gandhinagar.
Brigden K, Labunska I, Santillo D, Allsopp M (2005). Recycling of
electronic wastes in China and India: workplace and environmental contamination. Report, Greenpeace International.
Census (2011). Chapter 3: State Overview. Government of India.
Chhachhi, A., 1999. Gender, Flexibility, Skill and Industrial Restructuring: The Electronics Industry in India. Working Paper 296.
Available at http://repub.eur.nl/res/pub/19041/wp296.pdf .
Last accessed on 1st December, 2012.
Chatterjee S (2012). Sustainable Electronic Waste Management and Recycling Process. American Journal of Environmental Engineering.
2(1):23-33. Chatterjee S, Kumar K (2009). Effective electronic waste management
and recycling process involving formal and non-formal sectors.
International Journal of Physical Sciences. 4(13):893-905. Chia X, Streicher-Porteb M, Wanga MYL, Reuter MA (2011). Informal
electronic waste recycling: A sector review with special focus on
China. Waste Manage. 31:731-742. Chung SS, Zhang C, (2011). An evaluation of legislative measures on
electrical and electronic waste in the People’s Republic of China.
Waste Manage. 31:2638-2646. Coase RH (1960). The problem of social cost. J. Law Econ. 3:1-44. Cobbing M (2008). Toxic tech:not in our backyard, uncovering the
hidden flows of e-waste. Amsterdam:Greenpeace International. Dahlén L, Lagerkvist A (2010). Strengths and weaknesses of weight-
based billing in household waste collection systems in Sweden.
Waste Management. 30:23-31. Dalrymple I, Wright N, Kellner R, Bains N, Geraghty K, Goosey M,
Lightfoot L (2007). An integrated approach to electronic waste (WEEE) recycling. Circuit World. 33(2):52-58. Available
from:http://dx.doi.org/10.1108/03056120710750256 . Davis G, Herat S (2008). Electronic waste: the local government
perspective in Queensland, Australia. Resour. Conserv. Recycling.
52 (8-9):1031- 1039. Deathe ALB, MacDonald E, Amos W (2008). E-waste Management
Programmes and the Promotion of Design for the Environment:
Assessing Canada’s Contributions. RECIEL. 17 (3):321-336. Department of Information Technology, Ministry of Communications and
Information Technology, Government of India. Information
Technology Annual Report, 2010-2011. Desrochers P (2004). Industrial symbiosis: the case for market
coordination. J. Cleaner Production. 12(8-10):1099-1110.
Dimitrakakis, E. et al., 2009. Small WEEE: determining recyclables and hazardous substances in plastics. Journal of Hazardous Materials. 161 (2-3):913-919.
Donaldson T, Preston L (1995). The stakeholder theory of the corporation: Concepts, evidence, implications. Academy of Management Review. 20:65-91.
Dwivedy M, Mittal RK. (2012). An investigation into e-waste flows in India. J. Cleaner Product. doi:10.1016/j.jclepro.2012.07.017.
Dwivedy M, Mittal RK (2010). Future trends in computer waste
generation in India. Waste Manage. 30:2265-2277. Eguchi A, Nomiyama K, Devanathan G, Subramanian A, Bulbule KA,
Parthasarathy P, Takahashi S, Tanabe S (2012). Different profiles of anthropogenic and naturally produced organohalogen compounds in serum from residents living near a coastal area and e-waste
recycling workers in India. Environ. Intl. 47:8-16. EMPA (2004). E-waste Pilot Study Delhi. Knowledge Partnerships with
Developing and Transition Countries. EMPA, St.Gallen.
Fontaine C, Haarman A, Schmid, S (2006). “The Stakeholder Theory (of the Multi National Corporation).” Availableat:http://www.edalys.fr/documents/Stakeholders%20theory.’
pdf, Last accessed on 5th November, 2012.
Frazzolia C, Orisakweb OE, Dragonec R, Mantovani A (2010). Diagnostic health risk assessment of electronic waste on the general
population in developing countries' scenarios. Environ. Impact Assess. Rev. 30:388-399.
Freeman RE (1984). Strategic management: A stakeholder approach.
Englewood Cliffs, NJ: Prentice-Hall. Fu J, Zhou Q, Liu J, Liu W, Wang T, Zhang Q, Jiang G (2008). High
levels of heavy metals in rice (Oryza sativa L.) from a typical E-waste
recycling area in southeast China and its potential risk to human health. Chemosphere. 71:1269-1275.
Goosey M (2004). End-of-life electronics legislation - an industry
perspective. Circuit World. 30(2):41-45. Greenpeace (2005). The e-waste problem. Greenpeace International.
Availableon:http://www.greenpeace.org/international/campaigns/toxic
s/electronics/the-e-waste-problem# . Last accessed on 5th December,
2012. Greenpeace., 2008. Take Back Blues: An Assessment of E-waste Take
Back in India. Available at www.greenpeace.org/india/press/reports/take-back-blues.
Last accessed on 5th December, 2012.
GTZ-MAIT., 2007. A study on E-waste assessment in the country. The German Technical Cooperation Agency (GTZ) and Manufacturer’s Association for Information Technology Industry (MAIT) press release
on date December 13, 2007. Available at:http://www.mait.com/admin/press_images/press77-
try.htmN . Last accessed on 4th May, 2008.
Ha NN, Agusaa T,Ramua K, Tu NPC, Murataa S, Bulbuled KA, Parthasaratye P,Takahashia S, Subramaniana A,Tanabe S (2009). Contamination by trace elements at e-waste recycling sites in
Bangalore, India. Chemosphere. 76:9-15. Habil I, Bilitewski B (2008). Pay-as-you-throw - A tool for urban waste
management. Waste Manage. 28:2759.
Haque A, Mujtaba I, Bell J, (2000). A simple model for complex waste recycling scenarios in developing countries. Waste Manage. 20:625- 31.
Heart S (2008). Environmental impacts and use of brominated flame retardants in electrical and electronic equipment. Environmentalist. 28:348-357.
Hicks C, Dietmara R, Eugsterb M (2005). The recycling and disposal of
electrical and electronic waste in China-legislative and market responses. Environ. Impact Assess. Rev. 25:459- 471.
Toshiaki I (2007). An Empirical Analysis of Planned Obsolescence. J.
Econ. Manage. Strategy 16(1):191-226 Reichenbach J (2008). Status and prospects of pay-as-you-throw in
Europe - A review of pilot research and implementation studies.
Waste Manage. 28:2809-2814. Jin H (2012). Rubbish as a Consequence of the Ever More Refined
Industrialization. Theory, Culture & Society. 28:354-357.
Jones TM, Wicks AC (1999). Convergent Stakeholder Theory. The Academy of Manage. Rev. 24 (2):206-221.
Jones TM (1994). Essay on the Toronto conference. Business Soc.
33:98-101. Kang HY, Schoenung JM (2004). Used consumer electronics: a
comparative analysis of material recycling technologies, in: 2004
IEEE International Symposium on Electronics and the Environment. Phoenix, AZ, May 10-13, 2004.
Ladou J, Lovegrove S (2008). Export of electronics equipment waste.
Int. J. Occupat. Environ. Health. 14(1):1-10. Lee Jc, Song HT, Yoo JM (2007). Present status of the recycling of
waste electrical and electronic equipment in Korea. Resour. Conserv.
Recycling. 50(4):380-397. Lim SR, Schoenung JM (2010). Human health and ecological toxicity

potentials due to heavy metal content in waste electronic devices with flat panel displays. J. Hazard. Mat. 177:251-259.
Liu J, Xu X, Wu K, Piao Z, Huang J, Guo Y, Li W, Zhang Y, Chen A,
Huo X (2011). Association between lead exposure from electronic waste recycling and child temperament alterations. NeuroToxicology. 32:458-464.
Lombard R, Widmer R, (2005). E-Waste Assessment in South Africa, A Case Study of the Gauteng Province. EMPA - Swiss Federal Laboratories for Materials Testing and Research, Switzerland.
Available at: http://ewasteguide.info/ Widmer_2005_Empa Last accessed on 7
th July, 2008.
Maharashtra Pollution Control Board (MPCB). 2005. Report On
Environmental Status Of Pune Region: 2004 - 2005. Manda BMK (2008). E-waste Management Policy in India:
Stakeholder’s Perception and Media Attention (Master’s Thesis, Lund
University, 2008) Manomaivibool P (2009). Extended producer responsibility in a non-
OECD context: The management of waste electrical and electronic
equipment in India. Resources, Conservation and Recycling. 53:136-144.
MoEF (2008). Guidelines for Environmentally Sound Management of E-
waste (as approved vide Ministry of Environment and Forests (MoEF) letter No. 23-23/2007-HSMD; 2008. dated March 12, 2008.
MPCB (2007). Report on Assessment of Electronic Wastes in Mumbai-
Pune Area Maharashtra. Maharashtra Pollution Control Board.
Mundada MN, Kumar S, Shekdar AV (2004). E‐waste: a new challenge for waste management in India. Int. J. Environ. Studies 61(3):265-279.
Nnorom IC, Osibanjo O (2008). Overview of electronic waste (e-waste) management practices and legislations, and their poor applications in the developing countries. Resour. Conserv. Recycling. 52:843-858.
Nnorom IC, Osibanjo O (2010). Electronic waste (e-waste): Material flows and management practices in Nigeria. Waste Manage. 28:1472-1479.
Nnoroma IC, Ohakwe J, Osibanjo O., 2009. Survey of willingness of residents to participate in electronic waste recycling in Nigeria - A case study of mobile phone recycling. Journal of Cleaner Production.
17:1629-1637. Oguchi, M. et al., 2011. A preliminary categorization of end-of-life
electrical and electronic equipment as secondary metal resources.
Waste Management. 31:2150-2160. Oliveira, C.R., Bernardes, A.M., Gerbase, A.E., 2012. Collection and
recycling of electronic scrap: A worldwide overview and comparison
with the Brazilian situation. Waste Management. 32:1592-1610. Ongondo, F.O., Williams, I.D., Cherrett, T.J., 2011. How are WEEE
doing? A global review of the management of electrical and electronic
wastes. Waste Management. 31:714-730. Osibanjo, O., Nnorom, I.C., 2007. The challenge of electronic waste (e-
waste) management in developing countries. Waste Management
and Research. 25 (6):489-501. Söderholm, P., 2011. Taxing virgin natural resources: Lessons from
aggregates taxation in Europe. Resources, Conservation and
Recycling. 55:911- 922. Peralta GL, Fontanos PM (2006). E-waste issues and measures in the
Philippines. J. Material Cycles Waste Manage. 8:34-39.
Pinto VN (2008). E-waste hazard: The impending challenge. Indian J. Occup. Environ. Med. 12:65-70
PMC (2012). Pune City Sanitation Plan 2012 (Final Draft). Pune
Municipal Corporation. Puckett J, Westervelt S, Gutierrez R, Takamiya Y (2005). The digital
dump. Exporting re-use and abuse to Africa. Report from the Basel
Action Network, Seattle. Pune Mirror (2011). Pune seems content with e-waste mismanagement.
Dated: 5th Aug, 2011.
Ramachandra TV, Varghese, SK. (2004). Environmentally Sound Options for E-Wastes Management. Envis J. Hum. Settle.
Reed MS, Graves A, Dandy N, Posthumus H, Hubacek K, Morris J,
Prelle C, Quinn CH, Stringer, LC (2009). Who’s in and why? A typology of stakeholder analysis methods for natural resource management. J. Environ. Manage. 90:1933-1949.
Robinson BH (2009). E-waste: An assessment of global production and environmental impacts. Sci. of the Total Environ. 408:183-191.
Borthakur and Sinha 909 Saphores JDM, Nixon H, Ogunseitan OA, Shapiro AA (2009). How
much e-waste is there in US basements and attics? Results from a national survey. J. Environ. Manage. 90:3322-3331.
Schluep M. et al., (2009). Sustainable Innovation and Technology Transfer Industrial Sector Studies: Recycling - from E-waste to Resources. United Nations Environment Programme & United
Nations University, Bonn, Germany. Schluep M,Hagelueken C, Kuehr R, Magalini F, Maurer C, Meskers C,
Mueller E, Wang F (2009). Recycling - from E-waste to Resources.
United Nations Environment Programme and United Nations University, Germany. Available at: http://isp.unu.edu/news/2010/files/UNEP_eW2R_publication.pdf Last
accessed on 5th December, 2012. Schmidt CW (2006). Unfair trade: e-waste in Africa. Environmental
Health Perspectives. 114, A232-A235.
Sepúlveda A, Schluep M, Renauda FG, Streicher M, Ruediger Kuehr R, Hagelüken C, Gerecke AC (2010). A review of the environmental fate and effects of hazardous substances released from electrical and
electronic equipments during recycling: Examples from China and India. Environmental Impact Assessment Review. 30:28-41.
Shinkuma T, Managi S (2010). On the effectiveness of a license
scheme for E-waste recycling: The challenge of China and India. Environmental Impact Assessment Review. 30:262-267.
Sinha D (2004). The management of electronic waste: A Comparative
Study on India and Switzerland. (Master’s Thesis, University of St. Gallen, 2004).
Sinha S (2008). “Dark shadows of digitization on Indian horizon”, In:
Johri R. (ed.), E-waste: Implications, regulations, and management in India. New Delhi: The Energy and Resource Institute pp. 23-44
Sinha-Khetriwal D, Kraeuchi P, Schwaninger M (2005). A comparison of
electronic waste recycling in Switzerland and in India. Environ. Impact Assess. Rev. 25:492- 504.
Skinner A, Dinter Y, Lloyd A, Strothmann P (2010). The Challenges
of E-Waste Management in India: Can India draw lessons from the EU and the USA? ASIEN. 117:7-26.
Sreevatsan A, Krishnan S (2009). Disposal of E-waste a staggering
problem city PULSE. (Date:27/07/2009 Source: Hindu (Chennai)). Availableat:http://www.indiaenvironmentportal.org.in/taxonomy/term/2510/0?page=192&rtype=books . Last accessed on 4
th December,
2012. Stevels ALN, Rama AAP, Deckers E (1999). Take-back of discarded
consumer electronic products from the perspective of the producer
Conditions for success. J. Cleaner Product. 7:383-389. Streicher-Porte M, Widmer R, Jain A , Bader HP, Scheidegger R,
Kytzia S (2005). Key drivers of the e waste recycling system:
assessing and modelling e-waste processing in the informal sector in Delhi. Environ. Impact Assess. Rev. 25:472-491.
Takayoshi, Shinkuma (2007). Reconsideration of an advance disposal fee policy for end-of-life durable goods. J. Environ. Econ. Manage.
53:110-121. Terazono A, Murakami S, Abe N, Inanc B, Moriguchi Y, Sakai S,
Kojima M,Yoshida A, Li J, Yang J, Wong MH, Jain A, Kim IS,
Peralta GL, Lin CC, Mungcharoen T, Williams E (2006). Current status and research on E-waste issues in Asia. J. Mat. Cycles and Waste Manage. 8 (1):1-12.
Toxic Links., 2004. E-WASTE IN INDIA:System failure imminent - take action NOW! Available at www.toxicslink.org/docs/06040_repsumry.pdf. Last accessed on 20
th
August, 2012. Toxics Link., 2004. E-Waste in India: System failure imminent - take
action NOW! Available at http://toxicslink.org/pub-
view.php?pubnum=40. Last accessed on 23rd
August, 2012. Tsydenova O., Bengtsson, M., 2011. Chemical hazards associated with
treatment of waste electrical and electronic equipment. Waste
Manage. 31:45-58. UNEP (2006). Call for Global Action on E-waste. United Nations
Environment Programme.
UNEP (2007). E-waste-Volume I: Inventory Assessment Manual. United Nations Environmental Programme.
UNEP (2010). A report - recycling - from E-waste to resources. United
Nations Environment Programme (UNEP); February 22, 2010. Van Beukering, PJH, van den Bergh JCJM (2006). Modelling and analysis
910 Afr. J. Environ. Sci. Technol.
of international recycling between developed and developing countries. Resour, Conserv. Recycling. 46:1-26.
Venn Couze., 2006. Rubbish, the Remnant, Etcetera. Theor. Cult. Soc.
23:44-46. Wang F , Jaco Huisman J, Meskers CEM, Schluep M, Stevels Ab,
Hagelüken C (2012). The Best-of-2-Worlds philosophy: Developing
local dismantling and global infrastructure network for sustainable e-waste treatment in emerging economies. Waste Manage. (The article is in press).
Wang Y, Ru Y, Veenstra A, Wang R, Wang Y (2010). Recent developments in waste electrical and electronics equipment legislation in China. Int. J. Advan. Manufact. Technol. 47(5-8):437-
448. Wath S et al, (2010). A roadmap for development of sustainable E-
waste management system in India. Sci. Total Environ. 409:19-32.
WHO (2010). Report On Inventorization of E-Waste in Two Cities in Andhra Pradesh And Karnataka (Hyderabad And Bangalore). Prepared by Environment Protection Training and Research Institute,
Gachibowli, Hyderabad, Andhra Pradesh, India.
Widmer R, Oswald-Krapf H, Sinha-Khetriwal D, Schnellmann M, Böni
H (2005). Global perspectives on e-waste. Environ. Impact Assess. Rev. 25(5):436-458.
Williams E, Kahhat R, Allenby B, Kavazanjian E, Kim J, Xu M (2008). Environmental, social and economic implications of global reuse and recycling of personal computers. Environ. Sci. Technol.
1;42(17):6446-6454. WITSA (World Information Technology and Services Alliance) (2002).
Digital planet 2002: the global information economy.
Wong MH et al. (2007). Export of toxic chemicals: A review of the case of uncontrolled electronic-waste recycling. Environ. Pollut. 149:131-140.
Yang J, Lu B, Xu C, (2007). WEEE flow and mitigating measures in China. Waste Manage. 28:1589-1597.
Yu J, Eric Williams E, Ju M, Yang Y (2010). Forecasting global
generation of obsolete personal computers. Environ. Sci. Technol. 44(9):3232-3237.