generalized pitzer correlation for density calculations of
TRANSCRIPT
DOI: 10.22146/ajche.60787
Generalized Pitzer Correlation for Density Calculations of
Ionic Liquids Jesus Patrick E. Nuqui 1
Regina G. Damalerio *,1,2
Sychheng Meas 1
Socheata Yem 1
Allan N. Soriano 1
1Chemical Engineering Department, Gokongwei College of Engineering, De La Salle University, 2401 Taft Avenue, Malate, Manila 1004 Philippines
2Center for Engineering Sustainable and Development Research, De La Salle University, 2401 Taft Avenue, Malate, Manila 1004 Philippines
*E-mail: [email protected]
Submitted 22 October 2020 Revised 05 May 2021 Accepted 19 May 2021
Abstract. The density of ionic liquids is an important design parameter for its utilization as a
chemical process solvent. In this study, a generalized Pitzer-type correlation for calculating the
density of ionic liquids with the use of reduced temperature (TR), reduced pressure (PR), and acentric
factor (ω) as parameters is proposed. Experimental density data were obtained from several
references through the IUPAC Ionic Liquids Database. Expansion of the terms as well as integrating
the ionic liquid molecular weight was attempted to determine the accuracy improvement of the
model in predicting densities at 0.1 MPa. Then, the obtained model was modified by further
truncation to include the pressure effects for densities at higher pressures. MATLAB software was
used to determine the optimal virial coefficients for the proposed correlations. The percent average
absolute deviation (%AAD) was applied to calculate the variation between the experimental and
calculated density values. It was concluded that the eight (8) coefficient correlation equation with
molecular weight for densities at 0.1 MPa had a %AAD of 4.7537%. Upon modifying the correlation
to include pressure effects, the resulting modified equation had an overall %AAD of 4.7174%.
Keywords: Ionic liquids, Pitzer correlation, MATLAB, virial coefficients, percent average absolute
deviation
INTRODUCTION
Ionic liquids (ILs) have gained interest
in chemical engineering applications due to
their favorable properties. ILs are feasible
green solvents for process industries due to
negligible vapor pressure, low flammability,
and high thermal, chemical, and
electrochemical stability. These are properties
that make it possible to incur lesser emissions
to the environment while utilizing a solvent
that is reliable in performance. Combining
different organic cations and organic or
inorganic anions make up most of the ionic
liquids (Shariati et al. 2013). In terms of its
applications, the extraction or separation
process of aromatics from aliphatics is of
significant interest (Delgado-Mellado et al.
J.P.E. Nuqui, R. Damalerio, S. Meas, S. Yem, A. N. Soriano 39
2019) as it is observed to be superior to
conventional solvents (Canales and
Brennecke, 2016). Synthesis of ILs intended
for a specified application will require
information regarding their properties.
Several challenges are encountered in
attempts to experiment on ILs properties. ILs
are expensive and tend to decompose upon
approaching conditions of critical states
(Valderrama et al. 2008). This has paved the
way towards initiatives to utilize different
methods in estimating the critical properties
of ILs. One notable attempt was performed
by Valderrama et al. (2008) in utilizing a group
contribution method to estimate the critical
properties, normal boiling point, and acentric
factor of 200 ILs.
Density is a crucial design variable in
chemical process industries. There are several
means to predict ionic liquid densities, such
as the use of the equation of states,
correlations such as those based on the
corresponding state principles, and group
contribution methods based on molecular
structure. Equation of state has its limitations
when applied to the calculation of liquid
densities. Meanwhile, the accuracy of
correlation equations relies on the set
experimental data used for its derivation
(Roshan and Ghader 2012, Roshan and
Ghader 2013). Zarei et al. (2019) modified a
density correlation for liquid refrigerants
called Nasrifar and Moshfeghian equation
(Nasrifar and Moshfeghian, 1998) by
removing the characteristic parameter that
has a specified value for different ionic liquids
and reducing the global constants. The
resulted modified equation is generalized for
many ionic liquids by requiring only critical
parameters and the acentric factor. Zarei et al.
(2019) further developed a correlation for
calculations at higher pressures by again
requiring only the critical temperature and
pressure and the acentric factor. Keshavarz et
al. (2016) developed a group contribution
model in the form of multiple linear
regression to calculate the density of ILs using
its elemental compositions as variables and
with correction factors to adjust the effects of
ionic interactions. Valderrama et al. (2009)
developed a method to predict ionic liquid
densities using the classical group
contribution method and artificial neural
network (ANN) as the mathematical tool.
Rostami et al. (2019) developed a method to
estimate the densities of ILs by applying
group contribution combined with the least
square support vector machine trained by a
genetic algorithm. In Roshan and Ghader's
(2012) work, three equations for predicting
the density of liquids were modified and
integrated with adjustable parameters to fit
their use for ionic liquid density calculations.
Patel and Joshipura (2013) observed that less
accurate predictions were obtained using the
cubic equation of states. They improvised the
Predictive-Soave-Redlich-Kwong (PSRK)
approach by Khashayar et al. (1998) for
predicting the liquid density of refrigerants by
generating compound-specific adjustable
parameters for 47 ILs. The optimized PSRK
model is not a cubic equation of state, but it
uses the cohesion factor expression of the
Soave-Redlich-Kwong model. In all of the
studies cited above, experimental data is
essential to increase the model's accuracy
and evaluate the suitability of the model for
ILs densities.
Another version of an equation of state
is expressed in virial form. Onnes (1902)
formulated a virial equation of state written
as a power series in reciprocal volume. The
virial equation of states can be expanded to
increase its accuracy in representing
experimental data (Zohuri, 2018). A three-
parameter corresponding state is suggested

40 Generalized Pitzer Correlation for Density Calculations of Ionic Liquids
by Pitzer et al. (1955) for heavier fluids
wherein a substance-specific parameter
called an acentric factor, 𝜔, is included. The
general form of the correlation is expressed
as X = X0 + 𝜔 X1. Often, X represents a
property of the fluid such as compressibility
factor, enthalpy, entropy, and others. The use
of the acentric factor is an extension of the
two-parameter corresponding state principle
to account for deviations that are typical of
heavier fluids (Mesbah and Bahadori, 2016).
The correction factors X0 and X1 expand in
virial form and are often expressed as a
function of pressure, temperature, and
volume.
In this study, a Pitzer-type correlation,
one that involves the use of the acentric factor,
was derived to predict the density of ionic
liquids across a wide range of temperatures
at 0.1 MPa. The X variable in this correlation
will be the density of ILs and the subsequent
correction factors, X0 and X1, expands in virial
form with the reduced temperature (TR) and
molecular weight (M) as parameters. Upon
determining the coefficients in the
generalized correlation equation for IL
densities at 0.1 MPa, the model was further
modified by truncation to account for
pressure effects by integrating the reduced
pressure (PR) in the calculations. Finally, the
model's accuracy was evaluated by
calculating the percent average absolute
deviation (% AAD) for each IL applied in the
study. The purpose of selecting this method
is to provide data regarding the accuracy and
limitations of using the Pitzer model for ionic
liquid densities.
METHODOLOGY
Collection of experimental data
The initial list of ionic liquids and
corresponding critical properties such as
critical temperature (Tc), critical pressure (Pc),
acentric factor (ω), and molecular weight
were obtained from Valderrama et al. (2008).
Experimental density data at 0.1 MPa and
high pressures were collected from the IUPAC
Ionic Liquids Database. The data sets were
plotted in a density vs. temperature graph for
the trimming process. Data sets that
exhibited deviation from the trend, with
percent errors equal to or more than ± 10,
and with less than three (3) available data
points were excluded. Trimming of data
points was one of the measures to improve
the resulting correlation equation as it relies
on the data set used. 78 ionic liquids from the
study of Valderrama et al. (2008) were
considered in this study due to sufficient
available data in the IUPAC Ionic Liquids
Database.
Proposed correlations as a function of
reduced temperature for densities at 0.1
MPa
The virial equations were initiated
starting with 6 coefficients and further
expanded until the percent average absolute
deviation (%AAD) can no longer be lowered.
The objective function for the density
correlation is expressed as:
𝜌𝑐𝑎𝑙𝑐 = 𝜌0 + 𝜔𝜌1 (1)
where ρcalc is the calculated density in kg·m-3,
ω is the acentric factor of the IL, and 𝜌0 and
𝜌1 are the correction factors as a function of
reduced temperature, TR. For the six
coefficients (α1 - α6) virial equation, 𝜌0 and 𝜌1
are defined as:
𝜌0 = 𝛼1 +𝛼2
𝑇𝑅+
𝛼3
𝑇𝑅2 (2)
𝜌1 = 𝛼4 +𝛼5
𝑇𝑅+
𝛼6
𝑇𝑅2 (3)
In the following discussions, Eq. (1)
refers to the generalized Pitzer-type
J.P.E. Nuqui, R. Damalerio, S. Meas, S. Yem, A. N. Soriano 41
correlation for density, while the term virial
equation refers to the different forms of the
expansion of 𝜌0 and 𝜌1 used in this study.
Using MATLAB software, the values of
α1 - α6 were maximized based on the
experimental density data at 0.1 MPa. The
calculated alpha, α, coefficients were plugged
into Eqs. (2) and (3) to obtain ρ0 and ρ1, which
were plugged into Eq. (1) to determine the
calculated density, 𝜌 calc. Similar procedures
were performed for virial equations with 8, 10,
and 12 coefficients. Eqs. (4) and (5) present
the correction factors for the highest
expansion of the model achieved in this study
which contains 12 coefficients.
𝜌0 = 𝛼1 +𝛼2
𝑇𝑅+
𝛼3
𝑇𝑅2 +
𝛼4
𝑇𝑅3 +
𝛼5
𝑇𝑅4 +
𝛼6
𝑇𝑅5 (4)
𝜌1 = 𝛼7 +𝛼8
𝑇𝑅+
𝛼9
𝑇𝑅2 +
𝛼10
𝑇𝑅3 +
𝛼11
𝑇𝑅4 +
𝛼12
𝑇𝑅5 (5)
The accuracy for N number of data
points for each ionic liquid was measured in
terms of the %AAD:
%𝐴𝐴𝐷 =1
𝑁∑
|𝜌𝑐𝑎𝑙𝑐 − 𝜌𝑒𝑥𝑝𝑡|
𝜌𝑒𝑥𝑝𝑡𝑁∗ 100
(6)
In this study, to determine the best
expansion of the virial equation, each %AAD
was obtained for comparison.
Proposed correlations as functions of
molecular weight and reduced
temperature for densities at 0.1 MPa
Assuming its direct relation to density,
the effect of molecular weight, M, on the
overall accuracy of the proposed correlations
was also investigated. The equations for the
correction factors, 𝜌0 and 𝜌1, were modified
and then expressed as:
For 6 coefficients:
𝜌0 = 𝛼1 + 𝛼2𝑀
𝑇𝑅+ 𝛼3
𝑀2
𝑇𝑅2 (7)
𝜌1 = 𝛼4 + 𝛼5𝑀
𝑇𝑅+ 𝛼6
𝑀2
𝑇𝑅2 (8)
For 8 coefficients:
𝜌0 = 𝛼1 + 𝛼2
𝑀
𝑇𝑅+ 𝛼3
𝑀2
𝑇𝑅2
+ 𝛼4
𝑀3
𝑇𝑅3
(9)
𝜌1 = 𝛼5 + 𝛼6
𝑀
𝑇𝑅+ 𝛼7
𝑀2
𝑇𝑅2
+ 𝛼8
𝑀3
𝑇𝑅3
(10)
Eq. (1) was used to calculate 𝜌calc after
obtaining the correction factors ρ0 and ρ1,
while Eq. (6) was used to evaluate the %AAD
for each model. The n coefficient virial
equation with the lowest %AAD was used and
modified to calculate the densities at higher
pressures.
Proposed correlations as functions of
molecular weight, reduced temperature,
and reduced pressure for densities at high
pressures
To incorporate the effects of pressure,
additional terms were added to the most
accurate n coefficient correlation for IL
densities at 0.1 MPa. The additional terms in
the expanded virial equation included the
new coefficients for pressure effects, β, and
added parameters of reduced pressure at
high pressures, PR,H, and reduced pressure at
0.1 MPa, PR,1.
From the density calculations at 0.1 MPa,
the correlation with eight (8) coefficients and
molecular weight as an added parameter had
the lowest overall %AAD. Further expansion
was found to result in a divergence of the
model. The obtained alpha coefficients from
low-pressure calculations were retained for
the modified equation to predict densities at
higher pressures. Eqs. (11) and (12) show the
correction factors, 𝜌 0 and 𝜌 1, for the
42 Generalized Pitzer Correlation for Density Calculations of Ionic Liquids
correlation of ionic liquid densities at higher
pressures.
𝜌0 = 𝛼1 + 𝛼2
𝑀
𝑇𝑅+ 𝛼3
𝑀2
𝑇𝑅2 + 𝛼4
𝑀3
𝑇𝑅3
+ 𝛽1
𝑀(𝑃𝑅,𝐻 − 𝑃𝑅,1)
𝑇𝑅
+ 𝛽2
𝑀2(𝑃𝑅,𝐻 − 𝑃𝑅,1)
𝑇𝑅2
2
+ 𝛽3
𝑀3(𝑃𝑅,𝐻 − 𝑃𝑅,1)
𝑇𝑅3
3
(11)
𝜌1 = 𝛼5 + 𝛼6
𝑀
𝑇𝑅+ 𝛼7
𝑀2
𝑇𝑅2 + 𝛼8
𝑀3
𝑇𝑅3
+ 𝛽4
𝑀(𝑃𝑅,𝐻 − 𝑃𝑅,1)
𝑇𝑅
+ 𝛽5
𝑀2(𝑃𝑅,𝐻 − 𝑃𝑅,1)
𝑇𝑅2
2
+ 𝛽6
𝑀3(𝑃𝑅,𝐻 − 𝑃𝑅,1)
𝑇𝑅3
3
(12)
The additional terms containing the β
coefficients add the effects of increased
pressure and mathematically give a value of
zero at 0.1 MPa, since PR,H becomes equal to
PR,1. The modified correlation was simulated
in MATLAB software using all data points to
determine the β coefficients. After calculating
𝜌 0 and 𝜌 1, the 𝜌 calc and %AAD were
determined using Eq. (1) and Eq. (6),
respectively. The same procedure was
repeated to obtain %AAD per ionic liquid as
well as for each model.
RESULTS AND DISCUSSION
Effect of molecular weight parameter to
the overall %AAD for models at 0.1 MPa
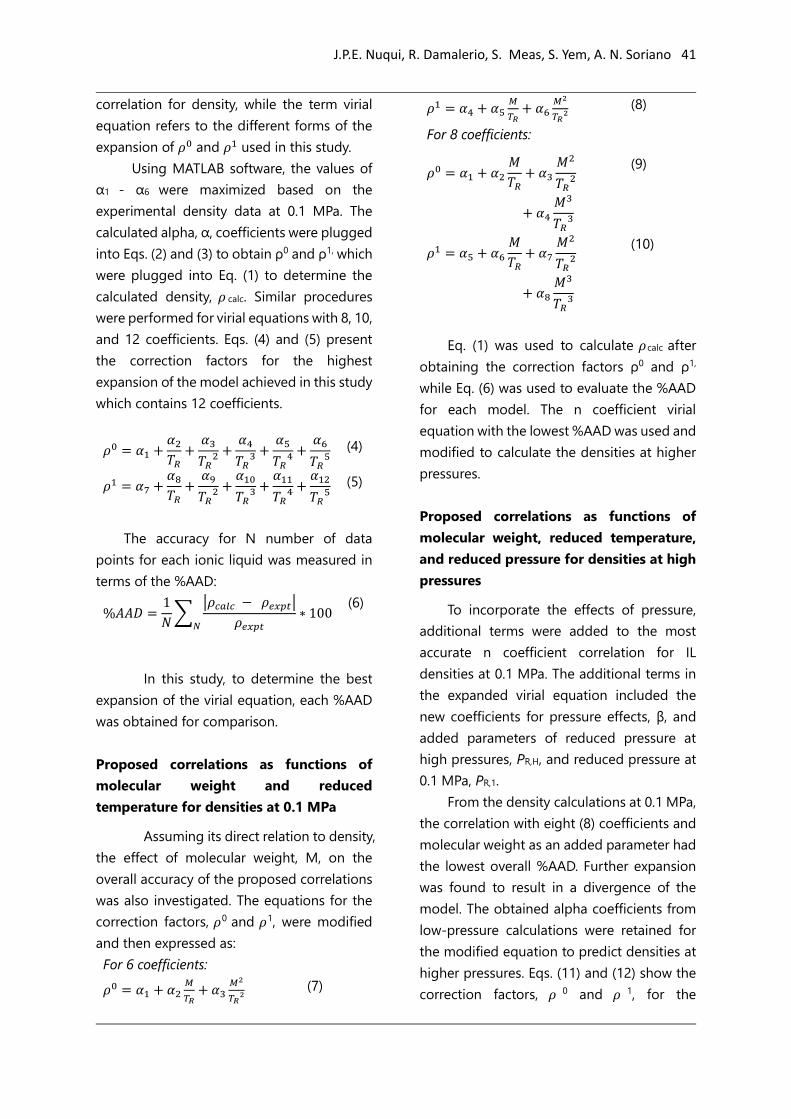
Table 1 presents the overall %AAD of the
different models with n coefficients, with and
without the effect of molecular weight. The 78
ILs with a combined 3982 data points were all
used to derive those correlations. The
overall %AAD was calculated using all density
data at 0.1 MPa. It was concluded that the
correlations incorporated the molecular
weight had lower overall %AAD at even lesser
truncated terms. Integrating the molecular
weight in the equation has been proven to
improve the model's accuracy, which
indicates that this property should not be
neglected in considering densities. In the
virial equation for low pressure, raising the
power of (M/TR) above 3 resulted in the
overall computation's divergence as the
computed density started to increase
dramatically. Therefore, only the eight (8)
coefficient virial equation was achieved in the
model, which integrates the molecular weight.
Table 1. The effect of truncating the terms in
the virial equation model in terms of
overall %AAD.
No. of
coefficients
Overall %AAD
Without
Molecular
Weight
With
Molecular
Weight
6 5.4250 4.8528
8 5.3658 4.7537
10 5.1966
12 5.1905
In the modified equation for higher
pressures, the same behavior of the
divergence of the equations upon further
truncation has occurred. Therefore, it was
found that the expansion of the terms has a
limit and the best model adopted is the one
that has the lowest %AAD before
approaching the limit.
The virial equation for ionic liquid density
calculations at 0.1 MPa
The %AAD in calculating liquid density at
low pressure (0.1 MPa) is presented in Table 2.
The temperature range was based on the
lower and upper limits of the 3982 data
points obtained from IUPAC Ionic Liquids

J.P.E. Nuqui, R. Damalerio, S. Meas, S. Yem, A. N. Soriano 43
Database. The model has exhibited reliable
accuracy in predicting the densities of ionic
liquids [emim][Ac] (0.40%), [pmpy][bti]
(0.53%), [prmpyr][bti] (0.75%), [S221][bti]
(0.92%), [py][EOESO4] (0.70%), and
[emim][ESO4] (0.47%). [mim][HSO4] has the
largest average and maximum %AAD which
are 21.40% and 21.78%, respectively. The
range and average of experimental densities
extracted from the database and the average
calculated density for each ILs are also shown.
Table 2. %AAD in calculating the ionic liquid densities using the virial equation with eight (8)
coefficients. Ionic Liquid N %AADave %AADmin %AADmax T(K) (range) 𝝆𝒆𝒙𝒑𝒕 /kg ∙ m-3
(range)
𝝆𝒆𝒙𝒑𝒕 /kg ∙ m-3
(average)
𝝆𝒄𝒂𝒍𝒄/kg∙m-3
[bmim][TFES] 10 5.3425 4.8670 5.8371 288.15 - 333.15 1318.8 - 1355.5 1337.09 1265.62
[emim][TFES] 7 10.6061 10.5650 10.6258 293.15 - 353.15 1385.8 - 1435.8 1410.71 1261.09
[bmim][HFPS] 4 9.1232 7.8685 10.2450 283.15 - 348.15 1364 - 1422 1395.00 1267.53
[bmim][TPES] 4 11.2069 9.2077 12.8952 283.15 - 348.15 1372 - 1439 1407.75 1249.63
[bmim][FS] 4 12.8820 11.0871 14.3826 283.15 - 348.15 1401 - 1462 1434.75 1249.63
[bmim][Ac] 119 8.2759 7.2052 10.3741 273.15 - 413.15 984.9 - 1112.5 1037.98 1123.79
[emim][Ac] 96 0.4045 0.0076 0.9026 273.15 - 363.15 1058.7 - 1115.3 1085.00 1089.35
[emim][BEI] 19 7.8765 6.4100 8.7124 273.15 - 363.15 1523.3 - 1621.6 1576.44 1452.08
[bmim][BEI] 23 7.1848 5.6271 7.6803 273.15 - 363.15 1446.1 - 1539.6 1500.27 1392.33
[dbim][bti] 36 2.0790 1.2617 3.6455 273.15 - 363.15 1282.5 - 1362.7 1322.70 1350.04
[dmim][bti] 32 3.7462 3.5021 3.9922 293.15 - 363.15 1503.2 - 1575 1543.76 1485.90
[bmpy][bti] 181 1.2741 0.0009 2.8350 278.15 - 373.15 1324.6 - 1498.1 1389.49 1407.00
[decmim][bti] 42 2.9662 1.3688 9.0373 293.15 - 473.15 1131.4 - 1308 1235.72 1271.76
[N-epy][bti] 40 2.6142 2.3796 2.8861 288.15 - 343.15 1491.87 - 1545.9 1519.35 1479.62
[hpmim][bti] 44 2.8894 1.0554 9.3686 278.15 - 473.15 1189.4 - 1373 1304.28 1340.91
[nmim][bti] 37 3.3023 1.5617 9.6707 278.15 - 473.15 1147.8 - 1316.4 1251.73 1292.18
[pmim][bti] 53 1.8152 0.0418 7.1665 278.15 - 473.15 1241.3 - 1443.6 1363.58 1387.17
[prmim][bti] 70 1.1637 0.0295 3.1079 278.15 - 473.15 1305.1 - 1515.1 1440.44 1430.30
[pmpy][bti] 79 0.5315 0.0107 1.3192 264.25 - 363.28 1386.7 - 1481.37 1430.89 1431.50
[N1123][bti] 23 2.1228 1.4084 2.9250 278.15 - 353.15 1352 - 1420.02 1384.25 1354.78
[N-bupy][bti] 97 1.0408 0.0647 2.0525 278.15 - 363.15 1389 - 1467.9 1429.84 1444.62
[prmpyr][bti] 67 0.7507 0.0092 1.6918 278.15 - 363.15 1370.5 - 1446.2 1410.51 1420.94
[N1444][bti] 19 2.2655 0.2289 3.4573 283.15 - 353.15 1217.5 - 1276 1248.89 1220.43
[N7222][bti] 8 2.1800 0.0657 3.9069 293.16 - 363.15 1213.8 - 1275.7 1245.13 1217.91
[N6222][bti] 41 1.6315 0.0005 3.4856 283.15 – 373.00 1231.1 - 1301.47 1264.44 1245.43
[N8222][bti] 25 2.9184 0.8104 4.1039 283.15 - 363.15 1195.8 - 1261.7 1227.86 1191.82
[S222][bti] 49 2.9009 2.4018 3.2923 278.15 - 353.15 1410.2 - 1479.7 1446.47 1488.38
[N1114][bti] 191 1.3946 0.0133 2.3355 278.15 - 414.93 1288.6 - 1480.6 1370.92 1351.77
[tmpa][bti] 10 3.3961 3.2790 3.4813 298.20 - 315.10 1414.2 - 1429.6 1422.63 1374.31
[Ph(CH2)mim][bti] 16 2.4483 1.7882 3.5122 278.15 - 323.15 1458 - 1512 1484.31 1520.58
[bdmim][bti] 80 1.3989 0.0307 2.4775 273.15 - 373.15 1328.4 - 1503.9 1402.35 1383.11
[mbpyr][bti] 25 1.2662 0.0149 2.6026 278.15 - 363.15 1352.7 - 1431 1390.80 1408.24
[bpyr][bti] 97 1.0521 0.0746 2.0660 278.15 - 363.15 1389 - 1467.9 1429.84 1444.78
[C12mim][bti] 34 3.1164 0.9004 8.3694 293.15 - 433.15 1133.7 - 1249.6 1206.32 1244.33
[mmim][bti] 32 4.9491 4.5609 5.2978 293.15 - 363.15 1503.2 - 1575 1543.76 1467.31
[S221][bti] 22 0.9166 0.7731 1.0302 278.15 - 353.15 1449.8 - 1520.5 1485.64 1499.25
[DEME][bti] 24 3.3162 1.7447 4.5905 283.15 - 368.15 1343.4 - 1420.6 1385.42 1339.30
[BMP][bti] 74 2.1505 0.8765 3.5788 283.15 - 373.15 1319 - 1395.6 1357.55 1386.61
[N222(12)][bti] 41 4.3950 0.4022 5.8851 283.15 - 373.00 1133.7 - 1199.67 1165.32 1115.63
[N2228][bti] 41 2.8133 0.4893 4.1635 283.15 - 373.00 1192.3 - 1261.7 1225.42 1190.73
[N2225][bti] 16 1.6183 0.0099 3.3357 298.00 – 373.00 1260.7 - 1321.5 1290.99 1270.34
[bmim][Br] 12 11.5943 11.5703 11.6388 308.39 - 362.86 1261.43 - 1299.64 1280.30 1131.86
[bmim][Cl] 40 1.2338 1.0807 1.5286 298.15 - 373.15 1000 - 1124 1057.60 1070.66
[hmim][Cl] 60 9.5430 9.0388 10.0411 288.15 - 373.15 997.1 - 1048 1022.30 1119.83
[omim][Cl] 50 15.2227 14.1502 16.3123 278.15 - 363.14 972.9 - 1021.2 997.52 1149.32
[emim][Cl] 18 9.0281 8.8026 9.1408 313.38 - 364.85 1106.3 - 1134.8 1118.78 1017.78
[bmim][dca] 223 8.6408 5.9498 11.1063 273.15 - 363.15 1001.1 - 1102.8 1046.77 1137.04
44 Generalized Pitzer Correlation for Density Calculations of Ionic Liquids
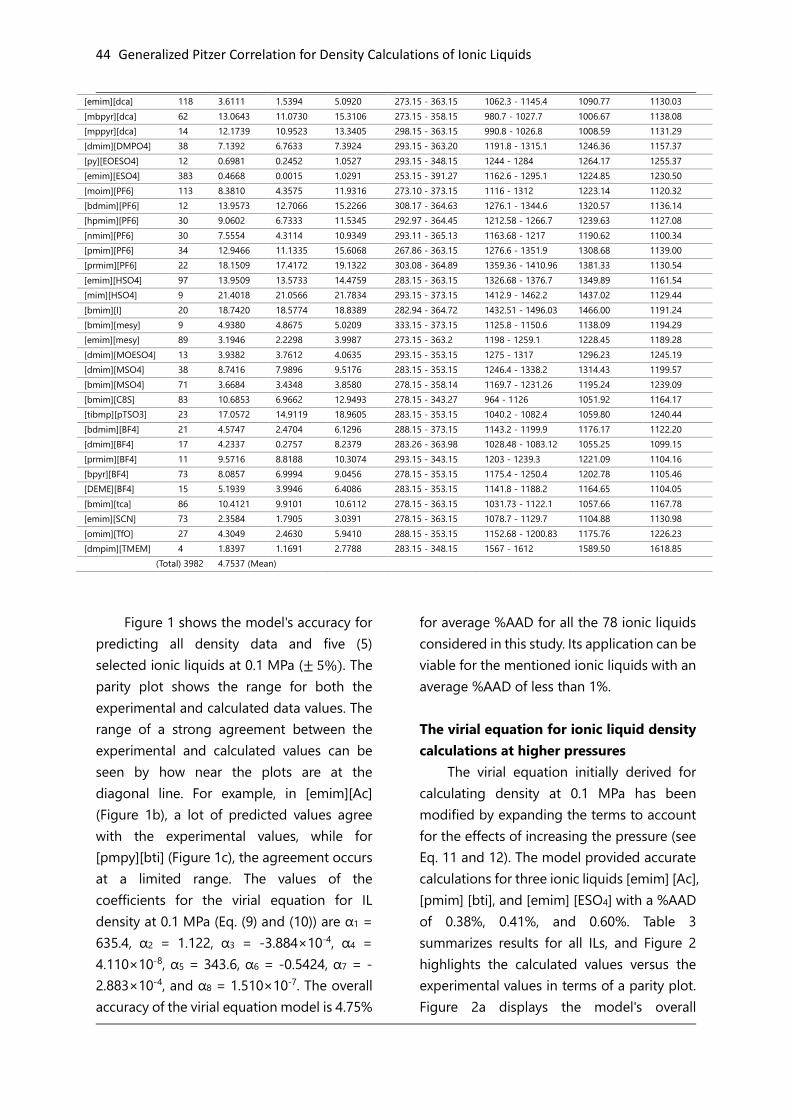
[emim][dca] 118 3.6111 1.5394 5.0920 273.15 - 363.15 1062.3 - 1145.4 1090.77 1130.03
[mbpyr][dca] 62 13.0643 11.0730 15.3106 273.15 - 358.15 980.7 - 1027.7 1006.67 1138.08
[mppyr][dca] 14 12.1739 10.9523 13.3405 298.15 - 363.15 990.8 - 1026.8 1008.59 1131.29
[dmim][DMPO4] 38 7.1392 6.7633 7.3924 293.15 - 363.20 1191.8 - 1315.1 1246.36 1157.37
[py][EOESO4] 12 0.6981 0.2452 1.0527 293.15 - 348.15 1244 - 1284 1264.17 1255.37
[emim][ESO4] 383 0.4668 0.0015 1.0291 253.15 - 391.27 1162.6 - 1295.1 1224.85 1230.50
[moim][PF6] 113 8.3810 4.3575 11.9316 273.10 - 373.15 1116 - 1312 1223.14 1120.32
[bdmim][PF6] 12 13.9573 12.7066 15.2266 308.17 - 364.63 1276.1 - 1344.6 1320.57 1136.14
[hpmim][PF6] 30 9.0602 6.7333 11.5345 292.97 - 364.45 1212.58 - 1266.7 1239.63 1127.08
[nmim][PF6] 30 7.5554 4.3114 10.9349 293.11 - 365.13 1163.68 - 1217 1190.62 1100.34
[pmim][PF6] 34 12.9466 11.1335 15.6068 267.86 - 363.15 1276.6 - 1351.9 1308.68 1139.00
[prmim][PF6] 22 18.1509 17.4172 19.1322 303.08 - 364.89 1359.36 - 1410.96 1381.33 1130.54
[emim][HSO4] 97 13.9509 13.5733 14.4759 283.15 - 363.15 1326.68 - 1376.7 1349.89 1161.54
[mim][HSO4] 9 21.4018 21.0566 21.7834 293.15 - 373.15 1412.9 - 1462.2 1437.02 1129.44
[bmim][I] 20 18.7420 18.5774 18.8389 282.94 - 364.72 1432.51 - 1496.03 1466.00 1191.24
[bmim][mesy] 9 4.9380 4.8675 5.0209 333.15 - 373.15 1125.8 - 1150.6 1138.09 1194.29
[emim][mesy] 89 3.1946 2.2298 3.9987 273.15 - 363.2 1198 - 1259.1 1228.45 1189.28
[dmim][MOESO4] 13 3.9382 3.7612 4.0635 293.15 - 353.15 1275 - 1317 1296.23 1245.19
[dmim][MSO4] 38 8.7416 7.9896 9.5176 283.15 - 353.15 1246.4 - 1338.2 1314.43 1199.57
[bmim][MSO4] 71 3.6684 3.4348 3.8580 278.15 - 358.14 1169.7 - 1231.26 1195.24 1239.09
[bmim][C8S] 83 10.6853 6.9662 12.9493 278.15 - 343.27 964 - 1126 1051.92 1164.17
[tibmp][pTSO3] 23 17.0572 14.9119 18.9605 283.15 - 353.15 1040.2 - 1082.4 1059.80 1240.44
[bdmim][BF4] 21 4.5747 2.4704 6.1296 288.15 - 373.15 1143.2 - 1199.9 1176.17 1122.20
[dmim][BF4] 17 4.2337 0.2757 8.2379 283.26 - 363.98 1028.48 - 1083.12 1055.25 1099.15
[prmim][BF4] 11 9.5716 8.8188 10.3074 293.15 - 343.15 1203 - 1239.3 1221.09 1104.16
[bpyr][BF4] 73 8.0857 6.9994 9.0456 278.15 - 353.15 1175.4 - 1250.4 1202.78 1105.46
[DEME][BF4] 15 5.1939 3.9946 6.4086 283.15 - 353.15 1141.8 - 1188.2 1164.65 1104.05
[bmim][tca] 86 10.4121 9.9101 10.6112 278.15 - 363.15 1031.73 - 1122.1 1057.66 1167.78
[emim][SCN] 73 2.3584 1.7905 3.0391 278.15 - 363.15 1078.7 - 1129.7 1104.88 1130.98
[omim][TfO] 27 4.3049 2.4630 5.9410 288.15 - 353.15 1152.68 - 1200.83 1175.76 1226.23
[dmpim][TMEM] 4 1.8397 1.1691 2.7788 283.15 - 348.15 1567 - 1612 1589.50 1618.85
(Total) 3982 4.7537 (Mean)
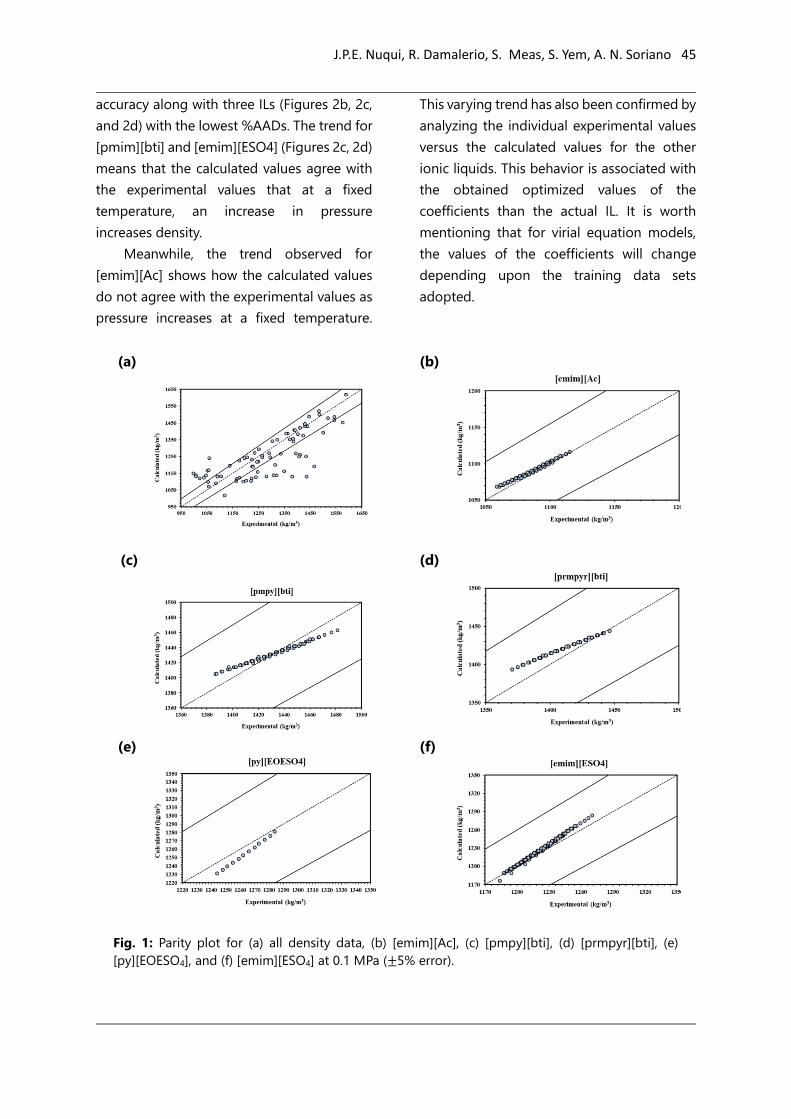
Figure 1 shows the model's accuracy for
predicting all density data and five (5)
selected ionic liquids at 0.1 MPa (± 5%). The
parity plot shows the range for both the
experimental and calculated data values. The
range of a strong agreement between the
experimental and calculated values can be
seen by how near the plots are at the
diagonal line. For example, in [emim][Ac]
(Figure 1b), a lot of predicted values agree
with the experimental values, while for
[pmpy][bti] (Figure 1c), the agreement occurs
at a limited range. The values of the
coefficients for the virial equation for IL
density at 0.1 MPa (Eq. (9) and (10)) are α1 =
635.4, α2 = 1.122, α3 = -3.884×10⁻⁴, α4 =
4.110×10⁻⁸, α5 = 343.6, α6 = -0.5424, α7 = -
2.883×10⁻⁴, and α8 = 1.510×10⁻⁷. The overall
accuracy of the virial equation model is 4.75%
for average %AAD for all the 78 ionic liquids
considered in this study. Its application can be
viable for the mentioned ionic liquids with an
average %AAD of less than 1%.
The virial equation for ionic liquid density
calculations at higher pressures
The virial equation initially derived for
calculating density at 0.1 MPa has been
modified by expanding the terms to account
for the effects of increasing the pressure (see
Eq. 11 and 12). The model provided accurate
calculations for three ionic liquids [emim] [Ac],
[pmim] [bti], and [emim] [ESO4] with a %AAD
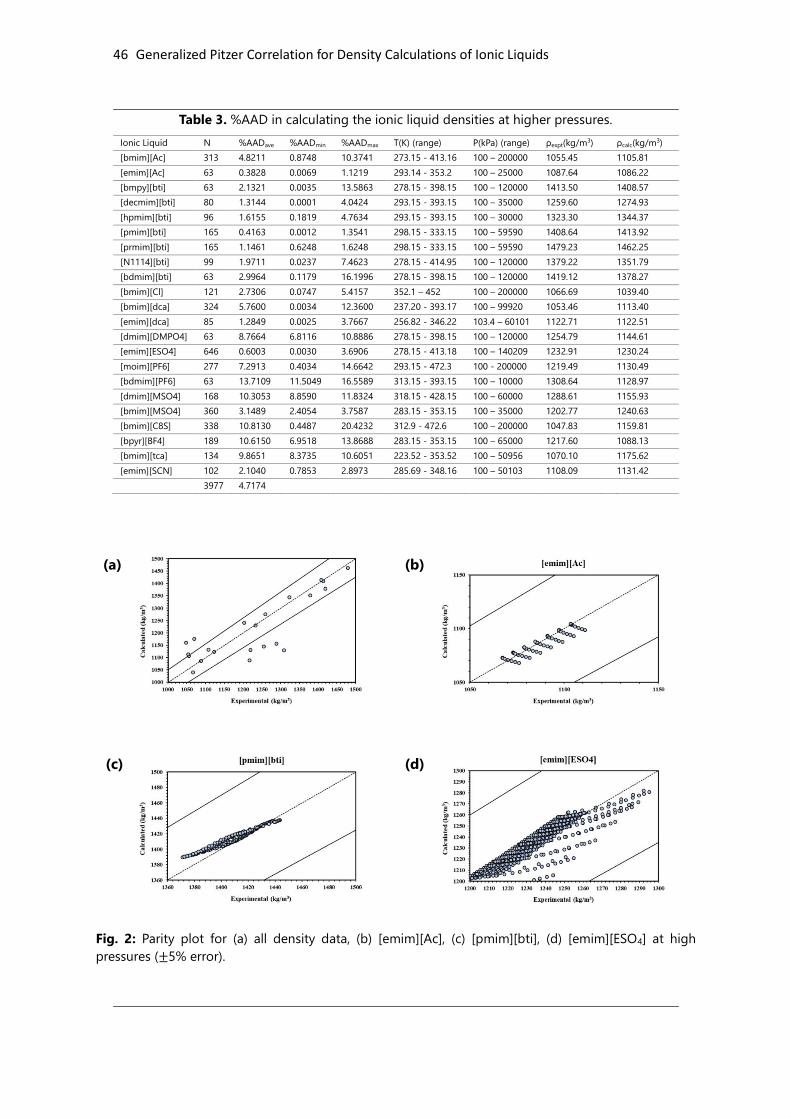
of 0.38%, 0.41%, and 0.60%. Table 3
summarizes results for all ILs, and Figure 2
highlights the calculated values versus the
experimental values in terms of a parity plot.
Figure 2a displays the model's overall
J.P.E. Nuqui, R. Damalerio, S. Meas, S. Yem, A. N. Soriano 45
accuracy along with three ILs (Figures 2b, 2c,
and 2d) with the lowest %AADs. The trend for
[pmim][bti] and [emim][ESO4] (Figures 2c, 2d)
means that the calculated values agree with
the experimental values that at a fixed
temperature, an increase in pressure
increases density.
Meanwhile, the trend observed for
[emim][Ac] shows how the calculated values
do not agree with the experimental values as
pressure increases at a fixed temperature.
This varying trend has also been confirmed by
analyzing the individual experimental values
versus the calculated values for the other
ionic liquids. This behavior is associated with
the obtained optimized values of the
coefficients than the actual IL. It is worth
mentioning that for virial equation models,
the values of the coefficients will change
depending upon the training data sets
adopted.
(a) (b)
(c)
(d)
(e)
(f)
Fig. 1: Parity plot for (a) all density data, (b) [emim][Ac], (c) [pmpy][bti], (d) [prmpyr][bti], (e)
[py][EOESO4], and (f) [emim][ESO4] at 0.1 MPa (±5% error).
46 Generalized Pitzer Correlation for Density Calculations of Ionic Liquids
Table 3. %AAD in calculating the ionic liquid densities at higher pressures.
Ionic Liquid N %AADave %AADmin %AADmax T(K) (range) P(kPa) (range) ρexpt(kg/m3) ρcalc(kg/m3)
[bmim][Ac] 313 4.8211 0.8748 10.3741 273.15 - 413.16 100 – 200000 1055.45 1105.81
[emim][Ac] 63 0.3828 0.0069 1.1219 293.14 - 353.2 100 – 25000 1087.64 1086.22
[bmpy][bti] 63 2.1321 0.0035 13.5863 278.15 - 398.15 100 – 120000 1413.50 1408.57
[decmim][bti] 80 1.3144 0.0001 4.0424 293.15 - 393.15 100 – 35000 1259.60 1274.93
[hpmim][bti] 96 1.6155 0.1819 4.7634 293.15 - 393.15 100 – 30000 1323.30 1344.37
[pmim][bti] 165 0.4163 0.0012 1.3541 298.15 - 333.15 100 – 59590 1408.64 1413.92
[prmim][bti] 165 1.1461 0.6248 1.6248 298.15 - 333.15 100 – 59590 1479.23 1462.25
[N1114][bti] 99 1.9711 0.0237 7.4623 278.15 - 414.95 100 – 120000 1379.22 1351.79
[bdmim][bti] 63 2.9964 0.1179 16.1996 278.15 - 398.15 100 – 120000 1419.12 1378.27
[bmim][Cl] 121 2.7306 0.0747 5.4157 352.1 – 452 100 – 200000 1066.69 1039.40
[bmim][dca] 324 5.7600 0.0034 12.3600 237.20 - 393.17 100 – 99920 1053.46 1113.40
[emim][dca] 85 1.2849 0.0025 3.7667 256.82 - 346.22 103.4 – 60101 1122.71 1122.51
[dmim][DMPO4] 63 8.7664 6.8116 10.8886 278.15 - 398.15 100 – 120000 1254.79 1144.61
[emim][ESO4] 646 0.6003 0.0030 3.6906 278.15 - 413.18 100 – 140209 1232.91 1230.24
[moim][PF6] 277 7.2913 0.4034 14.6642 293.15 - 472.3 100 - 200000 1219.49 1130.49
[bdmim][PF6] 63 13.7109 11.5049 16.5589 313.15 - 393.15 100 – 10000 1308.64 1128.97
[dmim][MSO4] 168 10.3053 8.8590 11.8324 318.15 - 428.15 100 – 60000 1288.61 1155.93
[bmim][MSO4] 360 3.1489 2.4054 3.7587 283.15 - 353.15 100 – 35000 1202.77 1240.63
[bmim][C8S] 338 10.8130 0.4487 20.4232 312.9 - 472.6 100 – 200000 1047.83 1159.81
[bpyr][BF4] 189 10.6150 6.9518 13.8688 283.15 - 353.15 100 – 65000 1217.60 1088.13
[bmim][tca] 134 9.8651 8.3735 10.6051 223.52 - 353.52 100 – 50956 1070.10 1175.62
[emim][SCN] 102 2.1040 0.7853 2.8973 285.69 - 348.16 100 – 50103 1108.09 1131.42
3977 4.7174
(a)
(b)
(c)
(d)
Fig. 2: Parity plot for (a) all density data, (b) [emim][Ac], (c) [pmim][bti], (d) [emim][ESO4] at high
pressures (±5% error).

J.P.E. Nuqui, R. Damalerio, S. Meas, S. Yem, A. N. Soriano 47
The modified equation has an
overall %AAD of 4.72%. It was initially
attempted to recreate a new model, which
is also based on virial equations for
calculating densities at higher pressures
with new coefficients; however, it provided
less accurate results than extending the
virial equation for lower pressures.
Modifying the equation is convenient in a
way that it expounds on the effects of
pressure, and adding it to the previous
equation emphasizes the basic concept
that an increase in pressure corresponds to
an increase in density. 3977 data points
were extracted from IUPAC Ionic Liquids
Database. Application of the equation
must consider the minimum and
maximum temperature and pressure for its
range of validity. Thus, Table 3 provides the
range of temperature and pressure for
reference.
The beta coefficients for the
modified model are β1 = 3.678×10⁻³, β2 =
-2.196×10⁻⁸, β3 = -5.682×10⁻¹³, β4 = -
9.115×10⁻³, β5 = 1.445×10⁻⁷, and β6 =
6.853×10⁻¹⁴. The values are relatively small
compared to the alpha coefficients since
these are intended to serve as pressure
effect correction factors. It is pointed out
once again that further expansion resulted
in a divergence of the model. Privat et al.
(2009) provided insights regarding the
divergence of the virial equation for high
densities into which ionic liquids fall. The
reason why divergence has occurred and
the coefficients are known to have
significance in terms of molecular
interaction is not the scope of this study.
However, it is worth noticing that for some
ionic liquids, the equation derived can be
usable in the prediction of their respective
densities. Additionally, the methods used
in this study can be adopted, and new
coefficients can be derived for ionic liquids,
which the model has the accurate
predicting capability.
Comparison with other models
Table 4 is data adopted from Zarei et al.
(2019), which compares the %AAD
obtained from different models used to
calculate ionic liquid densities. ZN, the
Zarei et al. (2019) model, was a
modification of the model by Nasrifar and
Moshfeghian (1998), which is also included
in the table as NM. GC is the group
contribution method combined with the
artificial neural network by Valderrama et
al. (2009). Meanwhile, YW is the model by
Yen and Wood (1966), which is one of the
early attempts to apply computer
calculations on creating a generalized
equation for IL densities. Rackett (1970)
proposed an equation of state model for
saturated liquids, which is indicated as RA.
A modification of the Rackett equation was
developed by Yamada and Gun (1973),
indicated as YG. HT is a correlation by
Hankinson and Thomson (1979) for
saturated densities of liquids. In the
present study using Pitzer correlation,
prediction of densities for five (5) ionic
liquids: [bmpy][bti], [N7222][bti],
[N1444][bti], [N6222][bti], and [N2225][bti]
provided excellent results compared to
recently developed models such as ZN,
NM, and GC. It can also be seen that
several calculations in the current model
provided %AAD values with high
deviations similar to earlier developed
models such as YW, RA, YG, and HT. In
Table 2, ionic liquids [emim][Ac],

48 Generalized Pitzer Correlation for Density Calculations of Ionic Liquids
[pmpy][bti], [prmpyr][bti], [S221][bti],
[py][EOESO4], and [emim][ESO4] have
a %AAD of 0.40%, 0.53%, 0.75%, 0.92%,
0.70%, and 0.47% respectively. All of which
were not compared as in Table 4 due to
limited data.
Data for comparing the Pitzer
correlation for higher IL densities to other
models is still adopted from the work of
Zarei et al. (2019) as shown in Table 5. NAM
is the model by Zarei et al. (2019) for
higher pressures. The extended Tait
equation by Thomson et al. (1982) is a
method to calculate densities of nonpolar
and slightly polar liquids and mixtures at
higher pressures. Chang and Zhao (1990)
is an equation for calculating the volumes
and densities of compressed liquids. Both
Taylor’s series expansion and Padé’s
approximation are developed by Roshan
and Ghader (2013).
Table 4. Comparison of %AAD with different models of IL densities at 0.1 MPa.
No. Ionic Liquid %AAD
This work ZNa NMb GCc YWd RAe YGf HTg
1 [emim][BEI] 7.88 1.75 0.97 1.57 4.36 18.13 1.15 1.39
2 [bmim][BEI] 7.18 1.95 1.68 1.76 5.31 23.74 5.20 5.45
3 [dmim][bti] 3.75 1.29 0.63 1.66 7.33 5.28 2.38 1.96
4 [bmpy][bti] 1.27 1.57 0.82 1.76 1.01 3.56 1.49 1.74
5 [N-epy][bti] 2.61 1.37 0.39 0.76 8.50 6.55 4.22 3.82
6 [N7222][bti] 2.18 2.42 0.75 2.25 2.08 7.69 10.03 9.77
7 [emim][mesy] 3.19 3.02 0.27 1.51 38.45 22.7 4.49 4.39
8 [N1444][bti] 2.27 2.42 0.75 2.25 2.08 7.69 10.03 9.77
9 [N6222][bti] 1.63 2.03 0.76 1.96 0.79 4.57 7.66 7.46
10 [N8222][bti] 2.92 2.66 0.84 2.25 2.47 10.10 11.69 11.30
11 [bmim][Br] 11.59 0.43 0.01 3.63 4.42 1.51 0.48 0.75
12 [tmpa][bti] 3.40 1.14 0.13 2.09 13.04 9.94 0.73 0.54
13 [hmim][Cl] 9.54 1.04 0.03 2.24 5.10 2.39 0.42 0.88
14 [emim][Cl] 9.03 2.19 0.27 3.97 10.04 7.68 9.05 9.33
15 [DEME][bti] 3.32 1.72 0.58 2.04 3.47 1.92 2.44 2.50
16 [BMP][bti] 2.15 1.26 1.26 2.29 1.93 3.93 10.24 10.10
17 [N2225][bti] 1.62 1.65 0.60 1.62 1.32 1.20 5.05 4.90
18 [omim][Cl] 15.22 1.08 0.17 4.65 3.58 7.73 4.11 3.46
19 [hpmim][PF6] 9.06 1.59 0.08 0.92 9.11 7.36 6.92 5.41
20 [mim][HSO4] 21.40 1.18 0.17 3.80 37.60 42.52 7.70 7.15
21 [nmim][PF6] 7.56 1.09 0.25 0.90 7.59 13.19 11.85 10.12
22 [DEME][BF4] 5.19 0.70 2.17 0.91 26.00 25.79 6.18 7.89
23 [bmim][I] 18.74 2.13 0.09 4.20 1.19 4.35 1.42 1.16
24 [bmim][mesy] 4.94 0.59 0.16 3.69 17.20 14.10 1.13 1.17
25 [dmim][MOESO4] 3.94 2.00 0.28 1.24 13.50 11.31 1.37 1.30
26 [tibmp][pTSO3] 17.06 1.05 0.59 1.01 0.53 12.50 11.80 11.26
27 [bdmim][BF4] 4.57 1.89 0.34 3.73 8.72 8.72 8.21 6.38
28 [prmim][BF4] 9.57 1.28 0.88 2.58 12.90 12.90 1.76 1.58
29 [omim][TfO] 4.30 2.85 0.59 4.67 2.67 2.67 8.80 8.55 aZarei et al. (2019); bNasrifar and Moshfeghian (1998); cValderrama et al. (2009); dYen and Wood (1966); eRackett (1970); fYamada and Gun (1973); gHankinson and Thomson (1979).

J.P.E. Nuqui, R. Damalerio, S. Meas, S. Yem, A. N. Soriano 49
Table 5. Comparison of %AAD with different models of IL densities at higher pressures (adopted from
Zarei et al. (2019).
No. Ionic Liquid %AAD
This work NAMa Taitb CZc Taylord Padéd
1 [emim][Ac] 4.82 1.11 1.13 1.10 1.04 1.18
2 [pmim][bti] 0.42 0.86 1.35 0.93 1.03 0.98
3 [prmim][bti] 1.15 0.77 0.87 0.82 0.73 1.14
4 [bdmim][bti] 3.00 1.01 1.58 1.08 1.35 1.05
5 [bmim][Cl] 2.73 1.52 2.54 3.40 3.96 4.02
6 [bmim][dca] 5.76 3.25 3.13 3.30 2.41 2.93
7 [dmim][DMPO4] 8.77 1.82 1.96 2.14 1.63 3.02
8 [emim][ESO4] 0.60 0.99 0.98 1.04 0.95 1.03
9 [bdmim][PF6] 13.71 2.96 3.11 3.05 3.02 3.16
10 [dmim][MSO4] 10.31 2.28 1.53 1.67 1.40 1.37
11 [bmim][MSO4] 3.15 1.00 0.99 1.04 0.95 1.03
12 [hpmim][bti] 1.62 2.85 3.16 2.99 3.04 2.98 aZarei et al. (2019); bThomson et al. (1982); cChang and Zhao (1990); dRoshan and Ghader (2013)
The accuracy of the equation for
predicting the densities of [pmim][bti],
[emim][ESO4], and [hpmim][bti] were
excellent compared to other models. The ILs
[emim][Ac] and [pmim][bti] with %AADs of
0.38% and 0.41% (Table 3) were not
compared with other models due to limited
data. In Table 5, significant deviations from
the present model are observed compared to
other models. The comparison of the models
is given to show the limitation of the Pitzer
correlation for IL densities. Similar to the
observed improvement in the overall %AAD
obtained by the addition of molecular weight,
it should be considered that other
parameters which are characteristic of each
ILs may improve the accuracy of the model.
CONCLUSIONS
Application of the Pitzer correlation for
ionic liquid density calculations has been
attempted in this study. Improvement of the
model's accuracy by truncating the terms in
the virial equation and including reduced
temperature, reduced pressure, acentric
factor, and molecular weight as variables has
been shown. The results show that 6 of the 78
ionic liquids considered in this study fits well
into the model for density calculations at 0.1
MPa; while 3 of the 22 ionic liquids used in
the higher-pressure density calculations fits
well into the extended virial equation.
There are several generalized correlation
equations available for ionic liquid densities.
The Pitzer correlation, which yields accurate
results when applied for gases at low to
moderate densities, has its limitations when
applied for the density calculations of ionic
liquids. It should be considered that the
coefficients obtained for the model depend
on the adopted data set, therefore indicating
that this approach in calculation can further
be improved and modified. Further
expansion of the terms in the virial equations
has resulted in a divergence in terms of a
dramatic increase in calculated %AAD. The
divergence of the calculated values upon
further expansion also reveals the optimum
accuracy of the form of equation used.
However, it should not be overlooked how
accurate predictions were obtained for some
ionic liquids where the use of the model
derived may be feasible.
50 Generalized Pitzer Correlation for Density Calculations of Ionic Liquids
REFERENCES
1. Canales, R.I., Brennecke, J.F. (2016).
“Comparison of Ionic Liquids to
Conventional Organic Solvents for
Extraction of Aromatics from Aliphatics,”
J. Chem. Eng. Data, 61(5), 1685-1699.
2. Chang, C.H-., Zhao, X. (1990). “A new
generalized equation for predicting
volumes of compressed liquids,” Fluid
Phase Equilib., 58, 231-238.
3. Delgado-Mellado, N., Ayuso, M., García,
J., Rodríguez, F. (2019). “Developing a
new correlation for the aliphatic and
aromatic hydrocarbon diffusion
coefficients at infinite dilution in ionic
liquids,” J. Mol. Liq., 296, 111857.
4. Hankinson, R.W., Thomson, G.H. (1979).
“A new correlation for saturated densities
of liquids and their mixtures,” AIChE J., 25,
653-663.
5. IUPAC Ionic Liquids Database (ILThermo),
N. S. R. D. Available online:
https://ilthermo.boulder.nist.gov/.
6. Khashayar, N., Mahmood, M. (1998). “A
saturated liquid density equation in
conjunction with the Predictive-Soave-
Redlich-Kwong equation of state for
pure refrigerants and LNG
multicomponent systems,” Fluid Phase
Equilib., 153, 231.
7. Keshavarz, M.H., Pouretedal, H.R., and
Saberi, E. (2016). “A simple method for
prediction of density of ionic liquids
through their molecular structure,” J. Mol.
Liq., 216, 732-737.
8. Mesbah, M. and Bahadori, A. (2016).
Equation of State. In A. Bahadori (Ed.),
Equation of State. Fluid Phase Behavior
for Conventional and Unconventional Oil
and Gas Reservoirs (pp. 99-101). Oxford:
Gulf Professional Publishing.
9. Nasrifar, K. and Moshifeghian, M. (1998).
“A saturated liquid density equation in
conjunction with the predictive-Soave-
Redlich-Kwong equation of state for
pure refrigerants and LNG
multicomponent systems,” Fluid Phase
Equilib., 153, 231-242.
10. Onnes, H.K. (1902). “Expression of the
equation of state of gases and liquids by
means of series,” In: KNAW, Proceedings.
11. Patel, N.K., Joshipura, M.H. (2013).
“Generalized PSRK model for prediction
of liquid density of ionic liquids,”
Procedia Eng., 51, 386-394.
12. Pitzer, K.S., Lippmann, D.Z., Curl Jr., R.,
Huggins, C.M., and Petersen, D.E. (1955).
The volumetric and thermodynamic
properties of fluids. II. Compressibility
factor, vapor pressure and entropy of
vaporization 1. J. Am. Chem. Soc., 77 (13),
3433e3440.
13. Privat, R., Privat, Y., and Jaubert, J-.N.
(2009). “Can cubic equations of state be
recast in the virial form?,” Fluid Phase
Equilib., 282, 38 – 50.
14. Rackett, H.G. (1970). “Equation of state
for saturated liquids,” J. Chem. Eng. Data.,
15 (4), 514-517.
15. Roshan, N., and Ghader, S. (2012).
“Developing models for correlating ionic
liquids density : Part 1 – Density at 0.1
MPa,” Fluid Phase Equilib., 331, 33-47.
16. Roshan, N., and Ghader, S. (2013).
“Developing models for correlating ionic
liquids density : Part 2 – Density at high
pressures,” Fluid Phase Equilib., 358, 172-
188.
17. Rostami, A., Baghban, A., Shirazian, S.
(2019). “On the evaluation of density of
ionic liquids: towards a comparative
study,” Chem. Eng. Res. Des., 147, 648-
663.
18. Shariati, A., Ashrafmansouri, S.-S., Osbuei,
M.H., and Hooshdaran, B. (2013). “Critical
J.P.E. Nuqui, R. Damalerio, S. Meas, S. Yem, A. N. Soriano 51
properties and acentric factors of ionic
liquids,” Korean J. Chem. Eng., 30(1), 187-
193.
19. Thomson, G.H., Brobst, K.R., Hankinson,
R.W. (1982). “An improved correlation for
densities of compressed liquids and
liquid mixtures,” AIChE J., 28, 671-676.
20. Valderrama, J.O., Sanga, W.W., and Lazzús,
J.A. (2008). “Critical properties, normal
boiling temperature, and acentric factor
of another ionic liquids,” Ind. Eng. Chem.
Res., 47, 1318-1330.
21. Valderrama, J.O., Reátegui, A., Rojas, R.E.
(2009). “Density of Ionic Liquids Using
Group Contribution and Artificial Neural
Networks,” Ind. Eng. Chem. Res., 48,
3254-3259.
22. Yamada, T., Gunn, R.D. (1973). “Saturated
liquid molar volumes. Rackett equation,”
J. Chem. Eng. Data., 18, 234-236.
23. Yen, L.C., Woods, S.S. (1966). “A
generalized equation for computer
calculation of liquid densities,” AIChE J.,
12, 95-99.
24. Zarei, A., Nasrifar, K., and Partoon, B.
(2019). “Generalized correlations for
calculating the density of ionic liquids at
0.1 MPa and higher pressures,” J. Mol. Liq.,
282, 131-141.
Zohuri, B. (2018). Chapter 2 – Properties
of Pure Substances. In Zohuri, B. (Ed.).
Physics of Cryogenics (pp. 53-79). doi:
10.1016/B978-0-12-814519-7.00002-1.