general directorate of highways traffic safety … · general directorate of highways traffic...
TRANSCRIPT
GENERAL DIRECTORATE OF HIGHWAYS
TRAFFIC SAFETY PROJECT
METHODS AND VALUES FOR APPRAISAL
OF TRAFFIC SAFETY IMPROVEMENTS
April 2001
SweRoad TRAFFIC SAFETY PROJECT
Ankara Traffic Safety Consultancy Services
Methods and Values for Appraisal of April 2001
Traffic Safety Improvements
1
Foreword
The purpose of this report is mainly to propose a suitable method for appraisal of minor road
safety improvements, mainly black spot projects, and monetary values for estimated accident
and casualty reductions.
It must be observed that the report represents only the beginning of the work leading up to
more definite methods and values. It gives, however, some indications both for the short-term
and long-term perspective. We hope the report will give some inspiration for future work.
The author of the report is Mr. Carsten Sachse, SweRoad’s specialist on transport economics.
Ankara, April 2001
Karl-Olov Hedman
Team Leader
SweRoad TRAFFIC SAFETY PROJECT
Ankara Traffic Safety Consultancy Services
Methods and Values for Appraisal 2/38 April 2001
of Traffic Safety Improvements
Contents Page
Foreword 1
Summary 3
1 Introduction 5
2 Appraisal methods 5
2.1 Basic methodology _______________________________________________ 5
2.2 Present methodology _____________________________________________ 10
2.3 Methods for prioritising __________________________________________ 10
2.4 Conclusions ____________________________________________________ 12
3 Accident values 13
3.1 Background ____________________________________________________ 13
3.2 Present accident values ___________________________________________ 16
3.3 Accident data ___________________________________________________ 17
3.4 Suggested improvements of accident values ___________________________ 20
3.5 Willingness-to-pay study, example from Sweden _______________________ 29
3.6 Conclusions ____________________________________________________ 31
4 Other values 31
4.1 Road maintenance costs ___________________________________________ 31
4.2 Vehicle operating costs ___________________________________________ 31
4.3 Time values ____________________________________________________ 31
4.4 Other missing values _____________________________________________ 34
5 Conclusions 35
6 References 37
7 Appendices 38
SweRoad TRAFFIC SAFETY PROJECT
Ankara Traffic Safety Consultancy Services
Methods and Values for Appraisal 3/38 April 2001
of Traffic Safety Improvements
Summary
The purpose of this report is to propose a method that can be used for prioritising traffic
safety measures. In order to do this, different methods of calculating benefits and how to
value effects are studied.
The present calculations of consequences of safety measures used at the Karayolları Genel
Müdürlüğü (KGM) are in principle correct. However, smaller adjustment of calculation
methods and how the effects are being valued can improve the quality. By using the
available statistics more extensively and diversified, combined with using international
experiences, improvements can be made. At present Benefit Cost Ratio, Net Present Value
and Internal Rate of Return are calculated. Benefit Cost Ratio is proposed as the most
appropriate method to use for appraising black spot improvements.
The most important issue in prioritising safety measures, is to estimate and maximize the
Benefit Cost Ratio – which normally means that smaller, more efficient solutions will be
prioritised first. This will also maximize the total Net Present Value.
All calculations are made using a discount rate of 15 %, which is rather high. A high
discount rate means that the length of the economic life period for a project will have a
limited effect. This means that projects with a shorter economic life have an advantage
against larger projects with longer life expectancies. A higher discount rate also means that
the traffic and economic growth will have a smaller impact
We propose that the existing accident costs are diversified into rural and urban values, as
well as for degree of severity. The official police and Gendarme road traffic fatality
statistics are being corrected for those injured in a traffic accident that later die in hospital
using information from the Ministry of Health. The correction means that the fatalities
reported by police and Gendarme should be multiplied by a factor of 1.51, and that the
number of injuries reported should be multiplied by a factor of 0.97.
Values of risk of getting killed or injured in a road accident are suggested, but since no
Turkish values or surveys concerning this exist, we estimate a Turkish risk value using the
Swedish values corrected with the relation of GNPs in Turkey and Sweden. This gives a
risk value of TL 107,000 million for a fatality and TL 3,700 million for an injury, both at
the price level of 1999.
Introducing a risk value means that the consumption should be deducted from the loss of
production being the result of an injury or fatality. The individual consumption is
estimated to be about 75 % of a persons production. The net production loss for an average
fatality is estimated to be TL 3,430 million (1999), and for an average injury to TL 1,325
million (1999).
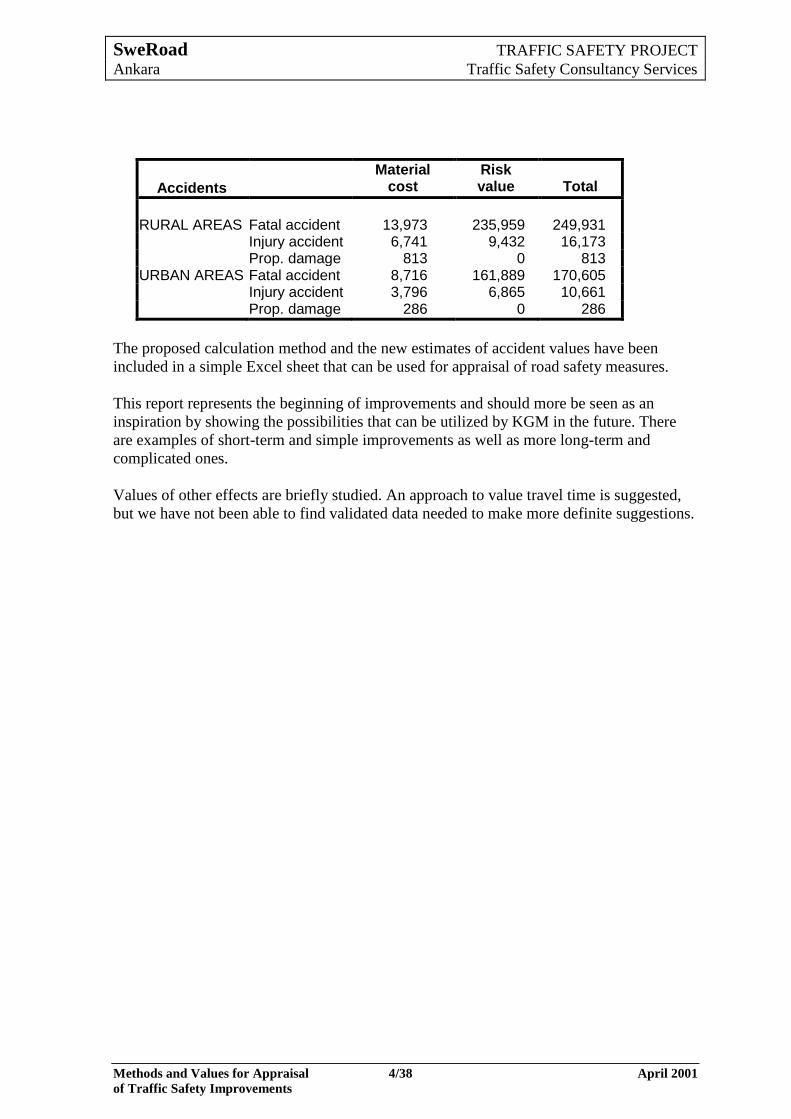
The results of the new approach to value accidents are shown in the table on the next page,
all values in the price level of 1999.
SweRoad TRAFFIC SAFETY PROJECT
Ankara Traffic Safety Consultancy Services
Methods and Values for Appraisal 4/38 April 2001
of Traffic Safety Improvements
Accidents
Material cost
Risk value
Total
RURAL AREAS
Fatal accident
13,973
235,959
249,931
Injury accident 6,741 9,432 16,173 Prop. damage 813 0 813
URBAN AREAS Fatal accident 8,716 161,889 170,605 Injury accident 3,796 6,865 10,661 Prop. damage 286 0 286
The proposed calculation method and the new estimates of accident values have been
included in a simple Excel sheet that can be used for appraisal of road safety measures.
This report represents the beginning of improvements and should more be seen as an
inspiration by showing the possibilities that can be utilized by KGM in the future. There
are examples of short-term and simple improvements as well as more long-term and
complicated ones.
Values of other effects are briefly studied. An approach to value travel time is suggested,
but we have not been able to find validated data needed to make more definite suggestions.
SweRoad TRAFFIC SAFETY PROJECT
Ankara Traffic Safety Consultancy Services
Methods and Values for Appraisal 5/38 April 2001
of Traffic Safety Improvements
1 Introduction
Most investments are made because it has been estimated that they will yield larger
benefits than costs. There are different methods to calculate this, and they vary between
private and public investments.
For public investments, cost-benefit calculations with socio-economic monetary values and
costs are normally used. The aim is to calculate the net economic benefit to the nation and
its inhabitants, and to achieve an economic optimisation for project investment decisions.
Costs and benefits are appraised by how they accrue to the economy as a whole.
The general steps leading to a cost-benefit analysis (CBA) are:
1. Identify the goals
2. Specify measures to reach the goals
3. Identify the effects of the measures
4. Value the relevant effects
5. Make a cost-benefit analysis
To value the effects you can use market price, willingness to pay or substitution prices.
If comparing investments with one dominating effect (e.g. road safety), you can calculate
the effectiveness per unit, hence avoiding setting a monetary value.
At present The Karayolları Genel Müdürlüğü (KGM) calculates Internal Rate of Return
(IRR), Net Present Value (NPV) and Benefit-Cost Ratio (BCR) for safety projects using
monetary values for fatalities, injuries and property damage.
Within KGM there is also a method to calculate costs and benefits of other types of road
investment projects. Besides costs of accidents, this method includes vehicle operating
costs (from HDM III, Highway Design and Maintenance model) and costs of road
maintenance. For some projects, a multi-criteria analysis is made together with the CBA.
The multi-criteria model used is called the Smart-model.
2 Appraisal methods
2.1 Basic methodology
The purpose of appraisals is to select the road measures, which give the highest return of
positive effects. This can be done by calculating single effects, weighted multiple effects,
using economic values for different effects, or multi-criteria analysis. Using:
single effects means that you calculate one effect only and do not consider other
effects,
weighted multiple effects means that you calculate each effect separately and then
weigh them together in order to get one single value and/or unit,
SweRoad TRAFFIC SAFETY PROJECT
Ankara Traffic Safety Consultancy Services
Methods and Values for Appraisal 6/38 April 2001
of Traffic Safety Improvements
economic values means that you give a monetary value to each of the calculated
effects, which then can be added up,
multi-criteria analysis means that you use some kind of non-monetary grading
system for each effect, which in some cases can be added up to one value.
The economic calculation methods (or indicators) mostly used are:
Net Present Value (NPV)
Internal Rate of Return (IRR)
Benefit/Cost Ratio (BCR)
Net Benefit/Cost Ratio (NBCR)
A very thorough or full cost-benefit analysis should theoretically include all costs and
benefits for society. For road investments projects, the most common are:
Accidents costs
Travel time cost
Vehicle operating costs
Emission costs
Other environmental costs
Investment costs
Maintenance cost
In addition, there might be other interesting effects, such as market effects. These are,
however, often very difficult to calculate. It is also disputed whether these effects are
newly generated or mainly a change of distribution or location of available effects in
society as a whole.
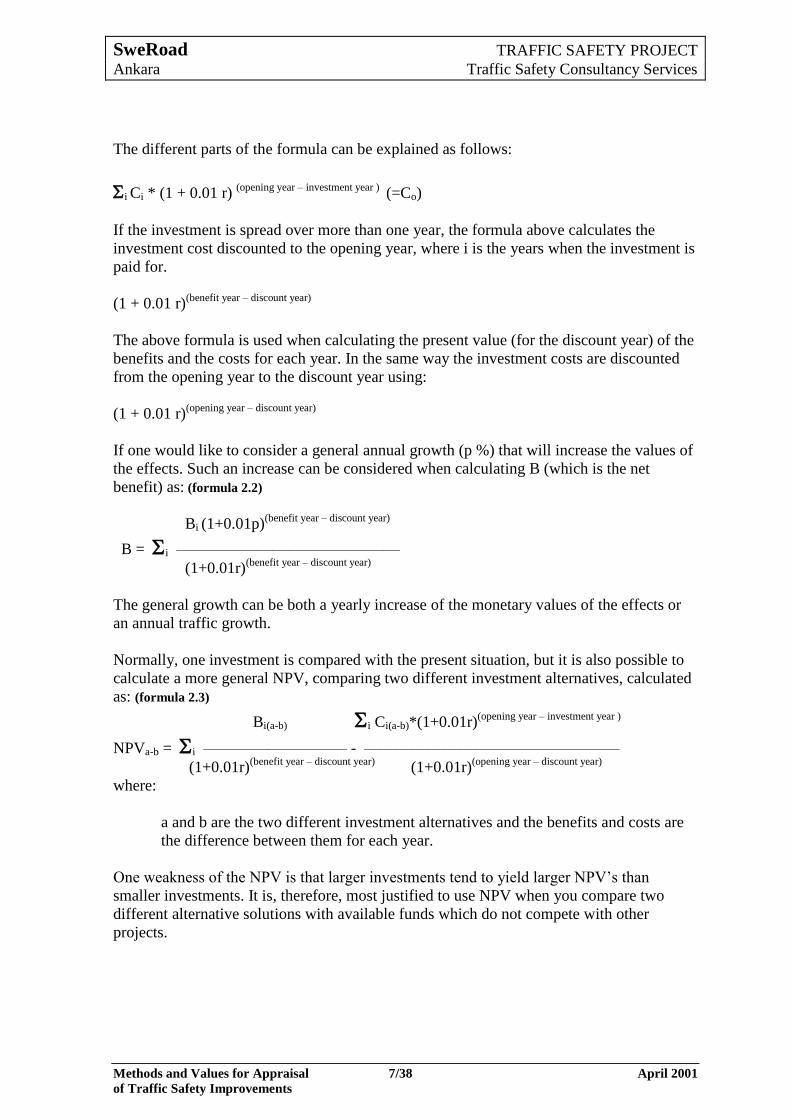
NPV is the benefits of a project minus its costs, both for the duration of the economic
lifetime of the project, and can be calculated according to the following: (formula 2.1)
Bi i Ci * (1+0.01r) (opening year – investment year )
NPV = i ——————— - ————————————————
(1+0.01r)(benefit year – discount year)
(1+0.01r)(opening year – discount year)
where:
Bi = the value of the net benefits year i
r = discount rate in percent (%)
Ci = investment costs year i
i = year
Discount year: all effects are discounted to this year, so different projects can be
compared even if the projects are opened in different years.
Opening year: the year, in which the project is opened for use.
Investment years: the years during which the investment is paid for.
SweRoad TRAFFIC SAFETY PROJECT
Ankara Traffic Safety Consultancy Services
Methods and Values for Appraisal 7/38 April 2001
of Traffic Safety Improvements
The different parts of the formula can be explained as follows:
i Ci * (1 + 0.01 r) (opening year – investment year )
(=Co)
If the investment is spread over more than one year, the formula above calculates the
investment cost discounted to the opening year, where i is the years when the investment is
paid for.
(1 + 0.01 r)(benefit year – discount year)
The above formula is used when calculating the present value (for the discount year) of the
benefits and the costs for each year. In the same way the investment costs are discounted
from the opening year to the discount year using:
(1 + 0.01 r)(opening year – discount year)
If one would like to consider a general annual growth (p %) that will increase the values of
the effects. Such an increase can be considered when calculating B (which is the net
benefit) as: (formula 2.2)
Bi (1+0.01p)(benefit year – discount year)
B = i ——————————————
(1+0.01r)(benefit year – discount year)
The general growth can be both a yearly increase of the monetary values of the effects or
an annual traffic growth.
Normally, one investment is compared with the present situation, but it is also possible to
calculate a more general NPV, comparing two different investment alternatives, calculated
as: (formula 2.3)
Bi(a-b) i Ci(a-b)*(1+0.01r)(opening year – investment year )
NPVa-b = i ————————— - ————————————————
(1+0.01r)(benefit year – discount year)
(1+0.01r)(opening year – discount year)
where:
a and b are the two different investment alternatives and the benefits and costs are
the difference between them for each year.
One weakness of the NPV is that larger investments tend to yield larger NPV’s than
smaller investments. It is, therefore, most justified to use NPV when you compare two
different alternative solutions with available funds which do not compete with other
projects.
SweRoad TRAFFIC SAFETY PROJECT
Ankara Traffic Safety Consultancy Services
Methods and Values for Appraisal 8/38 April 2001
of Traffic Safety Improvements
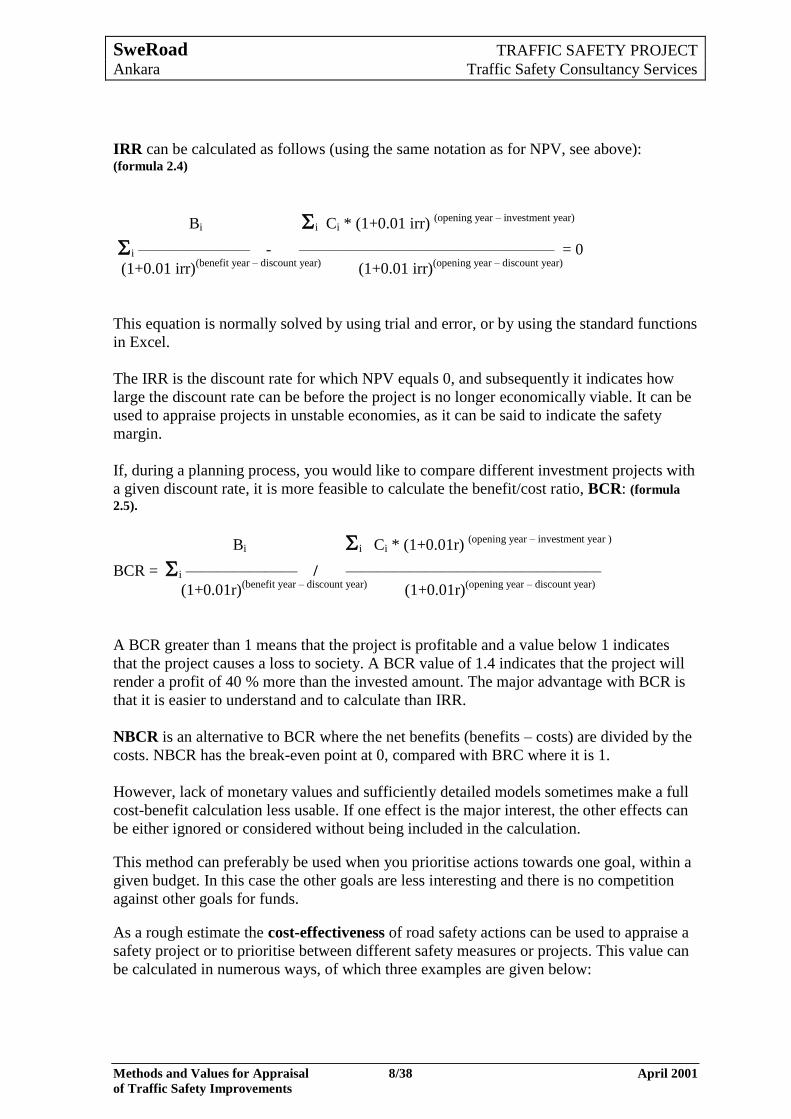
IRR can be calculated as follows (using the same notation as for NPV, see above): (formula 2.4)
Bi i Ci * (1+0.01 irr) (opening year – investment year)
i ——————— - ———————————————— = 0
(1+0.01 irr)(benefit year – discount year)
(1+0.01 irr)(opening year – discount year)
This equation is normally solved by using trial and error, or by using the standard functions
in Excel.
The IRR is the discount rate for which NPV equals 0, and subsequently it indicates how
large the discount rate can be before the project is no longer economically viable. It can be
used to appraise projects in unstable economies, as it can be said to indicate the safety
margin.
If, during a planning process, you would like to compare different investment projects with
a given discount rate, it is more feasible to calculate the benefit/cost ratio, BCR: (formula
2.5).
Bi i Ci * (1+0.01r) (opening year – investment year )
BCR = i ——————— / ————————————————
(1+0.01r)(benefit year – discount year)
(1+0.01r)(opening year – discount year)
A BCR greater than 1 means that the project is profitable and a value below 1 indicates
that the project causes a loss to society. A BCR value of 1.4 indicates that the project will
render a profit of 40 % more than the invested amount. The major advantage with BCR is
that it is easier to understand and to calculate than IRR.
NBCR is an alternative to BCR where the net benefits (benefits – costs) are divided by the
costs. NBCR has the break-even point at 0, compared with BRC where it is 1.
However, lack of monetary values and sufficiently detailed models sometimes make a full
cost-benefit calculation less usable. If one effect is the major interest, the other effects can
be either ignored or considered without being included in the calculation.
This method can preferably be used when you prioritise actions towards one goal, within a
given budget. In this case the other goals are less interesting and there is no competition
against other goals for funds.
As a rough estimate the cost-effectiveness of road safety actions can be used to appraise a
safety project or to prioritise between different safety measures or projects. This value can
be calculated in numerous ways, of which three examples are given below:
SweRoad TRAFFIC SAFETY PROJECT
Ankara Traffic Safety Consultancy Services
Methods and Values for Appraisal 9/38 April 2001
of Traffic Safety Improvements
1. Investment cost/Number of less fatalities during the first year: cost per reduced
number of killed persons.
2. Investment cost/Number of less accidents during the first year: cost per reduced
accidents.
3. Number of less fatalities + injuries/Discounted investment cost over the projects
lifetime: yearly cost per reduced fatality + injury over the projects lifetime.
If the investment consists of a measure which will result in a substantial yearly
maintenance cost, the present value of this cost can be added to the investment cost in 1-3
above.
However, it is normally considered to be most correct to calculate the relation between
benefits and costs. The net present value (NPV), internal rate of return (IRR) or
benefit/cost ratio (BCR) can be calculated in this case using the reduced accident costs as
the only benefit (e.g., due to calculation problems and lack of data) but considering the
investment cost and, when relevant, the maintenance cost. Another possibility is to use an
engineering estimate of how large the influence of the non-valued effects should be when
choosing between alternative solutions or prioritising between projects.
The discount rate used for calculations of costs and benefits is very important and has a
major influence on all results. At present, KGM uses 15 %, while some agencies use 12 %,
according to our information. Lowering from 15 % to 12 % would make an increase of the
benefits with more than 20 % (depending on the traffic growth) for a project with an
expected economic life period of 20 years.
A discount rate of 15 % is rather high and means that especially long-term investments are
more difficult to justify. High discount rates are mostly due to an uncertain future
economic development. Often, the Ministry of Finance in a country decides the discount
rate and normally there is no reason to use other values.
A higher discount rate means that a longer life period will have a smaller effect, hence
projects with shorter economic life periods have an advantage against larger projects with
longer life expectancies.
A higher discount rate also means that future traffic growth will have a smaller impact.
Normally, some kind of ―tax factor” needs to be added to the values to obtain the correct
results in a cost-benefit analysis. There are mainly two types of tax factors.
The first tax factor considers that all resources used have a value reflecting how much the
consumers are prepared to pay. Normally, goods that are purchased have a value added tax
(VAT). Therefore, all components in a cost-benefit analysis should include VAT. This tax
factor should also be used in Turkey, with a VAT on average estimated to 17 %.
Sometimes a second tax factor is used. This factor is normally referred to as ―marginal cost
of public funds‖. Marginal cost of public funds relates to the fact that government financed
investments are considered to imply an efficiency loss within the socio-economics, partly
because they compete against private investments (which often have a higher profit) and
SweRoad TRAFFIC SAFETY PROJECT
Ankara Traffic Safety Consultancy Services
Methods and Values for Appraisal 10/38 April 2001
of Traffic Safety Improvements
partly because they reduce the space for private consumption. It also normally covers that
an increase of tax revenue by the margin leads to a loss in welfare of the society. This tax
factor should be used for all activities financed over the state budget. Accordingly, all
public investments and maintenance, costs of government hospitals or health insurance
etc., should include this second tax factor. Setting this value, however, is a difficult task.
The presence and value of a second tax factor is dependant on the efficiency of the public
sector compared with the private. The existence of such a difference is not evident. The
other parts of the second tax factor are less disputed, but since the factor is difficult to
assess, it is recommended not to include this tax factor at present.
2.2 Present methodology
At present KGM uses different methods for calculation, one for road safety projects and
another for other road investments.
For road safety projects a cost-benefit analysis is made with the change in safety costs as
the only benefit. An Excel spread sheet is used to calculate the costs of accidents in a
situation where nothing is done and in the situation where a measure has been taken. Then,
the difference is the total benefit. Based on this, and by using the investment cost, NPV,
IRR and BCR are calculated for a given discount rate, traffic growth and appraisal period.
For other road investment projects, the procedure is very much the same, except that
vehicle operating costs and road maintenance costs are included in the calculations.
These calculations at present seem to have almost no impact on the prioritising of road
safety projects. Normally, the number of black spot projects are selected from severity and
other indices to an amount equal to the available budget. Sometimes two alternatives are
prepared, one high-cost alternative and one low-cost alternative. If the budget is high, the
high-cost alternative is chosen and if it is low, the low-cost alternative is selected. If the
budget only allows for some high and some low-cost alternatives, the selection of high-cost
solutions is often made by order of severity of the accidents. If an accident has received
special attention in media or aroused a political interest, this accident spot can sometimes
get high priority and more expensive measures are used than what is cost-effective.
2.3 Methods for prioritising
2.3.1 General methodology
Normally, the needs of measures are greater than the available means and therefore a
suitable balance must be struck between the needs and what can actually be implemented.
When doing this, the most positive effects from available funds should be attained.
Sometimes there are relevant reasons to diverge from the estimated ―optimal‖ order of
priority, but having a list with the measures prioritised after benefits and costs will make
the decision-maker aware of the cost of the diversion.
SweRoad TRAFFIC SAFETY PROJECT
Ankara Traffic Safety Consultancy Services
Methods and Values for Appraisal 11/38 April 2001
of Traffic Safety Improvements
There are many ways to prioritise, but only three will be described in the following:
1. After values in monetary terms / CBA
2. After non-monetary effects / Cost-effectiveness CEA
3. A combination of the two
2.3.2 Using cost-benefit analysis (CBA)
The different methods to calculate benefits from a road project have different use and
advantages. Looking at a total budget level, the NPV should be maximised, but looking at
project level, the BCR should be maximised in order to find the project that contributes
mostly to the NPV in relation to the investment cost. Hence it is recommended that BCR
should normally be used for prioritising of black spot improvements. The NPV gives the
highest total value of net benefits. If you prioritise according to NPV, you will often
prioritise large projects, because they tend to yield large net benefits even if the BCR is
low. Especially if there is a long list of projects with different alternatives, it becomes
difficult to optimise the NPV for the total list.
IRR and BCR give about the same order when projects and alternatives are being
prioritised. IRR is more difficult to understand. BCR is easier to grasp. If BCR is 1, the
benefits are equal to the costs. If BCR is 2 the benefits are twice as large as the costs. IRR
on the other hand, shows how high the discount rate can be without making the project
unprofitable. For large, single projects, where a financier needs to determine the risk of the
project, IRR can be useful. However, to prioritise between alternative measures or projects,
BCR is easier to understand.
When there are different alternatives for each site, it should be considered that low-cost
alternatives in most cases tend to give higher BCRs than high-cost alternatives. As there
normally are many black spots in need of funds for improvement, the leading principle
should be to use low-cost alternatives for all sites in order to be able to eliminate as many
black spots as possible. This principle will normally yield the highest total NPV within a
certain budget frame. The only case, when a more costly alternative should be used, is
when the marginal BCR for the more expensive alternative exceeds the BCR for the best
alternative use of funds for other sites.
2.3.3 Using cost-effectiveness analysis (CEA)
If traffic safety has a special budget there is no need to make a full cost-benefit analysis for
prioritising between safety measures and other investments.
Even if the primary goal of the safety budget is to reduce the number of accidents, injuries
and fatalities in road traffic, it is still of interest to society to make these measures efficient
not only concerning safety but also from all other aspects.
The problem when making a full cost-benefit analysis is that it requires monetary values
for at least all major effects. For Turkey, as mentioned before, there are values for safety,
vehicle operating costs and road maintenance. The major effects not valued at present are
travel time and environmental issues, such as emissions, noise and barrier effects. Setting
SweRoad TRAFFIC SAFETY PROJECT
Ankara Traffic Safety Consultancy Services
Methods and Values for Appraisal 12/38 April 2001
of Traffic Safety Improvements
values to emissions is normally a difficult task and some specialists argue that it is not even
possible. Environmental issues may be better dealt with using multi-criteria analysis. From
experiences in other countries, time value is one of the larger contributors to the total
valued effect in the cost-benefit analysis.
It would be a good long-term strategy, besides improving the existing values, to start using
values of time. However, in the shorter perspective it is probably sufficient to value the
safety effects when prioritising safety projects. The alternative to value the safety effects
would be to determine ―weighting‖ factors between accidents, property damage accidents,
accident with injuries/injured and accidents with fatalities/fatalities. This however, is very
close to a valuation in monetary terms.
Therefore, the present approach used by the KGM, calculating cost-benefit using values for
safety only, is the most suitable one in the short-term perspective. However, improvements
of the calculations and the values used should be made.
For cost-effectiveness the marginal effect may be used in a similar way as described under
2.3.2.
2.3.4 Analyze both monetary and non-monetary values
Normally, monetary values for all effects are not available. Even for important effects
values may be missing, simply because some effects are very difficult to value in monetary
terms. This does not mean that these effects should not be considered.
Very often when you intend to make a full cost-benefit analysis there will be effects that do
not have any monetary values. These effects can, together with the calculated BCR of the
valued effects, make a basis for a total appraisal of the project’s viability.
Another way is to use multi-criteria analysis in which you list all positive and negative
effects and assign some kind of non-monetary valuation scheme that may vary between
different effects.
2.4 Conclusions
We suggest that the present method used at KGM for black spots, that calculates the
benefit-cost ratio using only the costs of accidents and investments, is used until the valued
effects at least also include the value of time. If a safety measure leads to substantial yearly
maintenance costs, we recommend that the present value of this should also be included.
It should be considered to complement these calculations with the marginal benefit-cost
ratio. This should then be used when setting the priorities of the complete list of black-spot
measures and when there are alternative solutions for many sites. If BCR is strictly used
for prioritising, the need to use marginal BCR may not be worth the effort. It should then
be observed, however, that low-cost improvements tend to yield higher BCRs than more
expensive solutions.
SweRoad TRAFFIC SAFETY PROJECT
Ankara Traffic Safety Consultancy Services
Methods and Values for Appraisal 13/38 April 2001
of Traffic Safety Improvements
For other than traffic safety projects, it is also recommended that the present approach
used by KGM should be used (that is to calculate a benefit-cost ratio using as many valued
effects as available, together with multi-criteria analysis).
As KGM at present has the HDM-IV program, this can actually be used for some of these
calculations, if properly calibrated.
3 Accident values
3.1 Background
The costs of casualties can be divided into three types:
Direct costs
Indirect costs
Risk value
Direct and indirect costs are also referred to as material costs.
Direct costs Direct costs are costs actually paid by someone, such as:
Property damage costs, costs of repair of vehicles and other damages on private or
public property, such as road signs.
Hospital costs, the sum of costs of hospitalisation, other medical treatment instantly
and in the future as a result of an injury, medicine, other medical necessities, need for
help/care in the home and transport.
Administration costs, costs of insurance companies and costs over the state budget
for police and courts that can be referred to traffic accidents.
Indirect costs Indirect costs are costs not directly paid by anyone. The indirect costs used in relation to
accidents are loss of production, or in the case that a risk value is being used, the loss of
net production (gross production minus consumption).
The production loss is the value of the amount of goods and services that a person would
have been able to produce if that person had not experienced an injury or fatal accident.
The value is estimated as the salary of that person plus the employer’s additional cost if
any (employer’s tax on the salary to the person, costs of social and health insurance,
retirement costs etc., paid by the employer on top of the salary).
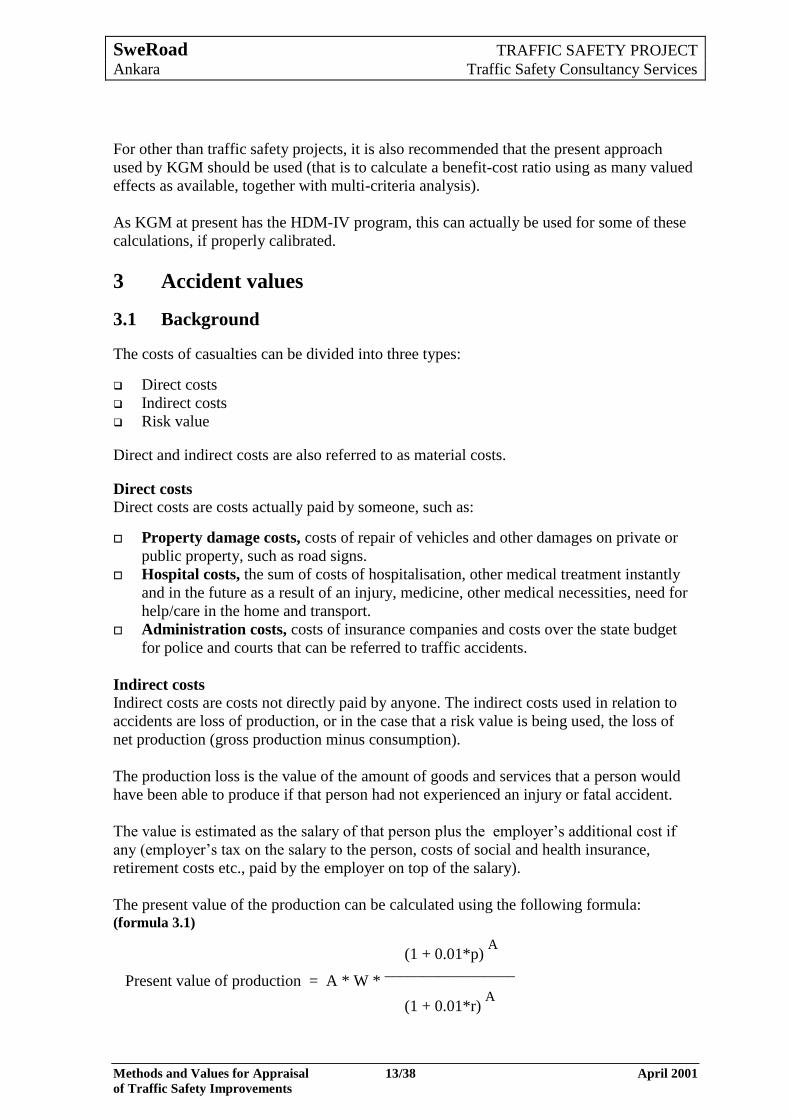
The present value of the production can be calculated using the following formula: (formula 3.1)
(1 + 0.01*p) A
Present value of production = A * W * _________________
(1 + 0.01*r) A
SweRoad TRAFFIC SAFETY PROJECT
Ankara Traffic Safety Consultancy Services
Methods and Values for Appraisal 14/38 April 2001
of Traffic Safety Improvements
where:
A = average years of production lost due to the fatal accident
W = average annual income (incl. employers additional costs)
p = expected yearly average production increase in the general economy (%)
r = discount rate (%)
The GNP per capita can substitute the average income. If you use the average income from
statistics, this does not always consider unemployment. If you use GNP per capita, this is
not a problem.
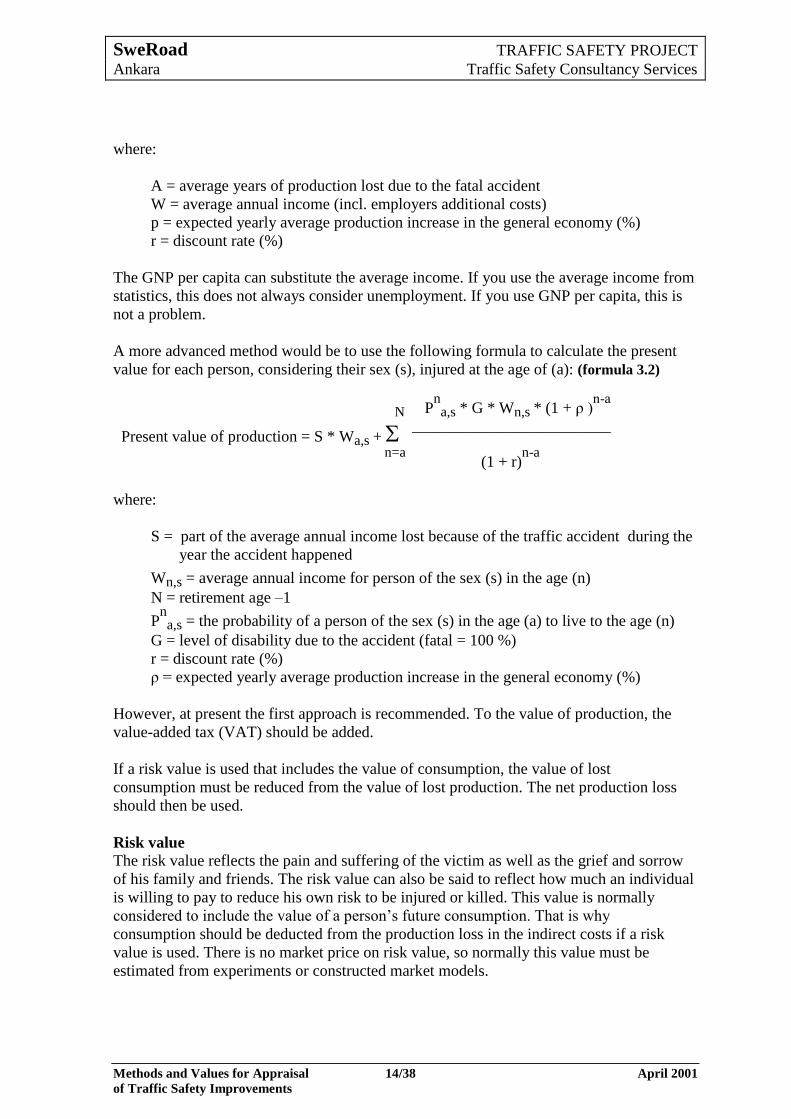
A more advanced method would be to use the following formula to calculate the present
value for each person, considering their sex (s), injured at the age of (a): (formula 3.2)
N Pna,s * G * Wn,s * (1 + ρ )
n-a
Present value of production = S * Wa,s + __________________________
n=a
(1 + r)n-a
where:
S = part of the average annual income lost because of the traffic accident during the
year the accident happened
Wn,s = average annual income for person of the sex (s) in the age (n)
N = retirement age –1
Pna,s = the probability of a person of the sex (s) in the age (a) to live to the age (n)
G = level of disability due to the accident (fatal = 100 %)
r = discount rate (%)
ρ = expected yearly average production increase in the general economy (%)
However, at present the first approach is recommended. To the value of production, the
value-added tax (VAT) should be added.
If a risk value is used that includes the value of consumption, the value of lost
consumption must be reduced from the value of lost production. The net production loss
should then be used.
Risk value
The risk value reflects the pain and suffering of the victim as well as the grief and sorrow
of his family and friends. The risk value can also be said to reflect how much an individual
is willing to pay to reduce his own risk to be injured or killed. This value is normally
considered to include the value of a person’s future consumption. That is why
consumption should be deducted from the production loss in the indirect costs if a risk
value is used. There is no market price on risk value, so normally this value must be
estimated from experiments or constructed market models.
SweRoad TRAFFIC SAFETY PROJECT
Ankara Traffic Safety Consultancy Services
Methods and Values for Appraisal 15/38 April 2001
of Traffic Safety Improvements
There are different methods to estimate the value of risk reduction, direct and indirect
ones. A direct estimate is to use a stated preference study, that is, to ask individuals about
their willingness to pay for a risk reduction.
An indirect estimate is to use revealed preferences, which means that you study how
people actually behave and then transform this behaviour to an estimated value. The
revealed preference approach is to value trade-offs, for example, how people accept wage
compensation for risky jobs or how much a company is prepared to pay for improved
safety for its workers. The argument against this technique is that risky jobs attract a
certain type of people who like to take risks, or that some people may have limited work
opportunities and have no other choice than to accept a risky job, without getting fully
compensated. Similarly you can look at how people insure their lives, but this, however,
does not only indicate how people value their lives, but more how much they can afford to
insure themselves and how much other people are depending on their income.
Another indirect estimate is to use implicit values. For example, when a Government takes
a decision to reduce a risk it will implicitly value the effects. Hopefully the Government is
aware of the cost this decision implies. This method, however, is normally considered to
be imprecise.
Some of the mostly used methods are:
Court decisions
Compensation ruled by a court could be used as a value for pain and grief. This value,
however, is depending on the expected future incomes and the skill of the lawyer.
Health index approach
This method is based on the relation of health to quality of life. Non-fatal injury
accidents are valued as weights/fractions of fatal accidents. The ―value of life‖ is set
using the relations between different degrees of injury.
Human capital approach
This method is purely based on future income losses and costs of health care for
accidents’ victims. To value the potential reduction in health care costs as a result of
safety measures, an approach called cost-of-illness is used. This approach should be
combined with willingness-to-pay, since no values of the benefits are included in the
human capital calculations.
Willingness-to-pay (WTP)
The value of increased safety is determined by how much individuals are prepared to
pay for small improvements of their safety, or demands in compensation, to increase
the risks. WTP-studies are based on observations of individual trade-offs between
income and risk, or by questioning individuals about their willingness to pay for
improvements. Also collective, for example political, decisions can be used.
WTP is the most used method and also considered the most relevant among experts.
SweRoad TRAFFIC SAFETY PROJECT
Ankara Traffic Safety Consultancy Services
Methods and Values for Appraisal 16/38 April 2001
of Traffic Safety Improvements
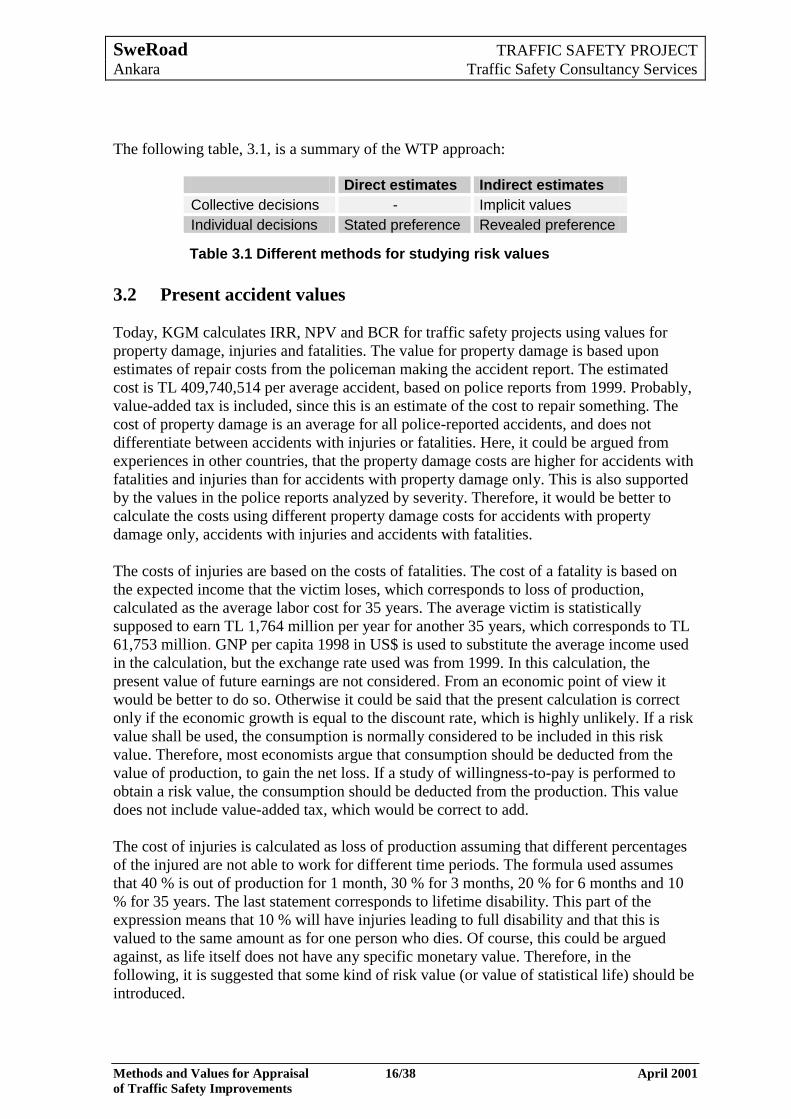
The following table, 3.1, is a summary of the WTP approach:
Direct estimates Indirect estimates
Collective decisions - Implicit values
Individual decisions Stated preference Revealed preference
Table 3.1 Different methods for studying risk values
3.2 Present accident values
Today, KGM calculates IRR, NPV and BCR for traffic safety projects using values for
property damage, injuries and fatalities. The value for property damage is based upon
estimates of repair costs from the policeman making the accident report. The estimated
cost is TL 409,740,514 per average accident, based on police reports from 1999. Probably,
value-added tax is included, since this is an estimate of the cost to repair something. The
cost of property damage is an average for all police-reported accidents, and does not
differentiate between accidents with injuries or fatalities. Here, it could be argued from
experiences in other countries, that the property damage costs are higher for accidents with
fatalities and injuries than for accidents with property damage only. This is also supported
by the values in the police reports analyzed by severity. Therefore, it would be better to
calculate the costs using different property damage costs for accidents with property
damage only, accidents with injuries and accidents with fatalities.
The costs of injuries are based on the costs of fatalities. The cost of a fatality is based on
the expected income that the victim loses, which corresponds to loss of production,
calculated as the average labor cost for 35 years. The average victim is statistically
supposed to earn TL 1,764 million per year for another 35 years, which corresponds to TL
61,753 million. GNP per capita 1998 in US$ is used to substitute the average income used
in the calculation, but the exchange rate used was from 1999. In this calculation, the
present value of future earnings are not considered. From an economic point of view it
would be better to do so. Otherwise it could be said that the present calculation is correct
only if the economic growth is equal to the discount rate, which is highly unlikely. If a risk
value shall be used, the consumption is normally considered to be included in this risk
value. Therefore, most economists argue that consumption should be deducted from the
value of production, to gain the net loss. If a study of willingness-to-pay is performed to
obtain a risk value, the consumption should be deducted from the production. This value
does not include value-added tax, which would be correct to add.
The cost of injuries is calculated as loss of production assuming that different percentages
of the injured are not able to work for different time periods. The formula used assumes
that 40 % is out of production for 1 month, 30 % for 3 months, 20 % for 6 months and 10
% for 35 years. The last statement corresponds to lifetime disability. This part of the
expression means that 10 % will have injuries leading to full disability and that this is
valued to the same amount as for one person who dies. Of course, this could be argued
against, as life itself does not have any specific monetary value. Therefore, in the
following, it is suggested that some kind of risk value (or value of statistical life) should be
introduced.
SweRoad TRAFFIC SAFETY PROJECT
Ankara Traffic Safety Consultancy Services
Methods and Values for Appraisal 17/38 April 2001
of Traffic Safety Improvements
When calculating the value of production loss for injuries, the same error is made as when
calculating the loss of production after a fatal accident, that is the present value is not
considered. In this case it only influences 10 % of the value. The source for the
percentages for how long victims are out of production is not known. But since no other
data is available and these percentages seem to be reasonable (although somewhat high
compared with other countries), we suggest that they should be used for the present. The
production is calculated as GNP per capita as used above.
3.3 Accident data
An important source to accident and casualty valuation is the available accident statistics.
But, as in most statistics there are uncertainties. Some of the major question marks are:
To which extent are accidents reported to the police?
How well can the damages and injuries be estimated by the reporting policeman?
How will the statistics be corrected for injured that later die in hospital?
How do statistics account for those who die while being transported to hospital?
The police (EGM) register accidents in a database. Since the last quarter of 1997 the
Gendarme reports accidents on a road network decided by each province, mostly non-
government rural roads. The police database contains most accidents, though the
Gendarme part, after the change in 1997, cannot be neglected. In 1998, the Gendarme
reported about 4 % of the total accidents. These 4 % contained about 20 % of the fatal
accidents and almost 20 % of the fatalities. Since Gendarme reported accidents are most
similar to the police reported accidents for rural areas, it could be mentioned that the
corresponding figures for these in 1998 were 15 % of the total, 45 % of the fatal accidents
and 51 % of the fatalities.
The accident report situation is somewhat complex. Gendarme have officially only
reported accidents since the last quarter of 1997, as mentioned above, and entered the data
in an accident database (in a similar way as the police do) only since the beginning of
1999. The area from which the police respectively the Gendarme reports accidents varies
between provinces and may not always be completely known by all.
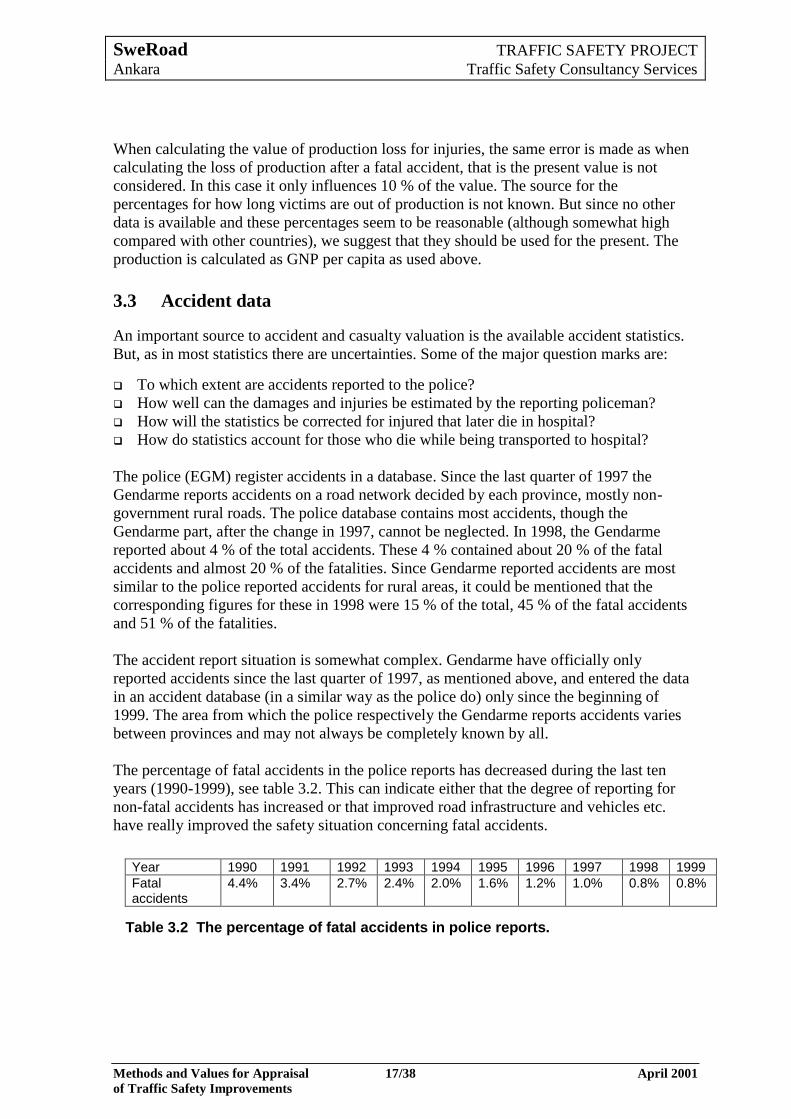
The percentage of fatal accidents in the police reports has decreased during the last ten
years (1990-1999), see table 3.2. This can indicate either that the degree of reporting for
non-fatal accidents has increased or that improved road infrastructure and vehicles etc.
have really improved the safety situation concerning fatal accidents.
Year 1990 1991 1992 1993 1994 1995 1996 1997 1998 1999
Fatal accidents
4.4% 3.4% 2.7% 2.4% 2.0% 1.6% 1.2% 1.0% 0.8% 0.8%
Table 3.2 The percentage of fatal accidents in police reports.
SweRoad TRAFFIC SAFETY PROJECT
Ankara Traffic Safety Consultancy Services
Methods and Values for Appraisal 18/38 April 2001
of Traffic Safety Improvements
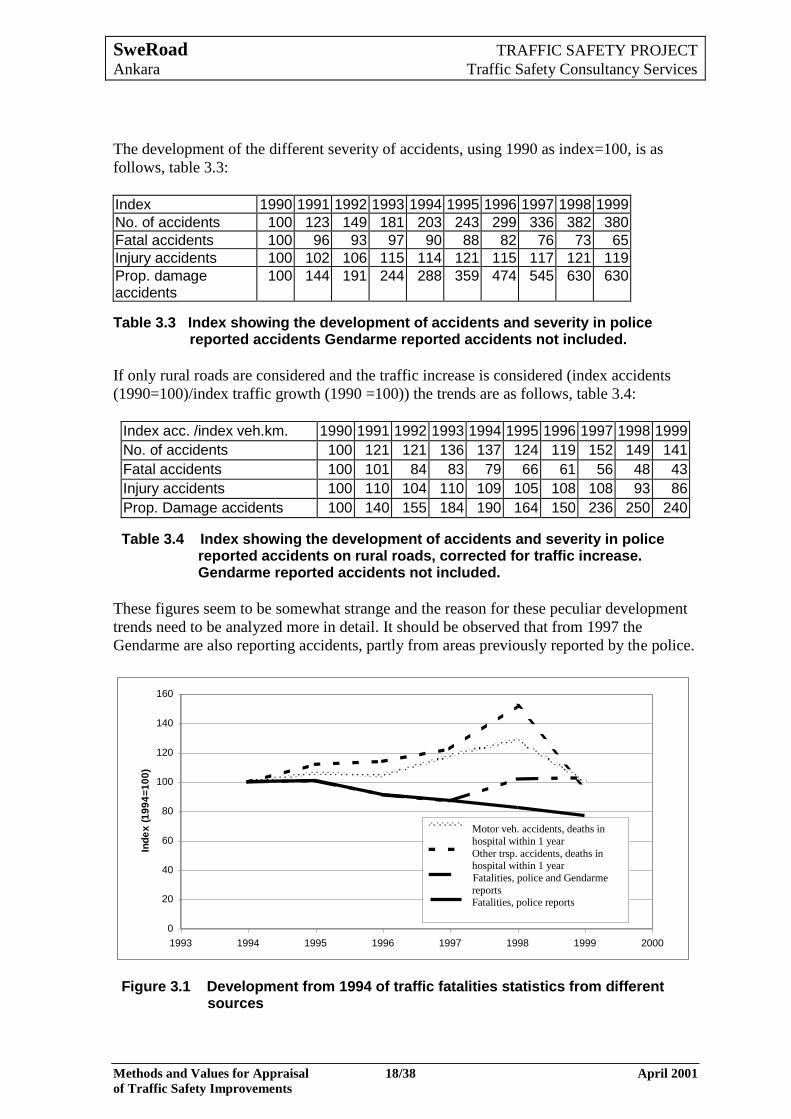
The development of the different severity of accidents, using 1990 as index=100, is as
follows, table 3.3:
Index 1990 1991 1992 1993 1994 1995 1996 1997 1998 1999
No. of accidents 100 123 149 181 203 243 299 336 382 380
Fatal accidents 100 96 93 97 90 88 82 76 73 65
Injury accidents 100 102 106 115 114 121 115 117 121 119
Prop. damage accidents
100 144 191 244 288 359 474 545 630 630
Table 3.3 Index showing the development of accidents and severity in police reported accidents Gendarme reported accidents not included.
If only rural roads are considered and the traffic increase is considered (index accidents
(1990=100)/index traffic growth (1990 =100)) the trends are as follows, table 3.4:
Index acc. /index veh.km. 1990 1991 1992 1993 1994 1995 1996 1997 1998 1999
No. of accidents 100 121 121 136 137 124 119 152 149 141
Fatal accidents 100 101 84 83 79 66 61 56 48 43
Injury accidents 100 110 104 110 109 105 108 108 93 86
Prop. Damage accidents 100 140 155 184 190 164 150 236 250 240
Table 3.4 Index showing the development of accidents and severity in police reported accidents on rural roads, corrected for traffic increase. Gendarme reported accidents not included.
These figures seem to be somewhat strange and the reason for these peculiar development
trends need to be analyzed more in detail. It should be observed that from 1997 the
Gendarme are also reporting accidents, partly from areas previously reported by the police.
0
20
40
60
80
100
120
140
160
1993 1994 1995 1996 1997 1998 1999 2000
Ind
ex
(1
99
4=
10
0)
Motor veh accidents, killed inhospital within 1 yearOther trsp accidents, killed inhospital within 1 yearFatalities, police andjandarma reportsFatalities, police reports
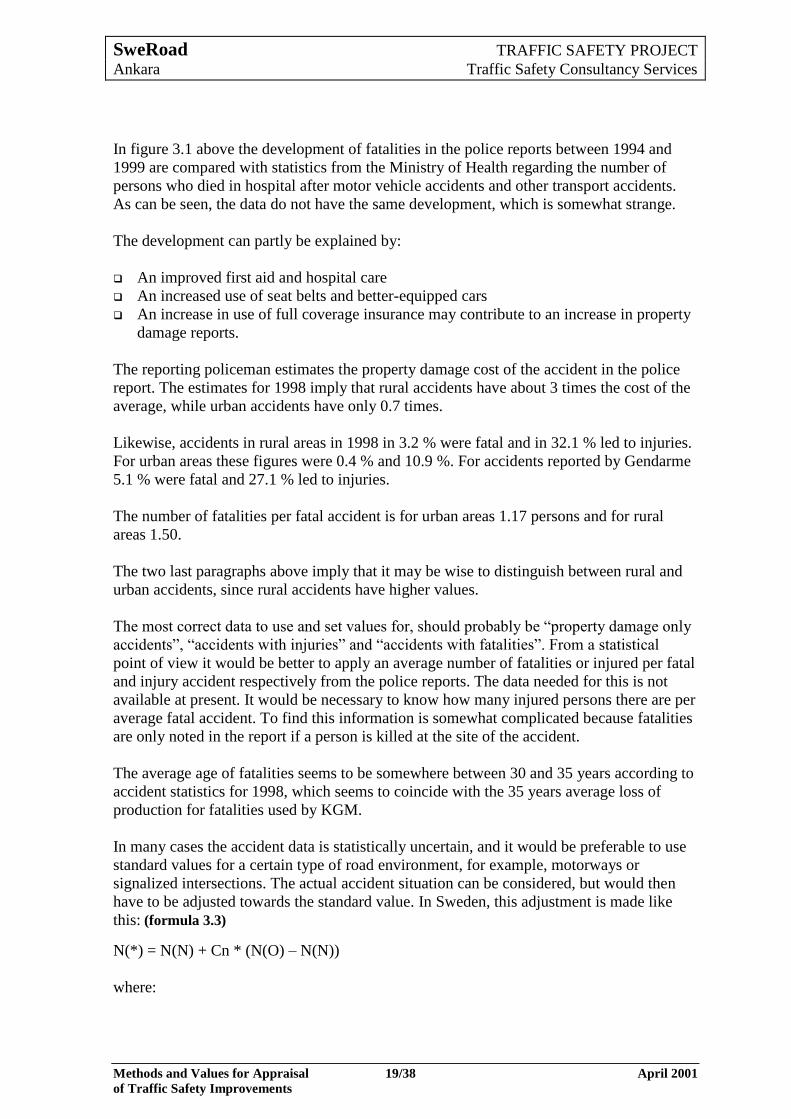
Figure 3.1 Development from 1994 of traffic fatalities statistics from different sources
Motor veh. accidents, deaths in
hospital within 1 year
Other trsp. accidents, deaths in hospital within 1 year
Fatalities, police and Gendarme
reports Fatalities, police reports
SweRoad TRAFFIC SAFETY PROJECT
Ankara Traffic Safety Consultancy Services
Methods and Values for Appraisal 19/38 April 2001
of Traffic Safety Improvements
In figure 3.1 above the development of fatalities in the police reports between 1994 and
1999 are compared with statistics from the Ministry of Health regarding the number of
persons who died in hospital after motor vehicle accidents and other transport accidents.
As can be seen, the data do not have the same development, which is somewhat strange.
The development can partly be explained by:
An improved first aid and hospital care
An increased use of seat belts and better-equipped cars
An increase in use of full coverage insurance may contribute to an increase in property
damage reports.
The reporting policeman estimates the property damage cost of the accident in the police
report. The estimates for 1998 imply that rural accidents have about 3 times the cost of the
average, while urban accidents have only 0.7 times.
Likewise, accidents in rural areas in 1998 in 3.2 % were fatal and in 32.1 % led to injuries.
For urban areas these figures were 0.4 % and 10.9 %. For accidents reported by Gendarme
5.1 % were fatal and 27.1 % led to injuries.
The number of fatalities per fatal accident is for urban areas 1.17 persons and for rural
areas 1.50.
The two last paragraphs above imply that it may be wise to distinguish between rural and
urban accidents, since rural accidents have higher values.
The most correct data to use and set values for, should probably be ―property damage only
accidents‖, ―accidents with injuries‖ and ―accidents with fatalities‖. From a statistical
point of view it would be better to apply an average number of fatalities or injured per fatal
and injury accident respectively from the police reports. The data needed for this is not
available at present. It would be necessary to know how many injured persons there are per
average fatal accident. To find this information is somewhat complicated because fatalities
are only noted in the report if a person is killed at the site of the accident.
The average age of fatalities seems to be somewhere between 30 and 35 years according to
accident statistics for 1998, which seems to coincide with the 35 years average loss of
production for fatalities used by KGM.
In many cases the accident data is statistically uncertain, and it would be preferable to use
standard values for a certain type of road environment, for example, motorways or
signalized intersections. The actual accident situation can be considered, but would then
have to be adjusted towards the standard value. In Sweden, this adjustment is made like
this: (formula 3.3)
N(*) = N(N) + Cn * (N(O) – N(N))
where:
SweRoad TRAFFIC SAFETY PROJECT
Ankara Traffic Safety Consultancy Services
Methods and Values for Appraisal 20/38 April 2001
of Traffic Safety Improvements
Cn = 0.25 * N(N) / (1 + 0.25 * N(N))
N(*) = Corrected number of accidents
N(O) = Observed number of accidents (police reported accidents)
N(N) = Normal number of accidents in this environment per million vehicles and year *
number of million vehicles per year on which the N(O) is based.
For number of injuries (or injuries and fatalities) the similar procedure is done like: (formula 3.4)
I(*) = I(N) + Ci * (I(O) – I(N))
where:
Ci = 0.10 * I(N) / (1 + 0.10 * I(N))
I(*) = Corrected number of injuries
I(O) = Observed number of injuries (police reported injuries)
I(N) = Normal number of injuries in this environment per million vehicles and year *
number of million vehicles per year on which the I(O) is based.
At present this type of correction cannot be used in Turkey since there are no standard
values for different road environments etc. If such values will be available in the future, a
similar correction should be used in Turkey.
3.4 Suggested improvements of accident values
3.4.1 Short-term perspective
In the short-term perspective it is only feasible to use already available data. Therefore, in
the following section, we have looked at what is available and how this material could be
better used.
Since the number of fatalities and injuries for a selected black spot may have a large
statistical uncertainty, it would be preferable to use some kind of average number of
fatalities and injuries per fatal and injury accident as a basis. It has been possible to
estimate figures of the number of injuries in fatal accidents by using the accident statistics
from the Pilot Project region of the Traffic Safety Project.
In rural areas, the number of injured persons per fatal accident has been estimated to be 2.8
and per injury accident to be 2.2 persons. These estimates are based on the more detailed
police reports from the Pilot region.
If the value of property damage for the average accident is calculated to TL 409,740,514,
the value for rural road accidents should be around 3 times this, that is around TL
1,200,000,000. However, for Gendarme reported accidents it is estimated at about TL
800,000,000. By not using the Gendarme values in the calculation of property damage, the
value becomes somewhat overestimated. However, the Gendarme have not been reporting
accidents for as long as the police and it is probably better to avoid mixing the estimates of
the different organisations.
SweRoad TRAFFIC SAFETY PROJECT
Ankara Traffic Safety Consultancy Services
Methods and Values for Appraisal 21/38 April 2001
of Traffic Safety Improvements
If a certain safety measure is reducing accidents with property damage only, using the
average cost for urban or rural accidents, the costs will be overestimated since the property
damage cost is higher for accidents with casualties. And, for a safety measure which
mainly lessens the risk of getting killed or injured, the benefit is underestimated.
The costs of the property damage for different categories of accidents, using the police
cost estimates, have for rural areas been approximated to:
Property damage only accident TL 690 million
Injury accident TL 1,550 million
Fatal accident TL 2,850 million
An estimate has been made for urban areas and later in the text we will account for this.
KGM is planning to install a database program in order to be able to make this type of
analysis in an easier way in the future.
Professor Dr. Rıdvan Ege claims, using statistics from the Ministry of Health and other
sources, that out of about 10,000 traffic fatalities in 1997, about 5,200 are killed instantly
and in the police report noted as fatalities. Of the remaining fatalities it is assumed that
1,150 die during transport to hospital and about 3,500 die in hospital. Since the analysis at
KGM is based on the police reports, the fatalities should be multiplied by a factor of 1.9
using these figures. On the other hand, this implies that the number of injuries should be
decreased with the corresponding number of injured (about to 0.96).
The statistical source for the number of people who die during transport to medical care
has not been found, and the other values used by Professor Dr. Ege have been changed
since 1997. For correcting the police and Gendarme reported fatalities and injuries an
average of 1998 and 1999 is used, which gives the following correction factors:
Fatalities 1.51
Injuries 0.97
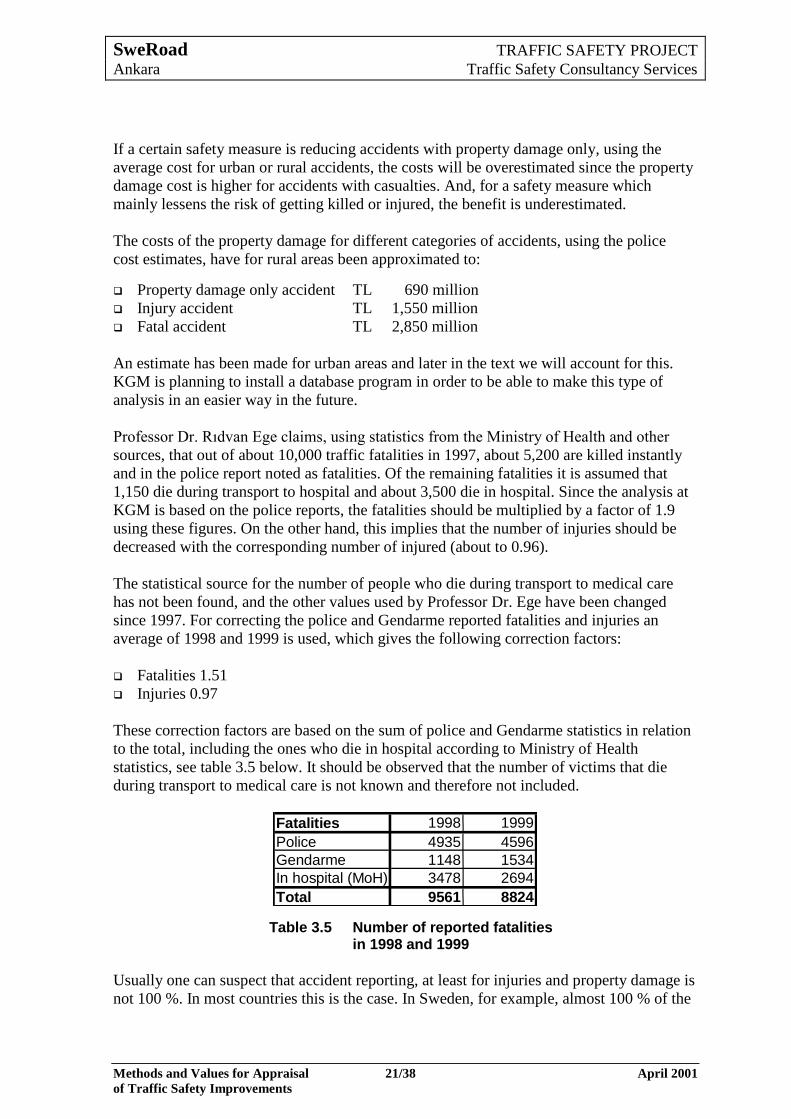
These correction factors are based on the sum of police and Gendarme statistics in relation
to the total, including the ones who die in hospital according to Ministry of Health
statistics, see table 3.5 below. It should be observed that the number of victims that die
during transport to medical care is not known and therefore not included.
Fatalities 1998 1999
Police 4935 4596
Gendarme 1148 1534
In hospital (MoH) 3478 2694
Total 9561 8824
Table 3.5 Number of reported fatalities in 1998 and 1999
Usually one can suspect that accident reporting, at least for injuries and property damage is
not 100 %. In most countries this is the case. In Sweden, for example, almost 100 % of the
SweRoad TRAFFIC SAFETY PROJECT
Ankara Traffic Safety Consultancy Services
Methods and Values for Appraisal 22/38 April 2001
of Traffic Safety Improvements
fatal accidents, 42 % of the injury accidents, and 7 % of only property damage accidents
are reported. For those injured in motor vehicle accidents, only 60 % are reported, for
bicycle accidents 20 % and pedestrian accidents 45 %. Many of the non-reported accidents
in Sweden are with bicyclists and pedestrians.
The reason for not reporting an accident could be, for example, use of alcohol, the police is
not nearby and the waiting time would be substantial, there is no possibility to contact the
police or that the damage cost is less than the excess of the insurance. The excess is the
part of the damage cost one must pay before the insurance pays anything. A large part of
the accidents, at least in most countries, often includes only one vehicle. This may give the
driver the feeling that he can only blame himself. Accordingly, there is often no one but
the driver, who has any interest in reporting the accident for insurance claims (if he finds it
worth while).
In Sweden, an accident is considered fatal if the person dies within 30 days. Severe injury
is defined as an injury that requires hospitalisation, slight injury means an injury that needs
treatment but not hospitalisation.
The following procedure is suggested to be used to calculate the monetary values:
1. Corrections to make it possible to use both fatal/injury accidents as well as
fatalities/injuries. From police statistics (1995-1999) and statistics from the Pilot
Project region (1998-1999) where more detailed data are available, the following
number of injured and killed persons per accident could be estimated for rural
accidents:
1.5 fatalities per fatal accident
2.8 injuries per fatal accident
2.2 injuries per injury accident
Assuming that the relations between injuries in fatal accidents and injuries in injury
accidents are the same as for rural areas, the following values are obtained for urban
accidents:
1.2 fatalities per fatal accident
1.9 injuries per fatal accident
1.5 injuries per injury accident
2. These figures are now corrected by using the statistics from the Ministry of Health
(1998-1999) that show how many of the persons who probably are reported as injured
that will die in hospital within one year. The normally used and recommended period
is 30 days. At present, however, this is the only available data. To ignore this and
consider these victims as injuries is certainly a much larger error than to include them
as fatalities. It should be noted that there might be a risk that some accidents are
recorded twice. In the calculation of the values below, it has been assumed that those
who die in hospital after an accident twice as often have been involved in a fatal
accident as in a severe injury accident. So the numbers from (1) above will be changed
to:
SweRoad TRAFFIC SAFETY PROJECT
Ankara Traffic Safety Consultancy Services
Methods and Values for Appraisal 23/38 April 2001
of Traffic Safety Improvements
for rural accidents:
2.1 fatalities per fatal accident
2.2 injuries per fatal accident
2.1 injuries per injury accident
for urban accidents:
1.5 fatalities per fatal accident
1.6 injuries per fatal accident
1.4 injuries per injury accident
There are also a few fatalities per injury accident, but these are approximated to
zero per injury accident.
The fatalities above are corrected with the factor of 1.51 and the injuries with 0.97
mentioned earlier. These correction factors are based on the following data from
1998/1999, see also table 3.5:
Number of police reported fatalities: 4,935/4596
Number of Gendarme reported fatalities: 1,148/1,534
Number of police reported injuries: 114,552/109,899
Number of Gendarme reported injuries: 11,241/15,687
Number of persons who die of motor vehicle accidents in hospital: 3,478/2,694
All of the accidents related to motor vehicles are not necessarily road traffic accidents,
but as the majority of them probably are, that is, there will only be a small
overestimation.
3. The value of property damage is then corrected by using the estimate in the police
reports and divide them into rural and urban:
Property damage per vehicle (used today by KGM): TL 410 million
Property damage per vehicle in rural areas: TL 860 million
Property damage per vehicle in urban areas: TL 280 million
4. With data from the Pilot region, the cost of property damage for different types of
accident severity can be estimated:
Rural property damage only accident: TL 690 million
Rural injury accident: TL 1,550 million
Rural fatal accident: TL 2,850 million
Rural injury: TL 710 million
Rural fatality: TL 660 million
Urban property damage only accident: TL 240 million
Urban injury accident: TL 550 million
Urban fatal accident: TL 1,000 million
Urban injury: TL 370 million
Urban fatality: TL 320 million
SweRoad TRAFFIC SAFETY PROJECT
Ankara Traffic Safety Consultancy Services
Methods and Values for Appraisal 24/38 April 2001
of Traffic Safety Improvements
The values for killed and injured persons above are corrected for persons who die in
hospital after an accident from (2).
For urban accidents, the costs for the different types were not possible to obtain from
the Pilot region (which is assumed to be purely rural). Therefore, the relative
differences between the costs of property damage accidents for different severe
accidents in urban areas were assumed to be the same as for property damage costs in
rural areas. The relations used were 1:2.25:4.14, from property damage only to fatal
accidents property damage costs.
This assumption was built on the fact that the property damage costs for different
accident severities vary in the same way for urban and rural areas. This may not be
accurate, but it is the best approximation that can be made at present with available
data.
5. The net present value of production loss is then calculated, the net value calculated as
production minus consumption because a risk value is going to be added, in which the
value of consumption is included. The net present value is at present calculated for
fatal accidents as the income during 35 years (expected remaining working years for a
fatality) which is estimated as TL 1,216 million per year. The present value is
calculated using an average annual economic growth of 5 % and a discount rate of
15 %.
The annual income is estimated as GNP per capita in 1999, and the public and
personal consumption is estimated from the statistics to be 75 % of this.
This gives the following present values for net production loss, including VAT:
TL 3,430 million for a fatality
TL 1,325 million for an injury
The reason for the rather small difference depends on the high discount rate.
The values per reported accident will be:
TL 10,224 million for a rural fatal accident
TL 2,882 million for a rural injury accident
TL 7,153 million for an urban fatal accident
TL 1,952 million for an urban injury accident
6. The material costs are, beside the indirect costs of net production loss, the direct costs
such as hospital costs, administration costs and property damage costs. The latter has
been calculated above, but for the two first ones no data are available. In Sweden,
these values have been studied and estimated, and as no data are available for Turkey,
these costs are assumed to be equally large parts of the material costs as in Sweden.
Some very preliminary data from Gazi University hospital indicates that this
assumption is reasonable. This gives the following factors by which the sum of
property damage and production loss obtained in 4 and 5 above should be multiplied:
SweRoad TRAFFIC SAFETY PROJECT
Ankara Traffic Safety Consultancy Services
Methods and Values for Appraisal 25/38 April 2001
of Traffic Safety Improvements
for property damage accidents 1.15
for injuries/injury accidents 1.34
for fatalities/fatal accident 1.06
7. The risk value is then calculated using the Swedish values. These are corrected in
relation to the difference in GNP of Sweden and Turkey in 1997, which gives a factor
of 8.6 higher GNP per capita in Sweden. Using this relation in calculating a risk value
for Turkey, the following values are obtained at a price level of 1999:
TL 3,700 million for an injury
TL 107,000 million for a fatality
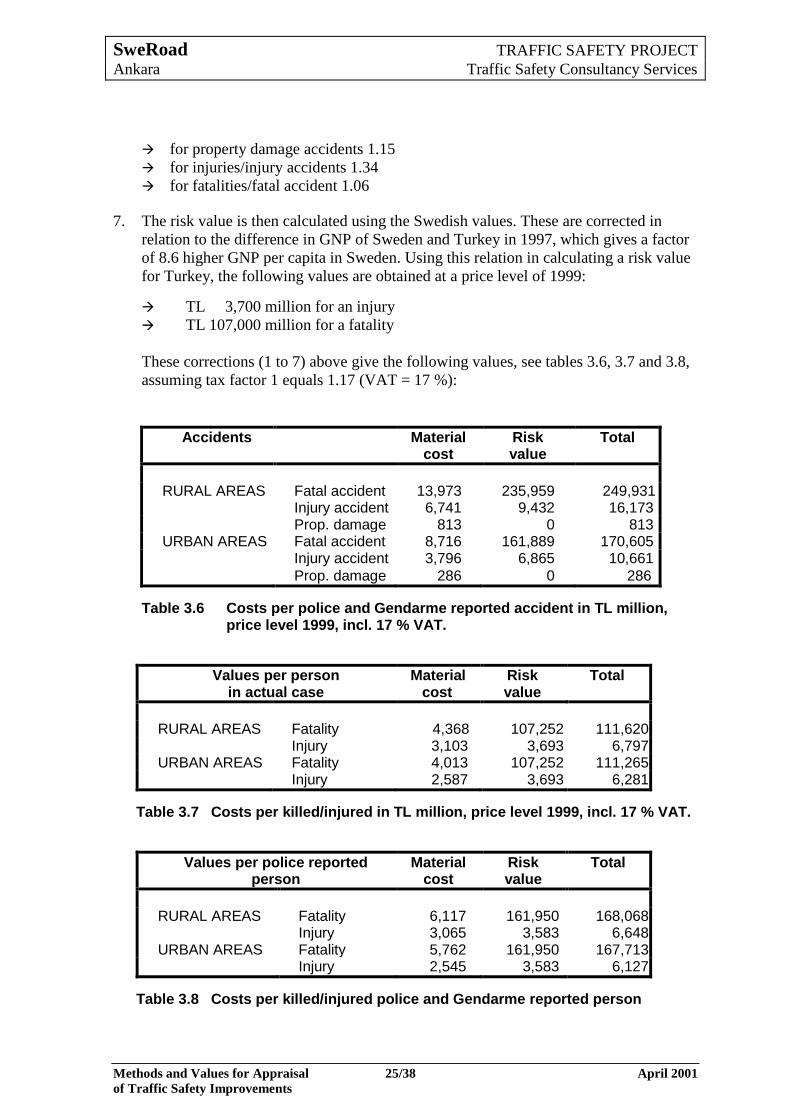
These corrections (1 to 7) above give the following values, see tables 3.6, 3.7 and 3.8,
assuming tax factor 1 equals 1.17 (VAT = 17 %):
Accidents Material cost
Risk value
Total
RURAL AREAS Fatal accident 13,973 235,959 249,931
Injury accident 6,741 9,432 16,173 Prop. damage 813 0 813
URBAN AREAS Fatal accident 8,716 161,889 170,605 Injury accident 3,796 6,865 10,661
Prop. damage 286 0 286
Table 3.6 Costs per police and Gendarme reported accident in TL million, price level 1999, incl. 17 % VAT.
Values per person in actual case
Material cost
Risk value
Total
RURAL AREAS Fatality 4,368 107,252 111,620
Injury 3,103 3,693 6,797 URBAN AREAS Fatality 4,013 107,252 111,265
Injury 2,587 3,693 6,281
Table 3.7 Costs per killed/injured in TL million, price level 1999, incl. 17 % VAT.
Values per police reported person
Material cost
Risk value
Total
RURAL AREAS Fatality 6,117 161,950 168,068
Injury 3,065 3,583 6,648 URBAN AREAS Fatality 5,762 161,950 167,713
Injury 2,545 3,583 6,127
Table 3.8 Costs per killed/injured police and Gendarme reported person
SweRoad TRAFFIC SAFETY PROJECT
Ankara Traffic Safety Consultancy Services
Methods and Values for Appraisal 26/38 April 2001
of Traffic Safety Improvements
in TL million, price level 1999 incl. 17 % VAT.
Starting in 2000, the police will no longer enter the ―property damage only‖ reports into
the accident database. A safety measure will in most cases also affect the total number of
accidents. Sometimes it will decrease all severity types. In other cases, it will decrease the
number of fatalities and injuries but increase the number of property damage only
accidents. The present KGM black spot program requires the number of accidents, and
since the material should be available, KGM might find it necessary to enter these data
into an accident database. When analyzing what kind of measures that are effective at a
black spot, it may also be useful to consider the information from property damage only
accidents.
If the property damage only accidents are not available, it is still possible to include them
in the cost-benefit analysis using average number of property damage accidents in relation
to accidents with injuries and fatalities. In the long-term perspective this relation may be
expected to change and should then be updated. There will then be a problem to estimate a
new relation factor, but it is recommended to include the property damage only accidents
at this time.
One could argue that the cost of an injury should be different in rural accidents than in
urban since the degree of severity can be different. The speeds are higher in rural areas but
on the other hand there are more accidents involving pedestrians in urban areas. As no data
is available, they are assumed to be equal.
The relations for property damage costs for accidents with property damage only, with
injuries or fatalities are in Sweden 1:3.5: 21. These figures are much higher than the ones
estimated by the police in Turkey, which give the relation 1:2.25:4.14. This is estimated
from one year of accidents in the Pilot region. When more data is available, this figure
should be updated.
In most countries there is considerable underreporting for injury accidents and property
damage only accidents. Awaiting a Turkish survey of the degree of reporting, it could be
possible to assume that the proportions are equal to those in Sweden. These correction
factors, however, may be a bit too high for Turkish conditions, since bicycle and
pedestrian accidents have the lowest degree of reporting and since bicycling is not so
frequent in Turkey as in Sweden. Instead, by way of precaution, the factor should be
calculated on the degree of reporting for motor vehicle accidents. The following factors to
calculate accident costs from police reported accidents could be used to consider non-
reported accidents:
Fatalities 1.0
Injuries 1.7
Property damage 7
However, at present we do not recommend the use of these, since there is no source
available that indicates how many injury and property damage only accidents that are not
reported. KGM must consider if such corrections should be used, and then if the Swedish
values could be used as estimates, meanwhile Turkish values are obtained.
SweRoad TRAFFIC SAFETY PROJECT
Ankara Traffic Safety Consultancy Services
Methods and Values for Appraisal 27/38 April 2001
of Traffic Safety Improvements
The numbers of accidents in the KGM analyses are considered to increase in proportion to
traffic growth. This can be questioned since better cars with more safety equipment and
better, more informed drivers will be a part of the normal development. In Turkey, there
has not been any correlation between traffic growth and accident growth during the last
years. Instead fatal accidents, according to police reports, have decreased by 3.6 % per
year for the last 9 years, while the traffic on state highways and provincial roads have
increased by 8 % per year for the last 8 years. It has not been possible to find a full
explanation for these seemingly illogical figures. At present we recommend that no
increase/decrease of traffic accidents is made over time in the analyses.
The factor describing the decrease in accidents not related to improvements in the road
environment is very difficult to isolate. In Sweden, the factor is considered to be a few
percent per year providing zero traffic increase. In Turkey, this figure could be higher as
the potential for improvements is larger. The improvements undertaken the last years in
Turkey are, however, not likely to be the only explanation for the large decrease in fatal
accidents.
The calculation methods and values used above in steps 1-7 have been included in an
Excel sheet that can be used by KGM for black spot analysis, Appendix 1. From this it is
possible to follow how different values are calculated and there is also the possibility to
change some factors and data to calculate new values. A short manual has been written for
this Excel sheet.
3.4.2 Long-term perspective
In a long-term perspective, it is suggested that surveys are made and that new material is
collected in order to describe the costs of accidents better, and also to make a better
estimate of the risk value for fatal and injury accidents. All data and costs should be
improved and updated.
The accident data should preferably be based on three- or five-year periods and more data
will later be available for the Pilot region. All costs should be checked and fixed at a given
price level when, for example, the national statistics for the year 2000 are available.
The effects and costs of safety measures, as well as other road investments, should
continuously be updated, for example, by using the follow up program recently started by
the Traffic Division at KGM. This program was initiated in 1998, and at the end of 2000
there should be 3 years of accident statistics for the first projects.
The estimates of property damage costs probably need to be improved. The policeman
making the accident report today bases property damage costs on a rough estimate. This
value is dependent on the skill of the individual policeman and his knowledge of repair
costs and also on his possibility to make an adequate judgement of the size of the damage
on the spot.
One way to improve the quality of the property damage costs would be to request
insurance companies for information, though it must be remembered that all vehicles do
not have an insurance that covers repair costs of the own vehicle.
SweRoad TRAFFIC SAFETY PROJECT
Ankara Traffic Safety Consultancy Services
Methods and Values for Appraisal 28/38 April 2001
of Traffic Safety Improvements
An improvement which could be made without any major effort or cost, would be to ask
the police/Gendarme to account for property damage costs divided into the categories of
―property damage only accidents‖, ―injury accidents‖ and ―fatal accidents‖. If the number
of injuries per fatal accident can be accounted for as well, this would mean a major
improvement.
How well the police and Gendarme estimates correlate to the real cost from insurance
claims and repair shops could also be studied.
According to international recommendations it would be better to use the following
definitions for traffic accidents:
Fatality: A person who dies within 30 days after the accident
Severe injury: A person who is hospitalised
Slight injury: An injury that does not lead to hospitalisation
Generally the knowledge of to what extent different accidents (property damage only,
injury, fatal) are reported to police needs to be investigated.
The costs of hospital and medical treatment can preferably be obtained by following up a
number of traffic accident victims of different degrees of severity during a longer period.
Within the emergency aid pilot project at Gazi University hospital, that is a part of this
project, these values should be possible to estimate.
The severity of an injury accident and for how long an injured person is unable to work
fully needs further investigation. Hopefully, the studies at Gazi University hospital can
give some input.
The degree of severity reported as injured varies largely. Therefore, it would be better if
the police reports could split this category into slight and severe injury. This would
improve the estimates of an accident with injuries during safety analyses. On the other
hand, experiences from other countries show that it is difficult for the police to determine
the degree of injury.
Administrative costs related to traffic accidents of the insurance companies and costs over
the state budget for police and courts can be difficult to obtain. These costs should
preferably be estimated per accident category, that is property damage only, injury (slight
and severe) and fatal.
For the calculations of net production loss, either the GNP per capita approach could be
used or an attempt to estimate the average income of traffic victims could be tried.
The discount rate should be further discussed. To find the correct discount rate for
infrastructure investments is probably a task for the concerned Ministries.
The tax factors needs further investigations. To determine tax factor 1, set equal to the
average VAT for private and public consumption, should merely be a question of
SweRoad TRAFFIC SAFETY PROJECT
Ankara Traffic Safety Consultancy Services
Methods and Values for Appraisal 29/38 April 2001
of Traffic Safety Improvements
gathering the correct data. Then, it is more difficult to decide whether to use tax factor 2 or
not, and in the former case what value to use. There are arguments both for and against
using a marginal cost of public funds. The decision to use this is a question not only for
KGM, but for all public investments in Turkey.
To determine actual Turkish risk values, a willingness-to-pay study is recommended. This
needs expertise specialised in the field. A short description of a Swedish study is made
under 3.5.
3.5 Willingness-to-pay study, example from Sweden
To estimate the value of risk reduction, a willingness-to-pay (WTP) approach is
recommended, using a contingent valuation (CV) study. The CV-study made by Ulf
Persson et al. for the Swedish National Road Administration used hypothetical questions
of WTP in a survey. The data was collected using a postal questionnaire sent to a random
sample of 5,650 individuals, age 18 to 74. Two sets of questionnaires were used in the
study. One had the purpose to estimate the value of a statistical life (VOSL) in the road
traffic sector and the other had the purpose to estimate the value of risk reduction for non-
fatal injuries.
The VOSL-study included 3,050 questionnaires divided into 6 groups:
1. Questioned about how much they were prepared to pay for a 10 % risk reduction.
2. Questioned about how much they were prepared to pay for a 30 % risk reduction, with
sub-groups (―scope embedding‖): a) for the risk of getting killed in traffic, b) for the
risk of getting injured in traffic, c) for the risk of getting injured or killed in traffic.
3. Questioned about how much they were prepared to pay for a 30 % risk reduction, with
sub-groups that had to consider if they were prepared to accept to pay a given amount
for this (―starting point bias‖). The amounts for the 6 sub-groups were SEK (Swedish
kronor) 20, 50, 100, 500, 1000 and 2000.
4. Questioned about how much they were prepared to pay for a 30 % risk reduction, with
2 sub-groups that had to consider the time perspective (―temporal embedding‖), a) if
the amount was to be paid yearly for 5 years, b) the whole amount was to be paid at
one time but for a risk reduction period of 5 years.
5. Questioned about how much they were prepared to pay for a 50 % risk reduction.
6. Questioned about how much they were prepared to pay for a 99 % risk reduction.
The study for non-fatal injuries:
1. Questioned about how much they were prepared to pay for a 30 % risk reduction, with
sub-groups with questions that test how the size of the risk reduction is considered
(―scale embedding‖): a) valuing a 20 % risk reduction by installing an airbag in the
steering wheel of an old inherited car which lacked this equipment, b) valuing a 20 %
risk reduction by installing a side-airbag in a car that already had an airbag in the
steering wheel, c) valuing a 40 % risk reduction by installing both an airbag in the
steering wheel and a side-airbag. All these sub-groups were further divided into 4
groups all with one injury that led to disability (or fatal in one case), one severe but
SweRoad TRAFFIC SAFETY PROJECT
Ankara Traffic Safety Consultancy Services
Methods and Values for Appraisal 30/38 April 2001
of Traffic Safety Improvements
healing injury and one slight injury. The groups were given different combinations of
detailed descriptions, one for each of the three injury groups.
2. Questioned about how much they were prepared to pay for a 50 % risk reduction,
divided into 4 sub-groups with different combinations of description, one for each of
the three injury groups as described above.
In the text below there are some examples of questions used in the questionnaire besides
general information like sex, age, household income, means of transport, car ownership,
experience of accidents, health status and such:
Questions about how aware the person is of his own risk, e.g. ―An average risk to get
killed in traffic an average year is about 5 to 100,000 for a person in his fifties. How
large do you think your own risk is of getting killed in an accident an average year?
Your risk can be both higher and lower than the average. Consider how much you
expose yourself in a traffic environment, which means of transport you use, and how
you behave, e.g. how safe is your driving behaviour. Answer: I believe the risk is
…….. to 100,000.‖
Questions about WTP, e.g. ―How much would you consider to pay at the most per
year to reduce your own risk of getting killed in a traffic accident with one third?
Answer: ……….. SEK per year.‖
There was quite thorough information in the questionnaire such as:
―In the question to follow we want you to answer the question about how much you
yourself would be willing to pay for safety equipment that reduces your own risk of
getting killed in a traffic accident with one third. Before you decide how much you at most
would be willing to pay, we like you to consider the following:
The reduction of risk only applies to getting killed in a traffic accident. The risk of
getting injured is not influenced.
The safety equipment is not uncomfortable, ugly or unpleasant to use. It is not
noticeable. You yourself can only use the equipment. It does not influence the risk of
other persons.
The safety equipment will only work for one year. Thereafter you must pay again if
you want to continue to use the risk reduction.
An accident will not influence the economy of your family, as we assume that the
insurance company fully will cover the loss of income to your family and any cost for
medical care and medicine.
The amount of money you pay to reduce this risk leads to less money to consume other
goods and services.‖
The injuries used in the injury groups, as described in the non-fatal accident methodology
above, were all described in detail.
One of often mentioned critics of the WTP-method is that it is very hypothetical, that the
interviewed person never has to pay what he claims he is willing to, and that some persons
may have a problem to understand the questions or relate to them.
SweRoad TRAFFIC SAFETY PROJECT
Ankara Traffic Safety Consultancy Services
Methods and Values for Appraisal 31/38 April 2001
of Traffic Safety Improvements
The method is very complex and it is advisable to use personnel with deep insights in
economics and statistics. Still WTP is considered to be the best method for estimating risk
values.
3.6 Conclusions
Even if there are problems to obtain relevant reliable statistics and data, it is possible - by
using estimates and experiences from other countries and by analyzing existing data more
in detail - to define values of reasonable quality to use in cost-benefit analysis for traffic
safety measures.
The statistics can be further evaluated and updated as new values and knowledge becomes
available. Studies can be made, such as the ones suggested above in this chapter, to further
improve the basic data.
The suggested method in this chapter should not be seen as a final approach for valuing the
effects of a safety measure. It is merely a suggestion how to use some of the available data
and knowledge better. One purpose is to stimulate KGM and others to constantly improve
the use of available data and to increase the awareness of where the major fields of
improvements are within accident statistics and values of safety effects.
Combining the present analyzing methods at KGM with the suggestions made in this
chapter will provide KGM with more accuracy and reasonable quality to value the effects
of safety measures.
4 Other values
4.1 Road maintenance costs
For maintenance costs KGM uses actual costs of road maintenance. This is normally also
the best way. There is no reason to question the quality of these costs at present, and
normally these values will be updated on an annual basis.
4.2 Vehicle operating costs
At present vehicle operating costs (VOC) are derived from HDM-III, which has been
calibrated for Turkish conditions. The quality of this value depends on how well this
calibration is made. KGM is at present starting to use the new version, HDM-IV, which
requires some additional data and calibration. At the same time, maybe the data used for
VOC should also be updated and improved.
4.3 Time values
Time costs constitute one of the larger components (normally benefit) of road
improvements. Therefore, it may be worthwhile to put some effort in acquiring the time
value.
SweRoad TRAFFIC SAFETY PROJECT
Ankara Traffic Safety Consultancy Services
Methods and Values for Appraisal 32/38 April 2001
of Traffic Safety Improvements
The average time value is normally supposed to be related mainly to income, choice of
mode and purpose of travel. You usually distinguish between at least two kinds of
purposes for traveling, business trips and other trips. Sometimes other trips are further
divided into trips to/from work, shopping trips, leisure and visiting trips and so on. But
since no such data is available for Turkey, we suggest that two different values is enough
to start with.
The value per time unit should be set equal for short trips as for long trips if available data
is not sufficient to differentiate. Small gains of time are normally supposed to have the
same value per time unit as large time gains. Reasons for considering even small gains of
time can be that people are driving against red light, over-takings are made in improper
situations and at dangerous locations etc. One assumption is that there often are
dependence between several road projects and that small time gains therefore are
accumulated into large gains of time.
Gains of travel time possible to be transformed into working time are valued to the price of
the market. The value of time is supposed to be proportionate to income; the income is
normally not supposed to vary between different regions. On the other hand, income is
supposed to vary between means of transport and purpose of travel.
One reason for using income as a source for time value is the consequences for future time
values, which may be of significant importance with regard to the lifetime of infrastructure
investments.
In the following, reference is made to the way time values were estimated in Sweden.
Time savings made in connection with business trips do not always mean that working
time increase with the same amount. Instead, a part of the time saving will lead to, for
example, that the road user will get more leisure time. In Sweden it is assumed that two
thirds of the time saving will be spent on working and one third will be spent on leisure
time. The cost of salary might be used as a base for valuation of the timesaving made
during working time. The salary cost shows the value of what the employee produces. The
reduction of travel time makes it possible for the employee to produce goods instead of
using the time for traveling. This time should be valued. The third spent on leisure is
estimated as for trips between workplace and home as mentioned below, but has been
given a somewhat higher value than the one based on the salary of an industrial worker.
For Turkey, since no such data is available, we suggest that the whole time saving is
considered to be used for work.
The alternative cost for business trips should then be estimated to the lost production in
trade and industry. The trade and industry estimate this loss in production at the total salary
cost, including additional employers’ costs. The goods produced by the industrial worker
will be sold at the market with a price corresponding to the salary cost that the company
would have paid the industrial worker and all additional costs such as insurances and
pensions for the employee and other state charges based on the employee’s salary.
At the market, this merchandise or service will be sold at the production cost with added
taxes (and the state yields taxes). When buying these goods the price would correspond to
SweRoad TRAFFIC SAFETY PROJECT
Ankara Traffic Safety Consultancy Services
Methods and Values for Appraisal 33/38 April 2001
of Traffic Safety Improvements
the consumer’s willingness to pay for what they would have been able to produce instead
of traveling. For that reason, the salary per hour including overhead costs and tax factor
one is used. This tax factor is used due to the fact that the state yields taxes if the consumer
uses his money buying goods.
The total gain of travel time for truck drivers is supposed to be transformed into work. The
value of gained travel time is assumed to correspond to the salary per hour, that is the
average salary for truck drivers, including the employer’s additional costs and tax factor
one.
The value of travel time for the three different types of travels during leisure time1 are in
Sweden based on an estimation of the willingness to pay corresponding to salary. The
estimated values are compilations of different investigations mostly based on revealed
preferences.
The valuations of trips between workplace and home in Sweden are supposed (based on
econometric valuations and interviews) to be 30 % of the salary per hour (not including the
employer’s costs for salaries), for shopping trips 25 % of the salary per hour and for other
kinds of trips during leisure time, 20 % of the salary per hour. The average salary for
industrial workers (men) is used as a base for valuation of time spent on trips during leisure
time (employer’s additional costs excluded).
In Sweden, as well as in other countries, many studies have been carried out to show how
timesaving during leisure time can be estimated. Mainly, real choice behaviour (revealed
preferences) has been studied. For example, studies have been carried out investigating
when road users choose to drive a faster but more expensive road, instead of a slower and
less expensive one. This can illustrate the road user’s valuation of time savings. Many
studies are also based on the road user's choice between different means of transport.
These studies have shown that the valuation of the time saved during leisure time is
somewhere between 15 and 35 % of the road users’ average salary per hour. Based on such
observations and average salary, per hour values can been estimated for time saving during
leisure trips. For Turkey we suggest 25 % of the average salary per hour for non-business
trips until other values can be obtained from studies.
The table below could be used to calculate a preliminary value, awaiting studies to obtain
Turkish values.
The values in table 4.1 are very rough estimates and given in thousand Turkish Lira.
Before these values are used, they should be validated.
Salary for business trips = average salary of a businessman * the employer’s additional
costs * VAT
Salary for other trips = average salary for an industrial worker including vacation payment
Salary for truck driver = average salary of a truck driver * employer’s additional costs *
VAT
1 Trips to and from work, shopping trips and other trips during leisure time
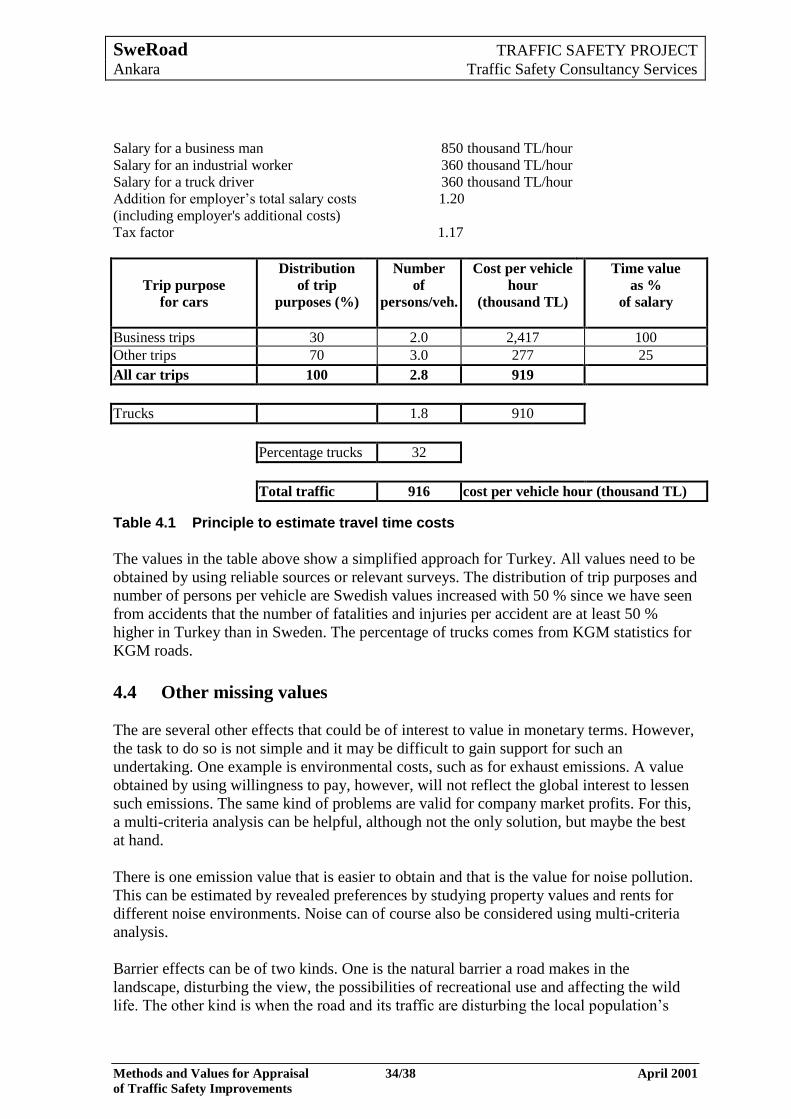
SweRoad TRAFFIC SAFETY PROJECT
Ankara Traffic Safety Consultancy Services
Methods and Values for Appraisal 34/38 April 2001
of Traffic Safety Improvements
Salary for a business man 850 thousand TL/hour
Salary for an industrial worker 360 thousand TL/hour
Salary for a truck driver 360 thousand TL/hour
Addition for employer’s total salary costs
(including employer's additional costs)
1.20
Tax factor 1.17
Trip purpose
for cars
Distribution
of trip
purposes (%)
Number
of
persons/veh.
Cost per vehicle
hour
(thousand TL)
Time value
as %
of salary
Business trips 30 2.0 2,417 100
Other trips 70 3.0 277 25
All car trips 100 2.8 919
Trucks 1.8 910
Percentage trucks 32
Total traffic 916 cost per vehicle hour (thousand TL)
Table 4.1 Principle to estimate travel time costs
The values in the table above show a simplified approach for Turkey. All values need to be
obtained by using reliable sources or relevant surveys. The distribution of trip purposes and
number of persons per vehicle are Swedish values increased with 50 % since we have seen
from accidents that the number of fatalities and injuries per accident are at least 50 %
higher in Turkey than in Sweden. The percentage of trucks comes from KGM statistics for
KGM roads.
4.4 Other missing values
The are several other effects that could be of interest to value in monetary terms. However,
the task to do so is not simple and it may be difficult to gain support for such an
undertaking. One example is environmental costs, such as for exhaust emissions. A value
obtained by using willingness to pay, however, will not reflect the global interest to lessen
such emissions. The same kind of problems are valid for company market profits. For this,
a multi-criteria analysis can be helpful, although not the only solution, but maybe the best
at hand.
There is one emission value that is easier to obtain and that is the value for noise pollution.
This can be estimated by revealed preferences by studying property values and rents for
different noise environments. Noise can of course also be considered using multi-criteria
analysis.
Barrier effects can be of two kinds. One is the natural barrier a road makes in the
landscape, disturbing the view, the possibilities of recreational use and affecting the wild
life. The other kind is when the road and its traffic are disturbing the local population’s
SweRoad TRAFFIC SAFETY PROJECT
Ankara Traffic Safety Consultancy Services
Methods and Values for Appraisal 35/38 April 2001
of Traffic Safety Improvements
pattern of movement and the fact that they may experience a greater risk than what is
actually the case. Both these types of effects can be valued by using stated preference
studies or considered by using multi-criteria analysis.
In most countries, where the environmental effects partly have been valued, the values are
rather small. This does not reflect the importance to consider the environmental effects of
road investment. Therefore, emissions and other environmental effects are probably best
considered in a multi-criteria analysis.
5 Conclusions
The present method used by KGM calculating BCR is recommended to be used with some
modifications. We suggest using the values in tables 3.6 – 3.8 together with the Excel sheet
(―Black-spot CB-analysis.xls‖) prepared by SweRoad for valuing effects of safety projects.
The program that is used to find black spots should, as the Traffic Division at KGM
suggested, be based on three years accident statistics. Then cost-benefit analyses should be
made for about twice the amount available in the budget. It would then be easier to
prioritise the projects so the traffic safety effects are maximized for the available funds. It
should be observed that low-cost alternatives tend to yield higher BCRs than high-cost
alternatives.
If there are any reasons not to follow the order of the prioritised list, KGM should inform
the decision makers what the consequences of this would be and how this would influence
the possibilities to improve the safety situation in the most efficient way.
There are several fields covered by this report for which improvements could be an
important future task. The most important ones are:
Improvement of accident statistics to cover the total number from Police, Gendarme
and the Ministry of Health.
Knowledge of the total number of non-reported accidents, injuries and fatalities.
Improvement of the risk value; updating the approach used in this report when new
data becomes available and in the longer perspective undertake a willingness-to-pay
study.
Validate the discount rate and economic growth forecast.
If a road data bank will be set up (together with an accident data bank), it will be
possible to obtain accident and injury rates for different road environments. These can
be used both for calculating corrected accident data and determine effects of new
investments.
Implemented road safety measures should be followed up to increase the knowledge of
which effects have been reached.
To be able to include all major effects in a CBA a Turkish value of time are needed.
Estimating time values using Turkish data about vehicle composition and earnings is
therefore an important future task.
SweRoad TRAFFIC SAFETY PROJECT
Ankara Traffic Safety Consultancy Services
Methods and Values for Appraisal 36/38 April 2001
of Traffic Safety Improvements
In the methods used in this report we correct the number of fatalities using the Ministry of
Health statistics. The number of injured is only corrected downwards because we assume
that the ones who die in hospital are reported as injured in the police reports. From
international experience we know that all injuries and accidents are not reported. It is,
therefore, an important task to estimate this underreporting.
The report is to a large extent about which are the most important effects to value. Even if
the environmental effects are difficult to value, they are important to consider in a full cost-
benefit analysis. If not valued they must be considered besides the CBA, for example, by
using multi-criteria analysis.
SweRoad TRAFFIC SAFETY PROJECT
Ankara Traffic Safety Consultancy Services
Methods and Values for Appraisal 37/38 April 2001
of Traffic Safety Improvements
6 References
Prof. Dr. Rıdvan Ege, (personal contact)
Prof. Dr. Rıdvan Ege, Report 1998 SICOT Scientific Conference: Is traffic a means of
civilisation or a catastrophe for our world?
Health statistics 1997 to 1999, Ministry of Health, Republic of Turkey
Persson. U, Hjalte, K, Nilsson, K, Norinder, A, Värdet av att minska risken för
vägtrafikskador – Beräkning av riskvärden för dödliga, genomsnittligt svåra och lindriga
skador med Contingent Value metoden. Bulletin 183, Lund Institute of Technology, 2000
Trawėn, A, Maraste, P, Persson, U, Cost per Fatal Casualty in Traffic Accidents – An
International Comparison of Values used in traffic Planning, Paper to: The 3rd KFB
Conference on Transport systems, Organisation and Planning, June 13-14 2000
SAMPLAN rapport 1995:14, Dokumentation av ASEK/gruppernas rapporter. SIKA,
Swedish Institute of Communication Analysis, 1996
Bush. J W, Chen M M, Patrick, D L, Health Status Index in Cost Effectiveness: Analysis
of PKU Program, I Berg, R L (ed) Health Status Indexes 1973
Statistical yearbook of Turkey 1998, State Institute of Statistics, Prime Ministry Republic
of Turkey
Statistics from Internet, State Institute of Statistics, Prime Ministry Republic of Turkey
Police accident report 1998, Trafik İstatistik Yıllığı 1998, Traffic Police
Police accident report 1999, Trafik İstatistik Yıllığı 1999, Traffic Police
Accident statistics from Gendarme, 1997-1999
Nielsen, S, Sachse, C, Estimating time value, Latvia 1998, SweRoad
Dr. Ferruh Ayoğlu, Gazi University hospital, (personal contact)
Swedish National Road Administration, Vägverkets samhällsekonomiska kalkylmodell –
Ekonomisk teori och värderingar, Vägverket 1997:130.
Sachse, C, Cost Benefit Analysis of Traffic Safety Projects, Latvia 1999, SweRoad
Traffic and transportation survey, Trafik ve Ulaşim Bilgileri, 1999, Karayolları Genel
Müdürlüğü
Excel calculation sheet used by the Planning Division, Karayolları Genel Müdürlüğü
SweRoad TRAFFIC SAFETY PROJECT
Ankara Traffic Safety Consultancy Services
Methods and Values for Appraisal 38/38 April 2001
of Traffic Safety Improvements
7 Appendices
Appendix A - Excel sheet for cost benefit analysis of black spots, ―Black-spot CB-
analysis.xls‖
Appendix B - Manual for using the Excel sheet, ―Black-spot CB-analysis.xls‖
Appendix C - Persson Ulf, Nilsson Katarina, Norinder Anna, Hjalte Krister, The value of
Statistical Life in Transport: Some evidence on scale embedding from a
New Contingent Valuation Study in Sweden.
Appendix D - Trawén Anna, Marasta Pia, Persson Ulf, Costs per Fatal Casualty in Traffic
Accidents, Paper to 3rd
KFB Research Conference, June 13-14, 2000.