gene expression changes as markers of early lapatinib
TRANSCRIPT
O’Neill et al. Molecular Cancer 2012, 11:41http://www.molecular-cancer.com/content/11/1/41
RESEARCH Open Access
Gene expression changes as markers of earlylapatinib response in a panel of breast cancer celllinesFiona O’Neill1,2*†, Stephen F Madden1†, Sinead T Aherne1, Martin Clynes1, John Crown1, Padraig Doolan1† andRobert O’Connor1,2†
Abstract
Background: Lapatinib, a tyrosine kinase inhibitor of HER2 and EGFR and is approved, in combination withcapecitabine, for the treatment of trastuzumab-refractory metastatic breast cancer. In order to establish a possiblegene expression response to lapatinib, a panel of breast cancer cell lines with varying sensitivity to lapatinib wereanalysed using a combination of microarray and qPCR profiling.
Methods: Co-inertia analysis (CIA), a data integration technique, was used to identify transcription factorsassociated with the lapatinib response on a previously published dataset of 96 microarrays. RNA was extracted fromBT474, SKBR3, EFM192A, HCC1954, MDAMB453 and MDAMB231 breast cancer cell lines displaying a range oflapatinib sensitivities and HER2 expression treated with 1 μM of lapatinib for 12 hours and quantified using TaqmanRT-PCR. A fold change≥± 2 was considered significant.
Results: A list of 421 differentially-expressed genes and 8 transcription factors (TFs) whose potential regulatoryimpact was inferred in silico, were identified as associated with lapatinib response. From this group, a panelof 27 genes (including the 8 TFs) were selected for qPCR validation. 5 genes were determined to besignificantly differentially expressed following the 12 hr treatment of 1 μM lapatinib across all six cell lines.Furthermore, the expression of 4 of these genes (RB1CC1, FOXO3A, NR3C1 and ERBB3) was directly correlatedwith the degree of sensitivity of the cell line to lapatinib and their expression was observed to “switch” fromup-regulated to down-regulated when the cell lines were arranged in a lapatinib-sensitive to insensitive order.These included the novel lapatinib response-associated genes RB1CC1 and NR3C1. Additionally, Cyclin D1(CCND1), a common regulator of the other four proteins, was also demonstrated to observe a proportionalresponse to lapatinib exposure.
Conclusions: A panel of 5 genes were determined to be differentially expressed in response to lapatinib atthe 12 hour time point examined. The expression of these 5 genes correlated directly with lapatinibsensitivity. We propose that the gene expression profile may represent both an early measure of thelikelihood of sensitivity and the level of response to lapatinib and may therefore have application in earlyresponse detection.
Keywords: Co-inertia analysis, Microarray, Lapatinib response, Breast cancer
* Correspondence: [email protected]†Equal contributors1Molecular Therapeutics for Cancer Ireland, National Institute for CellularBiotechnology, Dublin City University, Glasnevin, Dublin 9, Ireland2School of Nursing and Human Sciences, Dublin City University, Glasnevin,Dublin 9, Ireland
© 2012 O'Neill et al.; licensee BioMed Central Ltd. This is an Open Access article distributed under the terms of the CreativeCommons Attribution License (http://creativecommons.org/licenses/by/2.0), which permits unrestricted use, distribution, andreproduction in any medium, provided the original work is properly cited.

O’Neill et al. Molecular Cancer 2012, 11:41 Page 2 of 14http://www.molecular-cancer.com/content/11/1/41
IntroductionBreast cancer is the second most common malignancyin the world to date [1]. Classification of this cancer isbased on a number of aspects such as tumour progres-sion and pathology, estrogen receptor status and HumanEpidermal growth factor Receptor 2 (HER2) status. Allof these clinical parameters dictate the most suitable pa-tient treatment.HER2-positive breast cancer, in which the HER2 re-
ceptor is either overexpressed or amplified, is repre-sented in approximately 20–30% of human breastcancers [2] and has been associated with poorer progno-sis [3,4]. As with many cancers, there are a number oftreatment options available to treat HER2 positive breastcancer. Radiation, surgery and chemotherapy have longbeen the standard for treatment. However, in recentyears a more targeted approach has been taken inregards to treatment. Current targeted therapies avail-able for this breast cancer subtype include the monoclo-nal antibody trastuzumab and the dual tyrosine kinaseinhibitor lapatinib. The adverse effects associated withthese types of therapies are less severe than those oftraditional chemotherapies as they target cancer cellsmore specifically [5]. Tyrosine kinases are a group ofenzymes that play a critical role in the signalling cas-cades of the cell. The tyrosine kinase functionality ofthese enzymes is typically coupled to and moderated byligand binding (receptor) components and receptor-coupled tyrosine kinases are involved in the phosphoryl-ation of tyrosine receptors in targeted proteins. Manyimportant receptor-coupled tyrosine kinases are locatedin the cell membrane and proteins are activated by thebinding of ligands to their extracellular domain. HER2and EGFR (epidermal growth factor receptor) are twosuch examples of growth factor receptors which canhomodimerise or dimerise with other members of theHuman Epidermal Growth Factor Receptor family,which in turn activates their tyrosine kinase moiety. Theactivated tyrosine kinases have critical roles in cell sig-nalling processes such as cell proliferation and growth[6,7]. Tyrosine kinase inhibitors (TKIs) prevent the acti-vation of these tyrosine kinases thus inhibiting the acti-vation of the pathways that would promote tumour cellgrowth and proliferation.In this study, we focused on lapatinib, a dual kinase in-
hibitor developed by GlaxoSmithKline, which targetsboth HER2 and EGFR [8]. By binding to both HER2 andEGFR receptors, lapatinib prevents activation of import-ant pro-cancer pathways such as Erk/MAPK (extracellu-lar-signal-regulated kinase/mitogen-activated proteinkinase) and PI3K (Phosphatidylinositol 3-kinases) whichhave vital roles in cell proliferation and survival [8,9].Lapatinib is currently approved for treatment of meta-static breast cancer in combination with capecitabine
[10]. It has also been used in combination with trastuzu-mab in patients suffering from advanced HER2 positivebreast cancer [11].Despite the wide application of HER2 testing in breast
cancer, a significant proportion of HER2-positivepatients do not respond to HER2-targeted therapy. Inrecent studies performed using lapatinib as a monother-apy, in combination with capecitabine and also withtrastuzumab, clinical benefit response rates were foundto range from 12.4% with lapatinib alone, 22% in com-bination with capecitabine and 24.7% in combinationwith trastuzumab [10,12,13].We have therefore soughtto use cellular models to examine and identify the geneexpression changes which might be characteristic of re-sponse to treatment with lapatinib.In this paper, we used a multivariate statistical tech-
nique called co-inertia analysis (CIA) to link transcrip-tion factor binding site (TFBS) target predictions andgene expression data to identify transcription factors(TFs) associated with the cellular response to lapatinib[14,15]. This is the first time this data integration tech-nique has been applied to a data set of breast cancercells responding to drug treatment. The TFBS target pre-dictions have been previously published [14]. In totalthis analysis contained TFBS information for 1236known and predicted TFBSs across the conserved prox-imal promoters for ~17,000 genes. The gene expressiondataset has been described previously [16] and incorpo-rates time series data post treatment with high and lowdose lapatinib in BT474 and SKBR3 cell lines.From the original analysis [16] of this time series data,
a number of gene expression changes were identified fol-lowing treatment with lapatinib. These included a num-ber of differentially expressed genes associated with theAKT pathway. This pathway is highly associated withcell proliferation, apoptosis and cell migration. The dif-ferentially regulated genes included, FOXO3A,CDKN1B, CCND1, AKT1 and E2F3. Of these genes, theauthors focused on the expression of FOXO3A andsome of its associated targets and regulators such asCDKN1B and CCND1 [16].CIA is used to combine two linked datasets (two sets
of measurements on the same objects) and perform twosimultaneous non-symmetric correspondence analyses(NSC) and identify the axes that are maximally co-variant [15,17]. The use of an ordination method such asNSC or principle components analysis (PCA) allows usto summarise the data in a low dimensional space. Inthis case, the two linked datasets are normalised geneexpression data from the lapatinib-treated cell lines andTFBS information for the same genes. We have previ-ously used this method to compare gene expression datawith miRNA target information [18] and proteomicsdata [19]. This is the first time that this approach has

O’Neill et al. Molecular Cancer 2012, 11:41 Page 3 of 14http://www.molecular-cancer.com/content/11/1/41
been used to analyse data derived from breast cancercells responding to targeted therapy treatment.CIA allows us to identify commonality between the ex-
pression of the genes and the TFs that are predicted totarget these genes. It can be performed both unsuper-vised and supervised. The unsupervised step allows fordata exploration and the identification of interestingtrends or splits in the data and the supervised stepallows us to identify which TFs are responsible for thesesplits. The supervised step incorporates the betweengroup analysis (BGA) classification method [20,21]which is used in combination with the ordinationmethod, forcing the ordination to be carried out ongroups of samples rather than individual samples. First,a normal NSC is performed; BGA then finds the linearcombination of the NSC axes that maximizes between-group variance and minimizes within-group variance, forspecified groups. The output from this analysis is aranked list of TFs predicted to be associated with thecellular response to lapatinib.Using this approach, we were able to identify 8 TFs
associated with the cellular response to lapatinib. Thisinformation was then used to generate a shortlist of 19genes based on; the magnitude of their response to lapa-tinib, whether they were predicted targets of the 8 TFsand the involvement of the gene in important oncogenicprocesses. Genes were manually selected on the basis ofmeeting two or more of these criteria and as representa-tives to validate the typically less quantitative array dataanalyses. This cohort of 27 genes was examined usingTaqman RT-PCR in a panel of 6 cell lines that had vary-ing sensitivities to lapatinib. 5 genes were significantlydifferentially expressed across all 6 cell lines (RB1CC1,FOXO3A, NR3C1, ERBB3 and CCND1) and the expres-sion of these 5 genes was directly correlated with the de-gree of sensitivity of each cell line to lapatinib.
Materials and methodsGene expression dataThe lapatinib-treated cell line dataset and experimentaldesign has been described previously [16] and wasobtained from the corresponding author in the form ofraw data files (.cel files). The normalised data file can bedownloaded from http://www.ebi.ac.uk/arrayexpress (ac-cession number: E-MEXP-440). Gene expression valueswere called using the robust multichip average method[22] and data were quantile normalized using the Bio-conductor package, affy. Affymetrix human genome HG-U133A arrays containing >22,000 probesets were usedin this experiment. Briefly, the experimental design wasas follows; four cell lines (BT474, SKBR3, T47D andMDAMB468) were analysed at 2, 6 and 12 hours posttreatment with 0.1% DMSO (the control), 0.1 μM lapati-nib and 1.0 μM lapatinib, with four replicates for each
time point/treatment. In addition, 0.1% DMSO-treatedcells were arrayed at 0 and 24 hours and 0.1 μM lapati-nib treated cells were arrayed at 24 hours. Again thesewere arrayed in quadruplicate. In total, there were 48arrays for each cell line. Our analysis focused on the twolapatinib sensitive cell lines, BT474 and SKBR3, com-prising a total of 96 arrays (including controls).Differential gene expression lists were generated using
the ebayes function of the limma [23] package from Bio-conductor. A fold change of ≥ 1.3 and an adjusted p-value of ≤ 0.05 were considered significant. The p-valuesare adjusted using the Benjamini and Hochberg method[24]. The choices of comparisons within the datasetswere guided by the unsupervised CIA. In total therewere 6 comparisons and these are summarised in Table 1.The final gene list was determined by consistent overlapbetween these 6 comparisons.The validity of choosing these six comparisons was
confirmed by differentially expression analysis to showthat early response in both BT474 and SKBR3 cells andlow dose lapatinib in BT474 cells results in little or nolapatinib responsive genes. As above the Bioconductorpackage, Limma was used, and a fold change of ≥ 1.3 andan adjusted p-value of ≤ 0.05 were considered significant.
Co-inertia analysisCIA, a multivariate coupling technique, was used in anunsupervised manner to combine the two linked data-sets; gene expression data from lapatinib-treated BT474and SKBR3 cell lines and predicted TFBS informationfor the same genes. This initial step was used for dataexploration and uses NSC. The analysis was then rerunin a supervised manner using BGA [14]. The outputfrom this analysis is a ranked list of TFs predicted to beassociated with the cellular response to lapatinib. Thesame 6 comparisons used to generate the differentiallyexpressed gene list were used to generate 6 ranked listsof TFs. The final TF list was determined by overlap be-tween these 6 ranked lists. All calculations were carriedout using the MADE4 library [25] of the open source Rpackage. MADE4 can be downloaded freely from theBioconductor web site http://www.bioconductor.org. Allthe scripts and datasets used are available upon requestfrom the authors.
Transcription factor binding site informationThe TFBS data has been previously published and con-tains information for 1236 known and predicted TFBSsacross the conserved proximal promoters for ~17,000genes at four different position specific scoring matrix(PSSM) thresholds, 0.7, 0.75, 0.8 and 0.85, giving 4 gene/TFBS frequency tables [14]. Using BGA with CIA, wewere able to combine this information with gene expres-sion data to gives 4 ranked lists of TFBS associated with

Table 1 A breakdown of the 6 comparisons for BT474 and SKBR3
Comparison Cell Line Groups Treatment Time Point Sample Number
1 BT474 Group 1 1 μM lapatinib 6 hr & 12 hr 8
Group 2 0.1 μM lapatinib 2 hr & 6 hr & 12 hr & 24 hr 16
1 μM lapatinib 2 hr 4
0.1% DMSO 0 hr & 2 hr & 6 hr & 12 hr & 24 hr 20
Total 48
2 BT474 Group 1 1 μM lapatinib 6 hr & 12 hr 8
Group 2 0.1 μM lapatinib 6 hr & 12 hr 8
Total 16
3 SKBR3 Group 1 1 μM lapatinib 6 hr & 12 hr 8
0.1 μM lapatinib 6 hr & 12 hr 8
Group 2 0.1 μM lapatinib 2 hr & 24 hr 8
1 μM lapatinib 2 hr 4
0.1% DMSO 0 hr & 2 hr & 6 hr & 12 hr & 24 hr 20
Total 48
4 SKBR3 Group 1 1 μM lapatinib 6 hr & 12 hr 8
0.1 μM lapatinib 6 hr & 12 hr 8
Group 2 0.1 μM lapatinib 2 hr 4
1 μM lapatinib 2 hr 4
0.1% DMSO 0 hr & 2 hr & 6 hr & 12 hr & 24 hr 20
Total 44
5 SKBR3 Group 1 1 μM lapatinib 12 hr 4
0.1 μM lapatinib 12 hr 4
Group 2 0.1 μM lapatinib 2 hr & 6 hr & 24 hr 12
1 μM lapatinib 2 hr & 6 hr 8
0.1% DMSO 0 hr & 2 hr & 6 hr & 12 hr & 24 hr 20
Total 48
6 SKBR3 Group 1 1 μM lapatinib 12 hr 4
0.1 μM lapatinib 12 hr 4
Group 2 0.1 μM lapatinib 2 hr & 6 hr 8
1 μM lapatinib 2 hr & 6 hr 8
0.1% DMSO 0 hr & 2 hr & 6 hr & 12 hr & 24 hr 20
Total 44
O’Neill et al. Molecular Cancer 2012, 11:41 Page 4 of 14http://www.molecular-cancer.com/content/11/1/41
a particular split of interest within the data; in this case,TFBS associated with the cellular response to lapatinib,for which we can infer the TFs linked with this response.The four lists were combined using the Rank Productsmethod [26] which was initially developed for combininglists of differentially expressed genes. This gives one finallist of ranked TFs.
Statistical overrepresentation of TFBSThe TFs identified from the supervised CIA were vali-dated using statistical overrepresentation of their pre-dicted target genes within the differentially expressedgene list. A one-tailed fisher exact test was used as we
are specifically interest in overrepresentation only[27,28]. The 421 consistently differentially expressedgenes and the 8252 genes for which promoter informa-tion was available and were present on the U133Aarrays, acted as the foreground and background for thefisher exact test respectively. The TFBS information isdescribed in the previous section.
Cell cultureSKBR3, HCC1954, EFM192A, MDAMB453 andMDAMB231 breast cancer cell lines were maintained inRPMI 1640 medium supplemented with 10% fetal bovineserum (PAA Labs, Austria). BT474 cells were maintained

O’Neill et al. Molecular Cancer 2012, 11:41 Page 5 of 14http://www.molecular-cancer.com/content/11/1/41
in Dulbeccos Modified Eagles medium (DMEM) supple-mented with 10% fetal bovine serum, 2%L-Glutamine(Sigma, St Louis, MO, USA) and 1% Sodium Pyruvate(Sigma). All cell lines were kept at 37 °C in a 5% CO2/95% air humidified incubator.
Lapatinib treatment and RNA extractionTriplicate samples were grown to approximately 75%confluency. Treated samples were conditioned with1 μM lapatinib for 12 hours. Control samples remaineduntreated. After the 12 hour incubation, the control andtreated samples underwent RNA isolation using a Qia-gen RNeasy mini Kit (Qiagen, Hilden, Germany) accord-ing to the manufacturer’s protocol and treated withQiagen RNase-free DNase. cDNA template was thenprepared from 2 μg of total RNA using an Applied Bio-systems high capacity RNA to cDNA kit (Applied Bio-systems, Foster City, CA, USA).
Taqman RT PCRTaqMan gene expression experiments were performedin 10 μl reactions in Taqman Array 96 well fast plates
Figure 1 Axes 1 (horizontal) and 3 (vertical) of the unsupervised CIAa PSSM threshold of 0.8 was used. (a) shows the projection of the cell lineblue 6 hr, light green 12 hr and orange 24 hr) and the 0.1 μM lapatinib tre24 hr) are split from the 1 μM lapatinib treated samples (purple 6 hr and psamples at 2 hours post treatment (grey). (B) Shows the projection of the Torigin) as a group of samples are associated with those samples.
which had been pre-seeded with assays for the genes ofinterest. 40 ng of cDNA template and 5 μl of Taqmanfast Universal Master Mix (2x), no AmpErase UNG (Ap-plied Biosystems, Foster City, CA, USA) were dispensedinto each well. The following thermal cycling specifica-tions were performed on the ABI 7900 Fast Real-TimePCR system (Applied Biosystems, Foster City, CA,USA); 20 s at 95 °C and 40 cycles each for 3 s at 95 °Cand 30 s at 60 °C. Expression values were calculatedusing the comparative threshold cycle (Ct) method [29].Glyceraldehyde-3-phosphate dehydrogenase (GAPDH)was selected as the endogenous control. The thresholdcycle (Ct) indicates the cycle number by which theamount of amplified target reaches a fixed threshold.The Ct data for GAPDH was used to create ΔCt values[ΔCt =Ct (target gene)-Ct (GAPDH)]. ΔΔCt values werecalculated by subtracting ΔCt of the calibrator (untreatedcontrols) from the ΔCt value of each target. Relativequantification (RQ) values were calculated using theequation 2-ΔΔCt. Genes with a fold change ± 2 in theBT474 and SKBR3 cell lines were deemed to be differen-tially expressed.
for BT474 cell line data. A gene/TFBS frequency table produced withsamples. The 0.1% DMSO treated samples (black 0 hr, red 2 hr, lightated samples (magenta 2 hr, dark blue 6 hr, cyan 12 hr and dark greenale blue 12 hr). The exception being the four 1 μM lapatinib treatedFBS motifs. Motifs that are in the same orientation (direction from the

Figure 2 Axes 1 (horizontal) and 2 (vertical) of theunsupervised CIA for SKBR3 cell line data. A gene/TFBSfrequency table produced with a PSSM threshold of 0.8 was used.Figure 2 (a) shows the projection of the cell line samples. The 0.1%DMSO treated samples (black 0 hr, red 2 hr, light blue 6 hr, lightgreen 12 hr and orange 24 hr), are split from the 0.1 μM lapatinibtreated samples (dark blue 6 hr, cyan 12 hr and dark green 24 hr)and the 1 μM lapatinib treated samples (purple 6 hr and pale blue12 hr). The exception being the eight 0.1 μM lapatinib and 1 μMlapatinib treated samples at 2 hours post treatment colouredmagenta and grey respectively. Figure,2 (b) Shows the projection ofthe TFBS motifs. Motifs that are in the same orientation (directionfrom the origin) as a group of samples are associated with thosesamples.
O’Neill et al. Molecular Cancer 2012, 11:41 Page 6 of 14http://www.molecular-cancer.com/content/11/1/41
Proliferation assay in vitroCells were cultured in 96 well flat bottomed plates for24 h before they were exposed to a range of concentra-tions of lapatinib for 6 days (0–20 μM for the insensitivecell lines and 0–1.5 μM for the sensitive cell lines). The% cell survival was then determined using an Acid Phos-phatase assay. Media was removed from plates, the wellswere washed twice with PBS and the cells were exposedto 10 mM PNP substrate in 0.1 M sodium acetate forapproximately 1 hour. The reaction was stopped using1 M NaOH and the plates were read at 405 nm and620 nm on the plate reader (Synergy HT, Bio-Tek). The% cell survival was calculated as a percentage of non-treated controls.
ResultsUnsupervised co-inertia analysis identifies prominenttrends in the BT474 and SKBR3 cell linesFor each cell line (BT474 and SKBR3) we used CIA tosimultaneously analyse mRNA expression levels andTFBS information in the promoters of the same genes.Unsupervised CIA was applied to the 48 microarrays foreach of the BT474 and SKBR3 cell lines and the asso-ciated gene/TFBS frequency tables to identify underlyingtrends in the data in each of the cell lines. The ultimategoal was to identify the TFs responsible for these trendsand the differentially regulated genes they were pre-dicted to target. The unsupervised CIA of the BT474and SKBR3 cell lines are shown in Figures 1 and 2 re-spectively and are described in the following sections.
Unsupervised co-inertia analysis of the BT474 cell lineidentifies a separation of 6- and 12-hour 1 μm lapatinibtreatment samplesAxes one and three of the CIA for BT474 are plotted inFigure 1a, for data exploration purposes. This allows usto estimate the response to lapatinib in the BT474 cellline. Axes one and three were chosen as they representthe dominant split within the data. The samples are la-belled based on time and treatment. The samples at 6hours and 12 hours post treatment with 1 μM lapatinib(purple 6 hr and pale blue 12 hr) clearly separated fromthose treated with 0.1% DMSO (black 0 hr, red 2 hr,light blue 6 hr, light green 12 hr and orange 24 hr), with0.1 μM lapatinib (magenta 2 hr, dark blue 6 hr, cyan12 hr and dark green 24 hr) and 2 hours post treatmentwith 1 μM lapatinib (grey), demonstrating a clear separ-ation in the data between 1 μM lapatinib treated cellsand the other samples. However, there was no differencebetween 0.1 μM lapatinib-treated and 0.1% DMSO-treated cells, suggesting that this is a dosage-dependentresponse in that a separation only occurred between thecontrol samples and the high dose lapatinib samples,with the exception of one outlier on the far right of the
plot. The lack of separation at 2 hours post treatmentwith 1 μM lapatinib suggests that the gene expressioneffects of the drug are not yet apparent at this timepoint. These observations guided our choice of compari-sons for both the supervised CIA and the differentialgene expression analysis which are summarised inTable 1.Figure 1b shows the motifs associated with this trend.
The most extreme motifs along each axis are labelled andnamed. Those motifs furthest from the origin in the sameorientation as the split of interest are most associated withthat split. In this case V. AHRARNT.02 was the motifmost associated with the separation of 1 μM lapatinibtreated cells from the other samples and therefore is themotif most associated with the response to lapatinib. Thisis the motif for the agonist-activated heterodimer AHR/ARNT (Aryl hydrocarbon receptor/Arnt (hypoxia indu-cible factor 1 beta)) which directly associates with the es-trogen receptors ER-alpha and ER-beta in ER-positivebreast cancer, although its function in HER2-positivebreast cancers is not well characterised [30].

Table 2 A ranked list of TFs associated with the responseof BT474 and SKBR3 to lapatinib
TF Motif ID Description
RAR V. RAR_RXR.02 Retinoic acid receptor
RXR V.RAR_RXR.02 Retinoid X receptor
ARNT V.AHRARNT.02 hypoxia inducible factor 1 beta
AHR V.AHRARNT.02 Aryl hydrocarbon receptor
ZNF143 V.STAF.02 Zinc finger protein 143
PAX9 V.PAX9.01 Paired box gene 9
OLF1 V.OLF1.01 Olfactory neuron-specific factor
PAX3 V.PAX3.01 Paired box gene 3
O’Neill et al. Molecular Cancer 2012, 11:41 Page 7 of 14http://www.molecular-cancer.com/content/11/1/41
Unsupervised co-inertia analysis of the SKBR3 cell lineidentifies a separation of 6- and 12-hour 0.1 μM and 1 μmlapatinib treatment samplesFigure 2a shows axes one and two of the CIA for SKBR3.The samples are labelled as before based on time andtreatment. There was a clear split between the 0.1 μM(dark blue 6 hr and cyan 12 hr) and 1 μM (purple 6 hrand pale blue 12 hr) lapatinib-treated cells at 6 and 12hours post treatment from the 0.1% DMSO treated con-trols (black 0 hr, red 2 hr, light blue 6 hr, light green12 hr and orange 24 hr), with the exception of one out-lier. As with the BT474 cell line there was no separationat 2 hours post treatment with 0.1 μM and 1 μM lapati-nib coloured magenta and grey respectively, suggestingthat the affects of the drug are not yet apparent at thistime point in both cell lines. However, in this cell linethe split occurred at both lapatinib dosages. Again, aswith the BT474 data, these analyses were used to guideour comparisons for the supervised CIA and the expres-sion analysis (Table 1).The motifs associated with this split in the data are in
the same orientation relative to the origin to our split ofinterest in Figure 2b. These include the VDR/RXR hetero-dimer (V.VDR_RXR.06, vitamin D receptor/retinoid X re-ceptor). This heterodimer has been previously associatedwith numerous cancers, including breast cancer [31].
Validation of the 6 comparisons chosen for supervisedCIAThe results from unsupervised CIA suggests that therewas no difference between control and treated cells atboth the high and low dose lapatinib at the 2 hour timepoint in both cell lines, and that there was no differencebetween treated and untreated BT474 cells at the 6 hrand 12 hr time point when low dose lapatinib was used.If this is the case there should be few differentially regu-lated genes at the early time point in both cell lines andat the low dose in the BT474 cell line. The results fromthese comparisons are shown in Additional file 1. Onaverage there are ~60 differentially regulated genes inthese comparisons compared to over ~2,500 differen-tially regulated genes when using the comparisons out-lined in Table 1 (data not shown). This markeddifference is a strong validation of our approach.
Supervised CIA identifies 8 putative transcription factorsassociated with the response to lapatinibIn order to systematically identify the TFBSs specificallyassociated with the response to lapatinib in these celllines (6 hr & 12 hr 1 μM lapatinib-treated samples vs.the other samples), we performed a supervised analysisof the data, combining CIA and BGA, as described. CIAwas performed twice in the BT474 dataset and fourtimes in the SKBR3 dataset (Table 1). This resulted in
six ranked lists of TFBS associated with a response tolapatinib treatment (Additional file 2). The 6 transcrip-tion factor motifs (representing 8 individual transcrip-tion factors) which were consistently ranked highlyacross the six comparisons are displayed in Table 2. Theindividual ranking for each of the 6 comparisons areavailable in Additional file 2. From these motifs we caninfer the 8 transcription factors which are driving the re-sponse to lapatinib in these cell lines.
Differential gene expression analysis of the BT474 andSKBR3 cell lines identifies a list of 421 genes associatedwith response to lapatinibThe same six comparisons outlined in Table 1 were usedto determine the genes which consistently respond tolapatinib treatment in both cell lines. In total, there were421 distinct genes (274 probes upregulated and 244probes downregulated) consistently dysregulated acrossthe six comparisons. The full list of dysregulated genes,with associated fold-changes and p-values, is available inAdditional file 3. A panel of 19 genes, in addition to theidentified TFs, were selected for further analyses usingqPCR based on varying combinations of the followingcriteria; (i) the magnitude of response to lapatinib, (ii)whether the selected genes were predicted targets of the8 TFs, (iii) the involvement of the gene in importantoncogenic processes (determined from functional anno-tation using the literature mining analysis software Path-way Studio Enterprise (Ariadne Genomics). Genes weremanually selected on the basis of meeting two or moreof these criteria and as representatives to validate thetypically less quantitative array data analyses. These 19genes are listed in Table 3 along with the TFs that arepredicted to target them.
The predicted targets of the majority of the TFs identifiedby CIA are statistically overrepresented in the 421 genesassociated with the response to lapatinibIn order to validate the results obtained by CIA we useda fisher exact test to determine if the predicted targets of
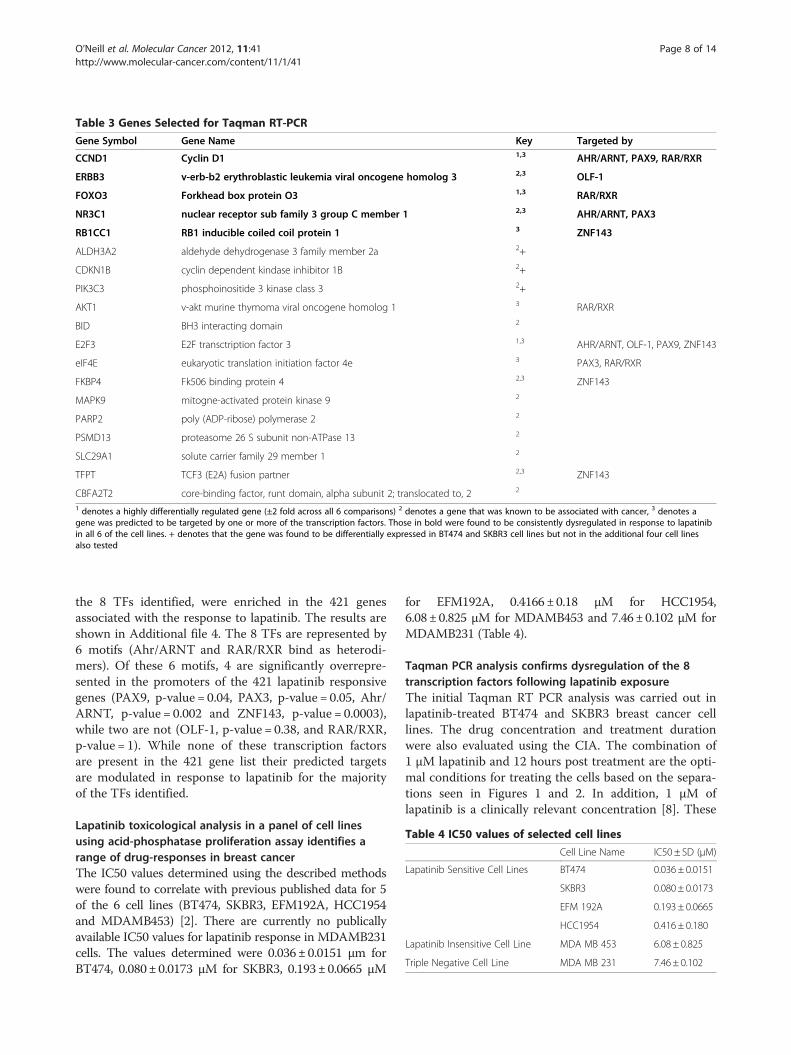
Table 3 Genes Selected for Taqman RT-PCR
Gene Symbol Gene Name Key Targeted by
CCND1 Cyclin D1 1,3 AHR/ARNT, PAX9, RAR/RXR
ERBB3 v-erb-b2 erythroblastic leukemia viral oncogene homolog 3 2,3 OLF-1
FOXO3 Forkhead box protein O3 1,3 RAR/RXR
NR3C1 nuclear receptor sub family 3 group C member 1 2,3 AHR/ARNT, PAX3
RB1CC1 RB1 inducible coiled coil protein 1 3 ZNF143
ALDH3A2 aldehyde dehydrogenase 3 family member 2a 2+
CDKN1B cyclin dependent kindase inhibitor 1B 2+
PIK3C3 phosphoinositide 3 kinase class 3 2+
AKT1 v-akt murine thymoma viral oncogene homolog 1 3 RAR/RXR
BID BH3 interacting domain 2
E2F3 E2F transctription factor 3 1,3 AHR/ARNT, OLF-1, PAX9, ZNF143
eIF4E eukaryotic translation initiation factor 4e 3 PAX3, RAR/RXR
FKBP4 Fk506 binding protein 4 2,3 ZNF143
MAPK9 mitogne-activated protein kinase 9 2
PARP2 poly (ADP-ribose) polymerase 2 2
PSMD13 proteasome 26 S subunit non-ATPase 13 2
SLC29A1 solute carrier family 29 member 1 2
TFPT TCF3 (E2A) fusion partner 2,3 ZNF143
CBFA2T2 core-binding factor, runt domain, alpha subunit 2; translocated to, 2 2
1 denotes a highly differentially regulated gene (±2 fold across all 6 comparisons) 2 denotes a gene that was known to be associated with cancer, 3 denotes agene was predicted to be targeted by one or more of the transcription factors. Those in bold were found to be consistently dysregulated in response to lapatinibin all 6 of the cell lines. + denotes that the gene was found to be differentially expressed in BT474 and SKBR3 cell lines but not in the additional four cell linesalso tested
Table 4 IC50 values of selected cell lines
Cell Line Name IC50 ± SD (μM)
Lapatinib Sensitive Cell Lines BT474 0.036 ± 0.0151
SKBR3 0.080 ± 0.0173
EFM 192A 0.193 ± 0.0665
HCC1954 0.416 ± 0.180
Lapatinib Insensitive Cell Line MDA MB 453 6.08 ± 0.825
Triple Negative Cell Line MDA MB 231 7.46 ± 0.102
O’Neill et al. Molecular Cancer 2012, 11:41 Page 8 of 14http://www.molecular-cancer.com/content/11/1/41
the 8 TFs identified, were enriched in the 421 genesassociated with the response to lapatinib. The results areshown in Additional file 4. The 8 TFs are represented by6 motifs (Ahr/ARNT and RAR/RXR bind as heterodi-mers). Of these 6 motifs, 4 are significantly overrepre-sented in the promoters of the 421 lapatinib responsivegenes (PAX9, p-value = 0.04, PAX3, p-value = 0.05, Ahr/ARNT, p-value = 0.002 and ZNF143, p-value = 0.0003),while two are not (OLF-1, p-value = 0.38, and RAR/RXR,p-value = 1). While none of these transcription factorsare present in the 421 gene list their predicted targetsare modulated in response to lapatinib for the majorityof the TFs identified.
Lapatinib toxicological analysis in a panel of cell linesusing acid-phosphatase proliferation assay identifies arange of drug-responses in breast cancerThe IC50 values determined using the described methodswere found to correlate with previous published data for 5of the 6 cell lines (BT474, SKBR3, EFM192A, HCC1954and MDAMB453) [2]. There are currently no publicallyavailable IC50 values for lapatinib response in MDAMB231cells. The values determined were 0.036± 0.0151 μm forBT474, 0.080±0.0173 μM for SKBR3, 0.193±0.0665 μM
for EFM192A, 0.4166±0.18 μM for HCC1954,6.08±0.825 μM for MDAMB453 and 7.46± 0.102 μM forMDAMB231 (Table 4).
Taqman PCR analysis confirms dysregulation of the 8transcription factors following lapatinib exposureThe initial Taqman RT PCR analysis was carried out inlapatinib-treated BT474 and SKBR3 breast cancer celllines. The drug concentration and treatment durationwere also evaluated using the CIA. The combination of1 μM lapatinib and 12 hours post treatment are the opti-mal conditions for treating the cells based on the separa-tions seen in Figures 1 and 2. In addition, 1 μM oflapatinib is a clinically relevant concentration [8]. These
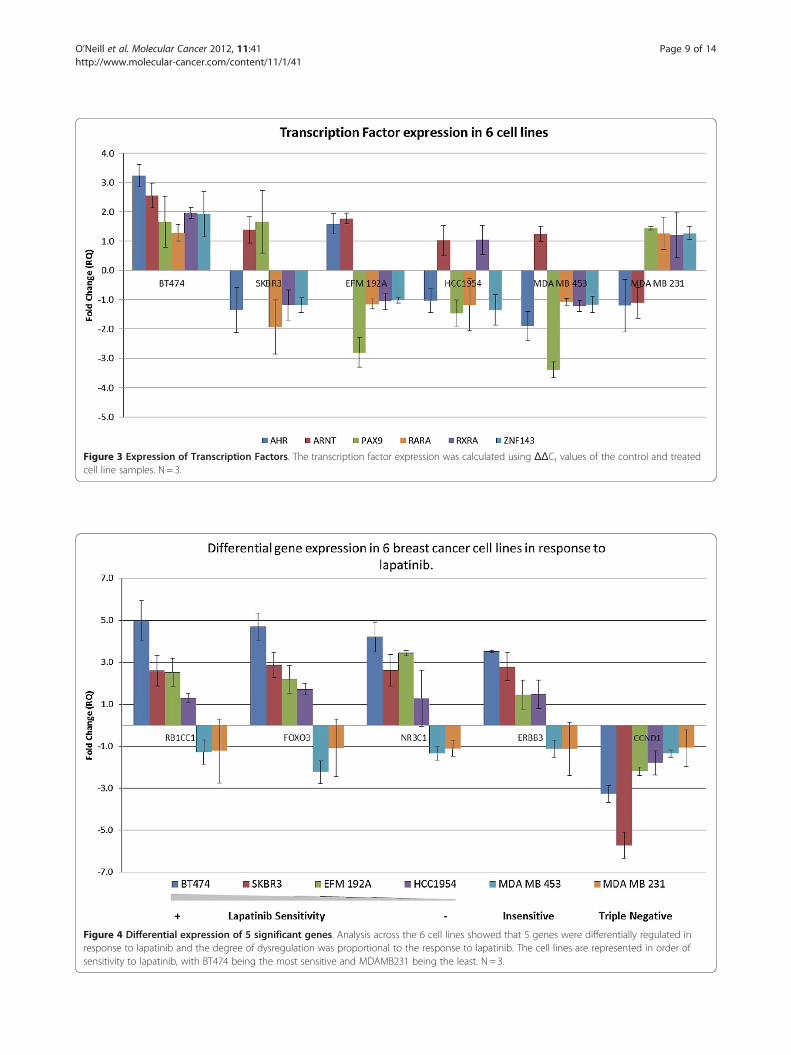
Figure 4 Differential expression of 5 significant genes. Analysis across the 6 cell lines showed that 5 genes were differentially regulated inresponse to lapatinib and the degree of dysregulation was proportional to the response to lapatinib. The cell lines are represented in order ofsensitivity to lapatinib, with BT474 being the most sensitive and MDAMB231 being the least. N = 3.
Figure 3 Expression of Transcription Factors. The transcription factor expression was calculated using ΔΔCt values of the control and treatedcell line samples. N = 3.
O’Neill et al. Molecular Cancer 2012, 11:41 Page 9 of 14http://www.molecular-cancer.com/content/11/1/41

O’Neill et al. Molecular Cancer 2012, 11:41 Page 10 of 14http://www.molecular-cancer.com/content/11/1/41
two cell lines are highly sensitive to lapatinib with IC50values of 0.036 μM±0.0151 μM and0.080 μM±0.0173 μM respectively (Table 4) [2]. Fouradditional cell lines were also chosen based on their sensi-tivity to lapatinib (EFM192A, HCC1954, MDAMB453 andMDAMB231). Their IC50 values are shown in Table 4.76 of the 8 transcription factors were found to be
present following 1 μM 12 hr lapatinib treatment relativeto untreated controls (Figure 3). Although these geneswere not identified from the differential gene expressionanalysis, they are clearly dysregulated in these cell lines, aspredicted by CIA. 2 of the predicted transcription factors(PAX3 and OLF1) were not expressed (data not shown).While the expression of the transcription factors does notfollow a set pattern, there are some distinct trends. For ex-ample, all the TFs were up-regulated in the mostlapatinib-sensitive cell line (BT474) and nearly all down-regulated in the most lapatinib-insensitive cell line (MDAMB 453). In addition ARNT was up-regulated in all lines,apart from MDAMB231, the triple negative cell line.
Taqman PCR analysis confirms a consistent dysregulationof 5 of the 19 additional genes selected for validation,following lapatinib exposureA panel of 19 genes was selected from the list of 421candidate genes as described (Table 3). As with the TFs,the 19 genes were first analysed for differential expres-sion in BT474 and SKBR3 cells that had been treatedwith 1 μM lapatinib for 12 hours using untreated cells asa control. Of the 19 genes 5 were found to be differen-tially expressed with an RQ value of ≥±2 in both theBT474 and SKBR3 cell lines (RB1CC1, FOXO3, NR3C1,ERBB3 and CCND1) (RQ values for all genes are avail-able in Additional file 5. Basal gene expression is avail-able for these 5 genes in Additional file 6, Figure S2). Ofthe remaining 14 genes (AKT1, ALDH3A2, BID,CDKN1B E2F3, eIF4E, FKBP4, MAPK9, PARP2, PIK3C3,PSMD13, SLC29A1, TFPT and CBFA2T2), some werefound to be differentially expressed, however, this alter-ation in expression did not occur in both of the cell linesand they were therefore excluded from further analysis.For further validation expression of, CCND1, ERBB3,
FOXO3, NR3C1 and RB1CC1, was analysed in two add-itional lapatinib-sensitive cell lines EFM192A andHCC1954. Both of these cell lines are HER2-positive andhave varying sensitivities to lapatinib, with IC50 valuesof 0.193 μM±0.0665 μM and 0.4166 μM±0.18 μM, re-spectively. Two lapatinib-insensitive cell lines were alsoanalysed, MDAMB453 and MDAMB231. MDAMB453 isa HER2-positive breast cancer cell line that is innatelyinsensitive to lapatinib and MDAMB231 is a triple nega-tive breast cancer cell line that has an IC50 value of7.46 ± 0.102 μM
In the lapatinib sensitive cell lines (BT474, SKBR3,EFM192A and HCC1954), the 5 genes showed differen-tial gene expression levels proportional to the degree ofsensitivity of the cells to lapatinib and are highlighted inbold in Table 3.Figure 4 shows the expression profiles of RB1CC1,
FOXO3A, NR3C1 and ERBB3 in the four lapatinib-sensitive cell lines and clearly demonstrates a correlationbetween the degree of sensitivity of the cell line to lapa-tinib and the magnitude of differential gene expression.BT474 was the most lapatinib-sensitive cell line and dis-played the highest differential expression values for thefour upregulated genes. As the cell lines became lesssensitive to lapatinib, the magnitude of differential geneexpression decreases. In the lapatinib-insensitive celllines, MDAMB453 and MDAMB231, the expression ofthese genes “switched” from up-regulation followinglapatinib exposure to down-regulation.In the case of CCND1, the differential gene expression
pattern followed a largely proportional response and nota “switching” response which was evident with the othergenes. In the lapatinib-sensitive cell lines the gene wasfound to be strongly down-regulated following the 12 hrtreatment. The magnitude of this down-regulation wasreduced as the cells became more lapatinib-insensitive(Figure 4).
DiscussionIn this paper, we describe the application of a method(CIA) for inferring the action of TFs by integrating theinformation provided by TFBS target prediction withmRNA gene expression data [14] to identify possiblemarkers for early lapatinib response. This is the firsttime this approach has been used to analyse an arraydata set derived from breast cancer cells treated with atargeted therapeutic. This multivariate statistical tech-nique was applied to gene expression data incorporatingtime series data post treatment with high and low doselapatinib in lapatinib-sensitive, HER2-positive cell lines(48 microarrays on both BT474 and SKBR3 cell lines).This method was initially used for data exploration todetermine the gene expression response to lapatinib.This response appears to require a high dose of lapatinibin BT474 cells (1 μM lapatinib) and require low to highdose in SKBR3 cells (0.1 μM or 1 μM lapatinib). Differ-ential gene expression analysis at early times or lose doselapatinib confirmed this, as we were unable to identify asubstantial gene list at low dose lapatinib in BT474 cellsand at the 2 hr time point in either cell line, providing astrong validation of our approach. Once the lapatinib re-sponse was determined, CIA was used in a supervisedmanner to identify 8 TFs associated with response tolapatinib. It is important to note that none of these TFswere associated with the lapatinib response through

O’Neill et al. Molecular Cancer 2012, 11:41 Page 11 of 14http://www.molecular-cancer.com/content/11/1/41
standard differential expression analysis and their priori-tisation here was only achieved via the novel use of theCIA method in this breast cancer dataset. Statisticaloverrepresentation of these TFs in the promoters of the421 differentially regulated genes was used to furtherconfirm of the validity of the approach we used here. 4of the 6 motifs (representing the 8TFs) were statisticallyoverrepresented in the lapatinib responsive gene list(PAX9, PAX3, Ahr/ARNT and ZNF143). While OLF-1and RAR/RXR expression levels were not statisticallysignificant within this gene list, it is not unexpected, asCIA is not restricted to a specific gene list but ratheruses the entire microarray data as input. CIA is thereforenot limited by arbitrary cut-offs which may exclude im-portant TFs of interest. Overall the target genes of theTFs identified by CIA show higher than expected modu-lation by lapatinib, even though the TFs themselves arenot differentially regulated.These 8 TFs and an additional 19 putative markers
were then validated using qPCR in a panel of breast can-cer cell lines following treatment with 1 μM lapatinib for12hours. The results suggest that the 5 genes RB1CC1,NR3C1, FOXO3A, ERBB3 and CCND1, which had beenfound to be differentially regulated in response to lapati-nib treatment could be utilised as potential markers forearly lapatinib response as their expression correlateswith the sensitivity of the cell lines to lapatinib.The expression of 6 TFs, AHR, ARNT, RXR, RAR,
PAX9 and ZNF143 were found to be altered across allthe cell lines in response to lapatinib treatment. TheseTFs are putative regulators of the cellular response tolapatinib and are predicted to target a number of the sig-nificantly differentially regulated genes. The expressionof these TFs does not follow a set pattern but do followsome distinct trends as mentioned above, however, theregulation of gene expression by TFs is difficult to dis-cern directly from the expression pattern of the TF genesthemselves. All of these TFs have been previouslydemonstrated to play important roles in cancer, althoughtheir function in HER2-positive breast cancer is unclear.The AHR/ARNT heterodimer has been implicated ashaving importance in ER positive breast cancer and hasbeen shown to directly associate with estrogen receptorsER-alpha and ER-beta [30,32,33]. Retinoids targeting theRXR/RAR heterodimer have marked affects on cellularprocesses such as proliferation and apoptosis and thishas been shown both in vivo and in vitro in breast can-cer models [34]. The RARA receptor has also been re-cently identified as being co-amplified with HER2 insome breast cancers [35]. While being known onco-genes, PAX9 and ZNF143 have not been extensivelystudied in breast cancer [36,37] and none of these TFshave previously been implicated in the response tolapatinib.
From the panel of 5 genes, 4 were upregulated in re-sponse to lapatinib, RB1CC1, NR3C1, FOXO3A andERBB3. The expression of these genes correlated withthe sensitivity of each cell line to lapatinib. The resultsshow that the more sensitive that the cell line is to lapa-tinib, which was determined using proliferation assays,the greater the magnitude of up-regulation of the 4genes. The genes then “switch” to down-regulation inthe remaining two lapatinib insensitive cell lines(MDAMB453 and MDAMB231). In the case of CCND1,this switching phenomenon is not evident; rather the ex-pression of CCND1 becomes less down-regulated as thelevel of lapatinib sensitivity decreases.All 5 of the genes have been previously demonstrated
to have importance in cancer. RB1 inducible coiled-coil1 (RB1CC1) expression has been shown to be associatedwith long term survival of breast cancer patients and hasbeen found to have a role in the inhibition G1-S pro-gression and proliferation in breast cancer cell lines[38,39]. NR3C1, a glucocorticoid receptor, has beenassociated with poor response to treatment in multiplemyeloma samples [40]. Up-regulation of ERBB3 (HER3)has been connected with invasive breast carcinomas andalso drug resistance in some HER2-overexpressing can-cers [41].FOXO3A and CCND1 have been demonstrated to be
important in both breast cancer and the lapatinib re-sponse [16,42]. FOXO3A and CCND1 were both shownby [16] to be differently expressed following treatmentwith lapatinib. This group reported up-regulation ofFOXO3A in both BT474 and SKBR3 and also a down-regulation of CCND1 in the same cell lines. Theseresults are consistent with the results obtained by ourstudy. It should be noted that CDKN1B was also differ-entially expressed in response to lapatinib in our study,[16] although its dysregulation did not correlate withlapatinib sensitivity (Additional file 6 figure S1). Theauthors identified that these three genes all played rolesin the regulation of the AKT pathway, both positive andnegative. They noted that the down regulation ofCCND1 and that the upregulation of CDKN1B in re-sponse to lapatinib could be as a result of a FOXO3A-dependent mechanism, which promotes lapatinib-induced apoptosis. However, they did not examine theexpression of these genes in other lapatinib sensitivecells lines nor did they observe that the expression ofthese genes correlated with the sensitivity of the celllines to lapatinib. They also observed additional changesin response to genes associated with a number of cellu-lar processes such as glycolysis and cell cycle regulation.Interestingly, CCND1 links all of these genes together
both at the TF level (it is predicted to be targeted byAHR/ARNT, RXR/RAR and PAX9) and at the gene levelvia several interactions. CCND1 was downregulated in
O’Neill et al. Molecular Cancer 2012, 11:41 Page 12 of 14http://www.molecular-cancer.com/content/11/1/41
response to lapatinib in our panel of cell lines which isconsistent with previous studies [43-45] and which mayalso be related to its known interactions with our othergenes of interest. FOXO3A has been shown to down-regulate CCND1 during cell cycle inhibition [46], whileErbb3 receptors are thought to be required to reducetranscription of E2F mediated transcription factors,which include CCND1 [47]. NR3C1 has been noted toinhibit CCND1 activation, through the TCF/ß-catenincomplex [48,49] and RB1CC1 has been found to de-crease the expression of CCND1 by promoting its deg-radation [39]. Also, AHR/ARNT has been shown toregulate cell cycle progression via a functional inter-action with CDK4/CCND1 [32] and retinoids (RXR/RAR receptor ligands) are known to inhibit CCND1 ex-pression [50].Of the 5 lapatinib-responsive genes, FOXO3A and
CCND1 were previously described in lapatinib-treatedBT474 and SKBR3 cell lines by the group that generatedthe original microarray dataset [16]. However, the inclu-sion of the additional 4 cell lines allowed us to examinethe 5 differentially expressed genes in the context of celllines with varying sensitivities to lapatinib. The upregula-tion of RB1CC1 and NR3C1 in response to lapatinib hasnot been previously observed, while only limited workhas been performed on ERBB3, FOXO3A and CCND1in this setting. While the analysis described in this workis of a descriptive nature, a number of these genes in-cluding, FOXO3a (Mickey C.-T Hu et al.) and ERBB3(Liu, B et al.) have been successfully functionally vali-dated as being important in breast cancer response[51,52] .The methods we have employed represent an attract-
ive approach to dissection of the underlying gene ex-pression changes associated with the response of cellularmodels of breast cancer (with differing inherent sensitiv-ity) to lapatinib treatment. Our experimental design gen-erated a list of gene changes that directly correlate withresponse to lapatinib in breast cancer. Since the list ishighly enriched for genes likely to be of importance inlapatinib response, our findings therefore representinteresting candidates as biomarkers of response orfunctional targets for therapeutic intervention to im-prove response/overcome resistance.
ConclusionsIn summary, we used CIA to identify a number ofgenes and TFs associated with the cellular responseto lapatinib. This is the first time that this techniquehas been applied to a dataset derived from drug-treated breast cancer cells. This panel included bothknown and novel markers of the lapatinib responseand represents an ideal cohort of markers both forthe response to lapatinib and the cellular sensitivity
to lapatinib. The expression of 5 of these genes corre-lated directly with lapatinib sensitivity. We identifiedknown lapatinib response genes such as FOXO3A,CDKN1B and CCND1, as well as novel responders tolapatinib, RB1CC1 and NR3C1. In addition, we haveidentified putative candidate regulators of this lapati-nib response, none of which have been previouslystudied in lapatinib-treated cells. Since our methodshighly enrich for genes likely to be of importance inthe drug response, they represent a novel route toidentification of putative response biomarkers or tar-gets for therapeutic intervention to increase treatmentefficacy.
Additional file
Additional File 1 Lapatinib modulated genes responding early or at lowdosage.
Additional File 2 A ranked list of TFBS associated with a response tolapatinib treatment for each of the 6 comparisons in 0 Table 1.Highlighted in bold are those TFBS consistent across the 6 comparisons.
Additional File 3 A full list of the differentially regulated genes and theTFs that are predicted to target them. This file also contains the foldchange and the adjusted p-value for each of the six comparisons.
Additional File 4 Statistical Overrepresentation of the TFs identified byCIA.
Additional File 5 RQ values for all genes tested, including the TFs.
Additional File 6 Figure S1. Expression of PIK3C3, ALDH3A2 andCDKN1B across the six cell lines. Figure S2. Basal gene expression (ΔCt)of RB1CC1, FOXO3A, NR3C1, ERBB3 and CCND1 across the six cell lines.
AbbreviationsHER2: Human epidermal growth factor Receptor 2; EGFR: Epidermal growthfactor receptor; Erk/MAPK: Extracellular-signal-regulated kinase/mitogen-activated protein kinase; PI3K: Phosphatidylinositol 3-kinases; CIA: Co-inertiaanalysis; TFBS: Transcription factor binding site; TF: Transcription factors;NSC: Non-symmetric correspondance analyses; PCA: Principal componentsanalysis; BGA: Between group analysis; PSSM: Position specific scoring matrix;GAPDH: Glyceraldehyde-3-phosphate dehydrogenase; PNP: P-nitrophenolphosphate; RQ: Relative quantification; VDR/RXR: Vitamin D receptor/retinoidX receptor; RB1CC1: RB1 inducible coiled-coil 1; RAR: Retinoic acid receptor;RXR: Retinoid X receptor; ARNT: Hypoxia inducible factor 1 beta; AHR: Arylhydrocarbon receptor; ZNF143: Zinc finger protein 143; PAX9: Paired boxgene 9; OLF1: Olfactory neuron-specific factor; PAX3: Paired box gene 3;AKT1: V-akt murine thymoma viral oncogene homolog 1; FOXO3: Forkheadbox protein O3; CCND1: Cyclin D1; E2F3: E2F transcription factor 3;eIF4E: Eukaryotic translation initiation factor 4e; RB1CC1: Retinoblastoma 1inducible coiled coil protein 1; ERBB3: V-erb-b2 erythroblastic leukemia viraloncogene homolog 3; MAPK9: Mitogen-activated protein kinase 9;FKBP4: Fk506 binding protein 4; TFPT: TCF3 (E2A) fusion partner;NR3C1: Nuclear receptor sub family 3 group C member 1;ALDH3A2: Aldehyde dehydrogenase 3 family member 2a;PIK3C3: Phosphoinositide 3 kinase class 3; BID: BH3 interacting domain;PARP2: Poly (ADP-ribose) polymerase 2; PSMD13: Proteasome 26 S subunitnon-ATPase 13; SLC29A1: Solute carrier family 29 member 1; CDKN1B: Cyclindependent kinase inhibitor 1B.
Competing interestsThe authors declare that they have no competing interests.
AcknowledgementsThe authors wish to thank the Science Foundation Ireland, StrategicResearch Cluster award to Molecular Therapeutics for Cancer Ireland (award08/SRC/B1410) for funding this work.
O’Neill et al. Molecular Cancer 2012, 11:41 Page 13 of 14http://www.molecular-cancer.com/content/11/1/41
Authors’ contributionsFON and SFM contributed equally to this work. SFM performed all of thebioinformatic/statistical analysis. FON treated the cells with lapatinibextracted the RNA and performed Taqman RT PCR and the proliferationassay. STA participated in the study design, RNA extraction and TaqMan RTPCR and analysis and interpretation of the results. FON, SFM, STA, JC, MCROC and PD contributed to the result interpretation and manuscriptpreparation. ROC and PD equally conceived the study, participated in itsdesign, coordination and interpretation of the results and finalized themanuscript. All authors read and approved the final manuscript.
Received: 16 February 2012 Accepted: 18 June 2012Published: 18 June 2012
References1. Ferlay J, Shin H, Bray F, Forman D, Mathers C, Parkin DM: Estimates of
worldwide burden of cancer in 2008: GLOBOCAN 2008. Int J Cancer 2010,127:2893–2917.
2. O'Brien NA, Browne BC, Chow L, Wang Y, Ginther C, Arboleda J, Duffy MJ,Crown J, O'Donovan N, Slamon DJ: Activated phosphoinositide 3-kinase/AKT signaling confers resistance to trastuzumab but not lapatinib. MolCancer Ther 2010, 9:1489–1502.
3. Slamon DJ, Clark GM, Wong SG, Levin WJ, Ullrich A, McGuire WL: Humanbreast cancer: correlation of relapse and survival with amplification ofthe HER-2/neu oncogene. Science 1987, 235:177–182.
4. Ross JS, Fletcher JA: The HER-2/neu oncogene in breast cancer:prognostic factor, predictive factor, and target for therapy. Stem Cells1998, 16:413–428.
5. Sawyers C: Targeted cancer therapy. Nature 2004, 432:294–297.6. Paul MK, Mukhopadhyay AK: Tyrosine kinase - Role and significance in
Cancer. Int J Med Sci 2004, 1:101–115.7. Arora A, Scholar EM: Role of Tyrosine Kinase Inhibitors in Cancer Therapy.
J Pharmacol Exp Ther 2005, 315:971–979.8. Burris HA, Hurwitz HI, Dees EC, Dowlati A, Blackwell KL, O'Neil B, Marcom PK,
Ellis MJ, Overmoyer B, Jones SF, Harris JL, Smith DA, Koch KM, Stead A,Mangum S, Spector NL: Phase I safety, pharmacokinetics, and clinicalactivity study of lapatinib (GW572016), a reversible dual inhibitor ofepidermal growth factor receptor tyrosine kinases, in heavily pretreatedpatients with metastatic carcinomas. J Clin Oncol 2005, 23:5305–5313.
9. Rusnak DW, Lackey K, Affleck K, Wood ER, Alligood KJ, Rhodes N, Keith BR,Murray DM, Knight WB, Mullin RJ, Gilmer TM: The effects of the novel,reversible epidermal growth factor receptor/ErbB-2 tyrosine kinaseinhibitor, GW2016, on the growth of human normal and tumor-derivedcell lines in vitro and in vivo. Mol Cancer Ther 2001, 1:85–94.
10. Geyer CE, Forster J, Lindquist D, Chan S, Romieu CG, Pienkowski T, Jagiello-Gruszfeld A, Crown J, Chan A, Kaufman B, Skarlos D, Campone M, DavidsonN, Berger M, Oliva C, Rubin SD, Stein S, Cameron D: Lapatinib pluscapecitabine for HER2-positive advanced breast cancer. N Engl J Med2006, 355:2733–2743.
11. Konecny GE, Pegram MD, Venkatesan N, Finn R, Yang G, Rahmeh M, UntchM, Rusnak DW, Spehar G, Mullin RJ, Keith BR, Gilmer TM, Berger M, PodratzKC, Slamon DJ: Activity of the dual kinase inhibitor lapatinib (GW572016)against HER-2-overexpressing and trastuzumab-treated breast cancercells. Cancer Res 2006, 66:1630–1639.
12. Gomez HL, Doval DC, Chavez MA, Ang PC, Aziz Z, Nag S, Ng C, Franco SX,Chow LWC, Arbushites MC, Casey MA, Berger MS, Stein SH, Sledge GW:Efficacy and safety of lapatinib as first-line therapy for ErbB2-amplifiedlocally advanced or metastatic breast cancer. J Clin Oncol 2008, 26:2999–3005.
13. Blackwell KL, Burstein HJ, Storniolo AM, Rugo H, Sledge G, Koehler M, Ellis C,Casey M, Vukelja S, Bischoff J, Baselga J, O'Shaughnessy J: Randomizedstudy of Lapatinib alone or in combination with trastuzumab in womenwith ErbB2-positive, trastuzumab-refractory metastatic breast cancer. JClin Oncol 2010, 28:1124–1130.
14. Jeffery IB, Madden SF, McGettigan PA, Perriere G, Culhane AC, Higgins DG:Integrating transcription factor binding site information with geneexpression datasets. Bioinformatics 2007, 23:298–305.
15. Dolédec S, Chessel D: Co-inertia analysis: an alternative method forstudying species - environment relationships. Freshw Biol 1994, 31:294–277.
16. Hegde PS, Rusnak D, Bertiaux M, Alligood K, Strum J, Gagnon R, Gilmer TM:Delineation of molecular mechanisms of sensitivity to lapatinib in breastcancer cell lines using global gene expression profiles. Mol Cancer Ther2007, 6:1629–1640.
17. Dray S, Chessel D, Thioulouse J: Co-inertia analysis and the linking ofecological data tables. Ecology 2003, 84:3078–3089.
18. Madden S, Carpenter S, Jeffery I, Bjorkbacka H, Fitzgerald K, O'Neill L,Higgins D: Detecting microRNA activity from gene expression data. BMCBioinforma 2010, 11:257.
19. Fagan A, Culhane AC, Higgins DG: A multivariate analysis approach to theintegration of proteomic and gene expression data. Proteomics 2007,7:2162–2171.
20. Dolédec S, Chessel D: Rhythmes saisonniers et composantes stationellesen milieu aquatique I—Description d'un plan d'observations completpar projection de variables. Acta Oecologica Oecologica Generalis 1987,8:403–426.
21. Culhane AC, Perrière G, Considine EC, Cotter TG, Higgins DG: Between-group analysis of microarray data. Bioinformatics 2002, 18:1600–1608.
22. Irizarry RA, Hobbs B, Collin F, Beazer-Barclay YD, Antonellis KJ, Scherf U,Speed TP: Exploration, normalization, and summaries of high densityoligonucleotide array probe level data. Biostatistics 2003, 4:249–264.
23. Smyth GK: Linear models and empirical bayes methods for assessingdifferential expression in microarray experiments. Stat Appl Genet Mol Biol2004, 3:Article3.
24. Benjamini Y, Hochberg Y: Controlling the False Discovery Rate: A Practicaland Powerful Approach to Multiple Testing. J Royal Statistical Soc Series B(Methodological) 1995, 57:289–300.
25. Culhane AC, Thioulouse J, Perrière G, Higgins DG: MADE4: an R packagefor multivariate analysis of gene expression data. Bioinformatics 2005,21:2789–2790.
26. Breitling R, Armengaud P, Amtmann A, Herzyk P: Rank products: a simple,yet powerful, new method to detect differentially regulated genes inreplicated microarray experiments. FEBS Lett 2004, 573:83–92.
27. Ho Sui SJ, Fulton DL, Arenillas DJ, Kwon AT, Wasserman WW: oPOSSUM:integrated tools for analysis of regulatory motif over-representation.Nucleic Acids Res 2007, 35:W245–W252.
28. Leonard MO, Howell K, Madden SF, Costello CM, Higgins DG, Taylor CT,McLoughlin P: Hypoxia selectively activates the CREB family oftranscription factors in the in vivo lung. Am J Respir Crit Care Med 2008,178:977–983.
29. Livak KJ, Schmittgen TD: Analysis of relative gene expression data usingreal-time quantitative PCR and the 2(−Delta Delta C(T)) Method. Methods2001, 25:402–408.
30. Rüegg J, Swedenborg E, Wahlström D, Escande A, Balaguer P, Pettersson K,Pongratz I: The transcription factor aryl hydrocarbon receptor nucleartranslocator functions as an estrogen receptor beta-selective coactivator,and its recruitment to alternative pathways mediates antiestrogeniceffects of dioxin. Mol Endocrinol 2008, 22:304–316.
31. Conde I, Paniagua R, Fraile B, Ruiz A, Arenas MI: Expression of vitamin D3receptor and retinoid receptors in human breast cancer: identification ofpotential heterodimeric receptors. Int J Oncol 2004, 25:1183–1191.
32. Barhoover MA, Hall JM, Greenlee WF, Thomas RS: Aryl hydrocarbonreceptor regulates cell cycle progression in human breast cancer cellsvia a functional interaction with cyclin-dependent kinase 4. MolPharmacol 2010, 77:195–201.
33. Safe S, Krishnan V: Cellular and molecular biology of aryl hydrocarbon(Ah) receptor-mediated gene expression. Arch Toxicol Suppl 1995, 17:99–115.
34. Darro F, Cahen P, Vianna A, Decaestecker C, Nogaret JM, Leblond B,Chaboteaux C, Ramos C, Pétein M, Budel V, Schoofs A, Pourrias B, Kiss R:Growth inhibition of human in vitro and mouse in vitro and in vivomammary tumor models by retinoids in comparison with tamoxifen andthe RU-486 anti-progestagen. Breast Cancer Res Treat 1998, 51:39–55.
35. Paroni G, Fratelli M, Gardini G, Bassano C, Flora M, Zanetti A, Guarnaccia V,Ubezio P, Centritto F, Terao M, Garattini E: Synergistic antitumor activity oflapatinib and retinoids on a novel subtype of breast cancer withcoamplification of ERBB2 and RARA. Oncogene 2011. doi:10.1038/onc.2011.506.
36. Wakasugi T, Izumi H, Uchiumi T, Suzuki H, Arao T, Nishio K, Kohno K:ZNF143 interacts with p73 and is involved in cisplatin resistancethrough the transcriptional regulation of DNA repair genes. Oncogene2007, 26:5194–5203.

O’Neill et al. Molecular Cancer 2012, 11:41 Page 14 of 14http://www.molecular-cancer.com/content/11/1/41
37. Tan K, Shaw AL, Madsen B, Jensen K, Taylor-Papadimitriou J, Freemont PS:Human PLU-1 Has transcriptional repression properties and interactswith the developmental transcription factors BF-1 and PAX9. J Biol Chem2003, 278:20507–20513.
38. Chano T, Ikebuchi K, Ochi Y, Tameno H, Tomita Y, Jin Y, Inaji H, Ishitobi M,Teramoto K, Nishimura I, Minami K, Inoue H, Isono T, Saitoh M, Shimada T,Hisa Y, Okabe H: RB1CC1 Activates RB1 Pathway and Inhibits Proliferationand Cologenic Survival in Human Cancer. PLoS One 2010, 5:e11404.
39. Melkoumian ZK, Peng X, Gan B, Wu X, Guan J: Mechanism of Cell CycleRegulation by FIP200 in Human Breast Cancer Cells. Cancer Res 2005,65:6676–6684.
40. Patel AS, Karagas MR, Spencer SK, Perry AE, Nelson HH: Gene-druginteraction at the glucocorticoid receptor increases risk of squamous cellskin cancer. AACR Meeting Abstracts 2006, 2006:1071.
41. Kim HH, Sierke SL, Koland JG: Epidermal growth factor-dependentassociation of phosphatidylinositol 3-kinase with the erbB3 geneproduct. J Biol Chem 1994, 269:24747–24755.
42. Paik J, Kollipara R, Chu G, Ji H, Xiao Y, Ding Z, Miao L, Tothova Z, Horner JW,Carrasco DR, Jiang S, Gilliland DG, Chin L, Wong WH, Castrillon DH, DePinhoRA: FoxOs Are Lineage-Restricted Redundant Tumor Suppressors andRegulate Endothelial Cell Homeostasis. Cell 2007, 128:309–323.
43. D'Alessio A, De Luca A, Maiello MR, Lamura L, Rachiglio AM, Napolitano M,Gallo M, Normanno N: Effects of the combined blockade of EGFR andErbB-2 on signal transduction and regulation of cell cycle regulatoryproteins in breast cancer cells. Breast Cancer Res Treat 2010, 123:387–396.
44. LaBonte MJ, Wilson PM, Fazzone W, Russell J, Louie SG, El-Khoueiry A, LenzH, Ladner RD: The Dual EGFR/HER2 Inhibitor Lapatinib SynergisticallyEnhances the Antitumor Activity of the Histone Deacetylase InhibitorPanobinostat in Colorectal Cancer Models. Cancer Res 2011, 71:3635–3648.
45. Lui VWY, Lau CPY, Ho K, Ng MHL, Cheng SH, Tsao S, Tsang CM, Lei KIK,Chan AT, Mok TSK: Anti-invasion, anti-proliferation and anoikis-sensitization activities of lapatinib in nasopharyngeal carcinoma cells.Invest New Drugs 2011, 29:1241–1252.
46. Schmidt M, Fernandez de Mattos S, van der Horst A, Klompmaker R, KopsGJPL, Lam EW, Burgering BMT, Medema RH: Cell Cycle Inhibition by FoxOForkhead Transcription Factors Involves Downregulation of Cyclin D. MolCell Biol 2002, 22:7842–7852.
47. Zhang Y, Hamburger AW: Heregulin regulates the ability of the ErbB3-binding protein Ebp1 to bind E2F promoter elements and repress E2F-mediated transcription. J Biol Chem 2004, 279:26126–26133.
48. Ayroldi E, Zollo O, Bastianelli A, Marchetti C, Agostini M, Di Virgilio R,Riccardi C: GILZ mediates the antiproliferative activity of glucocorticoidsby negative regulation of Ras signaling. J Clin Invest 2007, 117:1605–1615.
49. Takayama S, Rogatsky I, Schwarcz LE, Darimont BD: The glucocorticoidreceptor represses cyclin D1 by targeting the Tcf-beta-catenin complex.J Biol Chem 2006, 281:17856–17863.
50. Chen Y, Dokmanovic M, Stein WD, Ardecky RJ, Roninson IB: Agonist andAntagonist of Retinoic Acid Receptors Cause Similar Changes in GeneExpression and Induce Senescence-like Growth Arrest in MCF-7 BreastCarcinoma Cells. Cancer Res 2006, 66:8749–8761.
51. Hu MC, Lee D, Xia W, Golfman LS, Ou-Yang F, Yang J, Zou Y, Bao S, HanadaN, Saso H, Kobayashi R, Hung M: IkappaB kinase promotes tumorigenesisthrough inhibition of forkhead FOXO3a. Cell 2004, 117:225–237.
52. Liu B, Ordonez-Ercan D, Fan Z, Edgerton SM, Yang X, Thor AD:Downregulation of erbB3 abrogates erbB2-mediated tamoxifenresistance in breast cancer cells. Int J Cancer 2007, 120:1874–1882.
doi:10.1186/1476-4598-11-41Cite this article as: O’Neill et al.: Gene expression changes as markers ofearly lapatinib response in a panel of breast cancer cell lines. MolecularCancer 2012 11:41.
Submit your next manuscript to BioMed Centraland take full advantage of:
• Convenient online submission
• Thorough peer review
• No space constraints or color figure charges
• Immediate publication on acceptance
• Inclusion in PubMed, CAS, Scopus and Google Scholar
• Research which is freely available for redistribution
Submit your manuscript at www.biomedcentral.com/submit