gender gap in admission performance under competitive pressure
TRANSCRIPT

Gender Gap in Admission Performance underCompetitive Pressure
�tµepán Jurajda and Daniel MünichCERGE-EI
December 22, 2010
Abstract
Do women perform worse than equally able men in stressful competitive settings?We ask this question for competitions with a high payo¤� admissions to tuition-freeselective universities. With data on an entire cohort of Czech students graduatingfrom secondary schools and applying to universities, we show that, compared to menof similar general skills and subject-of-study preferences, women do not shy away fromapplying to more competitive programs and perform similarly well when competitionis less intense, but perform substantially worse (are less likely to be admitted) whenapplying to very selective universities. This comparison holds even when controllingfor unobservable skills.JEL Codes: J16, I29Keywords: Gender Gap in Performance, Test Anxiety, Competition, Admissions
Acknowledgements CERGE-EI is a joint workplace of the Center for Economic Research and Graduate
Education, Charles University, and the Economics Institute of the Academy of Sciences of the Czech Republic.
Both authors are Research A¢ liates at CEPR, London; Jurajda is also Research Fellow at IZA, Bonn. The
help of Petr Mat¼ej°u and Jindµrich Krejµcí from the Sociological Institute of the Czech Academy of Sciences
and Vladimír Burda (formerly of the Czech National Institute of Technical and Vocational Education) in
acquiring and processing the Sonda Maturant data is gratefully acknowledged, as are comments from Alena
Biµcáková and Andreas Ortmann.
Address CERGE-EI, Charles University Prague and Academy of Sciences of the Czech Republic, Politickychveznu 7, Prague 11121, Czech Republic. E-mail: [email protected], [email protected]
1

1 Introduction
Field observations as well as experimental data have recently been used to suggest that
psychological explanations are important for the persistent gender gaps in wages and rep-
resentation in high-powered positions. In their book, Babcock and Laschever (2003) argue
that women do not negotiate as toughly as men on salary issues because they tend to have
a lower opinion of themselves than men. Women also tend to report higher levels of exam
anxiety in educational psychology studies (e.g., Bors, Vigneau and Kronlundet, 2006). Ex-
perimental evidence points in a similar direction. Gneezy, Niederle, and Rustichini (2003)
suggest that women are less e¤ective than men in competitive environments, even if they per-
form similarly well in non-competitive settings. Niederle and Vesterlund (2007) and Datta
Gupta, Poulsen and Villeval (2005) imply that men are more likely to select into a com-
petitive environment (a tournament) than women of the same ability. Gender competition
performance gaps could help explain the near absence of women from top-level managerial
positions, which are awarded in repeated tournaments.1
These psychological explanations are increasingly being tested with �eld data (e.g., Man-
ning and Swa¢ eld, 2008; Lavy, 2008). In particular, the competitive nature of the education
process o¤ers several testing opportunities. Price (2008) suggests that a competitive gradu-
ate fellowship program, which aimed at increasing graduation rates, helped men on average,
but bene�ted women only when a larger fraction of the group was female. Örs, Palomino
and Peyrache (2008) also study educational outcomes within a speci�c group� applicants
to a top-ranked French business school. They show that within this group, women outper-
form their male colleagues in non-competitive comprehensive tests, but lag behind men in
the highly competitive school admission process. The written admission tests are graded
1For an overview of gender gaps in the labor market, see Altonji and Blank (1999). Focusing on the Czech
Republic� the country of analysis in this paper� Jurajda and Paligorova (2006) show that the recent share
of females among the highest-paid Czech managers is about 9%, quite similar to the 6% Bell (2005) reports
for a sample of (much larger) US �rms.
2

anonymously such that discrimination is ruled out as a potential explanation for the gender
performance gap under competition.2
In this paper, we perform a similar analysis. Instead of analyzing the admission process
to one very selective business school, we study the experience of an entire cohort of Czech
secondary-school graduates applying to all available universities. For all applicants, we ob-
serve their test scores from a national non-competitive comprehensive examination conducted
shortly before the university admission process, and we see which universities they apply to,
together with the admission decision. Unlike the existing research, we can therefore compare
the performance of equally able women and men under a varying degree of competition� in
university admissions characterized by a varying over-subscription rate. We �rst ask whether
a female applicant to a given university performs di¤erently in comparison to an equally gifted
male applicant, as measured by the comprehensive high-school exam. Next, we ask whether
the size of such a gender performance gap depends on how selective a given admission process
is� on the degree of competition. For students applying to several universities, we can also
control for their unobservable ability using a person �xed e¤ect. Finally, we also measure
gender di¤erences in aspirations, that is the di¤erence in the selectivity of tertiary schools
to which equally able men and women apply.
The Czech university admission system provides a useful framework for the study of
gender performance gaps for two reasons. First, student rationing is extensive. At 12%,
the country has one of the lowest tertiary attainment rates in the OECD (OECD, 2004);
not surprisingly, the Czech Republic features one of the highest college/high-school wage
gaps in the EU (Jurajda, 2005). Tuition-free public universities provide the bulk of tertiary
education, and they tend to reject about a half of the applicants each year. In 1999� the year
2Several earlier studies, e.g., Bridgeman and Lewis (1996), document the existence of gender gaps in
academic performance; however, this line of work does not ask about the e¤ect of competitive pressure on
the size of this gap. See also Nekby, Skogman Thoursie and Vahtrik (2008) for a test of gender di¤erences in
competitiveness in a male-dominated environment.
3

our data come from� 55% of all applicants to Czech universities were not able to enroll in any
program. Second, there is unique administrative data available on study achievement and
university admission experience of the whole population of Czech secondary-school graduates
in 1999. We work with the registry of all university applications, which tells us whether
they resulted in the o¤er of admission, and merge it with data on all students graduating
from Czech secondary schools in 1999. For these graduates, we observe national school-
leaving-exam test scores from mathematics and the native Czech. The 1999 national test of
secondary-school graduates was used to evaluate schools, but had no impact on individual
student grades in secondary schools or on university admissions. Using this data, we compare
admission performance of similar men and women. We use the non-competitive test scores
to capture students�general skills, and we also control for the overall university admission
probability from a given secondary school, which captures secondary school quality.
Even with such rich data, students�subject-speci�c and university-speci�c skills remain
unobservable to us. In the presence of gender preferences for certain subjects of study,3
women (men) applying to highly �male�(�female�) university programs are likely to have un-
usually strong program-speci�c skills, particularly so if they apply to very selective programs.
Such selection on unobservables may therefore obscure our measurement of competition per-
formance gaps among equally quali�ed applicants. We minimize the in�uence of gender
di¤erences in program-speci�c unobservables by focusing on gender-balanced pools of ap-
plicants and we also compare the performance of men and women who wish to study the
same subject (�eld), i.e., we control for subject-of-study preferences. In a sub-set of our
analysis, we extend the literature by fully controlling for individual ability, both general and
subject-speci�c, using a person �xed e¤ect. This is possible for the sub-set of applications
where a student applies to several university programs of the same subject-of-study type that
di¤er in their overall admission probability. Finally, we also separately examine the groups
3See Machin and Puhani (2003) for evidence on these di¤erences from Germany and the UK and Jurajda
and Franta (2007) for �ndings from the Czech Republic.
4

of most and least able applicants as test anxiety may be stronger and gender competition
performance gaps may be wider among weaker applicants.
We �nd that compared to men of similar general skills and subject-of-study preferences,
women do not shy away from applying to more competitive programs. We also �nd that
those women who do apply to very selective tertiary programs perform substantially less
well (are less likely to be admitted) compared to equally able male applicants. The size
of the gender admission gap increases with the degree of competition at (selectivity of) a
given university program. This �nding is consistent with women performing poorly under
the stress of competitive, relative ranking.
Unfortunately, we do not know which universities grade their entrance exams anony-
mously, which prevents us from e¤ectively disentangling gender discrimination in grading
proportional to excess demand from gender di¤erences in performance under competitive
pressure as the source of the observed gender admission gaps. However, our estimates change
little when we focus on gender-balanced pools of applicants, where gender stereotyping in
admission may be expected to be unimportant. Furthermore, the magnitude of our estimates
is in line with the e¤ect Örs et al. (2008) estimate using one university, where they know
grading is anonymous, i.e., discrimination-free.
2 The Czech Education System and our Data
In this section, we describe our data in more detail and use them to o¤er several stylized
facts about the Czech education system.4 We merge university applications with test scores
from a national school-leaving comprehensive examination, �Maturita� in Czech, which is
a pre-requisite for tertiary education and approximately corresponds to the U.K. General
Certi�cate of Secondary Education or the German �Abitur�. These exams are administered
at the end of four-year secondary programs and are prepared by each school individually
4All data construction is summarized in an appendix Data Flow Chart.
5

based on national guidelines. In 1999, however, the �rst (and so far the last) national
�Maturita�exam was administered on top of the school-speci�c exams. This national test
was held simultaneously in all schools, independently of the school�s own examinations, and
the results were processed centrally.
The 1999 national exam covered all �Maturita�students, i.e., approximately 60 percent
of the entire cohort of 18-year olds: over one hundred thousand students in 1,642 schools.5
We observe standardized test scores (on a 0 to 100 scale) corresponding to the students�
mathematics skills and to their command of native Czech as well as one foreign language. The
tested students come from two main types of Czech secondary 4-year programs: vocational
and academic. Vocational programs typically provide specialized training in, for example,
construction or nursing, and some cover craft skills. The academic programs are typically
strong in both humanities and mathematics.6
A sub-set of students graduating with the �Maturita�exam applies to universities. We
have merged their �Maturita�test scores with the administrative register of applications to
Czech universities.7 We work with a sub-set of the tested group of 105,979 secondary-school
graduates, who chose to apply to at least one university program in 1999. There are 41,486
such graduates who, on average, submit about 3 university applications, resulting in a total
of 116,479 applications to 116 distinct faculties of Czech universities. Fifty-�ve percent of all
�Maturita�students are women. This changes little, to 53%, when we focus on the sub-set
of university applicants. The average (as well as the standard deviation of the) number of
5There are also apprenticeship programs, which do not lead to the �Maturita�exam; with minor excep-
tions, apprentices do not apply to universities. In terms of the OECD classi�cation of education levels, the
apprenticeship programs without a �Maturita� exam correspond to the ISCED 2 level. Secondary-school
education with �Maturita� then correspond to ISCED 3A. All students taking the �Maturita� exam have
completed at least 12 years of education.
6See Filer and Münich (2000) for a detailed description of the Czech education system.
7All of the universities are public and tuition-free. Enrollment in private colleges emerged only after 1999.
Even today, private tuition-based tertiary education remains miniscule in the Czech Republic.
6
applications submitted by female and male applicants is also very similar.
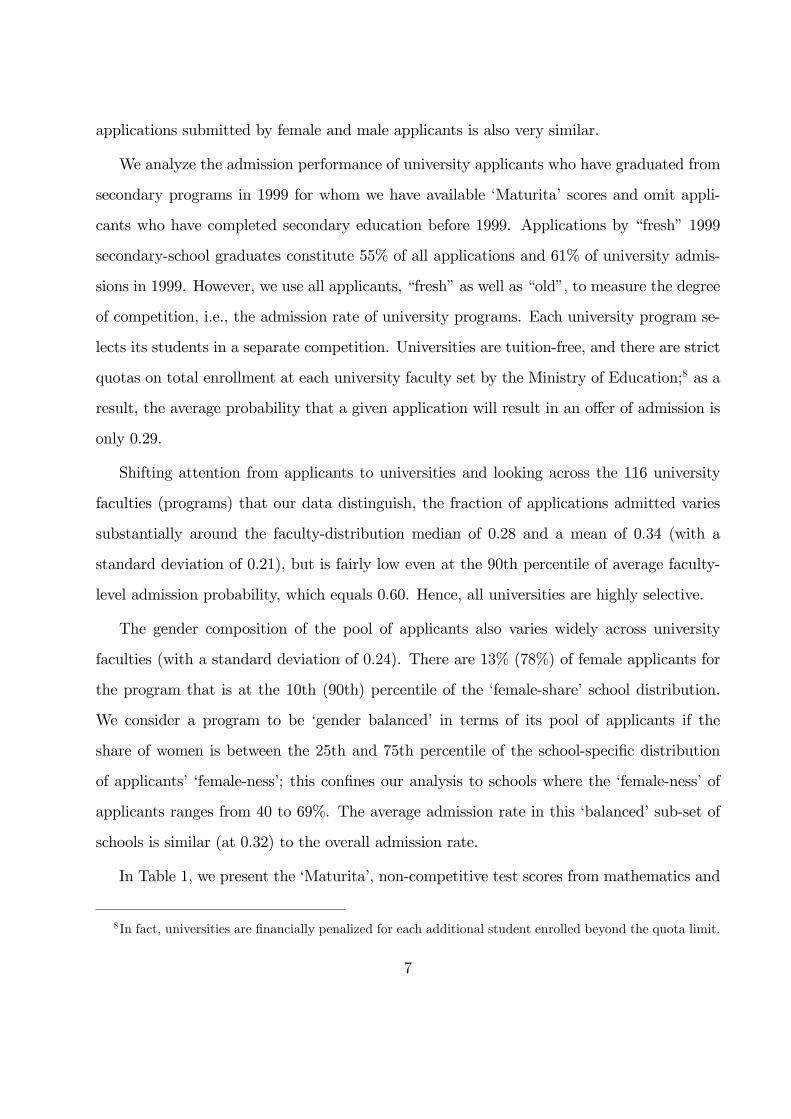
We analyze the admission performance of university applicants who have graduated from
secondary programs in 1999 for whom we have available �Maturita�scores and omit appli-
cants who have completed secondary education before 1999. Applications by �fresh�1999
secondary-school graduates constitute 55% of all applications and 61% of university admis-
sions in 1999. However, we use all applicants, �fresh�as well as �old�, to measure the degree
of competition, i.e., the admission rate of university programs. Each university program se-
lects its students in a separate competition. Universities are tuition-free, and there are strict
quotas on total enrollment at each university faculty set by the Ministry of Education;8 as a
result, the average probability that a given application will result in an o¤er of admission is
only 0.29.
Shifting attention from applicants to universities and looking across the 116 university
faculties (programs) that our data distinguish, the fraction of applications admitted varies
substantially around the faculty-distribution median of 0.28 and a mean of 0.34 (with a
standard deviation of 0.21), but is fairly low even at the 90th percentile of average faculty-
level admission probability, which equals 0.60. Hence, all universities are highly selective.
The gender composition of the pool of applicants also varies widely across university
faculties (with a standard deviation of 0.24). There are 13% (78%) of female applicants for
the program that is at the 10th (90th) percentile of the �female-share�school distribution.
We consider a program to be �gender balanced� in terms of its pool of applicants if the
share of women is between the 25th and 75th percentile of the school-speci�c distribution
of applicants��female-ness�; this con�nes our analysis to schools where the �female-ness�of
applicants ranges from 40 to 69%. The average admission rate in this �balanced�sub-set of
schools is similar (at 0.32) to the overall admission rate.
In Table 1, we present the �Maturita�, non-competitive test scores from mathematics and
8In fact, universities are �nancially penalized for each additional student enrolled beyond the quota limit.
7

the Czech language for our 41,486 university applicants. The table supports the typical
ordering of study achievement with academic programs outperforming the vocational ones,
even conditional on applying to a university program. Students graduating from academic
programs also have much higher chances of being admitted to universities. There are typical
gender di¤erences in average performance within school types. Men outperform women on
math tests, while women do somewhat better on Czech-language tests (Guiso et al., 2008).
There are also large within-school-type gender gaps in the share of university applicants
who are able to enter at least one university. It is not our aim to explain these gaps in
access to any college, which could be the consequence of gender di¤erences in application
strategies, subject-of-study preferences, university entrance exam performance, or selection
into applicant status. Our main question is a narrow one: we ask whether the size of the
admission-probability gender gap among applicants with similar �Maturita�test scores de-
pends on the selectivity of the program to which they are applying. Nevertheless, we need
to understand the main sources of the overall gender admission gaps in order to proceed
to our narrow question. We therefore estimated three preliminary least-squares regressions
predicting application success using all 116,479 applications. (We ask about the admission
probability of an application, not that of an applicant.) Conditioning only on the female
dummy and secondary-school type, we obtain a female-dummy coe¢ cient, a measure of the
overall admission gender gap, of -0.13. Conditioning further on the �Maturita�test scores and
the average success rate of a given secondary school, brings the female-dummy parameter
down to -0.10.9 Finally, conditioning additionally on eight subject-of-study types of univer-
sity programs10 reduces the female-dummy coe¢ cient to -0.02. A gender gap in admission
probability of a mere two percentage points may in part be related to a gender competition-
9Needless to say given the sample size, all of the female-dummy coe¢ cients are highly statistically signif-
icant. We obtain similar results using the Probit model.
10Medicine, humanities, natural sciences, technical (engineering), agriculture, arts, informatics, and peda-
gogy.
8

performance penalty that we test for below. It is clear, however, that subject-of-study choice
is a major gender-related determinant of admission chances; hence, all of our subsequent
analysis will condition on this �eld choice.
3 Aspiration Analysis
Our �rst question is whether among university applicants of similar ability, men chose more
competitive universities to apply to, i.e., university programs with a lower admission rate. If
so, women would be on average more able within the group of applicants to highly selective
universities. To generate an answer that is not in�uenced by gender preferences in subjects
of study or selection on unobservable skills, we ask this question conditional on eight types of
university-program subjects of study, and we also focus only on programs where the gender
composition of applicants is balanced (see the previous section for the de�nition of �gender
balanced�and for the study-�eld types).
Speci�cally, we use application data to regress the overall admission rate at the university
program targeted by a given application on applicants�gender, secondary-school type and
�Maturita�test scores and on the subject of study at the university program. We �nd statis-
tically signi�cant, but negligible conditional gender gaps in the admission rates of programs
that students apply to. Table 2 bears out this claim. Irrespective of whether we use all appli-
cations or focus on those to �gender-balanced�programs and irrespective of whether we use
data on most or least able applicants, we �nd that, compared to similar men, women apply
to university programs that are less than one percentage point di¤erent in their admission
rates. (Recall that the standard deviation of school admission rates is 21 percentage points.)
Women therefore appear not to shy away from competition relative to men, conditional on
�eld choice; they do not appear to re�ect any potential competition performance gap in their
application strategies.11
11This conclusion rests heavily on comparing men and women with the same subject-of-study preferences.
9

4 College Admissions
In this section, we ask whether women perform worse in university admissions compared to
men of similar ability, as measured by �Maturita�test scores and the secondary-school-speci�c
average university admission rate. To ascertain how such gender performance gap depends
on the degree of competition, i.e., the university admission rate, we group the application
data by the quartile of the school-speci�c admission rate distribution and estimate least-
squares admission regressions within each group.12 To assess potential biases from selection
on unobservable skills or gender stereotyping in admission-exam grading, we compare results
based on all applications to those estimated o¤of applications to �gender-balanced�university
programs (see Section 2 for de�nition). To �nd out whether gender gaps in performance are
present in di¤erent parts of the ability distribution, we also separately estimate the (binary)
admission regressions for the most and least able applicants.
Table 3 lists least-squares female-dummy coe¢ cients from admission regressions condi-
tioning on both the Czech and the math �Maturita�test score, the secondary-school type,
the average success rate of students from a given secondary school in admissions, and a full
set of dummy variables for the subject-of-study of university programs.13 There are large
and statistically signi�cant gender gaps in favour of male admission for university programs
with low admission rates, i.e., for very competitive programs. The negative gender gap of
about 3 to 4 percentage points that we estimate for the most competitive college admis-
sions, based on both all applications (in column 1) and only on those to �gender-balanced�
programs (in column 2), suggests that women are signi�cantly disadvantaged in their access
to selective schools. In order to compensate for this gender competition performance gap, a
Excluding the eight university type dummies from the regression reported in the �rst column of Table 2
would result in a ten-fold increase in the size of the female-dummy coe¢ cient.
12The admission-rate quartiles are based on all schools. The results are not materially a¤ected when we
group university programs into quartiles separately for each subject of study.
13We obtain fully similar �ndings when using the Probit model in place of the linear probability model.
10

female applicant would have to improve her �Maturita�math test score by one standard de-
viation.14 The small di¤erence between results based on all applications and those based on
only �gender-balanced�programs suggests that the e¤ect of selection based on unobservable
ability di¤erences is small or balanced with respect to highly �female�and highly �male�types
of programs. Similarly, the negligible sensitivity is consistent with either small or balanced
e¤ects of gender stereotyping on admissions.
Next, we re-estimate the admission regressions on the sub-sets of the most and least able
applicants in columns (3) and (4). The top-ability group consists of those who score above
the 75th all-applicant percentile in either math or the Czech tests (or both), and the bottom-
ability group scores below the 25th percentile in at least one of the two tests.15 Using these
two groups, we obtain results that are fully consistent with those presented in columns (1)
and (2). Women appear to perform worse at the most selective programs and not elsewhere
even when the gender comparison is based on the most and the least able group of applicants.
In Table 4, we repeat the comparisons of admission chances of equally able men and
women from Table 3, but instead of relying on least-squares regressions, with all of their
implicit functional form and weighting assumptions, we conduct a matching comparison.
Speci�cally, we perform one-to-one nearest neighbor propensity score matching without re-
placement.16 The matching-based results con�rm the least-squares-based �ndings of a sig-
ni�cant �female competition penalty�in admissions. The only exception is the rather small
14This comparison is based on the highly precisely estimated coe¢ cient on the math test score (of 0.002)
from an admission regression controlling for gender, �Maturita�test scores, secondary-school type, and average
secondary-school success rate and based on all 36,566 university applications to the most selective quartile
of universities.
15In our admission regressions, both the mathematics and the Czech �Maturita�test scores are invariably
positively and statistically signi�cantly related to admission chances.
16Matching is implemented in Stata 9 using the psmatch2 code. The number of observations (N) provided
in Table 4 corresponds to the number of matched observations on the common support. Bootstrapped
standard errors allow for clustering at the applicant level.
11

group of (matched) bottom-ability applicants, where estimates are small and noisy.
To visualize the underlying relationship, and to free up the assumption of Table 3 of simi-
lar �returns�to mathematics and Czech language skills across admissions to di¤erent schools,
we also estimate the (least-squares) female dummy coe¢ cient (from regressions condition-
ing on student ability and secondary-school type) separately for each university admission
process. The results are presented in Figure 1, which plots the estimated school-speci�c
conditional female admission gap (based on comparing similarly skilled men and women
within each admission process) against the school-speci�c admission rate (degree of compe-
tition). Each program-speci�c female dummy coe¢ cient is weighted by the inverse of its
variance.17 As with the application-level analysis, we �nd that the female performance gap
is less negative in schools with higher admission rates, i.e., lower degree of competition.
The weighted-least-squares regression slope implied by Figure 1 is 0.11 (0.08) when based
on all (only �gender balanced�) university admissions. Increasing the admission rate by one
standard deviation of the school-speci�c distribution (0.21) lowers the female competition
performance gap in admission probability by over 2 percentage points� roughly the size of
the overall least-squares conditional gender gap in admissions presented in Section 2.
Finally, our data also allow us to fully control for individual ability, both general and
subject-speci�c. Secondary-school graduates submit several university applications, often
to schools of the same �eld type. We can therefore compare admission probability of the
same individual across several university programs characterized by varying admission rates.
In order to make sure that we control not only for general individual ability, but also for
subject-of-study ability of a given individual, we estimate admission regressions controlling
for person-school-type �xed e¤ects. In other words, we only compare admission probabil-
ities within groups of applications by the same person to university programs of the same
subject-of-study type. Speci�cally, using �gender balanced� programs, we regress the bi-
17See Wooldridge (2003) for a justi�cation of such approach based on e¢ ciency grounds.
12

nary admission outcome of applications on these person-school-type �xed e¤ects and on the
university overall admission rate (degree of competition). These �xed-e¤ect regressions are
estimated separately for men and for women. Clearly, an application�s admission proba-
bility will increase with the school-wide admission rate; we ask whether it does so equally
for men and for women. Consistent with our earlier evidence, in Table 5, we �nd that the
competition �gradient�of admission probability is steeper for women than for men. Women
perform relatively worse than men when they face lower admission rates (higher degrees of
competition). This holds also when we look separately at the group of more and less selective
schools, separated by the median of the overall school admission probability. Although based
only on a sub-set of applications, these results control for individual ability fully and thus
e¤ectively rule out selection on unobservable school-type ability as an explanation for our
earlier �ndings.
5 Conclusions
Competition for university education is �erce in the Czech Republic and the stakes are
high. We �nd that female applicants to university programs perform substantially less well
than similar men when the admission rate is below 19% (in the lowest quartile), but that
they are similarly successful when admission rates are higher. We also �nd that a given
woman performs relatively more poorly in more selective schools compared to the decline in
admission probability across the same selectivity increase observed for a given man. Women
may not be aware of such admission gender gaps as they do not seem to apply to less
selective schools when compared to comparable men and when comparing within university
subject-of-study groups. There is little sensitivity to using only �gender-balanced� pools
of applicants consistent with �female competition penalty�, as opposed to discrimination,
being the chief mechanism underlying our estimates of performance gaps. The results are
thus consistent with psychological gender di¤erences being important for gender gaps in
13

labor-market performance. Our �ndings are of direct import for the formation of Czech
educational policies and student assistance as unequal access to quality education can have
serious consequences for life-time labor market outcomes. We note here that the Czech
system is typical of several other EU tertiary systems that apply school-speci�c selection at
entry.18
18School-speci�c admission standards similar to the Czech case are used in the UK, Germany and in some
of the French universities. There are also countries that apply centralized selection at entry, e.g., Sweden or
Denmark, and countries where access is unrestricted and where selection is applied after entry. See Jacobs
and van der Ploeg (2006) and Aghion, Dewatripont, Hoxby, Mas-Colell and Sapir (2008).
14

Bibliography
Aghion, Philippe, Dewatripont, Mathias, Hoxby, Caroline, Mas-Colell, Andreu, and André
Sapir (2008) �Higher Aspirations: An Agenda for Reforming European Universities,�
Bruegel Blueprint Series, Vol. V.
Altonji, Joseph G., and Rebecca M. Blank (1999) �Race and Gender in the Labor Market.�
In Orley Ashenfelter, and David Card, Eds., Handbook of Labor Economics, Vol. 3-4,
3143-3259. Amsterdam: North Holland.
Babcock, Linda, and Sara Laschever (2003)Women Don�t Ask: Negotiation and the Gender
Divide, Princeton: Princeton University Press.
Bell, Linda A. (2005) �Women-Led Firms and the Gender Gap in Top Executive Jobs�,
IZA Discussion Paper No. 1689.
Bors, Douglas A., Vigneau, Francois, and Antonia Kronlund (2006) �Anxiety Facing Exams:
Dimensionality, Similitudes and Di¤erences in University Students,�Canadian Journal
of Behavioural Science 38 (2), 176 - 184.
Bridgeman, Brent, and Charles Lewis (1996) �Gender Di¤erences in College Mathemat-
ics Grades and SAT-M Scores: A Reanalysis of Wainer and Steinberg,� Journal of
Educational Measurement 33 (3), 257-270.
Datta Gupta, Nabanita, Poulsen, Anders and Marie-Claire Villeval (2005) �Male and Fe-
male Competitive Behavior �Experimental Evidence,�IZA Discussion Paper No. 1833.
Filer, Randal, and Daniel Münich (2000) �Responses of Private and Public Schools to
Voucher Funding: The Czech and Hungarian Experience,�CERGE-EI Working Paper
No. 160.
Gneezy, Uri, Muriel Niederle, and Aldo Rustichini (2003) �Performance in Competitive
Environments: Gender Di¤erences,�Quarterly Journal of Economics, 118 (3), 1049 -
1074.
15

Guiso, Luigi, Ferdinando Monte, Paola Sapienza, and Luigi Zingales (2008) �Culture, Math,
and Gender,�Science, 5880.
Jacobs, Bas and Frederick van der Ploeg (2006) �Guide to Reform of Higher Education: A
European Perspective�Economic Policy 21 (47), 535 - 592.
Jurajda, �tµepán (2005) �Czech Returns to Schooling: Does the Short Supply of College
Education Bite?�Czech Journal of Economics and Finance 55 (1-2), pp. 83-95.
Jurajda, �tµepán, and Michal Franta (2007) �Occupational Gender Segregation in the Czech
Republic,�Czech Journal of Economics and Finance, 57 (5-6), 255-271.
Jurajda, �tµepán, and Teodora Paligorova (2006) �Female Managers and Their Wages in
Central Europe�CERGE-EI Working Paper No. 296.
Lavy, Victor (2008) �Gender Di¤erences in Market Competitiveness in a Real Workplace:
Evidence from Performance-based Pay Tournaments among Teachers,�NBERWorking
Paper No. 14338
Machin, Stephen, J., and Patrick A. Puhani (2003) �Subject of Degree and the Gender Wage
Di¤erential, Evidence form the UK and Germany,�Economics Letters 79, 393-400.
Manning, Alan, and Joana Swa¢ eld (2008) �The Gender Gap in Early-CareerWage Growth,�
Economic Journal, 118 (530), 983-1024.
Nekby, Lena, Skogman Thoursie, Peter, and Lars Vahtrik (2008) �Gender and Self-Selection
into a Competitive Environment: Are Women More Overcon�dent than Men?�Eco-
nomics Letters 100, 405� 407.
Niederle, Muriel, and Lise Vesterlund (2007) �Do Women Shy Away from Competition? Do
Men Compete Too Much?�Quarterly Journal of Economics, 122 (3), 1067-1101.
OECD (2004) Education at a Glance, OECD, Paris.
Örs, Evren, Frédéric Palomino, and Eloïc Peyrache (2008) �Performance Gender-Gap: Does
Competition Matter?�CEPR Discussion Paper No. 6891.
16

Price, Joseph (2008) �Gender Di¤erences in the Response to Competition� Industrial and
Labor Relations Review, 61 (3), 320-333.
Wooldridge, Je¤rey M. (2003) �Cluster-Sample Methods in Applied Econometrics,�Amer-
ican Economic Review, 93 (2): 133-138.
17
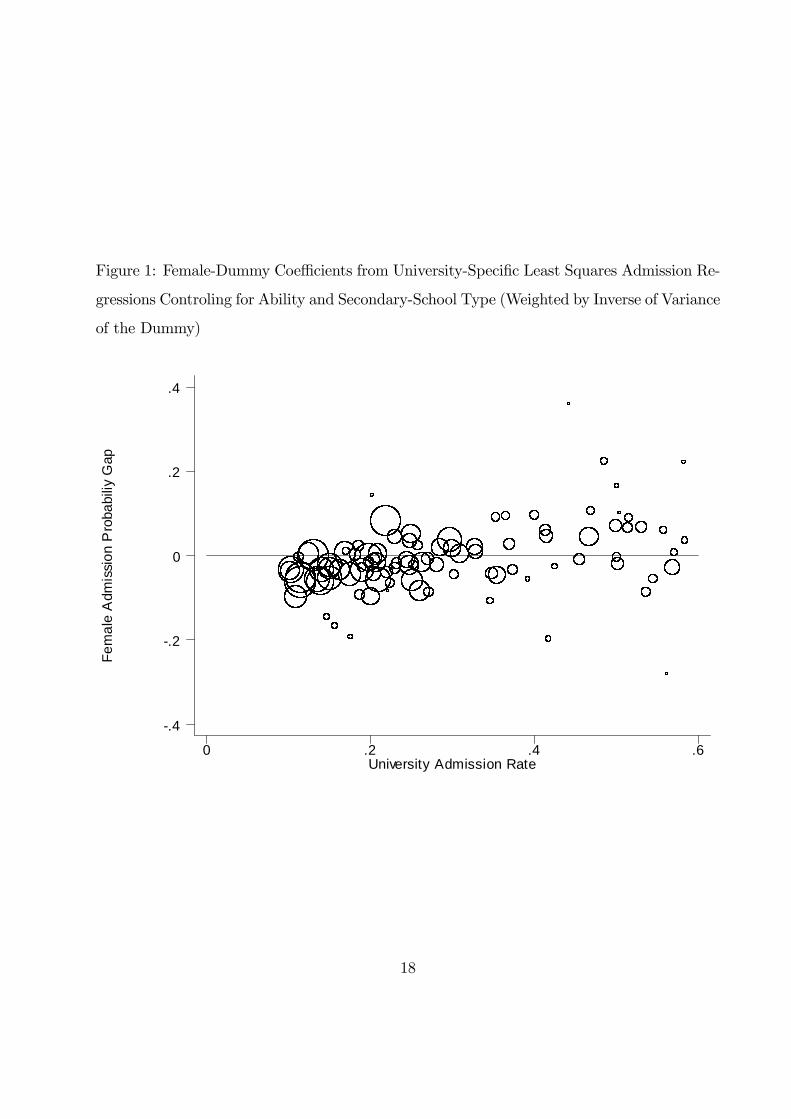
Figure 1: Female-Dummy Coe¢ cients from University-Speci�c Least Squares Admission Re-
gressions Controling for Ability and Secondary-School Type (Weighted by Inverse of Variance
of the Dummy)
Fem
ale
Adm
issi
on P
roba
biliy
Gap
University Admission Rate0 .2 .4 .6
.4
.2
0
.2
.4
18

Table 1: Mean Test Scores of University Applicants by Secondary School Type
School Type Academic Vocational
Men Women Men Women
Mathematics test score 51.0 44.4 35.9 26.5
(15.5) (15.8) (16.1) (14.6)
Czech language test score 73.7 75.3 60.4 64.0
(11.6) (11.4) (11.9) (12.0)
Share of students admitted to at least one university 0.76 0.61 0.52 0.29
Share of female students 0.57 0.50
N 17,637 23,849
Note: Standard deviations in parentheses.
Table 2: Admission Rates of Univerities Students Apply to
Applicants All All Top Ability Bottom Ability
University programs All �Gender Balanced� �Gender Balanced� �Gender Balanced�
(1) (2) (3) (4)
Female -0.009 0.005 0.005 0.003
(0.001) (0.001) (0.001) (0.002)
Math score/100 -0.013 -0.007 -0.004 -0.013
(0.002) (0.003) (0.005) (0.008)
Czech score/100 -0.046 -0.019 -0.027 -0.005
(0.003) (0.005) (0.008) (0.010)
N 116,479 57,995 26,079 16,118
Note: Robust standard errors allow for clustering at the applicant level. All regressions control for secondary
school type and subject-of-study of university program. The top (bottom) ability group consists of applicants
with the Math and/or the Czech �Maturita�test scores above (below) the 75th (25th) percentile.
19

Table 3: Female-Dummy Coe¢ cients from University Admission Least-Squares Regressions
University Programs All �Gender Balanced� All All
Applicants All All Top Ability Bottom Ability
(1) (2) (3) (4)
1st Quartile of Admission Rate -0.043 -0.033 -0.062 -0.033
(0.004) (0.005) (0.007) (0.006)
N 36,566 15,952 17,478 10,858
2nd Quartile of Admission Rate -0.016 -0.014 -0.014 -0.027
(0.005) (0.005) (0.009) (0.007)
N 32,863 23,190 14,400 9,617
3rd Quartile of Admission Rate 0.012 0.007 0.024 -0.001
(0.007) (0.008) (0.015) (0.011)
N 25,957 14,506 11,943 7,592
4th Quartile of Admission Rate 0.012 0.002 0.004 0.015
(0.008) (0.015) (0.012) (0.015)
N 19,587 4,347 8,383 6,914
Note: Each coe¢ cient comes from a separate regression. Standard errors allow for clustering at the applicant level.
Bolded coe¢ cients are statistically signi�cant at the 1% level. All speci�cations control for �Maturita�test scores,
secondary school type and average success rate, and university subject of study. The top (bottom) ability group
consists of applicants with the math and/or the Czech test scores above (below) the 75th (25th) percentile.
20

Table 4: Matching: �Average Treatment on the Treated� of being Female in University
Admission
University Programs All �Gender Balanced� All All
Applicants All All Top Ability Bottom Ability
(4) (4) (5) (6)
1st Quartile of Admission Rate -0.045 -0.033 -0.065 -0.007
(0.006) (0.008) (0.009) (0.007)
N 23,094 13,482 11,110 6,464
2nd Quartile of Admission Rate -0.031 -0.021 -0.039 0.008
(0.010) (0.011) (0.012) (0.008)
N 23,034 18,026 10,194 6,606
3rd Quartile of Admission Rate -0.026 0.005 -0.031 -0.021
(0.007) (0.014) (0.010) (0.011)
N 25,943 11,360 11,934 7,586
4th Quartile of Admission Rate 0.011 0.006 -0.008 0.040
(0.010) (0.019) (0.014) (0.021)
N 19,587 3,568 8,383 6,912
Note: Each coe¢ cient comes from a separate estimation. Standard errors allow for clustering at the applicant level.
Bolded coe¢ cients are statistically signi�cant at the 1% level. All speci�cations control for �Maturita�test scores,
secondary school type and average success rate, and university subject of study. The top (bottom) ability group
consists of applicants with the math and/or the Czech test scores above (below) the 75th (25th) percentile.
21

Table 5: School-Admission-Rate Coe¢ cients from Fixed-E¤ect Admission Regressions
Applicants Men Women
All �Gender Balanced�Programs 0.998 1.263
(0.089) (0.099)
Number of Applications 15,206 23,311
Number of Fixed E¤ects 6,881 11,146
�Gender Balanced�Programs below Median Admission Rate 1.126 1.499
(0.233) (0.204)
Number of Applications 10,656 16,259
Number of Fixed E¤ects 5,916 9,066
�Gender Balanced�Programs above Median Admission Rate 0.416 0.731
(0.193) (0.297)
Number of Applications 4,550 7,052
Number of Fixed E¤ects 3,412 5,364
Note: Each coe¢ cient comes from a separate regression. Standard errors allow for clustering at the
applicant level. Bolded coe¢ cients are statistically signi�cant at the 5% level. All speci�cations control
for a person-school-type �xed e¤ect. School type corresponds to eight types of university subject of
study. The all-school median admission rate is 0.28.
22