gelification: an effective measure for achieving ... · surface capping agents such as alkylamines...
TRANSCRIPT

Published: October 27, 2011
r 2011 American Chemical Society 19512 dx.doi.org/10.1021/ja2081263 | J. Am. Chem. Soc. 2011, 133, 19512–19523
ARTICLE
pubs.acs.org/JACS
Gelification: An Effective Measure for Achieving DifferentlySized Biocompatible Fe3O4 Nanocrystals through a SinglePreparation RecipeQiaojuan Jia,† Jianfeng Zeng,†Ruirui Qiao,† Lihong Jing,† Liang Peng,‡ Fenglong Gu,*,‡ andMingyuan Gao*,†
†Institute of Chemistry, The Chinese Academy of Sciences, Bei Yi Jie 2, Zhong Guan Cun, Beijing 100190, China‡Center for Computational Quantum Chemistry, South China Normal University, Guangzhou 510631, China
bS Supporting Information
’ INTRODUCTION
Because of the quantum confinement effect and the nanometersize effect, inorganic nanocrystals exhibit unique particle size-dependent physical properties.1,2 Although great success has beenachieved over the past decades in regulating the particle size ofvarious types of inorganic nanocrystals synthesized throughdifferent synthetic principles,3�9 developing new synthetic routesand further exploring themechanisms for delicate control over theparticle size remain hot subjects for wet-chemical synthesis ofinorganic nanocrystals, especially for magnetic iron oxide nano-crystals due to their bright future in nanomedicine.
The pioneering work of Alivisatos’ group on γ-Fe2O3 nano-crystals, prepared by pyrolyzing metal Cupferron complexes Fe-Cup3 (Cup:N-nitrosophenylhydroxylamine) at 200�300 �C via a“hot-injection” method (i.e., a stock solution of the metal pre-cursor is quickly injected into a hot solvent), has paved a newsynthetic route for high-qualitymagnetic iron oxide nanocrystals.10
Hyeon and co-workers developed the above-mentioned synthesisby using Fe(CO)5 instead of metal Cupferron complexes inproducing monodispersed γ-Fe2O3 nanocrystals.11 By varyingthe molar ratio of Fe(CO)5 to oleic acid, which serves asstabilizing agent, the size of the resultant nanocrystals was tunedin a range of 4�11 nm. Via a seed-mediated growth, larger
γ-Fe2O3 nanocrystals (16 nm) were obtained.11,12 Sun and co-workers for the first time reported the synthesis of highlymonodispersed Fe3O4 nanocrystals by pyrolyzing iron(III) acet-ylacetonate (Fe(acac)3) in the presence of oleic acid, oleylamine,and 1,2-hexadecanediol in 2002.7 Most importantly, a “heating-up”method (i.e., heating the solution consisting of all reactants todesigned temperatures) was introduced and adopted instead ofthe “hot-injection” method, although the latter approach wasbelieved to be reasonable and effective for achieving monodis-persed nanocrystals through the burst of nucleation followedsolely by the particle growth process. The as-prepared nanocrystalwas typically around 4�6 nm. Via the seed-mediated growth, alarger Fe3O4 nanocrystal of 20 nmwas obtained.13 Upon a similarapproach, a series of 3�20 nm metal-doped iron oxide of spinelMFe2O4 (M = Mn, Fe, Co) nanocrystals were synthesized.13
Following the “heating-up” method, Peng and co-workers re-ported a simple, reproducible, and general method for preparingmonodispersed metal oxide nanocrystals by pyrolyzing me-tal�fatty acid salts.14 They also found that the amount and chainlength of the fatty acid, serving as the particle surface capping
Received: August 29, 2011
ABSTRACT: Biocompatible Fe3O4 nanocrystals were synthesized through thepyrolysis of ferric acetylacetonate (Fe(acac)3) in diphenyl oxide, in the presence ofα,ω-dicarboxyl-terminated polyethylene glycol (HOOC�PEG�COOH) and oleyla-mine. Unusual gelification phenomena were observed from the aliquots extracted atdifferent reaction stages after they were cooled to room temperature. By reaction time,the average size of the Fe3O4 nanocrystals was tuned from 5.8 to 11.7 nm with anequilibrium size around 11.3 nm. By increasing the gelification degree of the stocksolution, the equilibrium size of the Fe3O4 nanocrystals was further increased from 11.3 to 18.9 nm. The underlying gel formationmechanism was investigated by using ultraviolet�visible absorption spectroscopy and Fourier transform infrared spectroscopy. Theresults suggest that the complexation between HOOC�PEG�COOH and Fe(acac)3, with the help of oleylamine, results in largemolecular networks, which are responsible for the gelification of the stock solution, while the interaction between the fragment of themolecular network and Fe3O4 nanocrystal is responsible for the second gelification process observed during the early stage of reflux.To further investigate the particle growth behavior, small molecules released during the preparation were collected and analyzed byusing photoelectron spectroscopy/photoionization mass spectroscopy (PES/PIMS). It was demonstrated that the pyrolysis of theFe precursor is strongly correlated with the particle growth process. Further numerical simulations reveal that the first gelificationprocess induced by the complexation between HOOC�PEG�COOH and Fe(acac)3 largely alters the pyrolysis behavior of the Feprecursor; consequently, the equilibrium size of the resultant Fe3O4 nanocrystals can effectively be tuned by the gelification degreeof the stock solution.
19513 dx.doi.org/10.1021/ja2081263 |J. Am. Chem. Soc. 2011, 133, 19512–19523
Journal of the American Chemical Society ARTICLE
agent, exerted strong effects in regulating the size of the resultantFe3O4 nanocrystals. Under optimized conditions, monodispersedmagnetic iron oxide nanocrystals of 6�30 nm were obtained.14
Moreover, they further demonstrated that the use of excessivefatty acid was in favor of larger particles, while the presence ofamines and alcohols as activating reagents led to smaller particlesof 3�4 nm. This synthetic approach was used for producingmonodispersed (γ-Fe2O3)1�x(Fe3O4)x nanocrystals at an ultra-large-scale (tens of grams) by Hyeon and co-workers.6 They alsoreported differently sized iron oxide nanocrystals synthesized byusing organic solvents with different boiling points (bp), forexample, 5 nm in 1-hexdecane (bp, 274 �C), 9 nm in octyl ether(bp, 287 �C), 12 nm in 1-octadecene (bp, 317 �C), 16 nm in1-eicosene (bp, 330 �C), and 22 nm in trioctylamine (bp, 365 �C),and found that x increased against the reaction temperature.6
Nevertheless, the alternation of the solvent may also introduceadditional solvent effects apart from simply varying the reactiontemperature. For example, Alivisatos and co-workers observed thathigher reaction temperature was in favor of smaller γ-Fe2O3
nanocrystals prepared through the “hot-injection” of Fe(CO)5into octyl ether.15 It is generally easier to understand the latter caseas higher reaction temperature speeds up the pyrolysis of metalprecursors, which is in favor of the formation of nuclei with higherconcentrations.
In brief, the aforementioned investigations have demonstratedthat the reaction temperature,6,13,15 the concentration and thechemical nature of the precursor,16,17 the surface capping agentand its ratio to precursor,14,18,19 etc., play important roles inregulating the size of the resultant iron oxide nanocrystals. This isbecause the reaction temperature, the chemical nature, and theconcentration of the precursor are directly associated with thesupplying rate and the resultant concentration of the monomerin forming the target nanocrystals. Meanwhile, the surfacecapping agents, used for stopping the growth of the resultantnanocrystals by firmly anchoring on the particle surface, also playan important role in the particle size regulation. In addition, somesurface capping agents such as alkylamines also exhibit strongparticle size-regulation ability as they were believed to catalyzethe pyrolysis of some iron�organic precursors.13,14,20
Although there are so many parameters practically used forregulating the size of iron oxide nanocrystals, the growth of acolloidal particle is generally believed to be strongly associatedwith the diffusion of monomer to the surface of nuclei and thefollowing surface reaction of monomer with nuclei. Therefore,two different growth models associated with these two processesare proposed on the basis of classic kinetics theory and widelyadopted for interpreting the growth behavior of inorganic colloi-dal particles in solution, that is, the diffusion-controlled growthmodel and reaction-controlled growthmodel.21�24 The diffusion-controlled model postulates that the particle growth rate dependson the flux of the monomers supplied to the particles,25�27
whereas the reaction-controlled growth model takes the precipi-tation and dissolution of monomers into consideration.22,23,28
Nevertheless, the growth of nanocrystals prepared through thethermal decomposition of metal�organic precursors is too com-plicated to be simply depicted by these two growth models.Recently, an important breakthrough has been achieved by Ba-wendi and co-workers in developing a kinetic model for describingthe nanocrystal nucleation and growth by taking the chemicalconversion of precursors to monomers into consideration.29 Twonondimensional parameters were extracted and successfully ap-plied for describing the nanocrystal nucleation and growth
behaviors in various thermal decomposition systems for predictingthe effects of the experimental conditions on both nanocrystal sizeand size distribution.29
However, the nucleation and growth of iron oxide nanocryst-als produced by the thermal decomposition method upon theuses of various types of metal�organic precursors are stillimportant subjects of further investigations, due to the lack ofenough knowledge on the corresponding pyrolysis reactions withthe particle ligands being deeply involved. In other words, theimpact of the complexation reaction between the surface cappingmolecules and the metal ions from the precursors on the growthkinetics of the resultant nanocrystals is far from clear. Recently,an unusual gelification of a Cu(acac)2/In(acac)3-in-dodeca-nethiol system, as an indicator of the formation of supramole-cular structure between the particle ligand and the metal ions,was reported and demonstrated to have a strong impact on thegrowth of the resultant Cu�In�S nanocrystals formed throughsuccessive pyrolysis of Cu(acac)2 and In(acac)3 precursors.
30
Following our previous investigations on water-soluble andbiocompatible Fe3O4 nanocrystals prepared by pyrolyzing Fe-(acac)3 in various types of high boiling point solvents,31�38
herein we report our recent investigations on the gelification-associated size regulation effect for biocompatible Fe3O4 nano-crystals produced by pyrolyzing Fe(acac)3 in diphenyl oxide inthe presence of α,ω-dicarboxyl-terminated polyethylene glycol(HOOC�PEG�COOH) and oleylamine. The PEG-coatedFe3O4 nanocrystals ranging from 5.8 to 18.9 nm were obtainedthrough a single preparation recipe simply by varying the reactiontime and the gelification degree of the stock solution. Theunderlying gel formation mechanism was investigated. Thegelification-associated size regulation effect was discussed incombination with the numerical simulation based on the theore-tical method recently reported by Bawendi and co-workers.29
’EXPERIMENTAL SECTION
Chemicals. Iron(III) acetylacetonate (Fe(acac)3) was purchasedfrom Aldrich (14024-18-1, 97%) and used after twice recrystallization.Diphenyl oxide (bp, 259 �C) was used after vacuum distillation.HOOC�PEG�COOH (Mn = 2000) was synthesized according to aprevious report.33 Oleylamine was purchased from Fluka (112-90-3,g70%) and used as received. Other chemicals of analytical gradeincluding ethanol, dichloromethane, and ether were used as received.Synthesis of Fe3O4 Nanocrystals. Typically, 2.12 g (6 mmol) of
Fe(acac)3, 7.90 mL (24 mmol) of oleylamine, and 24.0 g (12 mmol) ofHOOC�PEG�COOH were dissolved in 100 mL of diphenyl oxidesolution. After being purged with nitrogen for 2 h, the solution washeated to reflux within 15 min. Under mechanical stirring at 400 rpm,different aliquots were extracted during the heating process before andafter the reaction mixture got refluxed for monitoring the particleformation and growth. Upon addition of a mixture of ethanol and ether(vol:vol = 1:5) into the aliquots at room temperature, the resultantnanocrystals were precipitated and isolated. By being redispersed inethanol and subsequently precipitated with ether for three cycles, thenanocrystals were purified and collected for further characterizations.Conversion Rate of Fe3O4 Nanocrystals. The conversion rate
of the decomposition reaction leading to iron oxide nanocrystals wasdefined herein as [Fe]iron oxide/[Fe]reactant, where [Fe]iron oxide stands forthe concentration of Fe derived from the iron oxide particles in eachaliquot and [Fe]reactant corresponds to the feeding concentration ofFe(acac)3. [Fe]iron oxide was experimentally determined by the 1,10-phenanthroline spectrophotometric method and inductively coupled

19514 dx.doi.org/10.1021/ja2081263 |J. Am. Chem. Soc. 2011, 133, 19512–19523
Journal of the American Chemical Society ARTICLE
plasma atomic emission spectroscopy (ICP-AES) after the resultantnanocrystals were digested by HCl.Characterizations. Transmission electron microscope (TEM)
images of the nanocrystals were taken on a JEM-100CXII electronmicroscope at an acceleration voltage of 100 kV. The particle size wasdetermined by countingmore than 400 nanocrystals per sample. PowderX-ray diffraction (XRD) pattern of the particle samples was recordedon a Regaku D/Max-2500 diffractometer under Cu Kα1 radiation(λ = 1.54056 Å). TGA measurements were performed on a NETZSCHTG209F3 thermogravimetric analyzer. The magnetic properties of theresultant samples were characterized by using a vibrating samplemagnetometer (VSM JDM-13, China). Dynamic light scattering(DLS) measurements were carried out at 298.0 K with a Nano ZS(Malvern) equipped with a solid-state He�Ne laser (λ = 633 nm) formeasuring the hydrodynamic size of the resultant nanoparticles. Fouriertransform infrared (FTIR) spectra and UV�Vis absorption spectra ofthe reaction mixtures with different combinations of reactants wererecorded at room temperature on a Bruker EQUINOX55 FT-IRspectrometer and a Cary 50 UV�Vis absorption spectrometer, respec-tively. The shear viscosity of the stock solutions after being aged atcontrolled temperature for different periods of time was measured on aTA AR2000 stress-controlled rheometer equipped with two parallelplates of 40 mm in diameter at 30 �C. The concentration of Fe wasdetermined by using an inductively coupled plasma atomic emissionspectrometer (ICP-2000) produced by Jiangsu Skyray Instrument Co.,Ltd. The photoelectron spectroscopy/photoionization mass spectro-scopy (PES/PIMS) measurements on small molecules released duringthe preparation were carried out on a homemade setup.39 The PESresolution of theHeI photoelectron spectrometer equippedwas of about30 meV, and the PIMS resolution was of 410 at m/z = 254.
’RESULTS
Size Evolution, Crystalline Structure, and Magnetic Prop-erties of the As-Prepared Nanoparticles. The TEM images ofthe as-prepared nanoparticles obtained by reflux time of 0 min(right after the reaction system got refluxed at 253 �C), 10 min,15 min, 20 min, 30 min, and 60 min are shown in Figure 1. Ingeneral, the particle size quickly increases against the reflux timewithin the initial 30 min of reflux and then becomes nearlyunchanged upon prolonged reflux as shown in Figure 2a. Itshould be mentioned that in all preparation systems containingHOOC�PEG�COOH reported herein, irrespective of theaging process purposely implemented for increasing the gelifica-tion degree of the stock solutions as discussed below, thenanoparticles were found to finish the fast growing processwithin 30 min. Therefore, the average particle size achieved at30 min of reflux was defined as the equilibrium size of thenanoparticles even though prolonged reflux can slightly increasethe particle size. Along with the particle growth, the particle sizedistribution, defined by the relative standard deviation (RSD) ofthe particle size, dramatically decreases and then slightly in-creases after the particle growth is slowed down. The conversionrate of iron oxide nanoparticles shown in Figure 2b, however,presents a nonmonotonic behavior comprised of three distinctregions. During the first 15min of reflux, it dramatically decreasesto a minimum of 54.2% and then quickly increases to 93.3% at 30min of reflux. After that, it slowly increases to ∼95% uponprolonged reflux. The unexpected decrease presented within theinitial 15 min of reflux will be discussed in the following section.Yet by comparing the quick increase with the particle growthtendency, it can be concluded that the following conversion rateof Fe3O4 is mainly contributed by the particle growth.
Figure 2. Frame a: Temporal evolutions of the particle size and sizedistribution. Frame b: The conversion rate of Fe3O4 nanocrystals againstreflux time.
Figure 1. TEM images of Fe3O4 nanocrystals obtained by reflux time of0 min (a), 10 min (b), 15 min (c), 20 min (d), 30 min (e), and 60 min(f), respectively. The scale bars correspond to 50 nm.

19515 dx.doi.org/10.1021/ja2081263 |J. Am. Chem. Soc. 2011, 133, 19512–19523
Journal of the American Chemical Society ARTICLE
Because the nanoparticles nearly stop growing in size after 30min of reflux, the resultant nanoparticles extracted at 30 min ofreflux were subjected to further characterizations. The powderXRD results shown in Figure 3a suggest that the resultantnanoparticles are Fe3O4 nanocrystals, which is also supportedby the fact that the Fe3+:Fe2+ ratio in the resultant nanocrystalswas of 2:1 determined by the phenanthroline spectrophoto-metric method. According to the diffraction peak of (311), theaverage nanocrystal size was calculated to be 11.1 nm by theScherrer formula, quite well in consistence with the TEM size.
The magnetic property of the nanocrystals was investigated byusing a vibrating sample magnetometer (VSM). The room-tem-perature magnetization curve shown in Figure 3b suggests that thenanocrystals are superparamagnetic with a saturation magnetiza-tion of 20.5 emu/g. According to the TGA result shown in FigureS1 in the Supporting Information, the saturation magnetization ofpure Fe3O4 nanocrystals is calculated to be around 50.2 emu/g. Itshould bementioned that HOOC�PEG�COOHcan in principlebridge the resultant nanoparticles forming particle aggregates.Nevertheless, under the current preparative conditions, as demon-strated by DLS results shown in Figure S2 in the SupportingInformation, no particle aggregate was formed with respect to theparticle samples shown in Figure 1.Unusual Gelification Phenomena of the Reaction System.
Quite unusual gelification phenomena were observed at roomtemperature from the aliquots extracted at different reactionstages. As a matter of fact, the stock solution already becamesticky at room temperature during the deaeration process, whichtypically lasted for 2 h. The heating procedure further increasedthe viscosity of the reaction mixture until the reaction tempera-ture reached 224 �C, which turned the aliquots extracted below224 �C into gels at room temperature. Yet the following aliquotsextracted before the reaction mixture got refluxed presentedgreatly reduced viscosity at room temperature. Quite unexpect-edly, the aliquots extracted at 0 and 10 min of reflux became gelsagain at room temperature. Yet the gelification did not repeatwith respect to the aliquots extracted later on. According to theseexperimental observations, the reaction mixture underwent twogelification processes showing increased viscosity as depicted inFigure 4. In fact, tiny nanoparticles were already formed, asshown in Figure S3 in the Supporting Information, at the end ofthe first gelification process at around 224 �C, which remains farbelow the refluxing temperature. It is therefore reasonable tobelieve that the gelification of the reaction system, as an indicatorfor the binding situations among reactants and intermediatespecies, should have a strong impact on the nucleation and thefollowing growth of the Fe3O4 nanocrystals.
30
Gelification-Associated Size Regulation Effect for Fe3O4
Nanocrystals. To further disclose the effects of gelification onthe nucleation and growth of Fe3O4 nanocrystals, a series of stocksolutions was prepared according to the recipe by which thenanocrystals shown in Figure 1 were prepared. They were thenaged at designed temperatures for different periods of time
Figure 3. Frame a: Powder X-ray diffraction pattern of the particlesshown in Figure 1e together with the JCPDS card (86-0866) data formagnetite shown at the bottom. Frame b: Room-temperature magne-tization curve of the corresponding Fe3O4 nanocrystal sample.
Figure 4. The temperature-rising curve of the reaction system forproducing the nanoparticles shown in Figure 1. The light gray and darkgray regions shadow the temperature points at which the aliquotsextracted became gels at room temperature.
Figure 5. The shear viscosity of the stock solutions obtained after beingaged at 40 �C for different periods of time. The arrows point to theincubated mixtures used for the following preparations.
19516 dx.doi.org/10.1021/ja2081263 |J. Am. Chem. Soc. 2011, 133, 19512–19523
Journal of the American Chemical Society ARTICLE
before being used for preparing Fe3O4 nanocrystals under thesame preparative conditions.In detail, a series of identical stock solutions was prepared and
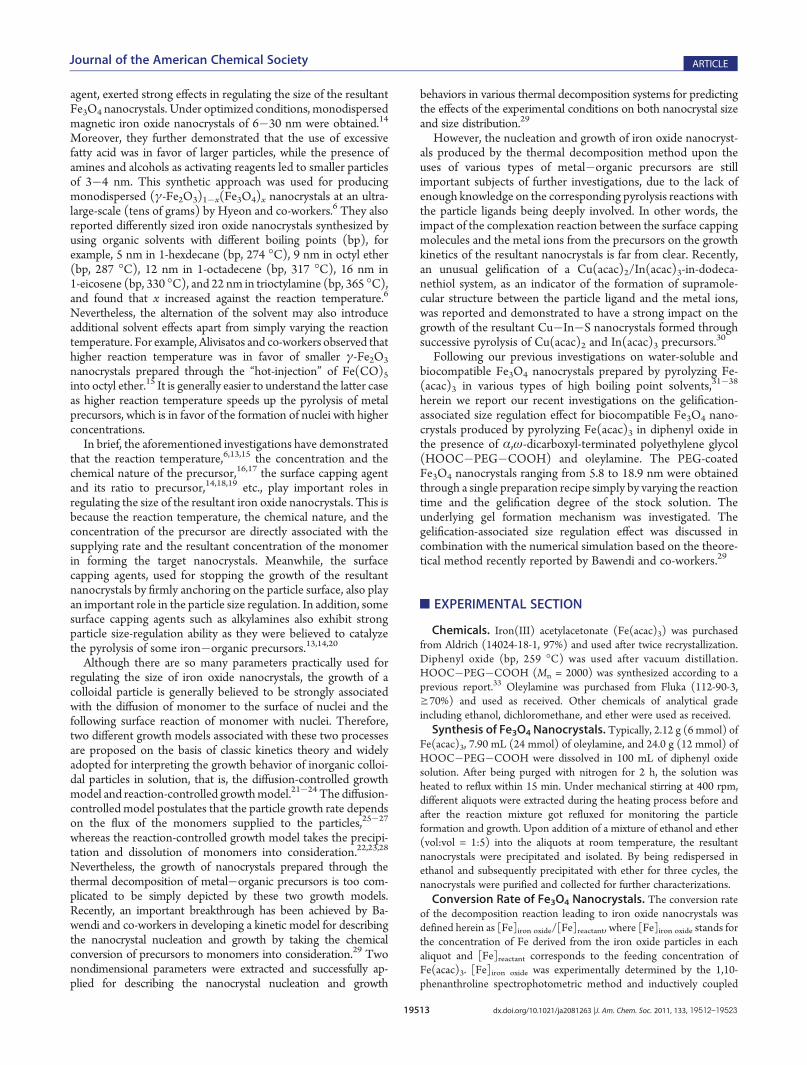
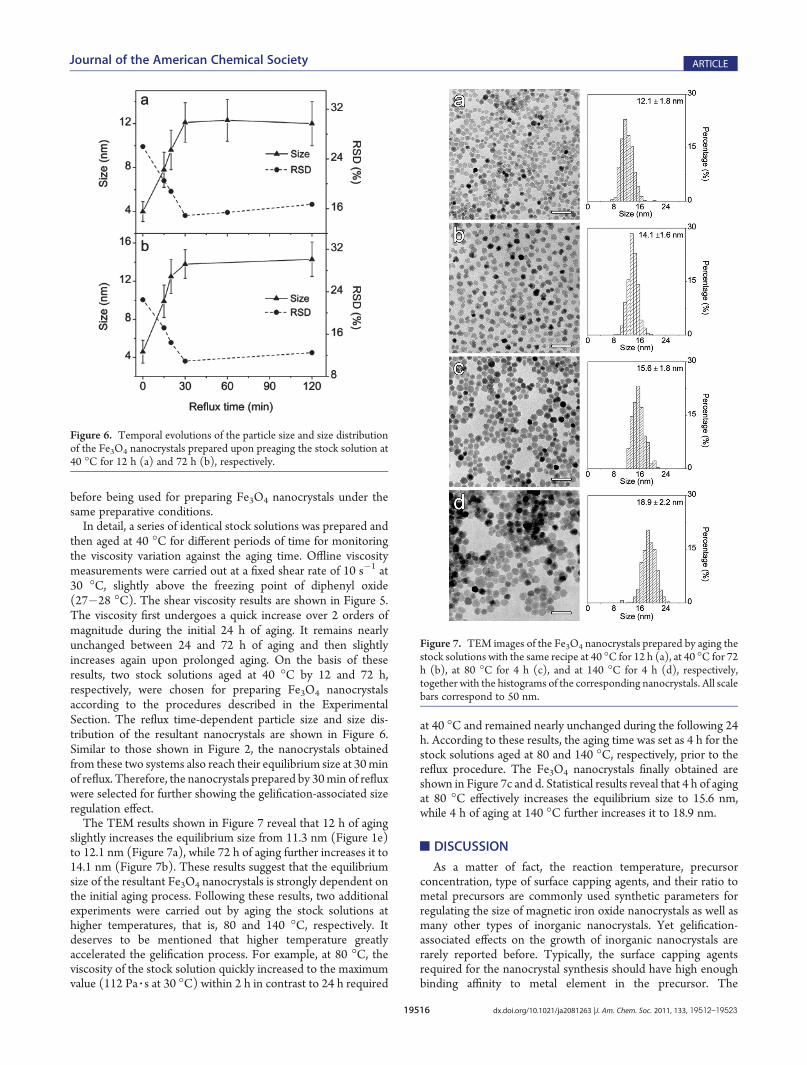
then aged at 40 �C for different periods of time for monitoringthe viscosity variation against the aging time. Offline viscositymeasurements were carried out at a fixed shear rate of 10 s�1 at30 �C, slightly above the freezing point of diphenyl oxide(27�28 �C). The shear viscosity results are shown in Figure 5.The viscosity first undergoes a quick increase over 2 orders ofmagnitude during the initial 24 h of aging. It remains nearlyunchanged between 24 and 72 h of aging and then slightlyincreases again upon prolonged aging. On the basis of theseresults, two stock solutions aged at 40 �C by 12 and 72 h,respectively, were chosen for preparing Fe3O4 nanocrystalsaccording to the procedures described in the ExperimentalSection. The reflux time-dependent particle size and size dis-tribution of the resultant nanocrystals are shown in Figure 6.Similar to those shown in Figure 2, the nanocrystals obtainedfrom these two systems also reach their equilibrium size at 30minof reflux. Therefore, the nanocrystals prepared by 30min of refluxwere selected for further showing the gelification-associated sizeregulation effect.The TEM results shown in Figure 7 reveal that 12 h of aging
slightly increases the equilibrium size from 11.3 nm (Figure 1e)to 12.1 nm (Figure 7a), while 72 h of aging further increases it to14.1 nm (Figure 7b). These results suggest that the equilibriumsize of the resultant Fe3O4 nanocrystals is strongly dependent onthe initial aging process. Following these results, two additionalexperiments were carried out by aging the stock solutions athigher temperatures, that is, 80 and 140 �C, respectively. Itdeserves to be mentioned that higher temperature greatlyaccelerated the gelification process. For example, at 80 �C, theviscosity of the stock solution quickly increased to the maximumvalue (112 Pa 3 s at 30 �C) within 2 h in contrast to 24 h required
at 40 �C and remained nearly unchanged during the following 24h. According to these results, the aging time was set as 4 h for thestock solutions aged at 80 and 140 �C, respectively, prior to thereflux procedure. The Fe3O4 nanocrystals finally obtained areshown in Figure 7c and d. Statistical results reveal that 4 h of agingat 80 �C effectively increases the equilibrium size to 15.6 nm,while 4 h of aging at 140 �C further increases it to 18.9 nm.
’DISCUSSION
As a matter of fact, the reaction temperature, precursorconcentration, type of surface capping agents, and their ratio tometal precursors are commonly used synthetic parameters forregulating the size of magnetic iron oxide nanocrystals as well asmany other types of inorganic nanocrystals. Yet gelification-associated effects on the growth of inorganic nanocrystals arerarely reported before. Typically, the surface capping agentsrequired for the nanocrystal synthesis should have high enoughbinding affinity to metal element in the precursor. The
Figure 6. Temporal evolutions of the particle size and size distributionof the Fe3O4 nanocrystals prepared upon preaging the stock solution at40 �C for 12 h (a) and 72 h (b), respectively.
Figure 7. TEM images of the Fe3O4 nanocrystals prepared by aging thestock solutions with the same recipe at 40 �C for 12 h (a), at 40 �C for 72h (b), at 80 �C for 4 h (c), and at 140 �C for 4 h (d), respectively,together with the histograms of the corresponding nanocrystals. All scalebars correspond to 50 nm.

19517 dx.doi.org/10.1021/ja2081263 |J. Am. Chem. Soc. 2011, 133, 19512–19523
Journal of the American Chemical Society ARTICLE
complexation between them sometimes leads to supramolecularstructures of different forms, which under certain circumstancescan immobilize the solvent molecules, leading to gelification ofthe reaction system.30,40,41
Gelification Mechanism of the Reaction System. Thecurrent synthetic system was comprised of Fe(acac)3,HOOC�PEG�COOH, and oleylamine apart from diphenyloxide serving as solvent. To disclose the gelification phenomena,
solutions containing different combinations of the reactants, thatis, Hacac (acetylacetone) + HOOC�PEG�COOH + oleyla-mine (solution 1), Fe(acac)3 + HOOC�PEG�COOH + oley-lamine (solution 2), Fe(acac)3 + HOOC�PEG�COOH(solution 3), and Fe(acac)3 + oleylamine (solution 4), wereprepared to investigate the gel formation. The photographsshown in the upper frame of Figure 8 suggest that only whenFe(acac)3, HOOC�PEG�COOH, and oleylamine are simulta-neously present in diphenyl oxide does the gelification occur.The UV�Vis absorption spectra of these solutions are shown in
the lower frame of Figure 8 with those of Fe(acac)3, oleylamine, andHOOC�PEG�COOH being provided in Figure S4. According tothe literature, Fe(acac)3 has two characteristic absorption bands at351 and 434 nm corresponding to dεf π4 and nf d* transitions,respectively,42,43 while the characteristic absorption band of acet-ylacetone locates at around 274 nm.44 Yet the latter band shifts to309 nm in the spectrum of solution 1, probably due to the stronginteraction of acetylacetone with HOOC�PEG�COOH andoleylamine. This absorption band appears as a shoulder in thespectrum of solution 2, which contains all of the reactants, but doesnot appear in the spectra of solutions 3 and 4, which suggests thatacetylacetone is generated by replacing the ligands of Fe(acac)3upon the collective effort of HOOC�PEG�COOH and oleyla-mine. If HOOC�PEG�COOH forms a coordination bond withFe with the help of oleylamine, the gelification can easily beunderstood because HOOC�PEG�COOH possessing twocarboxyl groups at both ends meets the requirements for estab-lishing a large molecular network together withmultivalent metalions. In contrast, the reaction system containing monocarboxy-lated PEG (Mn = 2000) instead of α,ω-dicarboxyl-terminatedPEG did not exhibit gelification phenomena at all. More detailswill be described below.To provide support for this hypothesis, FTIR investigations
were performed. The typical IR spectra of HOOC�PEG�COOH, oleylamine, and their mixture in CH2Cl2 with a molarratio of 1:2 are shown in Figure 9. It can be found that the CdOstretch band of carboxyl group, peaking at 1749 cm�1 in thespectrum of HOOC�PEG�COOH, disappears in the spec-trum of the mixture of oleylamine and HOOC�PEG�COOH.Instead, two new absorption peaks appear at 1601 and1405 cm�1, which can be assigned to the υas(COO�) andυs(COO�) bands, respectively.45 Therefore, it can be con-cluded that HOOC�PEG�COOH can form a primary aminesalt with oleylamine by donating its proton, leading to theformation of �OOC�PEG�COO�, which then coordinateswith Fe(acac)3 by partly replacing the acetylacetonate ligand ofFe(acac)3, because the binding constant of carboxylate groupwith Fe3+ (lg K1 = 3.2) is quite comparable to the third stepbinding constant (lg k3 = 4.6) for Fe(acac)3.
46 According tothese results, the gel formation mechanism for the first gelifica-tion process is proposed in Scheme 1. In brief, in the reactionsystem, the carboxylated PEG first reacts with oleylamineforming the primary amine salt, which subsequently coordi-nates with Fe atom in Fe(acac)3 by partly replacing theacetylacetonate ligand, consequently leading to the formationof a large molecular network.Because the thermal decomposition temperature for Fe-
(acac)3 is around 189 �C,47 and very small nanoparticles wereobserved at the end of the first gelification process at around224 �C, it can therefore be deduced that the first gelificationdisappears while the molecular network partly breaks down forgiving birth to the Fe3O4 nuclei. As the reactions go on, especially
Figure 8. Top frame: Photographs of solution 1 (Hacac + HOOC�PEG�COOH + oleylamine), solution 2 (Fe(acac)3 + HOOC�PEG�COOH + oleylamine), solution 3 (Fe(acac)3 + HOOC�PEG�COOH),and solution 4 (Fe(acac)3 + oleylamine). Bottom frame: The UV�Visabsorption spectra of these solutions. Note: The photographs weretaken 5 h after they were prepared.
Figure 9. FTIR spectra of HOOC�PEG�COOH, oleylamine, and themixture of HOOC�PEG�COOH and oleylamine in dichloromethane.
19518 dx.doi.org/10.1021/ja2081263 |J. Am. Chem. Soc. 2011, 133, 19512–19523
Journal of the American Chemical Society ARTICLE
when Fe3O4 nanocrystals of 5.8�7.9 nm were formed during0�10 min of reflux, corresponding to the second gelificationprocess, the fragments of the polymeric network attaching on thenuclei surface effectively cross-link the nanoparticles againthrough the bivalent PEG to develop the second gelificationprocess. Upon further decomposition of the network fragmentsserving as the precursor reservoir for the following particlegrowth, the second gelification disappears.Thermal Decomposition of the Fe Precursors. The decom-
position of metal precursors plays an important role in thenucleation and growth of nanocrystals.17 Although Fe(acac)3served as Fe precursor in the current system, due to theformation of new coordination compounds between Fe(acac)3and HOOC�PEG�COOH, the decomposition of Fe precur-sor in the new forms becomes more complicated. The nuclea-tion and growth kinetics of Fe3O4 nanocrystals are con-sequently altered as suggested by the experimental resultsshown in Figures 6 and 7 that the equilibrium size of Fe3O4
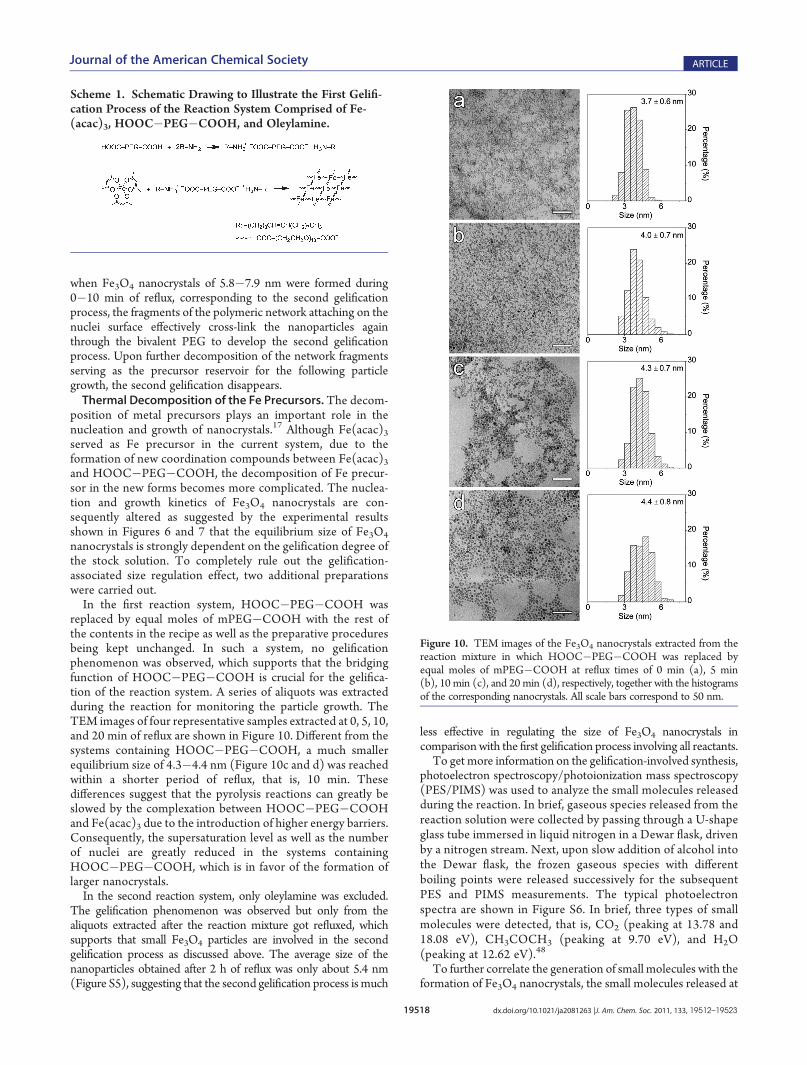
nanocrystals is strongly dependent on the gelification degree ofthe stock solution. To completely rule out the gelification-associated size regulation effect, two additional preparationswere carried out.In the first reaction system, HOOC�PEG�COOH was
replaced by equal moles of mPEG�COOH with the rest ofthe contents in the recipe as well as the preparative proceduresbeing kept unchanged. In such a system, no gelificationphenomenon was observed, which supports that the bridgingfunction of HOOC�PEG�COOH is crucial for the gelifica-tion of the reaction system. A series of aliquots was extractedduring the reaction for monitoring the particle growth. TheTEM images of four representative samples extracted at 0, 5, 10,and 20 min of reflux are shown in Figure 10. Different from thesystems containing HOOC�PEG�COOH, a much smallerequilibrium size of 4.3�4.4 nm (Figure 10c and d) was reachedwithin a shorter period of reflux, that is, 10 min. Thesedifferences suggest that the pyrolysis reactions can greatly beslowed by the complexation between HOOC�PEG�COOHand Fe(acac)3 due to the introduction of higher energy barriers.Consequently, the supersaturation level as well as the numberof nuclei are greatly reduced in the systems containingHOOC�PEG�COOH, which is in favor of the formation oflarger nanocrystals.In the second reaction system, only oleylamine was excluded.
The gelification phenomenon was observed but only from thealiquots extracted after the reaction mixture got refluxed, whichsupports that small Fe3O4 particles are involved in the secondgelification process as discussed above. The average size of thenanoparticles obtained after 2 h of reflux was only about 5.4 nm(Figure S5), suggesting that the second gelification process is much
less effective in regulating the size of Fe3O4 nanocrystals incomparisonwith the first gelification process involving all reactants.To get more information on the gelification-involved synthesis,
photoelectron spectroscopy/photoionization mass spectroscopy(PES/PIMS) was used to analyze the small molecules releasedduring the reaction. In brief, gaseous species released from thereaction solution were collected by passing through a U-shapeglass tube immersed in liquid nitrogen in a Dewar flask, drivenby a nitrogen stream. Next, upon slow addition of alcohol intothe Dewar flask, the frozen gaseous species with differentboiling points were released successively for the subsequentPES and PIMS measurements. The typical photoelectronspectra are shown in Figure S6. In brief, three types of smallmolecules were detected, that is, CO2 (peaking at 13.78 and18.08 eV), CH3COCH3 (peaking at 9.70 eV), and H2O(peaking at 12.62 eV).48
To further correlate the generation of small molecules with theformation of Fe3O4 nanocrystals, the small molecules released at
Figure 10. TEM images of the Fe3O4 nanocrystals extracted from thereaction mixture in which HOOC�PEG�COOH was replaced byequal moles of mPEG�COOH at reflux times of 0 min (a), 5 min(b), 10 min (c), and 20 min (d), respectively, together with the histogramsof the corresponding nanocrystals. All scale bars correspond to 50 nm.
Scheme 1. Schematic Drawing to Illustrate the First Gelifi-cation Process of the Reaction System Comprised of Fe-(acac)3, HOOC�PEG�COOH, and Oleylamine.

19519 dx.doi.org/10.1021/ja2081263 |J. Am. Chem. Soc. 2011, 133, 19512–19523
Journal of the American Chemical Society ARTICLE
different stages of the heating process were collected and thenanalyzed by photoionization mass spectroscopy. As small nano-particles were observed when the reaction temperature reached224 �C, five points along the heating process were set for collectingthe small molecules released in between, that is, 220 �C, 250 �C, 10min of reflux, 30 min of reflux, and 2 h of reflux at 253 �C. Fourdifferent types of signals were observed from the photoionizationmass spectroscopy. The signals atm/z = 44 and 18 can be assignedto CO2 and water, respectively, while the signals at m/z = 53 and43 can be assigned to CH3COCH3 and its fragment CH3CO 3 ,respectively. The evolutionsof these signals are shown inFigure 11.According to previous investigations, acetone and CO2 are theprincipal gaseous products for many acetylacetonates.47,49,50
Therefore, the signal variations in acetone, CH3CO 3 , and CO2
can be used for monitoring the pyrolysis reactions taking place inthe current system. The CH3COCH3 fragment signal appearsbetween 220 and 250 �C, and then reaches the maximum valueduring the second stage, that is, between 250 �C and 10 min ofreflux at 253 �C. Although no CH3COCH3 signal was detectedduring the first stage, it also appears with the maximum valueduring the second stage. These results suggest that the degradationof Fe precursors already starts during the first observation stage,and then takes place more vigorously during the first 10 min ofreflux. During the third stage, that is, 10�30 min of reflux, thesignals of CH3COCH3 and CH3CO 3 start to decrease and thenthe CH3COCH3 signal completely vanishes during the last stage,that is, 30 min to 2 h of reflux, which suggests that the acetone-related signals are strongly associated with the degradations of theFe precursors in the new forms. In difference, the CO2 signalappears during the first observation stage, but reaches the max-imum value during the third stage where the particles growdramatically in size. Therefore, the release of CO2 seems to bemore strongly associated with the formation of Fe3O4 nanocrystalsas the Fe3O4 conversion rate climbs to 93.3% during this stage,which further implies that the Fe3O4 nanocrystalsmay grow via thesurface condensation reactions with the precursor fragments(monomer) by releasing CO2.In brief, as the small molecules are heavily released during the
growth of the Fe3O4 nanocrystals, it is reasonable to believe thatthe pyrolysis of the Fe precursor is strongly associated with theparticle growth process.Impact of Gelification on the Growth Kinetics of Fe3O4
Nanocrystals. All above-mentioned results and discussion
disclose that the first gelification process exerts a strong impacton the equilibrium size of the Fe3O4 nanocrystals by altering thecoordination situation of Fe(acac)3, which thus offers an ex-cellent system for further investigating the impact of the pyrolysisbehavior of metal precursors on the growth kinetics ofnanocrystals.As a matter of fact, the results shown in Figure 2 also reveal
that the particle size distribution (RSD) dramatically decreases,exhibiting a size focusing effect, before the particle reaches itsequilibrium size at 30 min of reflux. Meanwhile, the conversionrate increases dramatically from 15 to 30 min of reflux reaching93.3%, quite close to the maximum conversion rate achievedafter 60 min of reflux. Because the aliquots extracted at 0 and 10min of reflux became gels at room temperature, the method forpurifying the nanocrystals exacted later on is not effective forseparating the nanocrystals from the unreacted gel-like pre-cursor, quite probably because the fragments of the breakdownmolecular network formed by HOOC�PEG�COOH andFe(acac)3 remain covalently attached on the nanocrystal sur-face. Consequently, the conversion rates for these two samplesare over-rated. Nevertheless, the rest of the conversion ratedata, together with temporal evolutions of size and size dis-tribution shown in Figures 2, 6, and 7, already provide sufficientinformation for understanding the growth behavior of theFe3O4 nanocrystals influenced by the gelification process ofthe reaction system.With respect to nanocrystal growth, the size focusing effect
and size defocusing effect are widely observed and interpretedby the diffusion-controlled growth model and the surfacereaction-controlled growth model in the literature.3,22,23,26 Inthe diffusion-controlled growth theory, the particle growth issupposed to be determined by diffusion of monomers toparticle surface.25�27 It is assumed that the average distancebetween the particles is large enough and the diffusion layer atthe periphery of each particle is undisturbed, so that the growthof each particle is independent.22,25,28 The monomers diffusefrom the bulk solution to the particle surface through thediffusion layer and are typically treated in the literature byFick’s First Law given as:3
J ¼ 4πx2DdCdx
ð1Þ
where J is the flux of monomers passing through a sphericalplane with a radius of x, which is the distance from a certainpoint within the diffusion layer to the center of the particle, D isthe diffusion coefficient of monomers, and C is the concentra-tion of monomer.According to Fick’s First Law, J is a constant regardless of x;
integrating C(x) from r + δ to r with respect to x gives eq 2:
J ¼ 4πDrðr þ δÞδ
ðCb � CiÞ ð2Þ
where δ is the thickness of the diffusion layer, Cb is the monomerconcentration in bulk solution, and Ci is the monomer concen-tration at the particle surface.If the monomers reaching the particle surface are completely
consumed by the particle growth, the particle growth rate can bewritten as a function of J:
drdt
¼ VmJ4πr2
ð3Þ
Figure 11. Photoionization MS signal intensities of the small moleculescollected at different stages of the preparation.

19520 dx.doi.org/10.1021/ja2081263 |J. Am. Chem. Soc. 2011, 133, 19512–19523
Journal of the American Chemical Society ARTICLE
where Vm is the molar volume of monomer. Combining eqs 2and 3 gives
drdt
¼ DVm
r1 þ r
δ
� �ðCb � CiÞ ð4Þ
If r/δ ,1, the growth rate can be rewritten as3
drdt
¼ DVm
rðCb � CiÞ ð5Þ
Equation 5 lays the theoretical foundation for the diffusion-controlled growth model, according to which the growth rate isproportional to the monomer concentration gradient and in-versely proportional to the particle radius. When the concentra-tion gradient is positive, the growth rate is inversely proportionalto particle size, which means that the growth of larger particles isretarded while the growth of smaller ones is hastened, leading tosize focusing behavior. When the concentration gradient isnegative, the growth rate is negative. Smaller particles dissolveinto monomers faster than larger ones, resulting in the sizedefocusing.With respect to reaction-controlled growth model, it is
assumed that the formation of nanocrystals is determined notonly by the monomer diffusion process, but also by the surfacereaction process. Thus, the particle growth rate is expressed as22
drdt
¼ VmDC0flat
S� exp2γVm
rRT
� �
r þ Dkflatg
exp α2γVm
rRT
� �8>>>><>>>>:
9>>>>=>>>>;
ð6Þ
where S is the supersaturation degree, which can be expressed byS = Cb/Cflat
0 ; Cflat0 is the solubility of the monomer in equilibrium
with bulk material; kgflat is the surface reaction rate constant for
the growth of the corresponding bulk material; γ is the surfacefree energy per unit area; α is the transfer coefficient for theprecipitation and dissolution reaction. When D . kg
flat, theparticle growth follows the surface reaction-controlled model,and the particle growth rate is then written as
drdt
¼ Vmkflatg C0
flat S exp � α2γVm
rRT
� �� exp ð1� αÞ2γVm
rRT
� �� �
ð7ÞFollowing eq 7, it can be seen that the growth rate increases
with the radius of the particle, r, which means that large particlesshow higher growth rate than small particles do. Therefore, if thesurface reaction-controlled growth is dominant, the particle sizedistribution tends to be broadened against reaction time.22,23,28
Both the diffusion-controlled growth model and the sur-face reaction-controlled model are widely used for simulating thegrowth behavior of inorganic nanocrystals. Nevertheless, theensemble behavior of the nanocrystals generated upon simpleprecipitation reactions occurring in aqueous system is bettersimulated than that for the nanocrystals prepared through thepyrolysis of organic precursors upon the thermal decompositionmethod.8,22,28,51 In the latter approach, apart from the diffusionof monomer to nuclei surface and the following surface reactions,the supply of monomer via the pyrolysis of precursors should alsobe taken into consideration as it strongly influences the particlegrowth.Recently, Bawendi and co-workers developed a new theore-
tical model by taking the thermal decomposition of precursor as
the rate-determining step for the particle growth.29 The decom-position reaction is described by an irreversible reaction given as:
P sfkf
C1 ð8Þwhere kf is the rate constant for the precursor decomposition,while P and C1 stand for the precursor and monomers, respec-tively. The release of small molecules during the pyrolysis ofmetal precursors Fe(acac)3 supports that the decompositionreaction of metal precursor is hardly reversible.34,50,52
On the basis of the reliable reaction conversion rates andTEM sizes, the concentration of the resultant Fe3O4 nano-crystals obtained at 15 and 30 min of reflux, as shown inFigures 1 and 2, was calculated to be 1.50 � 10�6 and 1.45 �10�6 mol/L, respectively. This allows us to assume that thegrowth of the Fe3O4 nanocrystals is based on the reactionsbetween monomers and particles instead of interparticle coa-gulation; thus the growth and dissociation reaction for n-sizedparticles can also be written as29
Cn þ C1sfrsGn
Dnþ1
Cnþ1 ð9Þ
where Gn and Dn are the time-dependent growth and dissocia-tion frequency of monomer attachment and detachment,respectively.According to Bawendi’s model, the growth rate is assumed to
be proportional to both the number of available sites on theparticles surface and the concentration of the monomers, andmeanwhile the particle dissociation rate is proportional to thenumber of sites occupied by ligands. The total number ofparticles binding sites is proportional to the 2/3 power of themonomer number within the particles, based on the hypothesisthat the particle is spherical and the unbound ligand concentra-tion is constant. The growth rate and the dissociation rate arethen written as follows:
Gn ¼ kan2=3C1 ð10Þ
Dn ¼ kdn2=3 ð11Þ
where ka and kd are the effective rate constants including theintrinsic rates of monomer addition and dissociation,respectively.29 The rate equations of precursor, monomer, andn-sized nanocrystal are written as follows:
dPdt
¼ � kfP ð12Þ
dC1
dt¼ kfP� kaC
21 � ka ∑
N � 1
n¼ 1ðnÞ2=3CnC1
þ kdð2Þ2=3C2 þ kd ∑N
n¼ 2ðnÞ2=3Cn ð13Þ
dCn
dt¼ kaðn� 1Þ2=3Cn�1C1 � kdðnÞ2=3Cn � kaðnÞ2=3CnC1
þ kdðn þ 1Þ2=3Cnþ1
ð14Þwhere N is the maximum number of monomers in particle. Twoparameters were extracted by Bawendi and co-workers for

19521 dx.doi.org/10.1021/ja2081263 |J. Am. Chem. Soc. 2011, 133, 19512–19523
Journal of the American Chemical Society ARTICLE
further analyzing the particle growth via the nondimensionalprocessing of eqs 12�14, that is:
α ¼ kaP0kf
ð15Þ
β ¼ kdkf
ð16Þ
where P0 is the initial precursor concentration. These twonondimensional parameters, α and β, correspond to scaledgrowth and dissociation rates, respectively.Following the method described by Bawendi and co-workers,
the nondimensionalized expressions of eqs 12�14 given as eqsS1�3 in the Supporting Information were integrated using thecontinuous Fokker�Planck partial differential equation, and thefollowing experimental quantities were computed on the basis ofthe concentration equations including the mean size (D), radialvariance (σR
2), relative standard deviation (RSD), and reactionconversion rate (Y). More details on the simulation method andparameters are provided in the Supporting Information.The best simulation results on size, size distribution, and
conversion rate presented in Figure 2 are shown in Figure 12 withα and β corresponding to 1.0� 109 and 2.0� 100, respectively.According to the simulation results, the growth process of Fe3O4
nanocrystals can be divided into three distinct regions. In the firstregion, the conversion rate of precursor is very low, and the sizeand size distribution are mainly determined by the nucleationprocess. In the second region, that is, the growth stage, theparticle size increases with the conversion rate of precursor;meanwhile, the size distribution is reduced. In the third region,the particle growth nearly stops, while the conversion rate of
precursor reaches 100%.Meanwhile, the size distribution remainsnearly constant for some time, and then slightly increases uponfurther reaction. It was demonstrated that the variation of RSD inthe third region is dependent on the value initially set for β. Asshown in Figure S7, further decreasing β simply flattens the tail ofthe RSD curve without changing the equilibrium size achieved atthe end of the second region. In general, the simulation resultsmatch well with the experimental results shown in Figure 2, andthe size focusing effect is also well depicted with respect to theFe3O4 nanocrystals synthesized without purposely imposing apreaging process for increasing the gelification degree.As decreasing β does not change the simulation results on the
equilibrium size and the corresponding RSD at the end of theparticle growth stage as shown in Figure S7, β was fixed in thefollowing simulations on the particle size and size distributions ofthose Fe3O4 nanocrystals shown in Figure 7 for further under-standing the impact of gelification on the growth as well as theequilibrium size of Fe3O4 nanocrystals eventually achieved. Onthe basis of the best fits shown in Figure 13, a series ofα valueswasextracted as 1.5 � 109, 4.0 � 109, 7.0 � 109, and 2.0 � 1010 for12.1, 14.1, 15.6, and 18.9 nm Fe3O4 nanocrystals, respectively.In the expression of α, that is, kaP0/kf, P0 was fixed during the
experiments and ka should remain unchanged as it represents therate constant for the monomer addition on particle surface.Consequently, α is inversely proportional to kf that representsthe rate constant for the precursor decomposition. Therefore, itcan be concluded that the increased equilibrium size, in con-sequence of the increased gelification degree of the stocksolution, is intrinsically caused by the reduced decompositionrate constant of the precursors, which involves HOOC�PEG�COOH in forming a large molecular network.To further verify the above conclusion, the growth of Fe3O4
nanocrystals formed in the nongelification system containingmPEG�COOH (Figure 10) was also simulated with the bestresults being shown in Figure S8. The value of α extracted was inthe magnitude of 106, which is greatly smaller than thoseextracted from the gelification systems, even though Fe(acac)3was used in all of these systems as the starting material. Thereduced α as a result of the increased rate constant for precursordecomposition is greatly in favor of burst of nuclei; consequently,the equilibrium size of the Fe3O4 nanocrystals is much smaller in
Figure 12. The best simulation results on particle size (- - -), sizedistribution (RSD, ���) in frame a, and conversion rate of Feprecursor in frame b, overlaid with the corresponding experimental datashown in Figure 2. The parameter values for α and β are 1.0 � 109 and2.0 � 100, respectively. The conversion rates for particles obtained atreflux times of 0 and 10min were abandoned as they were overestimated.
Figure 13. The best simulation results on particle size and sizedistribution for the Fe3O4 nanocrystals (shown in Figure 7) obtainedby aging the stock solution at 40 �C for 12 h (red lines, 12.1 nm), at40 �C for 72 h (green lines, 14.1 nm), at 80 �C for 4 h (blue lines,15.6 nm), and at 140 �C for 4 h (cyan lines, 18.9 nm), respectively. Theparameter value of β is fixed as 2.0 � 100.

19522 dx.doi.org/10.1021/ja2081263 |J. Am. Chem. Soc. 2011, 133, 19512–19523
Journal of the American Chemical Society ARTICLE
the nongelification system and also reached more quickly. In thiscontext, it is easy to understand why the as-prepared iron oxidenanocrystals are typically of several nanometers in diameter byusing Fe(acac)3 as precursor except for those prepared via theseed-mediated growth,7,20,31,35,53,54 because the rate constant kffor the precursor decomposition is determined by the chemicalnature of the precursor.
’CONCLUSIONS
In summary, nearly monodispersed Fe3O4 nanocrystals with thediameter ranging from 5.8 to 18.9 nm were synthesized in diphenyloxide by the thermal decomposition method through a singlepreparation recipe comprised of Fe(acac)3,HOOC�PEG�COOH,and oleylamine. Systematic experiments reveal that HOOC�PEG�COOH used for the biocompatible surface coating can cross-linkFe(acac)3 molecules with the aid of oleylamine to form gels.Further investigations demonstrate that the gelification degree isstrongly associated with the equilibrium size of the resultantFe3O4 nanocrystals. Simply by manipulating the gelificationdegree through aging the stock solutions with the same prepara-tion recipe, the equilibrium size of the Fe3O4 nanocrystals haseffectively been tuned over a size range of 11.3�18.9 nm. ThePES/PIMS analysis on the small molecules released during thereaction suggests that the nanocrystal growth is strongly corre-lated to the pyrolysis reactions taking place in the reaction system.Theoretical analysis and numerical simulations on the particlegrowth behavior suggest that the complexation betweenHOOC�PEG�COOH and Fe(acac)3, apparently inducing thegelification of the reaction system, intrinsically reduces thethermal decomposition rate constants of the Fe precursors inthe new forms, and eventually gives rise to the gelification-associated size regulation effect for Fe3O4 nanocrystals by alteringtheir growth kinetics.
The delicate control over the particle size is not only mean-ingful for discovering the particle size-related physical propertiesof inorganic nanocrystals, but also important for further achiev-ing advanced nanomaterials with well-defined properties. Thecurrent investigations have demonstrated that the gelification ofthe reaction system can be used as an effective measure for tuningthe size of resultant nanocrystals. Although the gelificationphenomenon does not always occur in the thermal decomposi-tion systems for producing high-quality nanocrystals, the under-lying principle can be adopted for effectively regulating the size ofnanocrystals by manipulating the complexation between metalprecursor and organic ligands or additives.
’ASSOCIATED CONTENT
bS Supporting Information. (1) TGA curve of the 11.3 nmFe3O4 nanoparticles, (2) hydrodynamic size distribution profilesof Fe3O4 particles obtained at different reflux times, (3) TEMimage of Fe3O4 nanoparticles extracted at around 224 �C duringthe heating process, (4) absorption spectra of Fe(acac)3, oleyla-mine, and HOOC�PEG�COOH, (5) TEM image of Fe3O4
nanoparticles obtained by 2 h of reflux in the absence ofoleylamine, (6) typical photoelectron spectra of the smallmolecules released during the preparation, (7) the simulationresults on the particle size and size distribution obtained by usingdifferent β values based on a fixed α value, and (8) the bestsimulation results on particle size and size distribution, over-laid with the corresponding experimental data extracted from
Figure 10; along with the expressions of simulated quantities,method, and parameters. This material is available free of chargevia the Internet at http://pubs.acs.org.
’AUTHOR INFORMATION
Corresponding [email protected]; [email protected]
’ACKNOWLEDGMENT
We thank the National Basic Research Program of China(2011CB935800), NSFC (81090271, 21003135, 20820102035,21021003), andCAS (KJCX2-YW-M15) for financial support. Q.J. also is grateful to Prof. Maofa Ge and Prof. Jun Zhang for theirkind help with respect to PES/PIMS and viscosity experiments.
’REFERENCES
(1) Alivisatos, A. P. Science 1996, 271, 933.(2) Roca, A. G.; Costo, R.; Rebolledo, A. F.; Veintemillas-Verdaguer,
S.; Tartaj, P.; Gonzalez-Carreno, T.; Morales, M. P.; Serna, C. J. J. Phys.D: Appl. Phys. 2009, 42, 224002.
(3) Sugimoto, T.Monodispersed Particles, 1st ed.; Elsevier: Amsterdam,2001; pp 368�376.
(4) Pradhan, N.; Reifsnyder, D.; Xie, R. G.; Aldana, J.; Peng, X. G.J. Am. Chem. Soc. 2007, 129, 9500.
(5) Yu,W.W.;Wang, Y. A.; Peng, X. G.Chem.Mater. 2003, 15, 4300.(6) Park, J.; An, K. J.; Hwang, Y. S.; Park, J. G.; Noh, H. J.; Kim, J. Y.;
Park, J. H.; Hwang, N. M.; Hyeon, T. Nat. Mater. 2004, 3, 891.(7) Sun, S. H.; Zeng, H. J. Am. Chem. Soc. 2002, 124, 8204.(8) Murray, C. B.; Norris, D. J.; Bawendi, M. G. J. Am. Chem. Soc.
1993, 115, 8706.(9) Ahrenstorf, K.; Heller, H.; Kornowski, A.; Broekaert, J. A. C.;
Weller, H. Adv. Funct. Mater. 2008, 18, 3850.(10) Rockenberger, J.; Scher, E. C.; Alivisatos, A. P. J. Am. Chem. Soc.
1999, 121, 11595.(11) Hyeon, T.; Lee, S. S.; Park, J.; Chung, Y.; Na, H. B. J. Am. Chem.
Soc. 2001, 123, 12798.(12) Park, J.; Lee, E.; Hwang, N.M.; Kang, M. S.; Kim, S. C.; Hwang,
Y.; Park, J. G.; Noh, H. J.; Kini, J. Y.; Park, J. H.; Hyeon, T. Angew. Chem.,Int. Ed. 2005, 44, 2872.
(13) Sun, S. H.; Zeng, H.; Robinson, D. B.; Raoux, S.; Rice, P. M.;Wang, S. X.; Li, G. X. J. Am. Chem. Soc. 2004, 126, 273.
(14) Jana, N. R.; Chen, Y. F.; Peng, X. G. Chem. Mater. 2004,16, 3931.
(15) Casula, M. F.; Jun, Y.W.; Zaziski, D. J.; Chan, E.M.; Corrias, A.;Alivisatos, A. P. J. Am. Chem. Soc. 2006, 128, 1675.
(16) Yu, W. W.; Falkner, J. C.; Yavuz, C. T.; Colvin, V. L. Chem.Commun. 2004, 2306.
(17) Si, R.; Zhang, Y. W.; Zhou, H. P.; Sun, L. D.; Yan, C. H. Chem.Mater. 2007, 19, 18.
(18) Cheon, J. W.; Kang, N. J.; Lee, S. M.; Lee, J. H.; Yoon, J. H.; Oh,S. J. J. Am. Chem. Soc. 2004, 126, 1950.
(19) Woo, K.; Hong, J.; Choi, S.; Lee, H. W.; Ahn, J. P.; Kim, C. S.;Lee, S. W. Chem. Mater. 2004, 16, 2814.
(20) Xu, Z.; Shen, C.; Hou, Y.; Gao, H.; Sun, S. Chem. Mater. 2009,21, 1778.
(21) Sugimoto, T. Adv. Colloid Interface Sci. 1987, 28, 65.(22) Talapin, D. V.; Rogach, A. L.; Haase, M.; Weller, H. J. Phys.
Chem. B 2001, 105, 12278.(23) van Embden, J.; Sader, J. E.; Davidson, M.; Mulvaney, P. J. Phys.
Chem. C 2009, 113, 16342.(24) Lifshitz, I. M.; Slyozov, V. V. J. Phys. Chem. Solids 1961, 19, 35.(25) Reiss, H. J. Chem. Phys. 1951, 19, 482.(26) Peng, X. G.; Wickham, J.; Alivisatos, A. P. J. Am. Chem. Soc.
1998, 120, 5343.
19523 dx.doi.org/10.1021/ja2081263 |J. Am. Chem. Soc. 2011, 133, 19512–19523
Journal of the American Chemical Society ARTICLE
(27) Lamer, V. K.; Dinegar, R. H. J. Am. Chem. Soc. 1950, 72, 4847.(28) Park, J.; Joo, J.; Kwon, S. G.; Jang, Y.; Hyeon, T. Angew. Chem.,
Int. Ed. 2007, 46, 4630.(29) Rempel, J. Y.; Bawendi, M. G.; Jensen, K. F. J. Am. Chem. Soc.
2009, 131, 4479.(30) Han, W.; Yi, L. X.; Zhao, N.; Tang, A. W.; Gao, M. Y.; Tang,
Z. Y. J. Am. Chem. Soc. 2008, 130, 13152.(31) Lu, X. Y.; Niu, M.; Qiao, R. R.; Gao,M. Y. J. Phys. Chem. B 2008,
112, 14390.(32) Hu, F. Q.; Li, Z.; Tu, C. F.; Gao, M. Y. J. Colloid Interface Sci.
2007, 311, 469.(33) Li, Z.; Wei, L.; Gao, M. Y.; Lei, H. Adv. Mater. 2005, 17, 1001.(34) Li, Z.; Sun, Q.; Gao, M. Y. Angew. Chem., Int. Ed. 2005, 44, 123.(35) Li, Z.; Chen, H.; Bao, H. B.; Gao, M. Y. Chem. Mater. 2004,
16, 1391.(36) Hu, F. Q.; Wei, L.; Zhou, Z.; Ran, Y. L.; Li, Z.; Gao, M. Y. Adv.
Mater. 2006, 18, 2553.(37) Liu, S. J.; Jia, B.; Qiao, R. R.; Yang, Z.; Yu, Z. L.; Liu, Z. F.; Liu,
K.; Shi, J. Y.; Han, O. Y.; Wang, F.; Gao, M. Y.Mol. Pharmaceutics 2009,6, 1074.(38) Liu, S. J.; Han, Y. C.; Qiao, R. R.; Zeng, J. F.; Jia, Q. J.; Wang,
Y. L.; Gao, M. Y. J. Phys. Chem. C 2010, 114, 21270.(39) Yao, L.; Zeng, X.; Ge, M.; Wang, W.; Sun, Z.; Du, L.; Wang, D.
Eur. J. Inorg. Chem. 2006, 2006, 2469.(40) Xing, B.; Yu, C.-W.; Chow, K.-H.; Ho, P.-L.; Fu, D.; Xu, B.
J. Am. Chem. Soc. 2002, 124, 14846.(41) Lesnyak, V.; Voitekhovich, S. V.; Gaponik, P. N.; Gaponik, N.;
Eychm€uller, A. Acs Nano 2010, 4, 4090.(42) Barnum, D. W. J. Inorg. Nucl. Chem. 1961, 21, 221.(43) Roggeman, E. J.; Scurto, A. M.; Brennecke, J. F. Ind. Eng. Chem.
Res. 2000, 40, 980.(44) Holm, R. H.; Cotton, F. A. J. Am. Chem. Soc. 1958, 80, 5658.(45) Nakamoto, K. Infrared and Raman Spectra of Inorganic and
Coordination Compounds; John Wiley & Sons, Ltd.: Hoboken, 2009.(46) Electrolytes, Electromotive Force, and Chemical Equilibrum. In
Lange’s Handbook of Chemistry, 15th ed.; Dean, J. A., Ed.; McGraw-Hill,Inc.: New York, 1999.(47) Ismail, H. M. J. Anal. Appl. Pyrolysis 1991, 21, 315.(48) Kimura, K.; Achiba, Y.; Yamazaki, T.; Iwata, S.Handbook of HeI
Photoelectron Spectra of Fundamental Organic Molecules; Japan ScientificSocieties: Tokyo, 1981.(49) Vonhoene, J.; Charles, R. G.; Hickam, W. M. J. Phys. Chem.
1958, 62, 1098.(50) Tu, C. F.; Du, J. J.; Yao, L.; Yang, C. H.; Ge, M. F.; Xu, C. L.;
Gao, M. Y. J. Mater. Chem. 2009, 19, 1245.(51) Rao, C. N. R.; Varghese, N.; Biswas, K. Chem.-Asian J. 2008,
3, 1435.(52) Kwon, S. G.; Piao, Y.; Park, J.; Angappane, S.; Jo, Y.; Hwang,
N. M.; Park, J. G.; Hyeon, T. J. Am. Chem. Soc. 2007, 129, 12571.(53) Jun, Y. W.; Huh, Y. M.; Choi, J. S.; Lee, J. H.; Song, H. T.; Kim,
S.; Yoon, S.; Kim, K. S.; Shin, J. S.; Suh, J. S.; Cheon, J. J. Am. Chem. Soc.2005, 127, 5732.(54) Lee, J. H.; Huh, Y. M.; Jun, Y.; Seo, J.; Jang, J.; Song, H. T.; Kim,
S.; Cho, E. J.; Yoon, H. G.; Suh, J. S.; Cheon, J. Nat. Med. 2007, 13, 95.