gearbox reliability collaborative update - national · pdf file · 2013-10-14oil...
TRANSCRIPT
NREL is a national laboratory of the U.S. Department of Energy, Office of Energy Efficiency and Renewable Energy, operated by the Alliance for Sustainable Energy, LLC.
Gearbox Reliability Collaborative Update
Sandia Reliability Workshop Albuquerque, NM
August 13-14, 2013 NREL/PR-5000-60141
Shawn Sheng and Jon Keller National Wind Technology
Center, NREL
Chad Glinsky US Technical Center Romax Technology
2
Outline Introduction
• “Classic” Statistics
• New Results
• Gearbox Reliability Collaborative (GRC)
Status Update
• Key Failure Modes
• Lessons Learned
• Design Changes in Gearbox #3
• Test Summary
• Key Findings
• Schedule
Next Steps for the GRC
Several Other Reliability Research and Development (R&D) Activities
Introduction
4
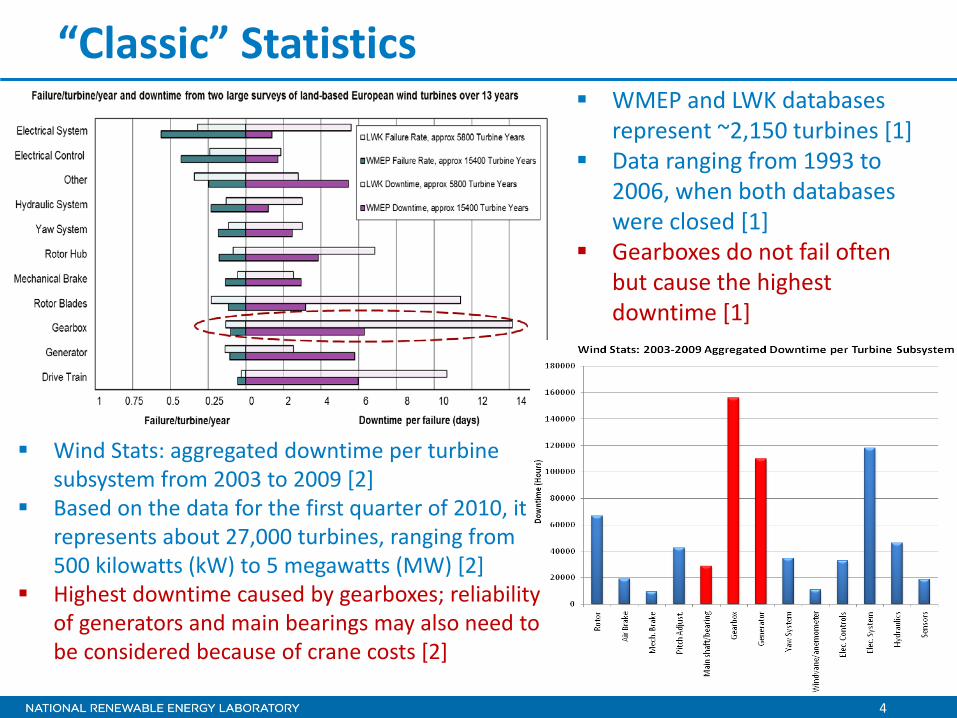
“Classic” Statistics WMEP and LWK databases
represent ~2,150 turbines [1] Data ranging from 1993 to
2006, when both databases were closed [1]
Gearboxes do not fail often but cause the highest downtime [1]
Wind Stats: aggregated downtime per turbine subsystem from 2003 to 2009 [2]
Based on the data for the first quarter of 2010, it represents about 27,000 turbines, ranging from 500 kilowatts (kW) to 5 megawatts (MW) [2]
Highest downtime caused by gearboxes; reliability of generators and main bearings may also need to be considered because of crane costs [2]
5
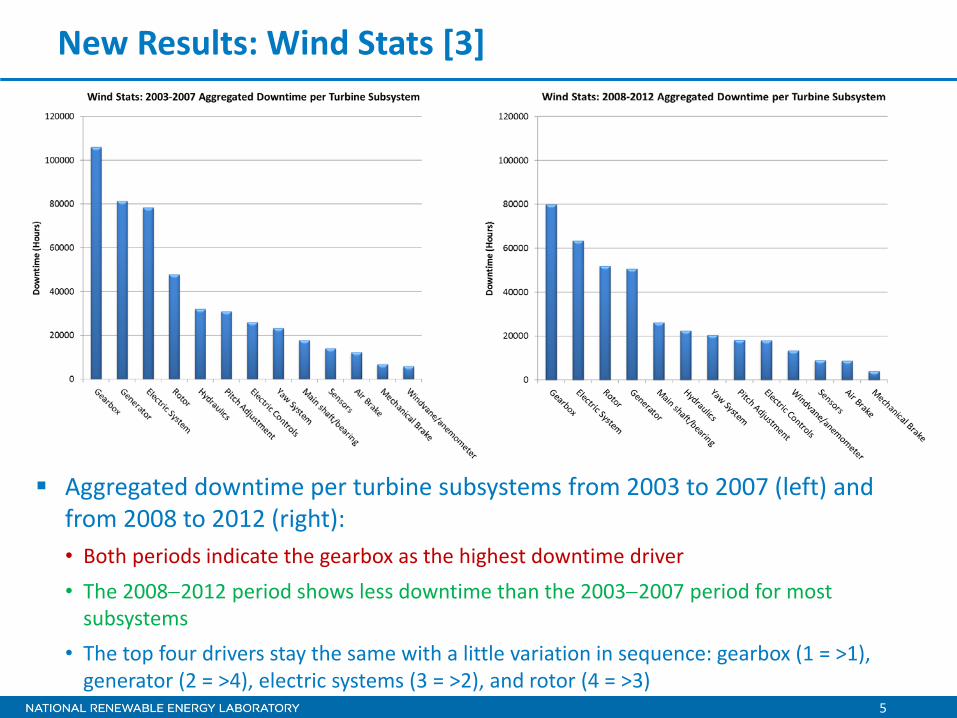
New Results: Wind Stats [3]
Aggregated downtime per turbine subsystems from 2003 to 2007 (left) and from 2008 to 2012 (right): • Both periods indicate the gearbox as the highest downtime driver • The 2008−2012 period shows less downtime than the 2003−2007 period for most
subsystems • The top four drivers stay the same with a little variation in sequence: gearbox (1 = >1),
generator (2 = >4), electric systems (3 = >2), and rotor (4 = >3)

6
New Results: Gearbox Failure/Reliability Database [3] Gearbox failure event data highlighting damaged components, failure modes, and possible
root causes About 20 partners involved, including turbine/gearbox manufacturers, owners/operators,
gearbox rebuild shops, and operation and maintenance (O&M) service providers Assets owned by owner/operator partners represent ~31% of the United State’s end of
2012 capacity The database contains 289 gearbox failure incidents with 257 confirmable damage records
(Note: one incident may have multiple damage records and inconsistent data reporting)
Observations: • Gearboxes fail in different ways • Bearings: ~ 70%; Gears: ~ 26%; and
Others: ~ 4% • Both bearing and gear faults are
concentrated in the parallel section • Top gearbox failure mode is high-
speed shaft (HSS) or intermediate- speed shaft (IMS) bearing axial cracks
7
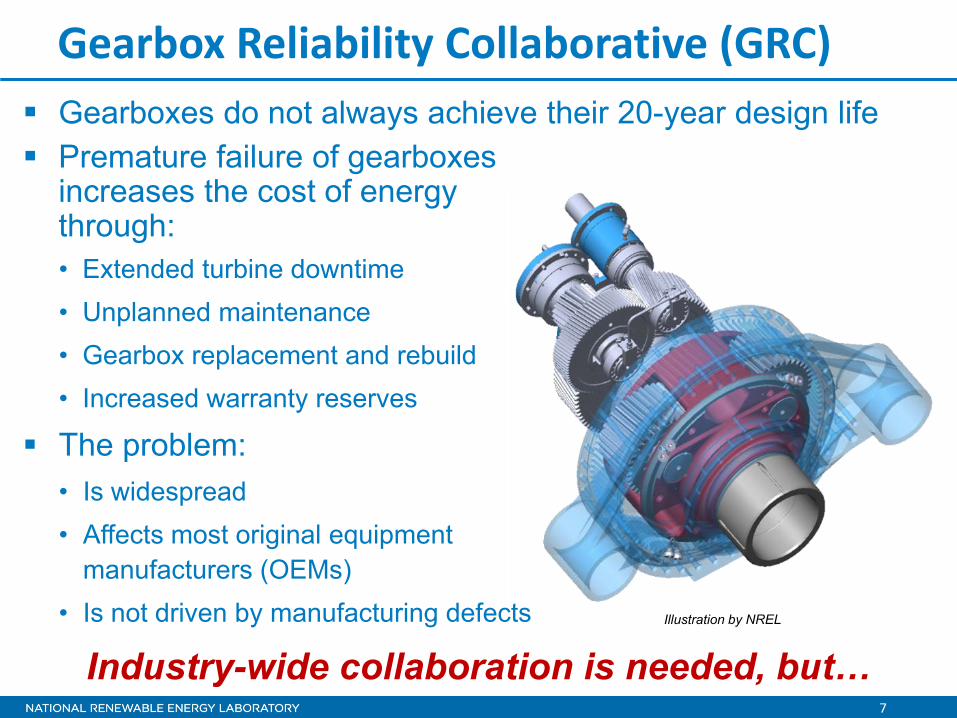
Gearbox Reliability Collaborative (GRC) Gearboxes do not always achieve their 20-year design life
Premature failure of gearboxes increases the cost of energy through: • Extended turbine downtime • Unplanned maintenance • Gearbox replacement and rebuild • Increased warranty reserves
The problem: • Is widespread • Affects most original equipment
manufacturers (OEMs) • Is not driven by manufacturing defects Illustration by NREL
Industry-wide collaboration is needed, but…
8
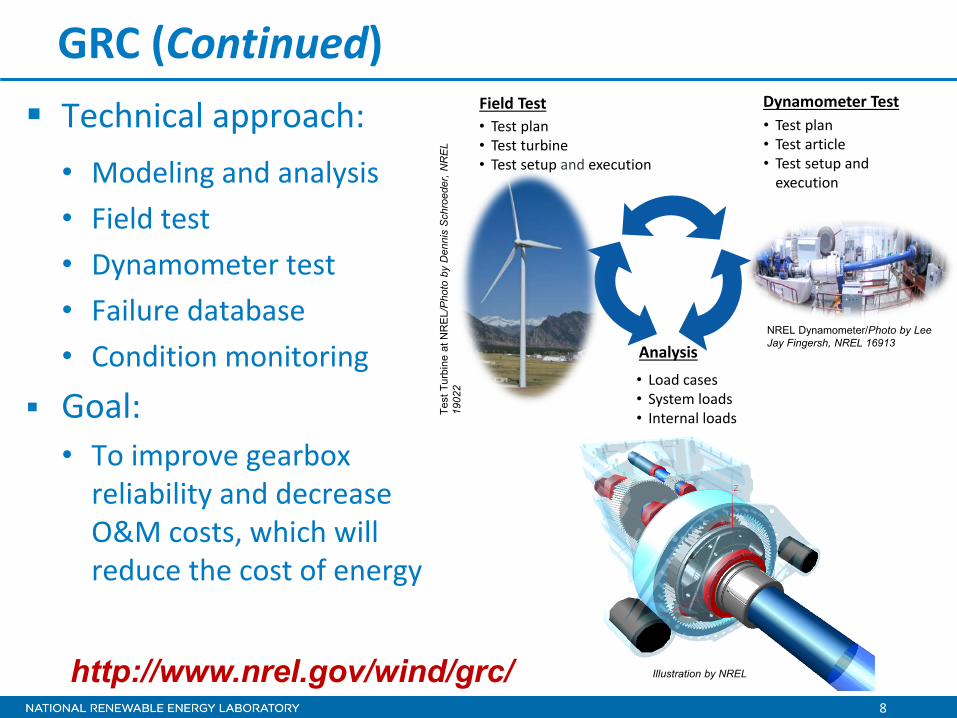
GRC (Continued) Technical approach: • Modeling and analysis • Field test • Dynamometer test • Failure database • Condition monitoring
Goal: • To improve gearbox
reliability and decrease O&M costs, which will reduce the cost of energy
Field Test Dynamometer Test • Test plan • Test article • Test setup and
execution
• Test plan • Test turbine • Test setup and execution
Analysis • Load cases • System loads • Internal loads
NREL Dynamometer/Photo by Lee Jay Fingersh, NREL 16913
Test
Tur
bine
at N
RE
L/P
hoto
by
Den
nis
Sch
roed
er, N
RE
L 19
022
Illustration by NREL
http://www.nrel.gov/wind/grc/
9
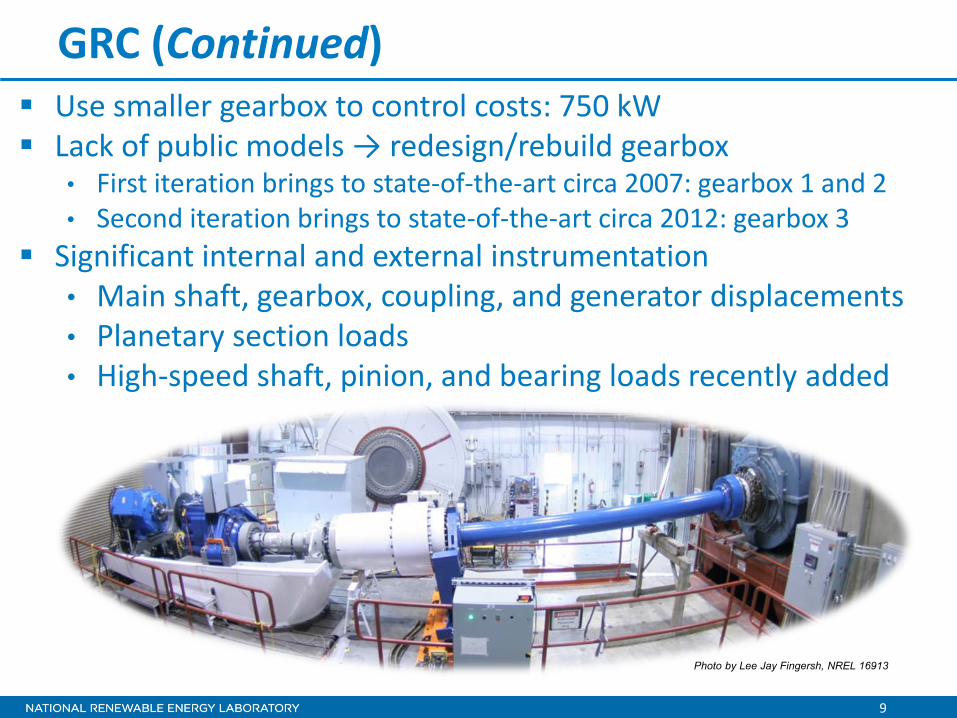
GRC (Continued) Use smaller gearbox to control costs: 750 kW Lack of public models → redesign/rebuild gearbox
• First iteration brings to state-of-the-art circa 2007: gearbox 1 and 2 • Second iteration brings to state-of-the-art circa 2012: gearbox 3
Significant internal and external instrumentation • Main shaft, gearbox, coupling, and generator displacements • Planetary section loads • High-speed shaft, pinion, and bearing loads recently added
Photo by Lee Jay Fingersh, NREL 16913
Status Update
11
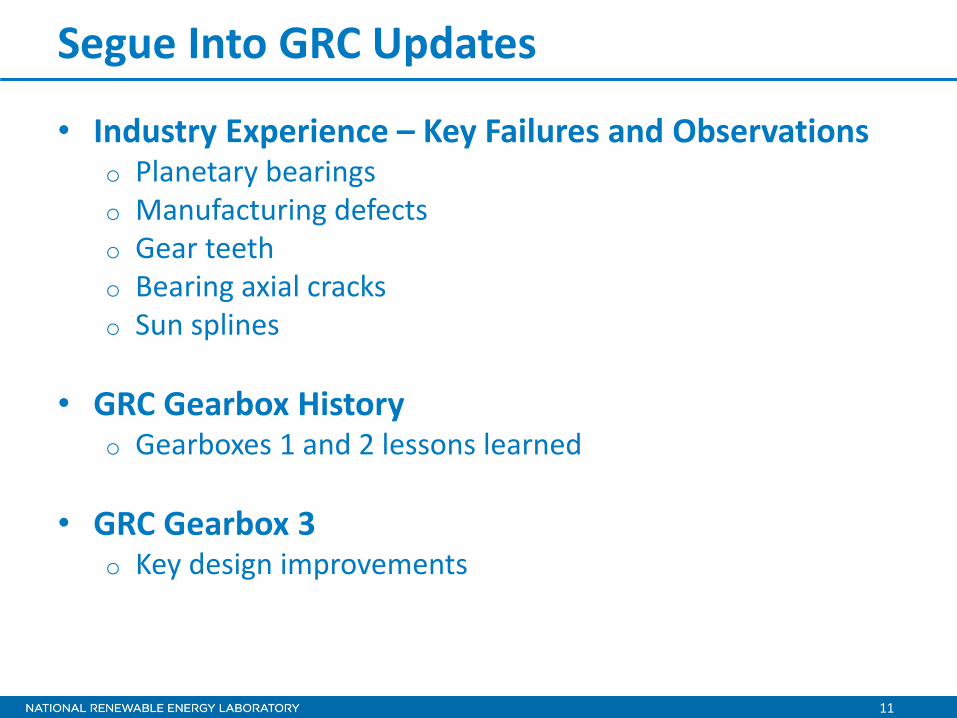
Segue Into GRC Updates
• Industry Experience – Key Failures and Observations o Planetary bearings o Manufacturing defects o Gear teeth o Bearing axial cracks o Sun splines
• GRC Gearbox History
o Gearboxes 1 and 2 lessons learned
• GRC Gearbox 3 o Key design improvements
12
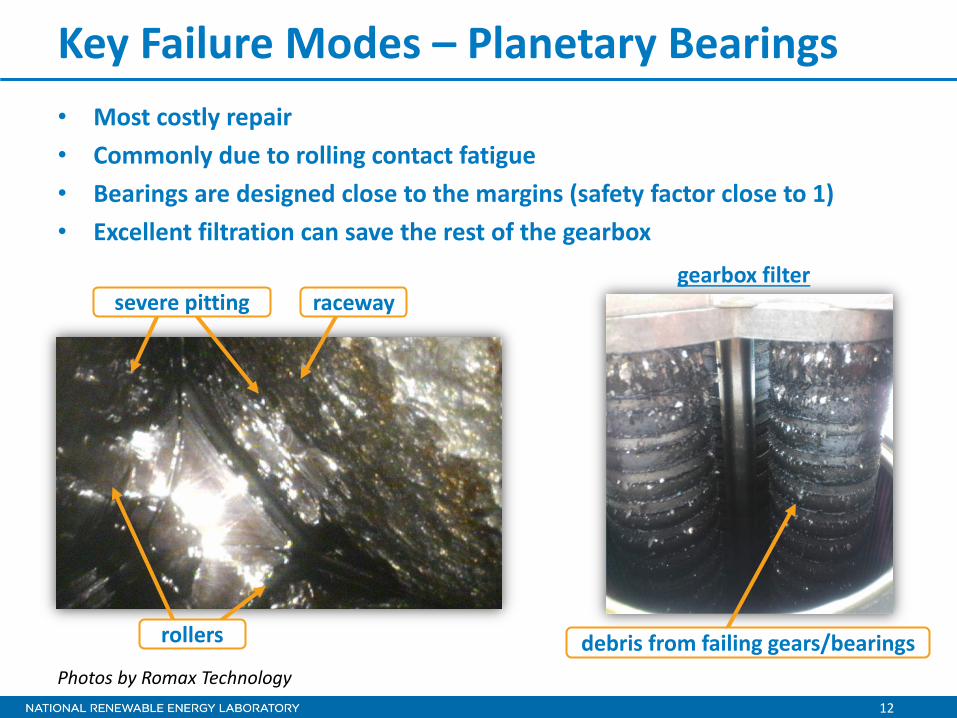
Key Failure Modes – Planetary Bearings • Most costly repair • Commonly due to rolling contact fatigue • Bearings are designed close to the margins (safety factor close to 1) • Excellent filtration can save the rest of the gearbox
rollers
severe pitting raceway gearbox filter
debris from failing gears/bearings Photos by Romax Technology
13
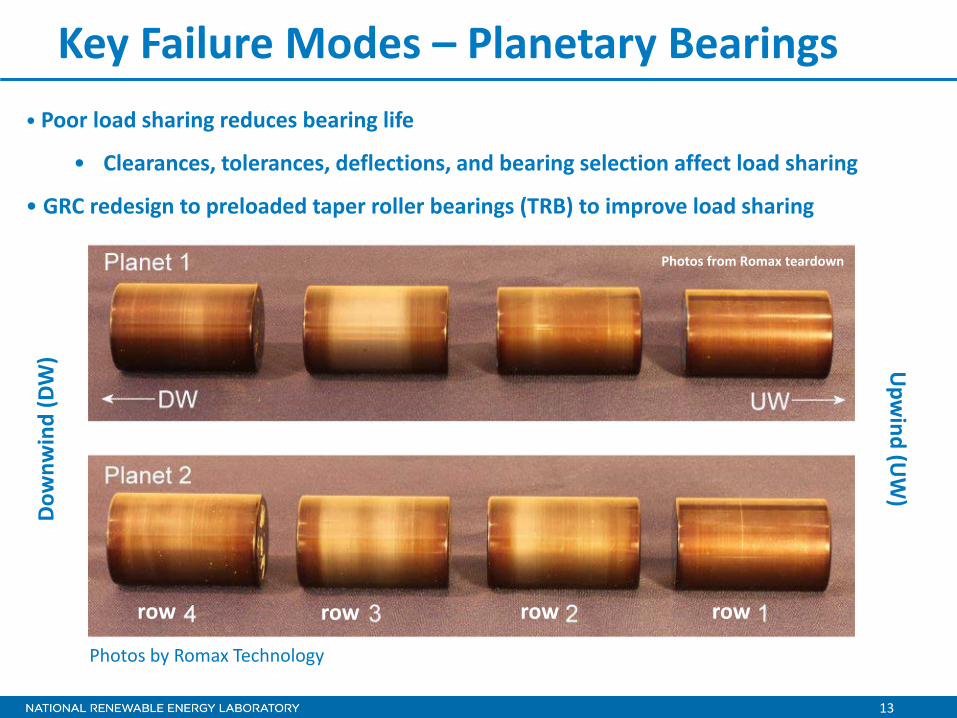
Key Failure Modes – Planetary Bearings • Poor load sharing reduces bearing life
• Clearances, tolerances, deflections, and bearing selection affect load sharing
• GRC redesign to preloaded taper roller bearings (TRB) to improve load sharing
Upw
ind (UW
) Dow
nwin
d (D
W)
row row row row
Photos from Romax teardown
Photos by Romax Technology
14
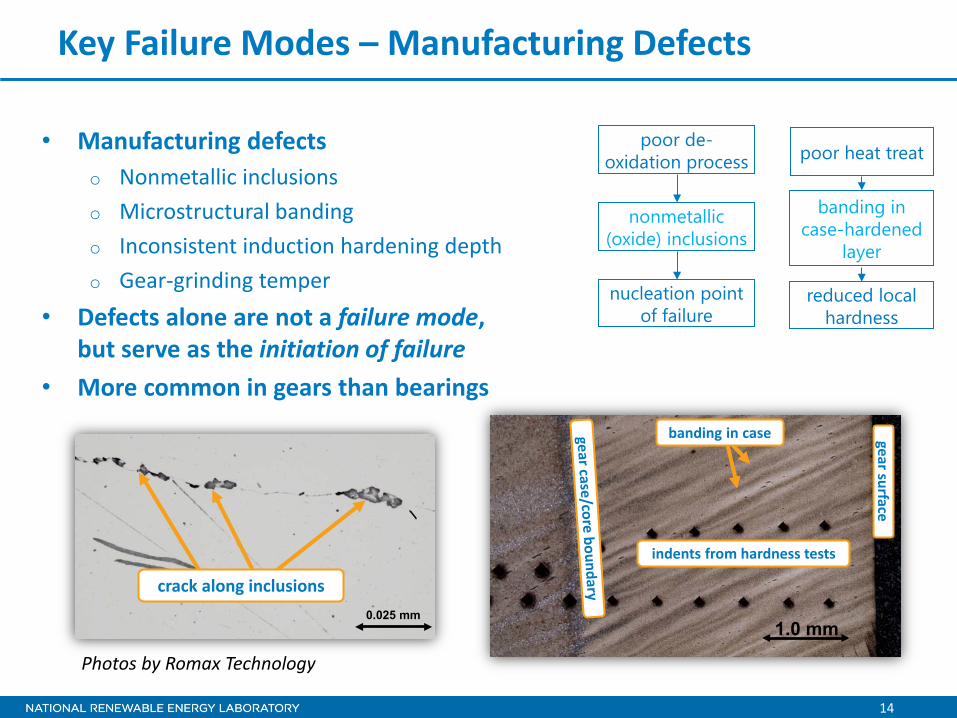
Key Failure Modes – Manufacturing Defects
• Manufacturing defects o Nonmetallic inclusions o Microstructural banding o Inconsistent induction hardening depth o Gear-grinding temper
• Defects alone are not a failure mode, but serve as the initiation of failure
• More common in gears than bearings
poor de-oxidation process
nonmetallic (oxide) inclusions
nucleation point of failure
0.025 mm
crack along inclusions
1.0 mm
indents from hardness tests
gear surface
banding in case
poor heat treat
banding in case-hardened
layer
reduced local hardness
Photos by Romax Technology
15
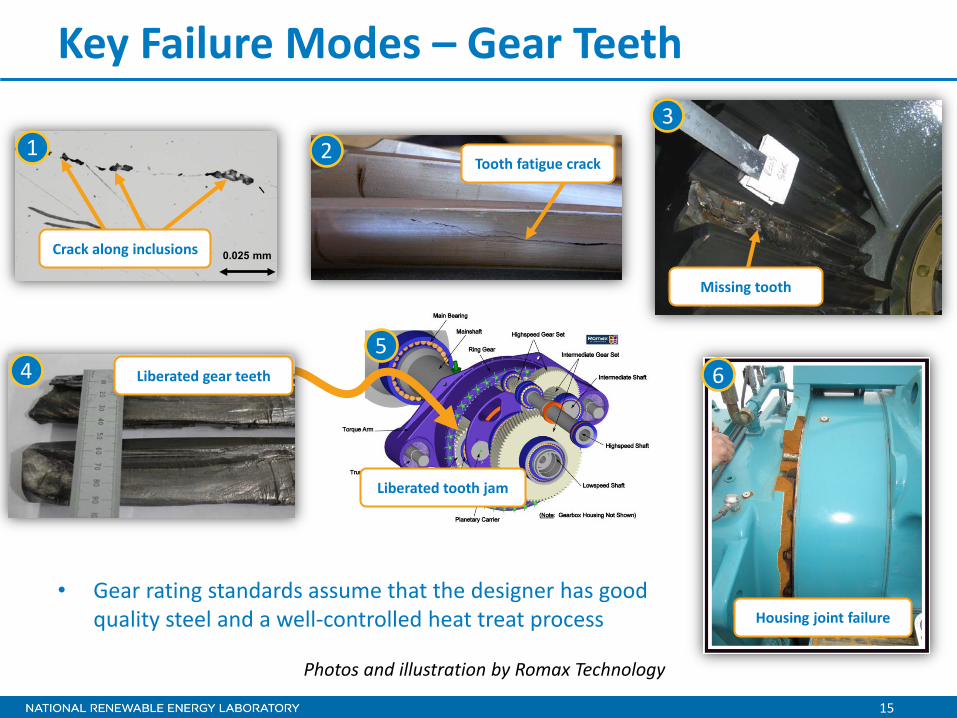
Key Failure Modes – Gear Teeth
• Gear rating standards assume that the designer has good quality steel and a well-controlled heat treat process
Tooth fatigue crack
0.025 mm Crack along inclusions
Missing tooth
Housing joint failure
Liberated gear teeth
Liberated tooth jam
1 2 3
4 5
6
Photos and illustration by Romax Technology
16
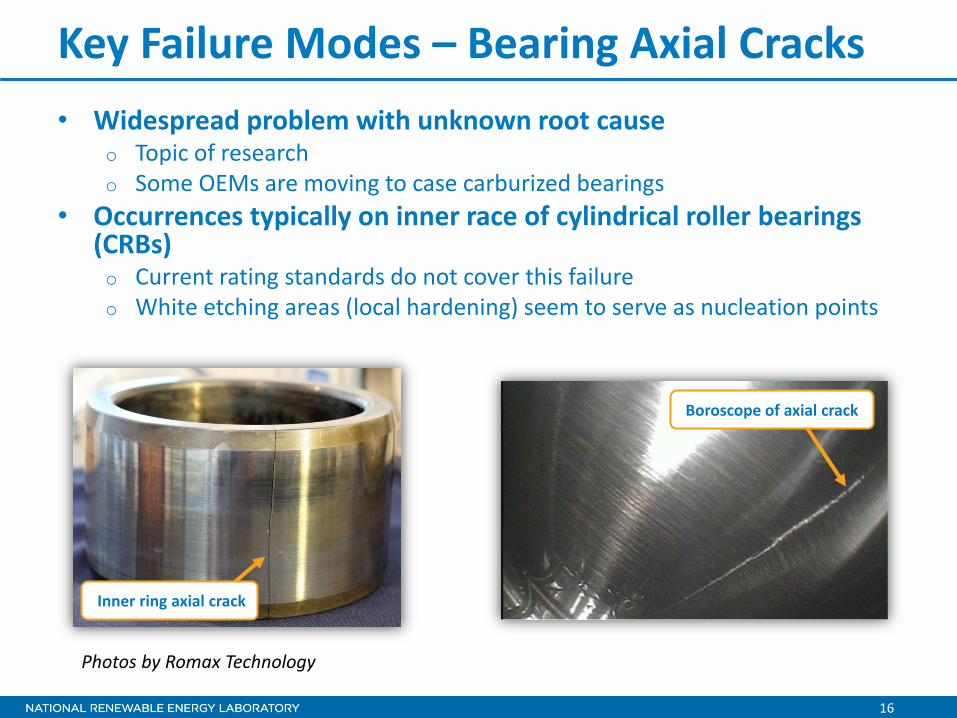
Key Failure Modes – Bearing Axial Cracks • Widespread problem with unknown root cause
o Topic of research o Some OEMs are moving to case carburized bearings
• Occurrences typically on inner race of cylindrical roller bearings (CRBs) o Current rating standards do not cover this failure o White etching areas (local hardening) seem to serve as nucleation points
Inner ring axial crack
Boroscope of axial crack
Photos by Romax Technology

17
Note About Sun Splines
• Commonly show signs of fretting and pitting o Difficult to lubricate
• Not a common failure mode o Debris generated is ideally flushed away with minimal
consequential damage to gears and bearings
Sun spline flank wear
Photos by Romax Technology
18
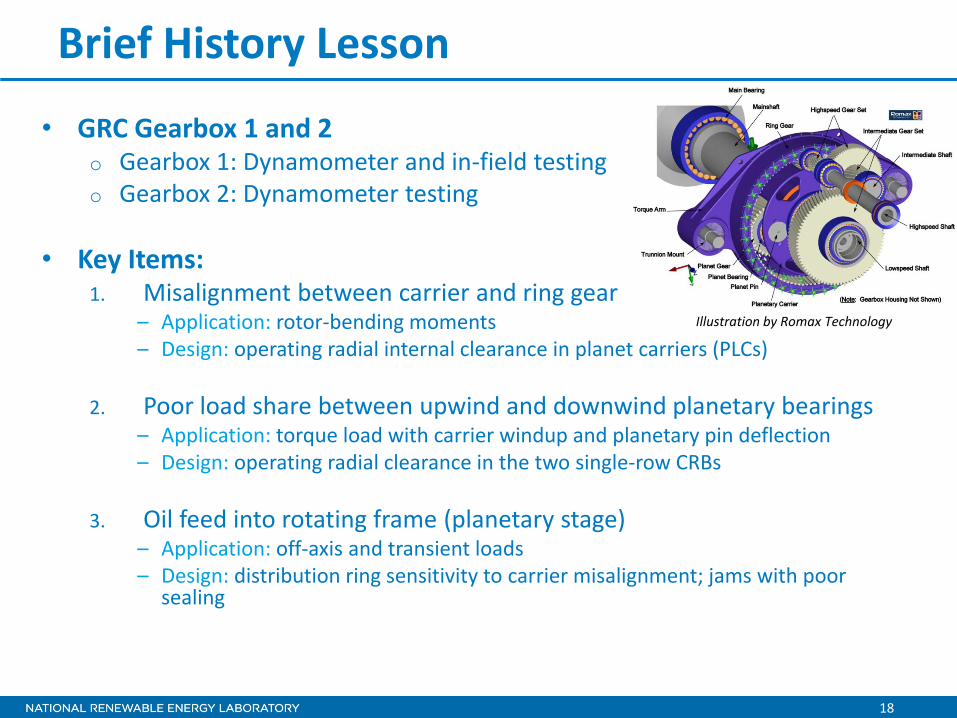
Brief History Lesson
• GRC Gearbox 1 and 2 o Gearbox 1: Dynamometer and in-field testing o Gearbox 2: Dynamometer testing
• Key Items:
1. Misalignment between carrier and ring gear – Application: rotor-bending moments – Design: operating radial internal clearance in planet carriers (PLCs)
2. Poor load share between upwind and downwind planetary bearings
– Application: torque load with carrier windup and planetary pin deflection – Design: operating radial clearance in the two single-row CRBs
3. Oil feed into rotating frame (planetary stage)
– Application: off-axis and transient loads – Design: distribution ring sensitivity to carrier misalignment; jams with poor
sealing
Illustration by Romax Technology
19
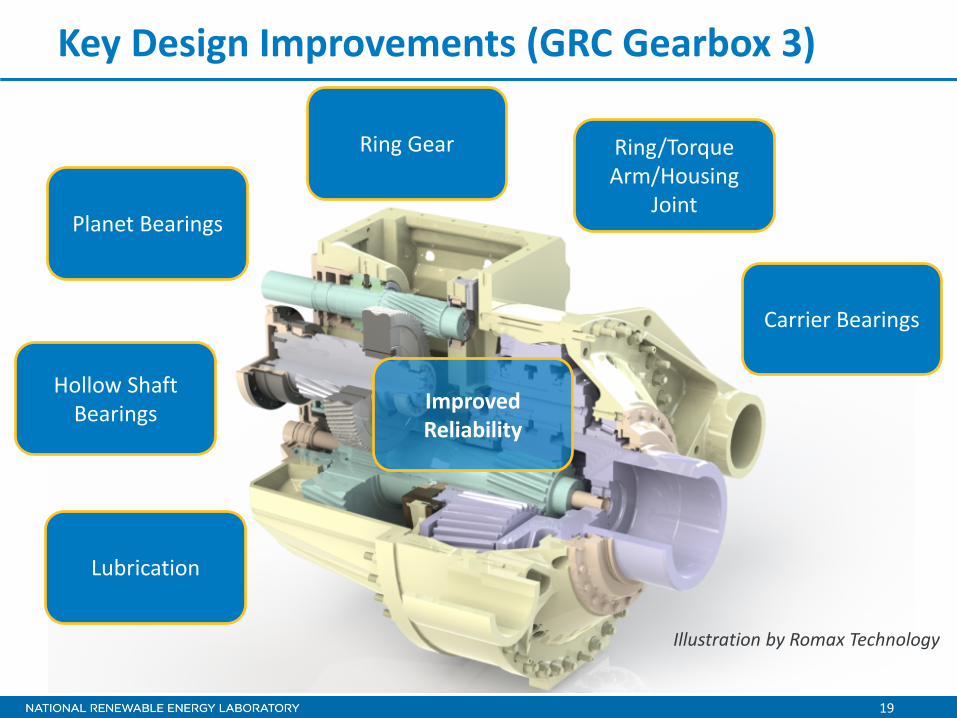
Carrier Bearings
Planet Bearings
Ring/Torque Arm/Housing
Joint
Ring Gear
Hollow Shaft Bearings Improved
Reliability
Lubrication
Illustration by Romax Technology
Key Design Improvements (GRC Gearbox 3)
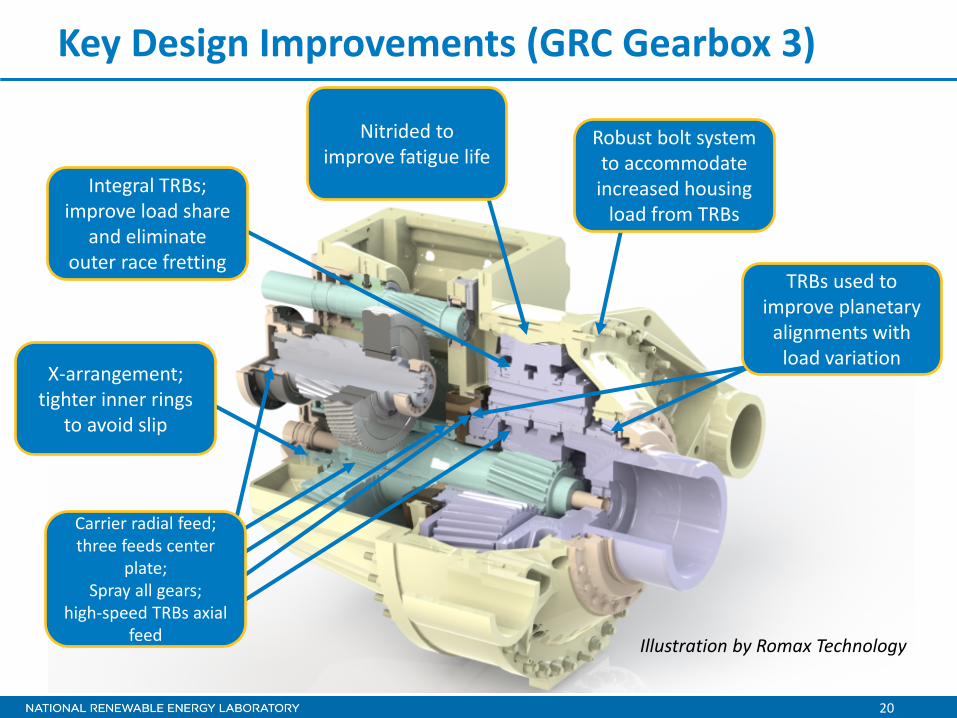
20
TRBs used to improve planetary
alignments with load variation
Robust bolt system to accommodate increased housing
load from TRBs
Nitrided to improve fatigue life
Integral TRBs; improve load share
and eliminate outer race fretting
X-arrangement; tighter inner rings
to avoid slip
Carrier radial feed; three feeds center
plate; Spray all gears;
high-speed TRBs axial feed Illustration by Romax Technology
Key Design Improvements (GRC Gearbox 3)
21
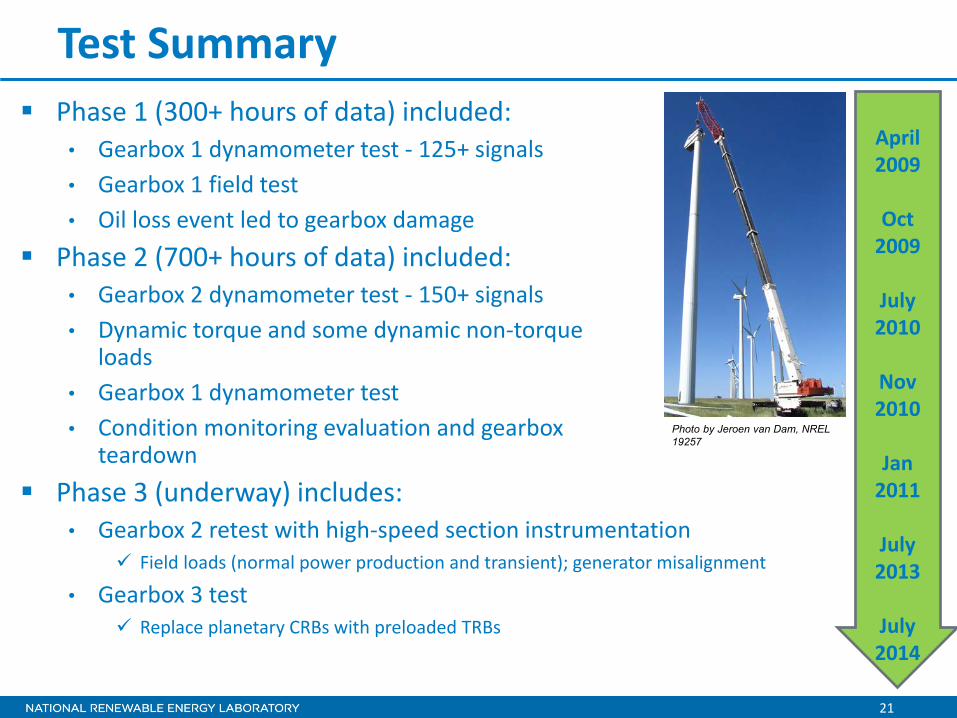
Test Summary Phase 1 (300+ hours of data) included:
• Gearbox 1 dynamometer test - 125+ signals • Gearbox 1 field test • Oil loss event led to gearbox damage
Phase 2 (700+ hours of data) included: • Gearbox 2 dynamometer test - 150+ signals • Dynamic torque and some dynamic non-torque
loads • Gearbox 1 dynamometer test • Condition monitoring evaluation and gearbox
teardown Phase 3 (underway) includes:
• Gearbox 2 retest with high-speed section instrumentation Field loads (normal power production and transient); generator misalignment
• Gearbox 3 test Replace planetary CRBs with preloaded TRBs
April 2009
Oct
2009
July 2010
Nov 2010
Jan
2011
July 2013
July 2014
Photo by Jeroen van Dam, NREL 19257
22
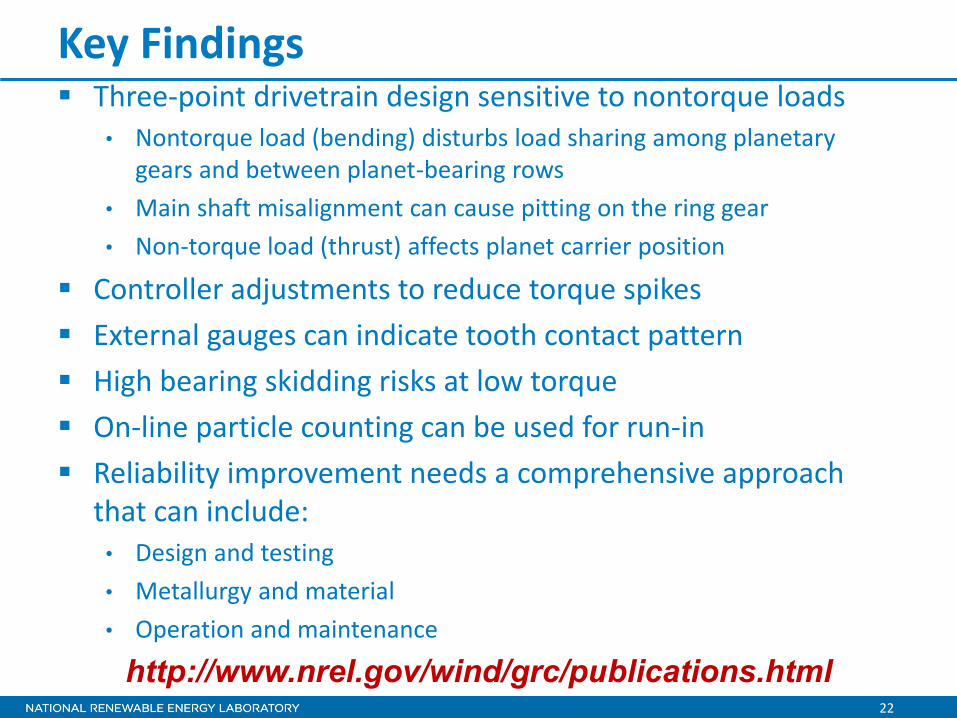
Key Findings Three-point drivetrain design sensitive to nontorque loads
• Nontorque load (bending) disturbs load sharing among planetary gears and between planet-bearing rows
• Main shaft misalignment can cause pitting on the ring gear • Non-torque load (thrust) affects planet carrier position
Controller adjustments to reduce torque spikes External gauges can indicate tooth contact pattern High bearing skidding risks at low torque On-line particle counting can be used for run-in Reliability improvement needs a comprehensive approach
that can include: • Design and testing • Metallurgy and material • Operation and maintenance
http://www.nrel.gov/wind/grc/publications.html
23
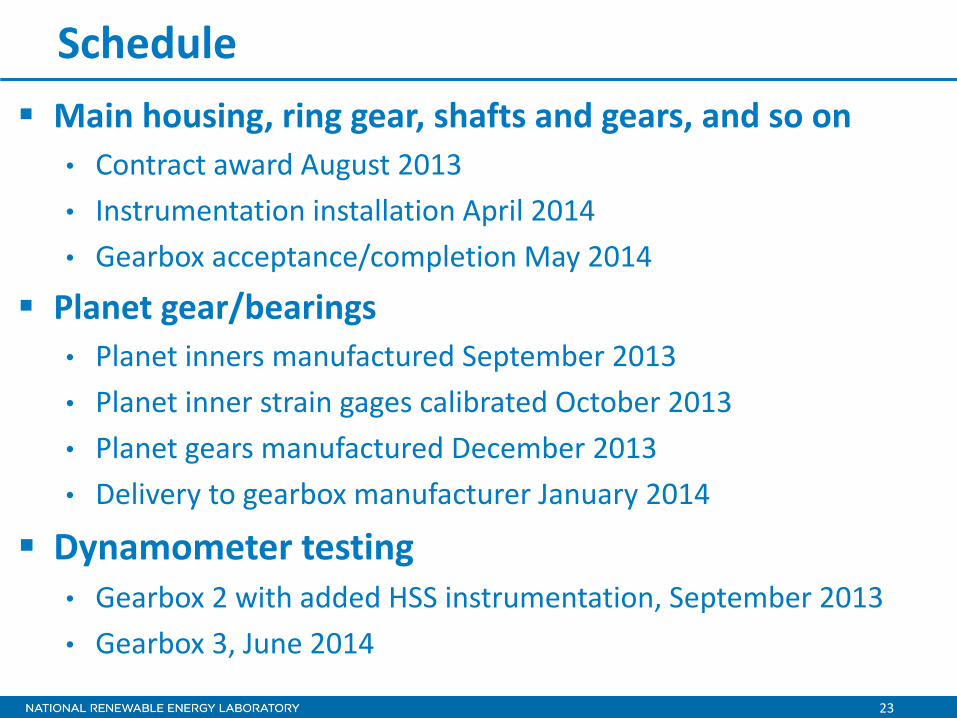
Schedule Main housing, ring gear, shafts and gears, and so on
• Contract award August 2013 • Instrumentation installation April 2014 • Gearbox acceptance/completion May 2014
Planet gear/bearings • Planet inners manufactured September 2013 • Planet inner strain gages calibrated October 2013 • Planet gears manufactured December 2013 • Delivery to gearbox manufacturer January 2014
Dynamometer testing • Gearbox 2 with added HSS instrumentation, September 2013 • Gearbox 3, June 2014

Next Steps
25
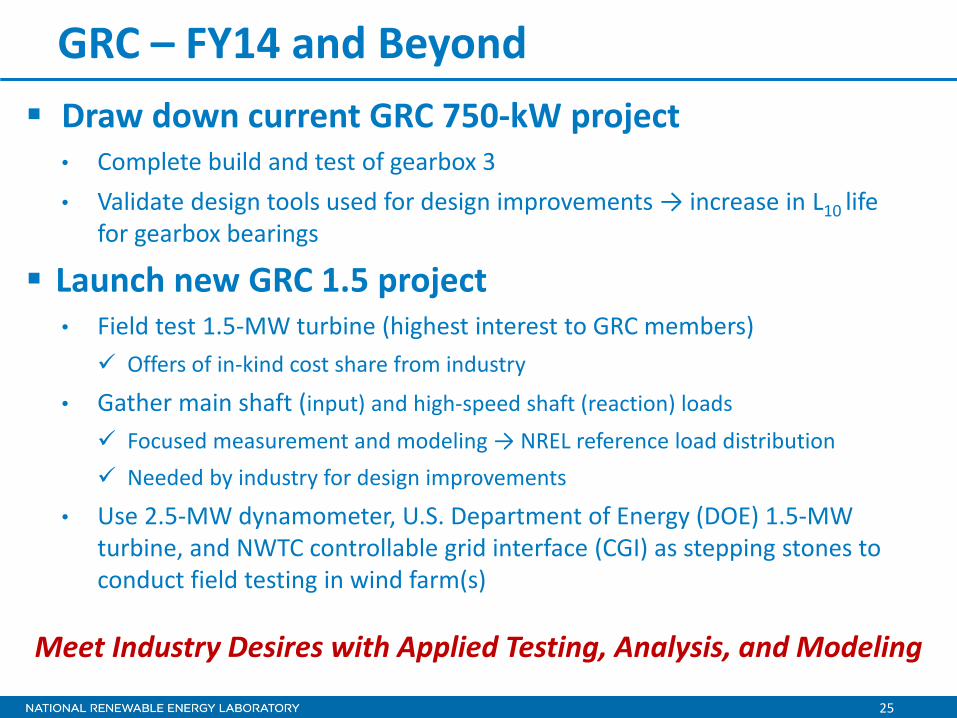
GRC – FY14 and Beyond Draw down current GRC 750-kW project
• Complete build and test of gearbox 3 • Validate design tools used for design improvements → increase in L10 life
for gearbox bearings
Launch new GRC 1.5 project • Field test 1.5-MW turbine (highest interest to GRC members) Offers of in-kind cost share from industry
• Gather main shaft (input) and high-speed shaft (reaction) loads Focused measurement and modeling → NREL reference load distribution Needed by industry for design improvements
• Use 2.5-MW dynamometer, U.S. Department of Energy (DOE) 1.5-MW turbine, and NWTC controllable grid interface (CGI) as stepping stones to conduct field testing in wind farm(s)
Meet Industry Desires with Applied Testing, Analysis, and Modeling
Several Other Reliability R&D Activities

27
Testing
Siemens 2.3 MW
Alstom 3 MW
DOE/GE 1.5 MW
Gamesa 2 MW
Control Advanced Research Turbines 2 x 600 kW
PV Array 1.1 MW
2.5-MW dynamometer
Field testing of commercial megawatt scale and small (under 100 kW) wind turbines
Dynamometer testing facilities: 250 kW, 2.5 MW, and 5 MW Static and fatigue tests of blades Grid compliance testing: a 7-MW controllable grid interface (CGI) Multimegawatt energy storage testing capability under development
5-MW dynamometer, 7-MW CGI
Photo by Vahan Gevorgian, NREL
28
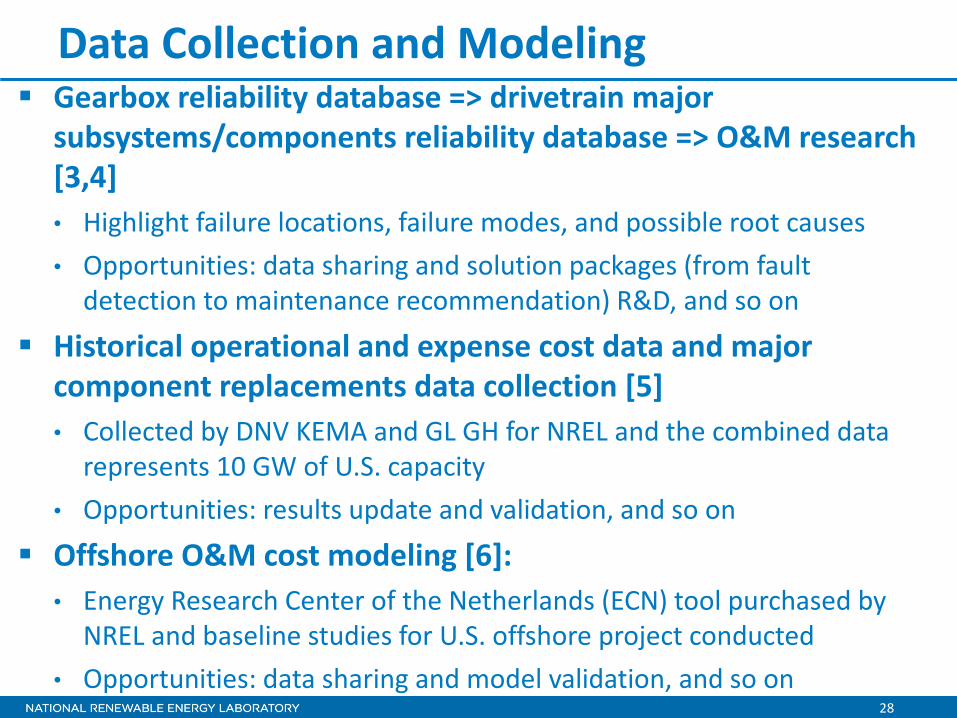
Data Collection and Modeling Gearbox reliability database => drivetrain major
subsystems/components reliability database => O&M research [3,4] • Highlight failure locations, failure modes, and possible root causes • Opportunities: data sharing and solution packages (from fault
detection to maintenance recommendation) R&D, and so on
Historical operational and expense cost data and major component replacements data collection [5] • Collected by DNV KEMA and GL GH for NREL and the combined data
represents 10 GW of U.S. capacity • Opportunities: results update and validation, and so on
Offshore O&M cost modeling [6]: • Energy Research Center of the Netherlands (ECN) tool purchased by
NREL and baseline studies for U.S. offshore project conducted • Opportunities: data sharing and model validation, and so on
29
References 1. Tavner, P. “How Are We Going to Make Offshore Wind Farms More Reliable?”
Presented at the 2011 SUPERGEN Wind General Assembly on March 20, 2011 at Durham University, UK.
2. Sheng, S. “Investigation of Various Wind Turbine Drivetrain Condition Monitoring Techniques.” Presented at the 2011 Wind Turbine Reliability Workshop, August 2−3, 2012 Albuquerque, NM.
3. Sheng, S. “Report on Wind Turbine Subsystem Reliability - A Survey of Various Databases.” NREL/PR-5000-59111.
4. Sheng, S. “Wind Turbine O&M and Condition Monitoring Research.” Presented at the 2013 GRC All Member Meeting, February 4−5, 2013, Golden, CO.
5. Lantz, E. “Operations Expenditures: Historical Trends and Continuing Challenges.” Presented at AWEA Wind Power Conference, May 5−8, 2013, Chicago, IL. NREL/PR-6A20-58606.
6. Meadows, R. Offshore O&M Cost Drivers - A U.S. Case Study, NREL Report No. TP-5000-58908 (forthcoming).
30
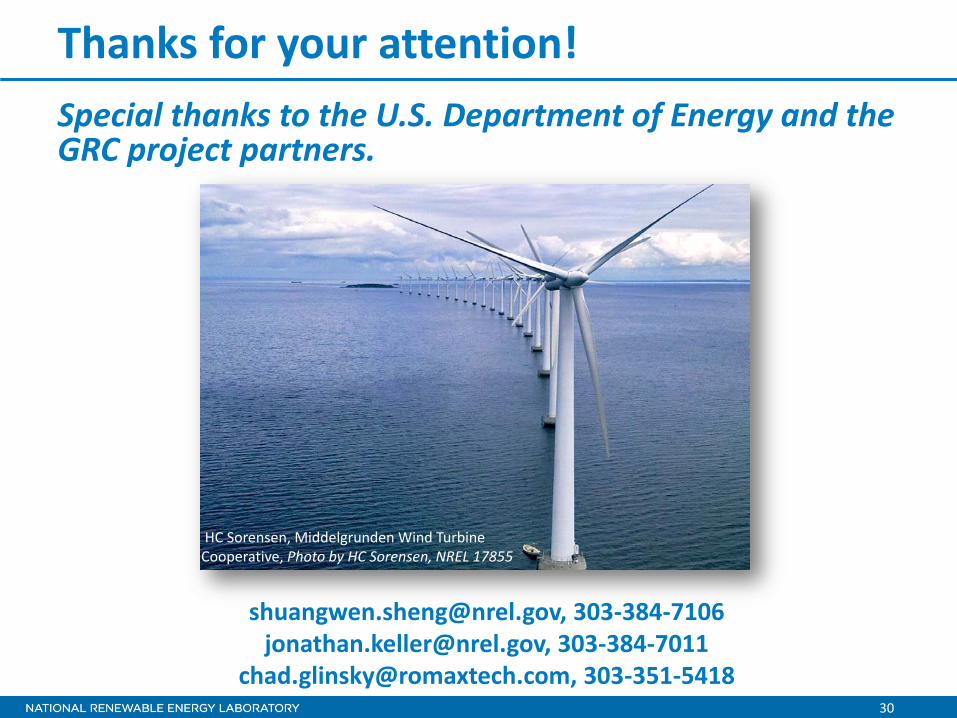
Thanks for your attention!
HC Sorensen, Middelgrunden Wind Turbine Cooperative, Photo by HC Sorensen, NREL 17855
[email protected], 303-384-7106 [email protected], 303-384-7011
[email protected], 303-351-5418
Special thanks to the U.S. Department of Energy and the GRC project partners.