gcan presentation to nigeria usaid mission slide deck
TRANSCRIPT

Gender, Climate, and Nutrition Integration Initiative (GCAN):
Insights for Nigeria
Tim Thomas, Elizabeth Bryan, Carlo Azzarri, Jowel ChoufaniEnvironment and Production Technology Division
International Food Policy Research Institute

GCAN ACTIVITIES• Objective: Support FTF focus countries to understand and use
climate data for climate-smart agriculture (CSA) programming that
integrates nutrition and gender for increased resilience under the
Global Food Security Strategy
• Activities include:
1. Framework and tools for understanding conceptually the
structural connections among climate change, CSA,
gender and nutrition.
2. Research and knowledge management to help answer
missions’ priority questions related to climate, gender, and
nutrition
3. Enhanced use of FTF open data, including mapping


OBJECTIVES
Review the projected impact of climate change on
agriculture and livelihoods in the FTF ZOI
Consider how climate change affects nutrition (& what to
do)
Consider how gender affects ability to adapt to climate
change (& what to do)
Initiate a dialogue about potential research and mission
support that can fill evidence gaps to inform mission
programming in support of the 2016 Global Food Security
Act and Strategy

Photo Credit Goes Here
Overview of Land Use and
Agriculture
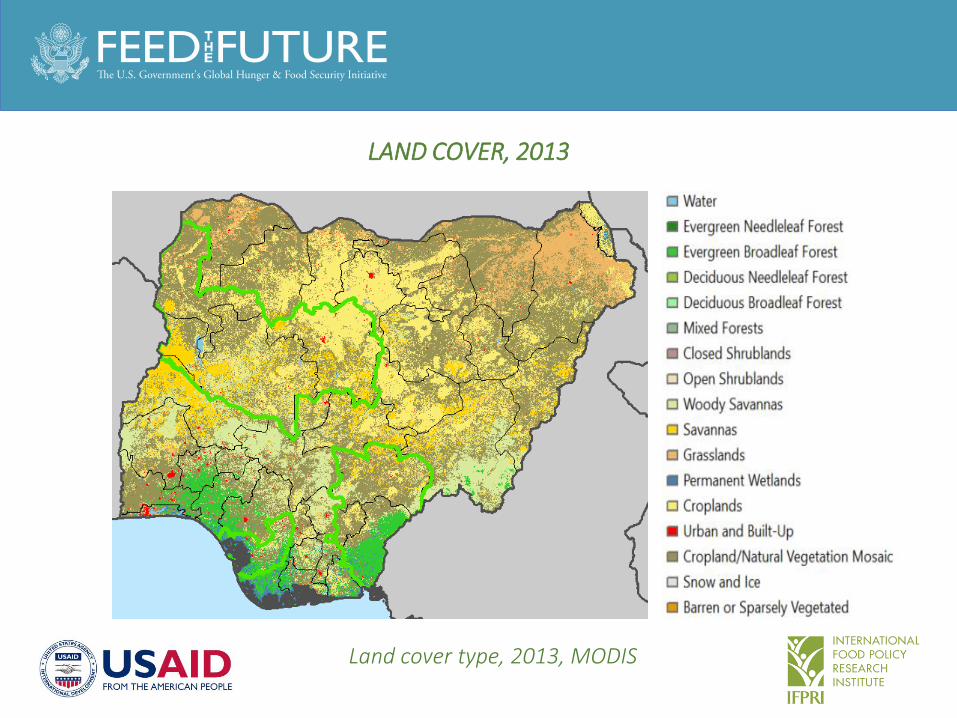
LAND COVER, 2013
Land cover type, 2013, MODIS

SUMMARY OF LAND CATEGORIES FOR NIGERIA, 2009
Land category Area (sq km)
Water 1,766Evergreen Needleleaf Forest 56Evergreen Broadleaf Forest 46,891Deciduous Needleleaf Forest 28Deciduous Broadleaf Forest 14,896Mixed Forests 97Closed Shrublands 2,398Open Shrublands 3,083Woody Savannas 182,532Savannas 97,548Grasslands 151,517Permanent Wetlands 15,352Croplands 136,807Urban and Built-Up 4,624Cropland/Natural Vegetation Mosaic 253,824Snow and Ice 3Barren or Sparsely Vegetated 320
Source: Authors, based on MCD12Q1, 2009, NASA (2015)

TEN LEADING CROPS OF NIGERIA, BY HARVESTED AREA, 2010-2012
Source: FAOSTAT (FAO 2014).
Item
Rank by area
harvested
Hectares harvested, avg 2010-
2012
Tons produced, avg 2010-
2012
Yield, 2010-2012
Maize 1 5,119,260 8,755,707 1.71Sorghum 2 5,117,094 6,979,344 1.36Cassava 3 3,689,663 49,645,544 13.46Millet 4 3,684,387 3,813,843 1.04Oil, palm fruit 5 3,216,667 8,033,334 2.5Cow peas, dry 6 3,083,247 2,576,350 0.84Yams 7 2,886,013 36,425,856 12.62Rice, paddy 8 2,565,723 4,624,280 1.8Groundnuts, with shell 9 2,517,330 3,277,334 1.3Cocoa, beans 10 1,236,143 391,067 0.32Sweet potatoes 11 1,105,000 3,333,333 3.02

VALUE OF PRODUCTION
Source: FAOSTAT (FAO 2014).
Item Rank by valueValue of production,
avg 2010-2012Yams 1 9,290,196Cassava 2 5,186,123Fruit, citrus other 3 1,732,874Groundnuts, with shell 4 1,478,546Rice, paddy 5 1,288,602Maize 6 1,240,377Vegetables, fresh other 7 1,139,792Sorghum 8 1,073,451Cow peas, dry 9 865,092Meat indigenous, cattle 10 819,417Cashew nuts, with shell 11 729,865Millet 12 692,014

Photo Credit Goes Here
Climate of Nigeria

MEAN ANNUAL PRECIPITATION, MM, 1950-2000
Source: WorldClim 1.4 (Hijmans et al.).
Note: Feed the
Future zone is
outlined in green.

MEAN DAILY MAXIMUM TEMPERATURE FOR THE WARMEST MONTH, 0C, 1950-2000
Source: WorldClim 1.4 (Hijmans et al.).
Note: Feed the
Future zone is
outlined in green.

TEMPERATURE AND RAINFALL FOR NIGERIA, 1950-2000
Percentile
Mean daily maximum
temperature, warmest
month, 0C
Mean annual
precipitation,
mm
Minimum 28.1 2535th 32.2 47610th 32.7 57725th 34.5 83550th 36.5 1,12975th 37.9 1,33790th 39.2 1,87795th 39.7 2,377Maximum 41.2 3,878Mean 36.2 1,183
Source: WorldClim 1.4 (Hijmans et al.).

Photo Credit Goes Here
Climate Change Projections for
Nigeria

CHANGE IN MEAN ANNUAL PRECIPITATION, MM, 2000-2050
Note: RCP 8.5.
Climate models
clockwise from
top left: GFDL,
HadGEM, MIROC,
and IPSL. Feed
the Future zone is
outlined in green.

CHANGE IN ANNUAL RAINFALL BY FTF ZONE, 2000-2050
25-75 Within interquartile (IQ) range10-25 Moderately below IQ range75-90 Moderately above IQ range< 10 Considerably below IQ range> 90 Considerably above IQ range
Base (1960-1990)
Change in annual rainfall, percentiles across 32 GCMs in average for 1960-1990 to 2050
Change in annual rainfall, 1960-1990 to 2050
FTF 0 (min) 10 25 50 75 90100
(max) GFDLHad-GEM IPSL MIROC
1 2,477 -276 -126 -63 38 141 181 544 13 68 -26 -502 1,823 -223 -120 3 65 129 191 230 39 113 21 2053 1,117 -265 -49 -32 40 88 117 388 -196 69 -36 387
All FTF 1,395 -251 -80 -14 57 84 154 309 -121 80 -21 309
Nigeria 1,176 -204 -60 -8 50 88 148 272 -123 102 -5 267

CHANGE IN MEAN DAILY MAXIMUM TEMPERATURE FOR THE WARMEST MONTH, 0C, 2000-2050
Note: RCP 8.5.
Climate models
clockwise from
top left: GFDL,
HadGEM, MIROC,
and IPSL. Feed
the Future zone is
outlined in green.

CHANGE IN MEAN DAILY MAXIMUM TEMPERATURE OF THE WARMEST MONTH BY FTF ZONE, 2000-2050
25-75 Within interquartile (IQ) range10-25 Moderately below IQ range75-90 Moderately above IQ range< 10 Considerably below IQ range> 90 Considerably above IQ range
Base (1960-1990)
Change in mean daily maximum temperature for the warmest month, 0C, percentiles across 32
GCMs in average for 1960-1990 to 2050
Change in mean daily maximum temperature for the warmest month, 0C, 1960-1990 to 2050
FTF 0 (min) 10 25 50 75 90100
(max) GFDLHad-GEM IPSL MIROC
1 32.7 0.8 1.6 1.7 2.2 2.8 3.2 4.2 2.0 2.6 3.2 0.82 34.4 1.7 2.0 2.2 2.6 3.0 3.3 4.7 2.4 2.7 3.2 2.23 37.0 0.4 2.0 2.2 2.7 3.0 3.4 3.6 2.0 3.0 3.6 2.9
All FTF 36.0 1.4 1.9 2.2 2.5 2.9 3.3 3.9 2.1 2.9 3.5 2.6
Nigeria 36.4 1.8 1.9 2.1 2.5 3.1 3.4 3.7 2.0 3.1 3.4 2.5
Photo Credit Goes Here
Projected Impact of Climate
Change on Agriculture

HARVESTED AREA FOR RAINFED SORGHUM AND MILLET, HECTARES PER PIXEL, CIRCA 2005
Source: SPAM 2005 (You et al. 2014).
Notes: A pixel at the equator has approximately 8,500 hectares in it.
Sorghum Millet
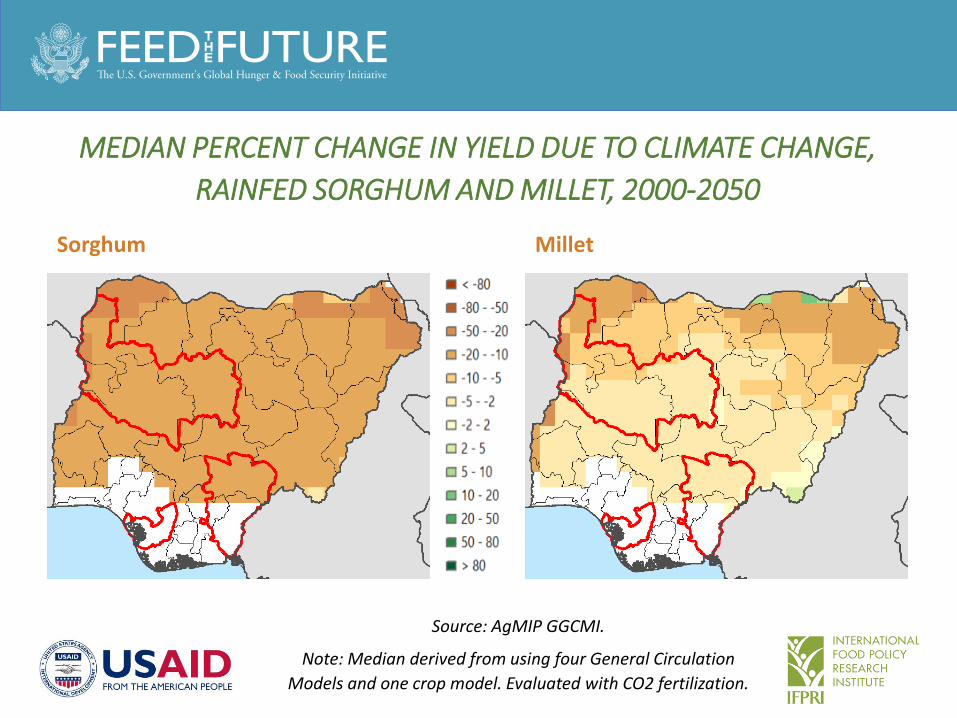
MEDIAN PERCENT CHANGE IN YIELD DUE TO CLIMATE CHANGE,
RAINFED SORGHUM AND MILLET, 2000-2050
Sorghum Millet
Source: AgMIP GGCMI.
Note: Median derived from using four General Circulation
Models and one crop model. Evaluated with CO2 fertilization.

HARVESTED AREA FOR RAINFED MAIZE AND CASSAVA, HECTARES PER PIXEL, CIRCA 2005
Source: SPAM 2005 (You et al. 2014).
Notes: A pixel at the equator has approximately 8,500 hectares in it.
Maize Cassava

MEDIAN PERCENT CHANGE IN YIELD DUE TO CLIMATE CHANGE,
RAINFED MAIZE AND CASSAVA, 2000-2050
Maize Cassava
Source: AgMIP GGCMI.
Note: Median derived from using four General Circulation
Models and one crop model. Evaluated with CO2 fertilization.

CLIMATE IMPACT ON NIGERIA’S LEADING RAINFED CROPS, 2000-2050
Source: AgMIP GGCMI.
Note: Median derived from using four General Circulation
Models and one crop model. Evaluated with CO2 fertilization.

PRIORITY ACTIONS RELATED TO CSA IN THE NIGERIA’S INDC
• Adopt improved agricultural systems for both crops and livestock -diversify livestock and improve range management; increase access to drought resistant crops and livestock feeds; adopt better soil management practices; and provide early warning/meteorological forecasts and related information
• Implement strategies for improved resource management - increase irrigation, rainwater & sustainable groundwater harvesting, planting of native vegetation cover & promotion of re-greening efforts; and intensify crop and livestock production in place of slash and burn
• Enhance artisanal fisheries and encourage sustainable aquaculture as adaptation options for fishing communities

CSA PRACTICES BEING IMPLEMENTED IN NIGERIA
• Conservation agriculture
• Integrated crop management
• Crop rotation and cover crops, nitrogen management and fertilization regimes, including oil palm tree residues as manure (potash content)
• Improved HY DT cereals, grain legumes, R&T with tolerance to major disease and pests [ex: NERICA (upland rice) and DT maize varieties. Use of salt tolerant Varieties (e.g. Ex-Dakar cultivar of groundnut).
• National Program for Food Security of Nigeria (NPFS) supports promotion and development of UDP technique in several Nigerian states

Photo Credit Goes Here
Climate and nutrition:
Considerations for nutrition-sensitive
climate resilience programming

NUTRITION PROFILE• Priorities:
– Global Hunger Index 2016= Score 25.5 (Serious) – Stunting in children under 5 years: 32.9% (WHO cutoff
≥20%). Rank: 98/132. – Wasting in children under 5 years: 7.9% (WHO cutoff ≥5%).
Rank: 93/130. – Overweight and Obesity in adults: 33.3%. Rank: 54/190
• Micronutrient deficiencies (varies with urban/rural, wealth quintile)– Anemia in women of reproductive age: 48.5% (WHO cutoff
≥20%). Rank: 172/185– Anemia in preschool-aged children: 71.0%
Global Nutrition Report 2016;
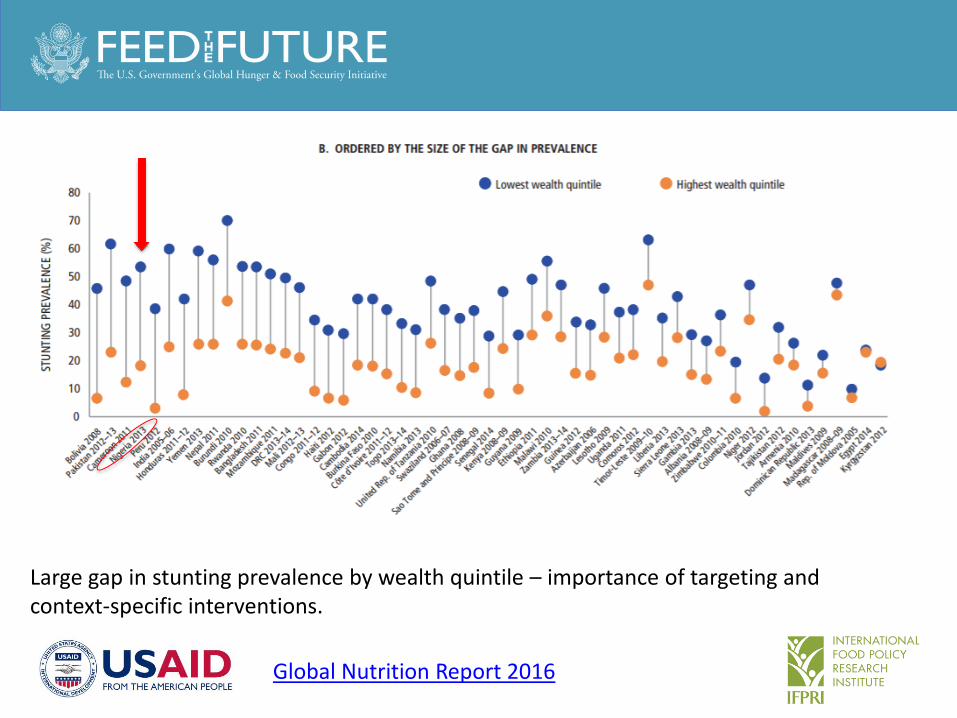
Global Nutrition Report 2016
Large gap in stunting prevalence by wealth quintile – importance of targeting and context-specific interventions.


Source: Fanzo, Downs and McLaren 2017
Input Supply
Production Post Harvest Storage
Processing Distribution Marketing and Retail
Consumption Food Utilization
Limited available land, soil
degradation, loss of biodiversity,
temperature and water stress, CO2
effects
Contamination, spoilage, increased electricity demands,
damage from extreme weather events
Improper processing of
foods, nutrient losses during
milling, combination
with unhealthy ingredients
Climate impacts on
transportation and retail
infrastructure, export/import
impacts on prices and availability
Lack of access to inputs (seeds,
fertilizer, irrigation, extension)
Advertising campaigns for
unhealthy foods, loss of
small food retailers
Lack of knowledge of
nutrition, nutrient losses
during preparation,
increased diarrhea &
enteropathy
Minimize nutrition “exiting” the value chain
Maximize nutrition “entering” the food value chain
New production locations,
diversification, CO2
fertilization, focus on women farmers,
extension
Aflatoxin control,
refrigeration
Fermentation, drying,
fortification, product
reformulation (reduce salt,
sugar, unhealthy fats)
Moving food from areas of shortage to
areas of surplus,
targeting of vulnerable
groups
Improved varieties, bio-fortification,
fertilizer, irrigation
Messaging on the
importance of nutrition and sustainability,
benefits of certain foods
Home fortification
(fish powders), training in
nutritious food preparation, time mgmt,
food preservation
Response: Nutrition-sensitive value chains

• Examine the link between agriculture revenue, diversification and dietary diversity in rural agricultural households small but significant effect
• Low production diversity across the sample
¹Dillon et al (2015)
Pathways: Climate, Agricultural Revenue,
and Dietary diversity

• A 10% increase of agricultural revenue:
• 1.8% increase in dietary diversity
• Increases the likelihood of a household reporting consumption of vegetables by 7.2 % & fish by 3.5%
• Decrease in consumption share of beverages by 5.9% but increases the consumption share of tubers by 5.2% Could suggest that as households increase agricultural revenue, beverage consumption is replaced by healthier tuber consumption.
• Other factors play a role:
• Gender - HHs with male heads less likely to have diverse diet compared to those with female heads
• Education - HHs with better-educated heads had more diverse diets while households with older heads had less diverse diets.
¹Dillon et al (2015)
Pathways: Climate, Agricultural Revenue,
and Dietary diversity

• The low dietary diversity-agricultural revenue elasticity illustrates potentially limited role that agricultural interventions designed solely to raise the agricultural revenue of households might have on dietary diversity and diet composition¹.
• Might be important for policy interventions to focus beyond income expansion¹.
• Evidence shows higher effects of agriculture income on nutrition when combined with better health and education outcomes ².
¹Dillon et al (2015), ² Bhagowalia et al
Pathways: Climate, Agricultural Revenue,
and Dietary diversity

• Explore the influence of food consumption diversity on adequate intake of food calories, proteins, and selected micronutrients in rural Nigeria
• Prevalence of food calorie intake deficiency seems to be higher than that of proteins. Incidence of micronutrient deficiencies, such as potassium, vitamin B1 and vitamin C, relatively higher than those of proteins, calories, and other micronutrients examined
Akerele et al (2017)
Outcomes: Factors Influencing Nutritional
Adequacy

Variables Calories ProteinsVit A Vit B12
Primary School Education -0.02 0.03 0.0025 0.02
Secondary School Education -0.05 0.03*** 0.0040 0.01
Tertiary School Education -0.08 -0.04 -0.01 -0.02
Nonfarm Enterprise Diversification 0.06*** 0.02 0.02 0.05**
Food Consumption diversity (food count) 0.05*** 0.06*** 0.07*** 0.13***
Lowest income tercile -0.68*** -0.26***-0.42*** -0.57***
Highest income tercile 0.30*** 0.08*** 0.14*** 0.33***Values are regression coefficients. , *p<0.01; **p<0.05; ***p<0.001
Akerele et al (2017)
Factors Influencing Adequate Intake of Food Calories, Proteins, and Micronutrients

Unique role of dietary diversity in addressing nutrition inadequacies
Other household-level characteristics play a role – Better access to education
– Income improvement, especially through nonfarm enterprise diversification
Akerele et al (2017)
Outcomes: Factors Influencing Nutritional
Adequacy

CASE STUDY – AGRICULTURE, MALARIA, AND
NUTRITION
Oladepo et al (2010)
• Observations conducted on a random selection of 10.0% of the farms (40 farms).
• Observation based on a checklist that used to document presence of various kinds high risk, potential breeding grounds for anopheles mosquitos
ENTRY POINTS FOR NUTRITION SENSITIVE CSA
• Need to consider nutrition as an input when addressing agricultural and livelihood risk
• Need to maximize nutrition entering the value chain and minimize exiting
• Need to understand pathways from CSA value chains to improved nutrition
• Need to evaluate whether CSA practices pose any health risks that could impact nutrition strive for more inclusive practices

Photo Credit Goes Here
Climate and gender:
Considerations for gender-
responsive climate resilience
programming
WHY CARE ABOUT GENDER AND CSA?Understanding and addressing these gender differences to:
• Ensure social inclusion: who is adopting CSA and who is not?
• Mitigate potential harm to the most vulnerable: identify and reduce unintended negative consequences or inequalities in CSA?
• Women’s participation may enhance CSA effectiveness: in what ways can women’s unique knowledge and networks contribute to CSA?
• Achieve co-benefits/other development outcomes: how will activities affect nutrition through health, diets, and care?
• Advance empowerment and gender equality: who is benefitting from CSA?

WHERE ARE THE GENDER DIFFERENCES?
Gender-differentiated determinants
Different feedback loops
Different well-being outcomesDifferent influence
on the pathways
Different preferences and decision-making power

Absorptive Capacity: Sensitivity to CC Depends on—
• Gender roles within and outside of agriculture—this is largely dependent on the context (varied across Nigeria):
• Nutritional status of men and women may be different, changing susceptibility to climate stresses (e.g. heat stress)
• Women might additionally be more sensitive to climate shocks (e.g. flooding)
• The extent to which institutions (e.g. social protection programs, social norms) support both men and women

Absorptive Capacity: Different Crop ChoicesGender indicators and crop choice in Nigeria
Full sample Female heads Male heads Significant differencePrimary crop choice n=3706 n=1105 n=2601
Maize 0.14 0.11 0.15***Rice 0.08 0.06 0.10***Cowpea 0.04 0.02 0.05***Cassava 0.04 0.04 0.04Tomato 0.03 0.01 0.04***Leafy green vegetable 0.03 0.05 0.03**Other vegetable 0.03 0.01 0.03***Yam 0.02 0.02 0.02Sugar cane 0.02 0.01 0.03***Peppers 0.02 0.00 0.02***Fallow, missing or no crop 0.54 0.67 0.48***
Peterman et al. 2011, survey covering Fadama project areas in 12 states

Adaptive Capacity: Women Face Constraints
• Evidence that men and women have different perceptionsof climate change--women tend to be less likely to perceive changes or to perceive different changes
• Men and women have different access to resources needed for adaptation
• Women tend to have less access to information about CC and response options
• The institutional context for men and women is different—women are sometimes hindered from adopting certain practices because of social norms (e.g. limited mobility), limited group participation, and lack of tenure security

Adaptive Capacity: Access to Productive
Resources/Assets
Percent of women who own land, by region
Zone Alone JointlyAlone and jointly
Do not own land
North Central 7.5 10.5 2.7 79.2North East 3.3 2.4 0.4 93.6North West 4.2 2.7 3.4 89.5South East 5.4 14.1 2 78.2South South 5.1 12.6 3 79.1South West 3.5 9.6 1.3 85.4
Source: DHS 2013

Adaptive Capacity: Access to Information
Adoption Level
MA:MF MA:FF FA:MF FA:FF MA:AllF FA:AllF
(n=141) (n=72) (n=22) (n=93) (n=213) (n=115)
Low 32.6 48.6 50.0 44.1 38.0 45.2
Moderate 29.1 29.2 18.2 22.6 29.1 17.4
High 38.3 22.2 31.8 33.3 32.9 37.4
Lahai et al. 1999

Responses to Climate Change: Gender Differences
Different ecosystem-based adaptation options reported by men and women in west-central Nigeria (Oloukoi et al. 2015, selected practices shown)
Adaptation Strategies Male (n=133) Female (n=58)
Modified farming (fruit and vegetable garden along floodplain) 22.4 67.1Cutting and burning trees 47.9 53.7Mixed farming 37.8 41.9Use of agricultural chemicals 17.9 40.7Cutting trees 38.8 37Crop rotation 35.7 35.5Use of irrigation + organic inputs 43.9 24.1Hire labor 20.3 16.7Replanting trees 25.7 9.6

Responses to Climate Change: Decision-Making Context
Source: adapted from Theis, et al. 2017. unpublished
Intrahousehold Distribution of Rights
Group
Control over profits and products
Control over how technology
is managed
Individual
Men WomenJoint
Control over who uses
technology
Decision to Adopt
Application of Technology
Benefits of Technology
Incentives to adopt
HouseholdControl over
selling the technology

Men Tend to Dominate Decision-Making
Who makes decisions about:
Women's responsesMainly wife
Wife and husband jointly
Mainly husband
Someone else
Own health care 6.2 32.6 60.8 0.2
Major household purchases 5.6 32 61.9 0.2
Visits to family or relatives 7.9 39.5 52.2 0.2
Men's responsesMainly wife
Wife and husband jointly
Mainly husband
Someone else
Own health care 11.9 22 65 0.8
Major household purchases 23.3 26 50 0.4Source: DHS 2013

Decision-Making Context in Nigeria Varies Considerably
Oseni et al. 2015 using General Household Survey Panel data 2010-11
Plot manager=primary decision maker on the plot

Pathways: Influenced by Gender
• Production pathway: Who makes crop/production choices? Men and women may choose different crops and for different purposes (consumption or sale)—implications for nutrition
• Income pathway: Who controls income? Men and women have different consumption preferences
• Asset pathway: Gender-differentiated asset dynamics have implications for well-being outcomes for men and women
• Labor pathway: Different CSA practices have different time implications for men and women (e.g. conservation agriculture)

Pathways: Income DecisionsPerson who decides how wife's cash earnings are used
Zone Mainly wifeWife and husband jointly
Mainly husband
North Central 48.3 25.8 25.5
North East 73.5 19.1 6
North West 87.7 7.3 4.7
South East 40.9 37.9 20.9
South South 48 40.6 11.2
South West 80.9 15.2 3.8
Source: DHS 2013

Outcomes: Will CSA Close or Exacerbate Gender Inequalities?
The costs and benefits of responses to climate change, including CSA, are not distributed equally across household members
• How does time use change on different activities, and for whom? • How does relative control over income change?• Who gains/loses assets? • Who is impacted by changes in human capital investments? (e.g.
leaving school, reduced health services)• Who changes consumption?• Who is more exposed to health risks (e.g. water harvesting)?•

ENTRY POINTS FOR GENDER TRANSFORMATIVE CSA
• Need to improve enabling conditions for women both within and outside the household
• Strengthen capacity of organizations on gender
• Develop/disseminate tools for assessing gender in CSA
• More gender-responsive and gender-transformative programs that:
• Involve women in the design of programs, technologies and approaches to CSA
• Ensure that both men and women have access to information, groups, social protection programs etc.
• Ensure buy-in by men (e.g. participatory, family approaches, awareness raising of men’s and women’s contributions)
• Gender disaggregated M&E to track outcomes for women/men

THANK YOU
Tim Thomas: [email protected]
Jowel Choufani: [email protected]
Elizabeth Bryan: [email protected]
Carlo Azzarri: [email protected]
GCAN website: http://gcan.ifpri.info/