gases and trace elements in soils at the north silver bell deposit, pima county, arizona
TRANSCRIPT
Journal o f Geochemical Exploration, 20 (1984) 323--336 323 Elsevier Science Publishers B.V., Amsterdam -- Printed in The Netherlands
GASES AND TRACE ELEMENTS IN SOILS AT THE NORTH SILVER BELL DEPOSIT, PIMA COUNTY, ARIZONA
MARGARET E. HINKLE 1 and CLIFFORD A. DILBERT
' U.S. GeologicaISurvey, P.O. Box 25046, DenverFederal Center, Denver, CO 80225 (U.S.A.)
(Received April 4, 1983; revised and accepted November 29, 1983)
ABSTRACT
Hinkle, M.E. and Dilbert, C.A., 1984. Gases and trace elements in soils at the North Silver Bell deposit, Pima County, Arizona. J. Geochem. Explor., 20: 323--336.
Soil samples were collected over the North Silver Bell porphyry copper deposit near Tucson, Arizona. Volatile elements and compounds in gases derived from the soils and metallic elements in the soils were analyzed in order: (1) to see which volatile constit- uents of the soils might be indicative of the ore body or the alteration zones; and (2) to distinguish the ore and alteration zones by comparison of trace elements in the soil.
Plots of analytical data on trace elements in soils indicated a typical distribution pattern for metals around a porphyry copper deposit, with copper, molybdenum, and arsenic concentrations higher over the ore body, and zinc, lead, and silver concentra- tions higher over the alteration zones.
Higher than average concentrations of helium, carbon disulfide, and sulfur dioxide adsorbed on soils were found over the ore body, whereas higher concentrations of carbon dioxide and carbonyl sulfide were found over the alteration zones.
INTRODUCTION
Considerable interest exists in using volatiles emanating from sulfide mineralization as an exploration guide in the search for buried sulfide deposits. Soil gases collected at or slightly below the ground surface may contain volatile elements and compounds that originated in the deposit itself, or were formed by reactions of ground water with the oxidizing deposit and host rocks, or were formed by reactions of bacteria with the soil gases. Anomalous quantities of volatiles in soil gases such as sulfur compounds and carbon dioxide are concentrated over and peripheral to the deposit by these processes.
In order to determine which volatiles might be associated with porphyry copper mineralization, soil gases and soils were collected over the North Silver Bell deposit near Tucson, Arizona. The primary objective of the s tudy was to compare concentrations of helium, carbon dioxide, oxygen, hydrocarbons, and volatile sulfur compounds over the ore body and over
324
the alteration zone east of the ore body, to see which gases might be in- dicative of the ore or alteration. The second objective of the study was to distinguish the ore body and alteration zones by comparison of trace elements in softs over these areas. Almost all of the samples were collected over the northern part of the exposed deposit and over the alteration zones extending to the east. Alteration zones on the west side of the ore body that are covered by alluvium were not sampled.
SITE DETAILS
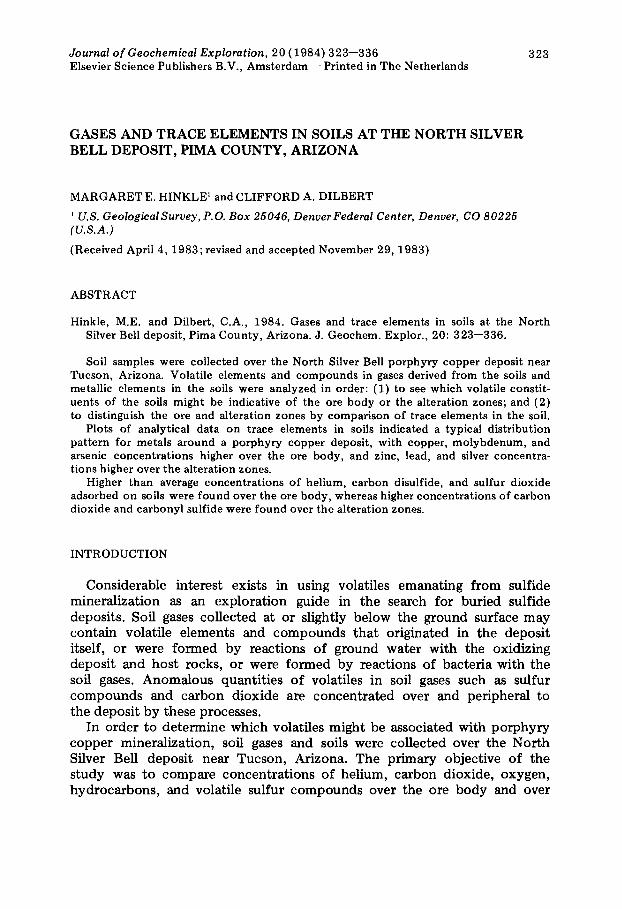
The North Silver Bell deposit is located about 60 km northwest of Tucson, Arizona (Fig. 1), and is jointly controlled by Minerals Exploration, Inc. (Union Oil) and ASARCO, Inc. The unmined deposit is a northwest- erly extension of the Silver Bell porphyry copper system, which occurs along the southwest flank of the Silver Bell Mountains. Hydrothermally altered igneous intrusives cut Tertiary(?), Cretaceous, and older rocks, and are considered to be Laramide in age (Richard and Courtright, 1966). Mineralization at the Silver Bell mine to the southeast is primarily distrib- uted along a large west-northwest-trending structural line that existed prior to the advent of Laramide intrusive activity. Three major and sev- eral minor faults are parallel to each other in this line of structural weak- ness. Other faults that are peTpendicular to the structural line controlled mineralization at the Silver Bell mine (Richard and Courtright, 1966). These faults persist into the North Silver Bell region, and, along with sev-
32 o 111°: 12'30" 111°31'00 '' 26'
~,;,~/,X~, ,j........~oL ) a , - ~ , EXPLANATION ~ , ~ / , ~ 2~00j_. ~ ~1 ~ Propylytic alter at ion
~ u a r t z te F~ez k ~ Potassic alteration
0 0.5 1 MILE • Sample site
I ' ' ' I 0 0.5 1 KILOMETER
Fig. 1. Location of North Silver Bell deposit.

325
eral breccia dikes and pipes, contr ibute to a highly fractured environment there.
Mineralized rocks at the North Silver Bell include dacite porphyry and quartz monzoni te porphyry that have intruded Paleozoic and Cretaceous rocks. Potassic, phyUic, and propylitic alteration zones are visible on the east side of the ore body. Primary sulfide minerals are pyrite and chalco- pyrite. Several cycles of oxidation and leaching have resulted in a super- gene zone of chalcocite ore presently lying beneath 10--40 m of leached capping (Guilbert and Davis, 1979). The alteration on the west side of the deposit is covered by alluvium, which deepens rapidly into the valley to the west.
C O L L E C T I O N AND A N A L Y S I S
Soil samples were collected for analysis of trace elements in the soils, and for analysis of gases adsorbed on the softs -- a procedure that utilizes the soil as a natural trap to concentrate gases rising from below. Samples were collected at 30 sites on hills and hillsides over a 3-km 2 area covering the northern part of the deposit by scraping away surficial debris and col- lecting the soil at 0--5 cm depth. Softs were sieved to minus 30 mesh (less than 600 pm) at each sample site, so that the samples would be the same grain size for volatile-element analysis. The samples were stored in plastic bags for all analyses except for helium; for helium analyses the sieved soils were stored in 20-ml-size stoppered Vacutainer 1 tubes according to the method of Hinkle and Kilburn (1979).
The softs in plastic bags were stored in a freezer to reduce loss of vol- atiles before analysis. The softs in Vacutainer tubes were equilibrated for 5 weeks at room temperature prior to helium analysis. A modified mass- spectrometer leak detec tor was used for helium analysis (Friedman and Denton, 1975; Reimer and Denton, 1978). The helium detector was cal- ibrated several times a day with injections of ambient air [5240 ppb (vol- ume/volume) helium] and of an 8300 ppb helium standard. Precision of the measurement was + 25 ppb helium, in excess of helium in air.
The gas adsorbed on soil in the Vacutainer tubes was analyzed for helium by injecting 5 ml of ambient air with a syringe through the rubber s topper into the Vacutainer tube, stirring the contents of the tube on a vortex mixer, removing a mixed air-and-gas sample from the tube with a syringe, and injecting the content of the syringe into the helium detector. The helium content in excess of helium in air was measured, and this measured quanti ty was used to calculate the concentrat ion of helium in the original pore space of the soil sample (Hinkle and Kilburn, 1979).
The carbon dioxide, oxygen, hydrocarbons, and volatile sulfur com-
1The use o f t rade names in this repor t is for descriptive purposes only and does not cons t i tu te endorsemen t by the U.S. Geological Survey.
326
pounds adsorbed on soil were analyzed simultaneously by gas chroma- tography. A 10-g soil sample was placed in a 40-ml glass vial that had an open-top screw cap lined with a teflon-covered septum. The soil samples in vials were equilibrated for 3 days in an incubator at 47°C. For analysis of head-space gas surrounding the soil in the vials, 25 ml of ambient air was injected by a syringe through the septum into the vial and 25 ml of mixed air and head-space gas were removed.
The gas mixture in the syringe was injected into the entrance port of the gas-sample loop of the first of three closely spaced gas chromatographs. The exit port of the gas-sample loop of the first chromatograph was con- nected by tygon tubing to the entrance port of the second gas chroma- tograph, and the exit port of this gas-sample loop was connected to the entrance port of the gas-sample loop of the third chromatograph. A 25-ml sample volume was necessary to completely fill all three sample loops plus the connecting tubing. The sample loops and connecting tubing were flushed with ambient air between samples to remove any traces of residual samples.
A Varian printer-plotter with four-channel plotting and integrating cap- ability and three remote-control station boxes was used to start and con- trol the chromatographic runs. The operating conditions for each chro- matograph are listed in Table I. Dilution of the head space gas by 25 ml of air approximated a two-fold dilution of the gas in the vial, therefore, concentrations of all components in the head-space gas, except for oxygen, were recorded as twice the amount measured; concentrations of oxygen were calculated from the measured values by assuming dilution of the sample with an equal volume of oxygen from ambient air (20.9%).
Standards of sulfur compounds were prepared in a permeation oven by diluting the sulfur gases that diffused from permeation tubes with dif- ferent pressures of helium (O'Keefe and Ortman, 1966; Stevens et al., 1969). Concentrations of sulfur compounds were expressed as ppb (volume/vol- ume). Standards of CO2, O2, and hydrocarbons were obtained from com- mercially prepared aerosol bottles. Reproducibility of standards and sam- ples was + 10% for CO2, O2, and hydrocarbons, and + 30% for sulfur com- pounds.
After analysis of the volatile constituents, the soil samples were further sieved to minus 80 mesh (180 um) then pulverized to less than 100 pm, and were analyzed for 31 elements by the six-step semiquantitative emis- sion-spectrographic technique of Grimes and Marranzino (1968). Because the concentrations of zinc, antimony and arsenic in the soils were below the lower limit of determination by emission spectrography, the softs were analyzed for zinc and antimony by atomic-absorption spectrophotometry (Ward et al., 1969; Welsch and Chao, 1975), and for arsenic by a colori- metric procedure (Welsch, 1979). In addition, the soils were analyzed for mercury by the gold-film technique of McNerney et al. (1972), for fluoride by a selective-ion electrode procedure (Hopkins, 1977), and for uranium by a fluorometric procedure (Centanni et al., 1956).

TA
BL
E I
Op
erat
ing
co
nd
itio
ns
for
gas
chro
mat
og
rap
hs
Ch
rom
ato
gra
ph
-1
Ch
rom
ato
gra
ph
-2
Ch
rom
ato
gra
ph
-3
Gase
s an
alyz
ed
Dete
ctor
Lower limit
of detection
Column
Carrier gas
Tem
per
atu
re
CO
2 an
d O
5
Th
erm
isto
r D
etec
tor
0.03
per
cen
t C
O2
(vo
lum
e/v
olu
me)
1.
0 p
erce
nt
O 5
C
on
cen
tric
sta
inle
ss
stee
l o
ute
r co
lum
n:
6 ft
×
1/4
in.
acti
vat
ed
mo
lecu
lar
siev
e, i
nn
er
colu
mn
: 6
ft ×
1/
8 in
. P
ora
pak
mix
ture
(A
llte
ch A
ssoc
iate
s,
Dee
rfie
ld,
IL)
Hel
ium
at
90 m
l/m
in
Co
lum
n:
70
°C
Det
ecto
r: "
Lo
w"
mo
de
Usi
ng e
qu
al-v
olu
me
sam
ple
sp
litt
er,
2 co
lum
ns
in
the
sam
e o
ven
, an
d 2
det
ecto
rs
CS2
, S
O:,
org
anic
-su
lfu
r co
mp
ou
nd
s H
all
Ele
ctro
lyti
c C
on
du
ctiv
ity
D
etec
tor,
op
erat
ed i
n th
e su
lfu
r m
od
e 50
pp
b o
f an
y s
ulf
ur
com
- p
ou
nd
(v
olu
me/
vo
lum
e)
Hy
dro
carb
on
s
Fla
me
Ion
izat
ion
D
etec
tor
100
pp
m (
vo
lum
e/
vo
lum
e)
30 i
n. ×
1/
8 in
. T
eflo
n
Pac
ked
wit
h 1
8"
of
acet
on
e-
was
hed
80
/10
0 m
esh
Po
rap
ak
QS
(S
up
elp
ak-S
) (S
up
elco
, In
c.,
Bel
lefo
nte
, P
A)
12 i
n. ×
1
/8 i
n.
stai
nles
s st
eel
Pac
ked
wit
h 6
0/8
0
mes
h C
arb
osi
eve
B
Ult
ra-h
igh
-pu
rity
hel
ium
at
Ult
ra-h
igh
pu
rity
60
ml/
min
. H
all
det
ecto
r:
hel
ium
at
60
ml/
min
M
eth
ano
l fl
ow
rat
e =
0.5
m
l/m
in.
Ult
ra-h
igh
pu
rity
air
fl
ow
rat
e ~-
35
ml/
min
B
oth
co
lum
ns
in t
he
sam
e o
ven
: 7
min
ute
s h
old
at
50 °
C,
pro
gra
mm
ed t
o 1
50
°C a
t 30
° C
/rai
n.
Ho
ld a
t 1
50
°C f
or
5 m
inu
tes
CO
S a
nd H
2S
Fla
me
Ph
oto
met
ric
Det
ecto
r
50 p
pb
(v
olu
me/
vo
lum
e)
6 ft
. ×
1/
8 in
. T
eflo
n
Pac
ked
wit
h C
hro
mo
sil
310
Hel
ium
at
25 m
l/m
in
Co
lum
n:
40 °
C
Det
ecto
r: 1
25 °
C
CO
t~

328
RESULTS
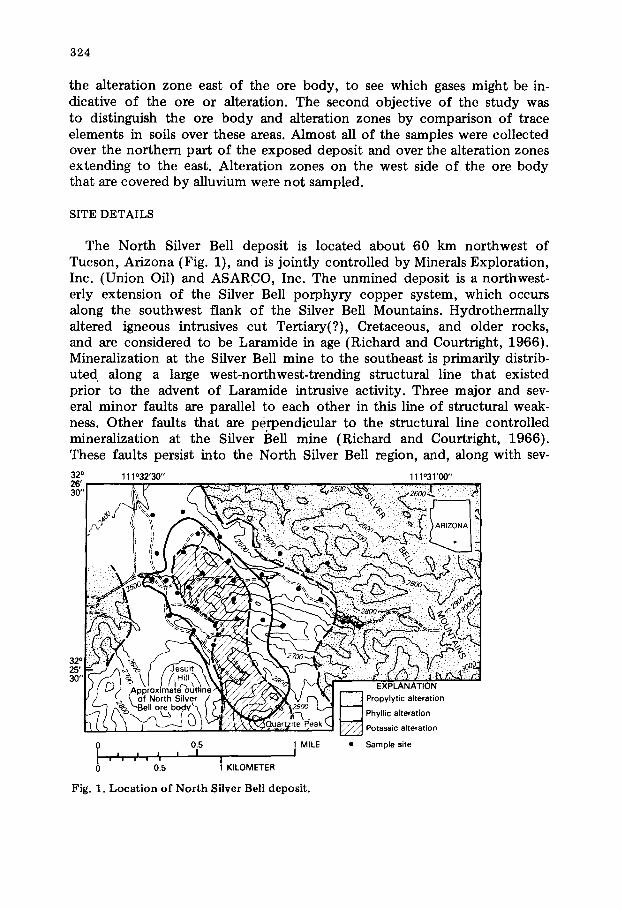
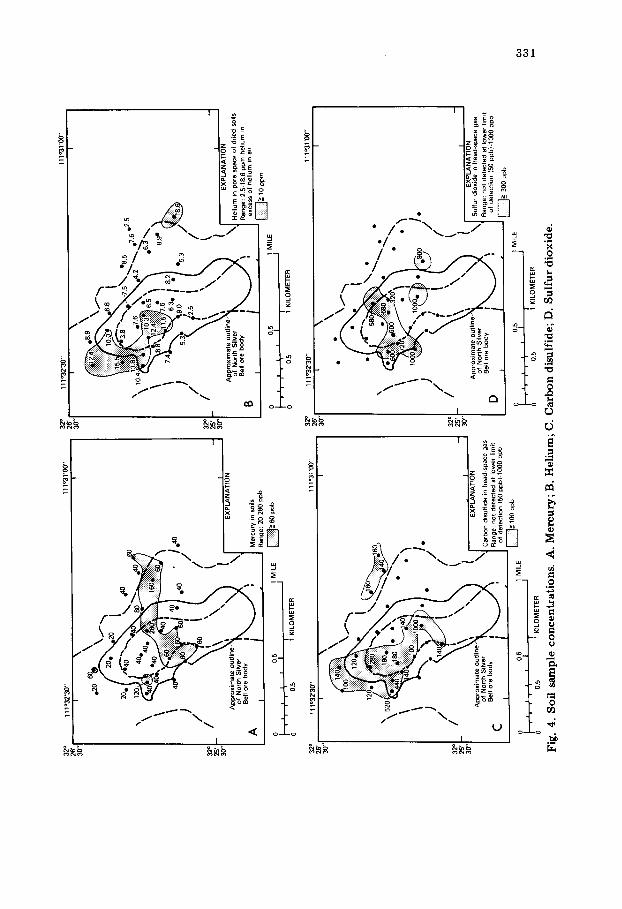
Higher than average (for this sample group) concentrations of copper, molybdenum, arsenic, lanthanum, and fluoride occur in the soils over and slightly northwest of the ore body (Figs. 2A--D, 3A), while above average concentrations of lead, zinc, and silver occur in the alteration zone around the ore body (Fig. 3B--D). Anomalous concentrations of mercury cut across both the ore body and the alteration zones, in an approximate east--west trend (Fig. 4A).
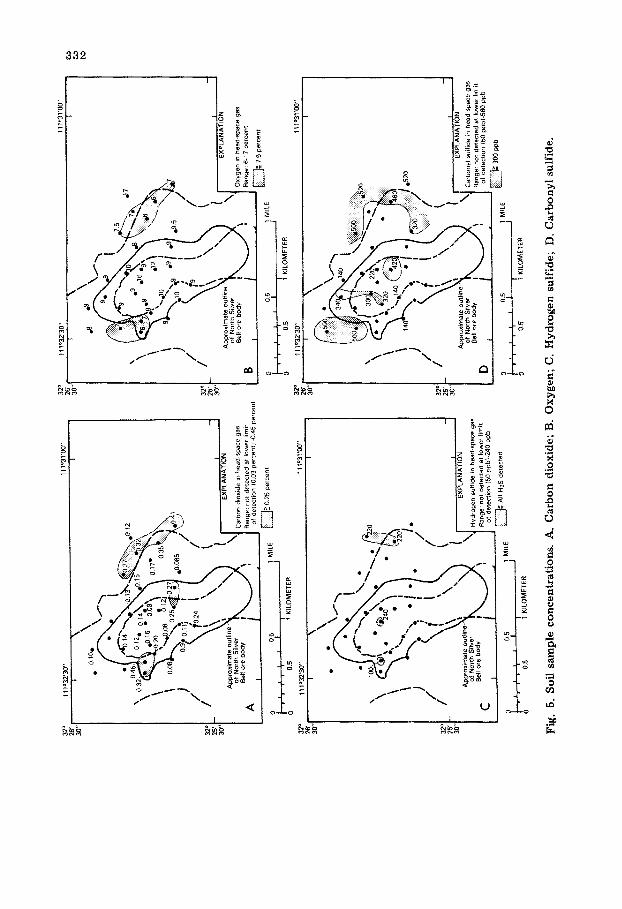
Higher than average volatile constituents of head space gas over soil samples also occur over the ore body and alteration zones. Above average concentrations of helium, CS2, and 802 occur over the ore body, whereas above average concentrations of CO2 occur over the alteration zones (Figs. 4B--D, 5A). Oxygen concentrations are low where CO2 concentrations are high over the alteration zones (Fig. 5B). Hydrogen sulfide was detected in only four samples, one over the ore body and three samples over the alteration zones (Fig. 5C). Carbonyl sulfide was detected in several sam- ples both over the ore body and in the alteration zones (Fig. 5D). Hydro- carbons either were not detected or were present in unmeasurable traces below the lower limit of detection in the head space gases of almost all the samples.
DISCUSSION
Metallic elements in soils
The metallic elements in softs form a typical distribution pattern for metals around a porphyry copper deposit (Lowell and Guilbert, 1970). Concentrations of copper, molybdenum and arsenic are higher over the ore body than over the alteration zones, whereas concentrations of zinc, lead, and silver are higher over the alteration zones than over the ore body.
Fluoride concentrations are also higher in softs over the ore body. The fluoride is probably derived from fluorite. Lanthanum concentrations are higher in the area between the ore body and alteration zones north- west of it, and probably occurred as a soluble rare-earth fluoride complex and precipitated along with the fluorite (Smith, 1974; Marchand et al., 1976). Higher concentrations of scandium and yt t r ium, which might be expected to accompany lanthanum, do not occur in this area.
Soil gases
Helium Concentrations of helium in excess of helium in air occur in the pore
space of all the softs sampled. Highest concentrations of helium occur primarily over the ore body and northwest o f the ore body. The pattern
2~
12 o 18:,
0'
111"
32"3
0"
11 t°
31 'o
O'"
i \
i
\
, ~
.~ -
.~
/) ! .
...
/ pr
oxim
ate
outli
ne
~)
I
I E
XP
LAN
ATI
ON
...
.. %
No
rt. s,
,..
\X
\J ~
o.oo
, ,..o
,,.
A
,.,,
ore
bod
y ,~
!
1 R
ange
: 10
0-20
00 p
pm
. /
: /
D--
_ .o
o o.~
0.
5 1
MIL
E ...
~ J,
,I
, ~,
I I
! I
0.5
1 KI
LOM
ETER
111o
32'3
0"
111o
31'0
0 ,,
\
(
\ \ ) / /
1 A
p E
XP
LAN
ATI
ON
,rsen
ic in
soi
ls
C an
ge:
2-8
ppm
I I
, •
I ~=
~ s
pp
m
0.5
I M
ILE
J
= ,
~ I
I ,
i ,
i =
I 0,
5 KI
LOM
ETER
Z ~
6'
0"
12 o
!5'
,1o~.~
u, \ \
\ \ ) / t
App
of
B(
I |
.
0.5
I I
I I
i i
I [
0b
1 KI
LOM
ETER
;2°
11 l°
32'3
0 ''
6''
....
..
I O
"
2o
5'
3,
\ \ \ ) / f D
I |
,
05
,t,
,=,
~,
= I
0.5
I KI
LOM
ETER
I E
XP
LAN
ATI
ON
Mol
ybde
num
in
soils
R
ange
: no
t de
tect
ed a
t lo
wer
lim
it of
de
ctec
tion
(5 p
pm)-
70 p
pm
MIL
E
I ~
15 p
pm
111o
31'0
0 '*
I I E
XP
LAN
AT
ION
than
um i
n so
ils
ge:
20-1
00 p
pm
I r
.....
~ 70
ppm
I MI
LE
I
Pig. 2
. So
il sam
ple
conc
entr
atio
ns.
A. Co
pper
; B.
Mo
lybd
enum
; C.
Ar
seni
c; D
. La
ntha
num.
;,O
,,3
D

32 °
26'
30"
111o
32'3
0 ''
i \
I I
, 0.
5 I
, I
I I I
I
I I
I I
0.5
111o
31'0
0 ''
I
225
1225
] i
ll 40
/
/ t "t '
EXPL
ANAT
ION
Fl
uorin
e in
soi
ls
Ran
ge: 6
0-15
00 p
pm
t
_-> 30
0 pp
m
1 M
ILE
I
I KI
LOM
ETER
320
111o
32,3
0"
26'
30"
I 1001
d
ido
/ /
\i~o
l, /
~,,
k |
Appr
oxim
ate
OUNo
rth Si
lve:
I'~
"X
kI
/
,,
Bell o
re body
! ~
i "%.
1
I o
I I
"J:
I
~;
26'
111°
32'3
0 ''
111~
31'0
0 - =
\ I
t 6s
/ \°~
I /
C
Bell o
re b
odiU
:line
ii
~ I
, E
XP
LAN
ATI
OIN
A
PC t~ r~
lx°i~h
a t~it°
u:'i n
e 't
I~
tnncg
:: ~
Oi]~
O p
pm
I I
t I ~-
>100
ppm
0.5
1 M
ILE
I l
, =
I I
I ,
, ,
, , 0.5
~ KILO
METE
R
~o
30"
0 05
I
i [
I I
I '
' '
' '
I 0
0.5
1 KI
LOM
ETER
111o
31'0
0 ''
I I EX
PLAN
ATIO
N
Lead
in s
oils
R
ange
: 30
500
ppm
~ _->
200 p
pm
1 M
ILE
I
32 °
111°
32'3
0 ''
111°
31 '0
0"
= \
I \
10
.
. ,
ti, j
,° :?: N
ATIO
'N
I "1
~
-Z
0'7
PPm
05
M
ILE
I ,
I I
I I
, I
I I
I 03
i
KILO
MET
ER
Fig
. 3.
Soi
l sa
mpl
e co
ncen
trat
ions
. A
. F
luor
ine;
B.
Lea
d; C
. Z
inc;
D.
Silv
er.
CO
CO
O
12 °
111 °
32'3
0"
111 °
31 '0
0"
32°
26'
i~'"
, \
~ 3o
'
I .2o~e ~.
~
2o. ~"
I\ .40
I \
) I
; ('°
/'°
~l"l
..
..
~l
%%
~
( I
EX
PLA
NA
TIO
N
30"
/ A
p~
ate
. ou
tline
%
\ !
\ I
/ B f
ellh'°
°:teh
bS;ye
r I~
,~
'~
%'t
/ A
......
.....
i ~
: I M
ercu
ry in
soi
ls
i I
I •
I R
ange
: 20
280
ppb
0 0.
5 1
MIL
E
~ 60
ppb
I
, I ,
i [
i I
I i
I 0
0.5
~ KI
LOM
ETER
;2°
111 °
32'3
0"
111 °
31 '0
0"
32°
26'
i
0.5
il
ll
l
0.5
\~6°
~ ~o
• I
/. i
("
/ /
"7
\l
~a,~
oo di
$u,id
e ,o .
ea~
,0~e
go,
~,
I R
ange
no
dete
cted
at l
ower
lim
it Ir j
/
of d
etec
tion
(50
ppb]
-100
0 ppb
1 M
ILE
~
=>
10
0 pp
b I
KILO
MET
ER
0"
i0"
111 °
32'3
0"
111 °
31 '0
0"
I 5~
e8
.5
2.5
\ 10
41~8
': o
4.2
~
•7.6
•
[ •
.. ~t
-%
. I
I I
EX
PLA
NA
TIO
N
Ap~
mat
e..o
utlin
e ~
~ /
'~ [
~o
eh~r
Y 'r
~
/~,
"t
Haen
i;em
'2n5 -P
18.6 S
ppP~ ~e
h{efl
i~ ~e ,d
n s°il
s I
v 0
/ ex
cess
of h
eliu
m in
air
I I
• I
~>
__ 1
0 pp
m
05
1 M
ILE
i i
= i
I I
, ,
J ,
~ I
0.5
1 KI
LOM
ETER
111O
32'30
" 11
1°31
'00"
i
\ I
• •
\\f..~
\ "-
.\
) -~.
~~
/
/ (
, -
.oo.
. .....
. ~r
~,
\.~
I.
EX
~LAN
,T,O
N ~2
:n~
K y,
\lS
u'°r0i
°'inhe
ad'0a
ce0a
S
) ..
....
. i
~ :
I R:
;~e'n
c°"i°
c~;;t
;d~l
"~N~
;o";"
, I I
I
i 01
5 |
•~M
LE
I ~
>
300
ppb
I 0.
5 1
KILO
MET
ER
Fig.
4.
Soi
l sa
mpl
e co
ncen
trat
ions
. A
. M
ercu
ry;
B.
Hel
ium
; C
. C
arbo
n di
sulf
ide;
D.
Sul
fur
diox
ide.
J.1
.=L
;2°
111 °
32'3
0"
111 o
31 'O
ff'
0.32
• 0
"15
::~
.32
, \fo
.,, !
L /
/ \L
',,
',\
t .I
EXP NA
T,O.
R
ange
: no
t de
tect
ed
at I
owe¢
lim
it o1
'det
ectio
n (0
03 p
erce
nt(
~0.4
5 pe
rcen
t
0 0.
5 1
MIL
E ~
-~
0.25
percent
I ~
J [
i I
I '
' '
' ~
KILO
MET
ER
0 0.
5 11
1o32
'30 '
' 11
1o31
'00"
0'
, \
I 0"
APo~
'~l(~
iftr~h
atSe
i,:~ ir
e&
~ XJ
H
ydro
g ...
. ffl
de i
n he
ad-s
pa,
/ ~.
I R
ange
: not
det
ecte
d at
low
er
C
~ellO
'eb°
dy
i "
~'
J of
det
ectio
n (5
0 pp
b)~2
40 P
C
0.5
1 M
ILE
L~-J
)= Al
l H
2S d
etec
ted
~lr
I
, I
I I
I J
0.5
1 KI
LOM
ETER
2 ~ 'o:
ipac
e ga
s ve
rlim
d 3b
)~24
0 pp
b
2 o
8'
Y'I
12 o
!5'
)0"
~2 o
)%
)0"1
12 o
!5'
10"
111 °
32'3
0"
o9.5
t/
/
A~o~
r~'j2:
t&°~
:"°e
\ I x
,o .o,o
,o S~
i%
,. "
Re:o,:
0.5
t M
ILE
=
I I
= I
| ,
, ,
, i
I 0,
5 1
KILO
MET
ER
111~
32,3
0 ''
I \
I \ \ \ \ ) / /
Ap~
) t
0,5
l i
i i
, I
i )
) ,
J 0.5
• fl
1 M
ILE
I
KILO
MET
ER
11e3
1'00
'' I I
EXPL
ANAT
ION
)xyg
en i
n he
ad s
pace
gas
ra
nge:
6-1
7 pe
rcen
t
~=
75
per
cent
t 1e3
1'00
'' I I
EX
PLA
NA
TIO
N
yl suffide Jn
head-space
gas
not
dete
cted
at
low
er l
imit
....
. ec
tion
(50
ppb)
560
ppb
> 30
0 pp
b
O
Fig.
5.
Soil
sam
ple
conc
entr
atio
ns.
A.
Car
bon
diox
ide;
B.
Oxy
gen;
C.
Hyd
roge
n su
lfid
e;
D.
Car
bony
l su
lfid
e.
333
of concentrations of helium in soil gas is unrelated to the pattern of con- centrations of uranium in the soil (M. Hinkle, unpubl, data), therefore the helium is unrelated to radioactive decay of the uranium in the soil. The entire North Silver Bell area was faulted and fractured extensively before and during emplacement of the ore. The mult i tude of faults and fractures in the vicinity of the ore body probably provides channelways for helium that is produced by radioactive decay at depth to migrate to the surface. Buried faults must also exist beneath the alluvium northwest of the deposit, and provide channelways for helium to migrate to the sur- face in this area.
Carbon dioxide and oxygen Anomalous concentrations of CO2 in soil gases occur over the alteration
zones around the ore body. Decomposing sulfides produce sulfur gases, which form sulfuric acid when dissolved in ground water or soil moisture. The acid reacts with carbonate rocks or minerals to produce carbon dioxide. Carbonate rocks occur nearby at the BS and K Mine about 1 km west of the North Silver Bell deposit, where veins of sphalerite-pyrite and chal- copyrite-galena occur in hydrothermal skarn zones in limestones (Guilbert and Davis, 1979). Carbonate rocks also occur about 1 km east of the North Silver Bell ore body (Graybeal, 1982). Carbonate rocks east of the ore body and fragments of carbonates in the igneous intrusives are a possible source for the CO2 in soil gas.
Oxygen concentrat ions in soil gas are low where CO2 concentrations are high (Fig. 5A, B). This may result from consumption of O: in oxida- tion of the sulfide minerals and product ion of CO2 by the resulting H:SO4 reacting with carbonates. An alternate explanation for the occurrence of high CO: and low 02 concentrations east of the ore body involves the product ion of CO2 by the bacteria Desulphovibrio desulphuricans. These bacteria consume oxidized sulfur compounds and other bacteria to produce CO2 as a metabolic gas, according to the reaction:
Fe +2 + SO~- +(CH20)~- FeS + CO2 (bacteria);
(L.H. Filipek and J.R. Watterson, U.S. Geological Survey, writ ten com- mun., 1982). The abundant pyrite in the alteration zone would provide ample oxidized sulfur compounds for consumption by the bacteria.
Sulfur compounds The most abundant sulfur gases determined at North Silver Bell were
CS 2 and COS. Eighteen of the 30 samples contained CS2, with the highest concentrations located over the ore body, whereas 15 samples contained COS, with the highest concentrations located over the alteration zones around the ore body. These two gases were also the most abundant sulfur
334
gases measured over decomposing sulfide minerals in laboratory experi- ments by Taylor et al. (1982). Only four of the 30 samples contained measurable H2S, one over the ore body and three over the alteration; this finding also agrees with the s tudy by Taylor et al. (1982) that showed very little H2S produced by decomposing sulfides. Although SO2 was not ex- pected because of its high solubility in water, nine of the 30 samples, lo- cated mostly over the ore body, contained 300--1000 ppb SO2. The oc- currence of SO2 at North Silver Bell may be at tr ibuted to the hot, dry environment there, and to the shallowness of the deposit. These environ- mental condit ions permit ted some of the SO2 that rose from oxidizing ore to reach the surface before it dissolved in moisture within the leached capping and overlying alluvium.
Organic-sulfur gases occurred in 16 of the 30 samples, both over the ore body and over the alteration zones, and ranged in concentrat ion from 50 to 200 ppb. Of the 16 organic sulfur gases, 8 were identified as dimethyl sulfide, 7 as methyl mercaptan, and 1 as ethyl mercaptan. The organic- sulfur compounds were probably produced by bacterial action in the allu- vium over the sulfide mineralization. However, the organic-sulfur gases showed no correlation either with the ore body or with the alteration. They formed only random patterns whether plot ted by type of compound or by concentrations of a single compound.
Hydrocarbon gases Hydrocarbon gas standards used for the soil gas analyses were methane,
acetylene, ethylene, ethane, propyne, propylene, propane, and n-butane. Of these, only methane was detected in the samples. Traces of methane were seen in almost all of the samples; these were much lower than the lower limit of determination (100 ppm, volume/volume) and were estimated to be lower than 10 ppm methane. Traces of unidentified hydrocarbons were seen in 4 of the 30 samples; these trace concentrations were probably well below 10 ppm, also.
CONCLUSIONS
Higher than average concentrations of helium, carbon disulfide, and sulfur dioxide were found over the ore body at North Silver Bell, whereas higher concentrat ions of carbon dioxide and carbonyl sulfide were found over the alteration zones. Organic-sulfur compounds were scarce and did no t correlate with the ore body or the alteration zones. Hydrocarbon con- centrations were negligible.
The low concentrations of hydrocarbons together with the low abun- dances of organic-sulfur gases indicate that the bacterially formed com- ponent of sulfur gases is probably lower than the component of sulfur gases originating from oxidation of the North Silver Bell deposit. Anom- alous volatiles in soft gases are at tr ibuted to the shallowness of the deposit
335
and to the hot, dry environment at North Silver Bell, which permitted the volatiles that rose from the oxidizing ore to reach the ground surface before being dissolved in moisture within the leached capping and overlying alluvium. These volatiles may not be seen over porphyry copper deposits that are deeply buried or in a more humid environment.
ACKNOWLEDGEMENTS
This study was made possible through the cooperation and assistance of ASARCO, Inc. and Minerals Exploration, Inc. (Union Oil).
We would like to thank the following people who analyzed the soil samples for the non-gaseous components: M.S. Erickson (spectrography); and B.F. Arbogast, D.L. Kelley, and J.D. Sharkey (chemistry).
REFERENCES
Centanni, F.A., Ross, A.M. and DeSesa, M.A., 1956. Fluorimetric determinations of uranium. Anal. Chem., 28: 1651.
Friedman, I. and Denton, E.H., 1975. A portable helium sniffer. U.S. Geol. Surv., Open- File Rep. 75-732, 6 pp.
Graybeal, F.T., 1982. Geology of the E1 Tiro area. In: S.R. Titley (Editor), Advances in Geology of the Porphyry Copper Deposits -- Southwestern North America. Uni- versity of Arizona Press, Tucson, pp. 487--505.
Grimes, D.J. and Marranzino, A.P., 1968. Direct-current arc and alternating-current spark emission spectrographic field methods for the semiquantitative analysis of geologic materials. U.S. Geol. Surv., Circ. 591, 6 pp.
Guilbert, J.M. and Davis, S.R., 1979. North Silver Bell Tour Guide. In: Society of Eco- nomic Geologists Field Conference, Southern Arizona Porphyry Copper Deposits, Tucson, Arizona, April, 1979.
Hinkle, M.E. and Kilburn, J.E., 1979. The use of vacutainer tubes for collection of soil samples for helium analysis. U.S. Geol. Surv., Open-File Rep. 79-1441, 23 pp.
Hopkins, D.M., 1977. An improved ion-selective electrode method for the rapid deter- mination of fluorine in rocks and soils. U.S. Geol. Surv., J. Res., 5: 589--593.
Lowell, J.D. and Guilbert, J.M., 1970. Lateral and vertical alteration-mineralization zoning in porphyry ore deposits. Econ. Geol., 65: 373--408.
Marchand, L., Joseph, D., Touray, J.C. and Treuil, M., 1976. Crit~res d'analyse g~o- chimique des gisements de fluorine bas~s sur l'~tude de la distribution des lanthanides- application au glte de Maine (71--Cordesse, France). Mineral. Deposita, 11: 357-- 379.
McNerney, J.J., Buseck, P.R. and Hanson, R.C., 1972. Mercury detection by means of thin gold films. Science, 178: 611--612.
O'Keefe, A.E. and Ortman, G.C., 1966. Primary standards for trace gas analysis. Anal. Chem., 38: 760--763.
Reimer, G.M. and Denton, E.H., 1978. Improved inlet system for the U.S. Geological Survey helium sniffer. U.S. Geol. Surv., Open-File Rep. 78-588, 4 pp.
Richard, K. and Courtright, B.H., 1966. Structure and mineralization at Silver Bell, Arizona. In: S.R. Titley and C.L. Hicks (Editors), Geology of the Porphyry Copper Deposits - - Southwestern North America, University of Arizona Press, Tucson, pp. 157--163.

336
Smith, F.W., 1974. Yttrium content of fluorite as a guide to vein intersections in partially developed fluorspar ore bodies. Soc. Min. Eng., AIME, Trans., 255: 95--96.
Stevens, R.K., O'Keefe, A.E. and Ortman, G.C., 1969. Absolute calibration of a flame photometric detector to volatile sulfur compounds at sub-part-per-million levels. Environ. Sci. Technol., 3(7): 652--655.
Taylor, C.H., Kesler, S.E. and Cloke, P.L., 1982. Sulfur gases produced by the decom- position of sulfide minerals. Application to geochemical exploration. J. Geochem. Explor., 17: 165--185.
Ward, F.N., Nakagawa, H.M., Harms, T.F. and VanSickle, G.H., 1969. Atomic absorption methods of analysis useful in geochemical exploration. U.S. Geol. Surv. Bull., 1289: 20--22.
Welsch, E.P., 1979. Determination of arsenic in geologic materials using silver diethyl- dithiocarbamate. U.S. Geol. Surv., Open-File Rep. 79-1442, 7 pp.
Welsch, E.P. and Chao, T.T., 1975. Determination of trace amounts of antimony in geological materials by atomic absorption spectrometry. Anal. Chim. Acta, 76: 65--69.