gas lift surveillance using welltracer tm...
TRANSCRIPT
34th Gas-Lift WorkshopSingapore
February 7 - 11, 2011
This presentation is the property of the author(s) and his/her/their company(ies).It may not be used for any purpose other than viewing by Workshop attendees without the expressed written permission of the author(s).
Gas Lift Surveillance using WellTracerTM
TechnologyMariana Jamil, Firdaus Abdullah, Anupam Konwar, Dk Adline Pg Hj T (Brunei Shell Petroleum, BSP)
Jayant Sadare (Weatherford International)
Larry Peacock (AppSmiths)

Feb. 7 - 11, 2011 2011 Gas-Lift Workshop 2
Outline
• WellTracer (WT) Technology• WellTracer Video• WellTracer Project Workflow Details• Summary of the results• Benefits to Client• Three example wells

Feb. 7 - 11, 2011 2011 Gas-Lift Workshop 3
WellTracer Technology Overview
• CO2 is injected into the gas lift injection line andits concentration is recorded at the well head
• Injected CO2 travels through the tubing-casingannulus into the tubing through injection point/s
• Travel velocities inside tubing and casing areused to back calculate operating lift depth/s

Feb. 7 - 11, 2011 2011 Gas-Lift Workshop 4
WellTracer Technology Overview
• WellTracer™ offers a low cost effective method to quickly and reliably determine lift gas entry points in the well.
Detect operating lift depth
Detect multiple points of injection
Detect tubing leaks
Identifies lift gas rate through each injection point
Identifies how much lift gas goes to each string of a dual completion well

Feb. 7 - 11, 2011 2011 Gas-Lift Workshop 5
WellTracer Video

Feb. 7 - 11, 2011 2011 Gas-Lift Workshop 6
WellTracer Workflow Set up• 26 wells pilot was run in 2009. Following workflow was
established for smooth & successful operation.
• Job Preparation WT analyst, PT’s, and Gas Lift focal point identifies the well
candidates for WT survey
WT analyst and PT prepare WinGLUE models and verify all the information in the models for the selected wells
WT analyst run the WinGLUE model and create procedure with estimated return times for the job
WT coordinator add selected wells to WT schedule (i.e. Well testing, and logistics) during IAP (Integrated Activity Planning)

Feb. 7 - 11, 2011 2011 Gas-Lift Workshop 7
WellTracer Workflow Set up• Field Operations Workflow Notify WT field crew about scheduled survey date
Arrange site survey for the following things well in advance– Making sure all the casing/tubing thread connections are compatible
– Ensure Sump, Platform Crane, and Electricity available
WT field crew runs WT survey
• WT Analysis/Reporting WT analyst and PT review the well test data from Programmer and
confirm the quality of the data
WT analyst conduct the analysis in WinGLUE program and discuss the results with PT
WT analyst generate report and submit recommendations to PT
Feb. 7 - 11, 2011 2011 Gas-Lift Workshop 8
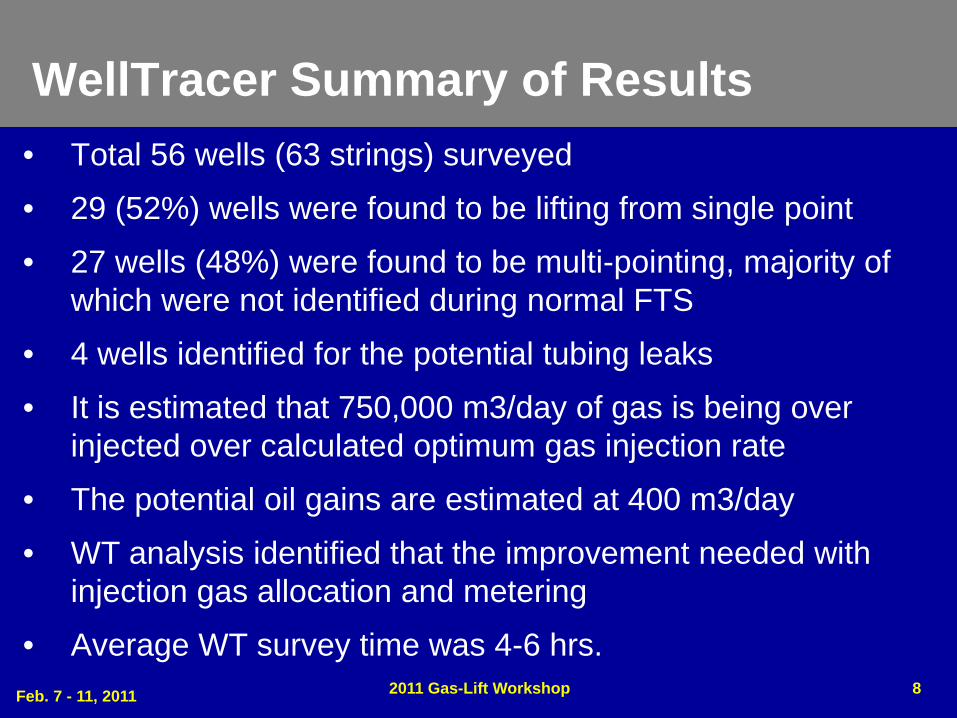
WellTracer Summary of Results• Total 56 wells (63 strings) surveyed
• 29 (52%) wells were found to be lifting from single point
• 27 wells (48%) were found to be multi-pointing, majority of which were not identified during normal FTS
• 4 wells identified for the potential tubing leaks
• It is estimated that 750,000 m3/day of gas is being over injected over calculated optimum gas injection rate
• The potential oil gains are estimated at 400 m3/day
• WT analysis identified that the improvement needed with injection gas allocation and metering
• Average WT survey time was 4-6 hrs.

Feb. 7 - 11, 2011 2011 Gas-Lift Workshop 9
WellTracer Summary of Results• Tracer Returns were pretty quick for very high injection gas
rates wells (Ex. 10 mins, 18 mins, 23 mins, and 33 mins)
• Average amount of CO2 injected was 30-40 lbs
• Shot fluid level’s to determine the fluid level in casing – Noise from wet gas made it less reliable
– Recommended to shut-in gas injection for future determination
• Clamp-on Gas flowmeter will be introduced – There is no real time gas injection measurements available
– Will help to reduce the survey run time
– Pin-point the tubing leaks more accurately
• Overall teamwork between WT team, gas lift foal point, PT’s and field operations was excellent

Feb. 7 - 11, 2011 2011 Gas-Lift Workshop 10
WellTracer Summary of Results
• Most common parameters causing over-injection and loss in production for the problem wells. Port erosion from the wet gas (to be confirmed after GLV change
out) and higher differential across the operating valves
Choking back the wells
Multi-pointing
No surface control
Leaky valves
Tubing leaks
Oversized Tubing

Feb. 7 - 11, 2011 2011 Gas-Lift Workshop 11
Benefits to Client using WT Technology• Frees up wireline to focus on other important
surveillance/integrity tasks.
Static Pressure surveys
Zone changes
• Improve surveillance in well reservoir management workflow by allowing wells to be reviewed each year
It was identified that some of the wells were not surveyed for few years and taking lot of gas
More surveillance will increase production, save injection gas, compression and maintenance costs

Feb. 7 - 11, 2011 2011 Gas-Lift Workshop 12
Benefits to Client using WT Technology• WT does not require any well intervention and will
virtually eliminate any costs related to fishing and production loss due to downtime
• Team members comprising of WT analyst, PT, Gas Lift focal point, and reservoir engineer can look at all the aspects of Nodal Analysis for problematic wells fairly quickly and put together proper recommendations to optimize the wells production. It allows everyone involved to utilize their time efficiently to focus on problematic wells.
Feb. 7 - 11, 2011 2011 Gas-Lift Workshop 13
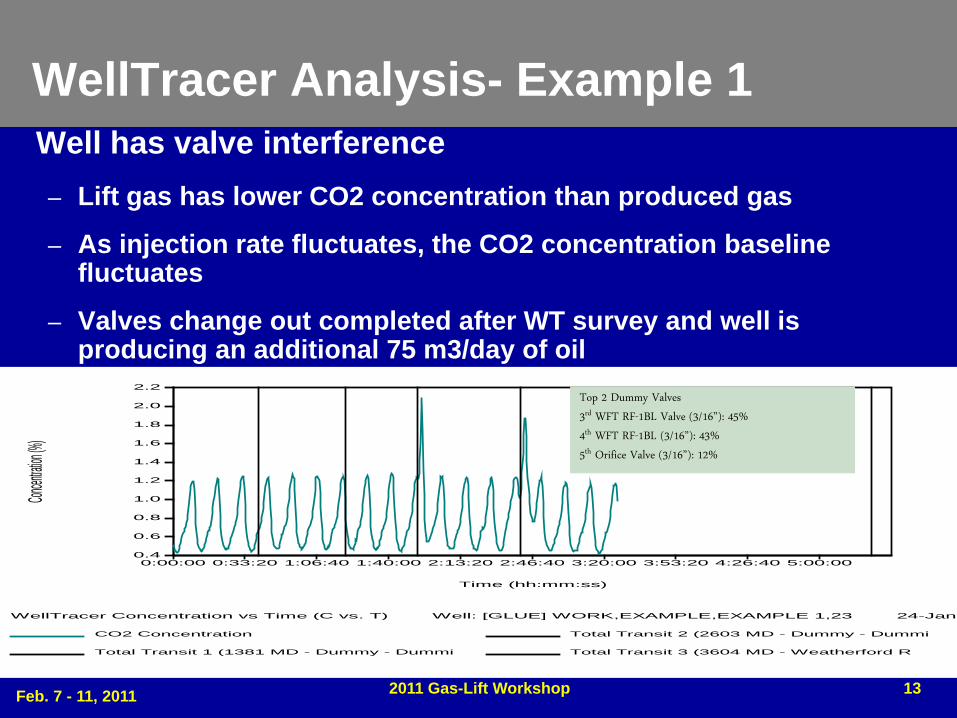
WellTracer Analysis- Example 1Well has valve interference– Lift gas has lower CO2 concentration than produced gas
– As injection rate fluctuates, the CO2 concentration baseline fluctuates
– Valves change out completed after WT survey and well is producing an additional 75 m3/day of oil
Concent
ration (%
)
2.2
2.0
1.8
1.6
1.4
1.2
1.0
0.8
0.6
0.4
Time (hh:mm:ss)
0:00:00 0:33:20 1:06:40 1:40:00 2:13:20 2:46:40 3:20:00 3:53:20 4:26:40 5:00:00
WellTracer Concentration vs Time (C vs. T) Well: [GLUE] WORK,EXAMPLE,EXAMPLE 1,23 24-Jan-
CO2 Concentration
Total Transit 1 (1381 MD - Dummy - Dummi
Total Transit 2 (2603 MD - Dummy - Dummi
Total Transit 3 (3604 MD - Weatherford R
Top 2 Dummy Valves
3rd WFT RF-1BL Valve (3/16”): 45%
4th WFT RF-1BL (3/16”): 43%
5th Orifice Valve (3/16”): 12%

Feb. 7 - 11, 2011 2011 Gas-Lift Workshop 14
WellTracer Analysis- Example 1De
pth (m
eters)
-0
200
400
600
800
1000
1200
1400
Pressure (kPag)
-0 1000 2000 3000 4000 5000 6000
Depth vs Pressure (D vs. P) Well: [GLUE] WORK,EXAMPLE,EXAMPLE 1,23 24-Jan-2011 19:28:22
Production Pressure Model: MMSM
Measured Injection Pressure Model
Measured Valve Opening Pressure
Measured VPC Valve Begin Flow Pressure
LIQUIDS (m3/day) GAS (m3/day)Oil 196.70 Form 15,000.00Water 148.35 Inj. 12,000.00Total 345.05 Total 26,600.00
Pressure(kPag) G/L Ratio (m3/m3)THP 670 Form GOR 76.26CHP 6,033 Total GLR 77.09
Gradient plot shows valve interference during the WT
survey.
Changed 4th PPO valve to 3/16” orifice valve and oil rate
increased by 75 m3/day.

Feb. 7 - 11, 2011 2011 Gas-Lift Workshop 15
WellTracer Analysis- Example 2Co
ncen
tratio
n (%)
3.4
3.2
3.0
2.8
2.6
2.4
2.2
2.0
1.8
1.6
1.4
1.2
1.0
Time (hh:mm:ss)
0:00:00 0:33:20 1:06:40 1:40:00 2:13:20 2:46:40 3:20:00 3:53:20 4:26:40
WellTracer Concentration vs Time (C vs. T) Well: [GLUE] EXAMPLE,EXAMPLE,EXAMPLE 2,23 24-J
CO2 Concentration
Total Transit 1 (1552 MD - Dummy - Dummi
Total Transit 2 (2493 MD - Dummy - Dummi
Total Transit 3 (3337 MD - Weatherford R
Example 2:
Top 2 Dummy Valves
3rd WFT RF-1BL Valve (8/64”): 34%
4th Orifice Valve (12/64”): 66%
Bottom 2 dummy Valves

Feb. 7 - 11, 2011 2011 Gas-Lift Workshop 16
WellTracer Analysis- Example 2De
pth (m
eters)
-0
200
400
600
800
1000
1200
1400
1600
1800
Pressure (kPag)
-0 1000 2000 3000 4000 5000 6000 7000 8000 9000
Depth vs Pressure (D vs. P) Well: [GLUE] WORK,EXAMPLE,EXAMPLE 2,23 24-Jan-2011 19:21:51
Production Pressure Model: MMSM
Measured Injection Pressure Model
Measured Valve Opening Pressure
Measured VPC Valve Begin Flow Pressure
Example 2:
Oil Rate= 108 m3/day
Water Rate= 186 m3/day
Formation Gas= 8,500 m3/day
Injection Gas= 23,000 m3/day

Feb. 7 - 11, 2011 2011 Gas-Lift Workshop 17
WellTracer Analysis- Example 2Ga
s Rate
(m3/d
ay)
18000
16000
14000
12000
10000
8000
6000
4000
2000
-0
Pressure (kPag)
-0 1000 2000 3000 4000 5000 6000
Injection vs Pressure (I vs. P) Well: [GLUE] WORK,EXAMPLE,EXAMPLE 2,23 24-Jan-2011 19:19:36
Valve 3 Weatherford RF1-BL 3/16 T/C
Valve 4 Camco BKO-3 3/16 VPC
Operating Points
Design Operating Points

Feb. 7 - 11, 2011 2011 Gas-Lift Workshop 18
WellTracer Analysis- Example 3Co
ncen
tratio
n (%)
5.0
4.5
4.0
3.5
3.0
2.5
2.0
Time (hh:mm:ss)
0:00:00 0:33:20 1:06:40 1:40:00 2:13:20 2:46:40 3:20:00 3:53:20 4:26:40
WellTracer Concentration vs Time (C vs. T) Well: [GLUE] WORK,EXAMPLE,EXAMPLE 3,23 24-Jan-
CO2 Concentration
Total Transit 1 (1732 MD - Dummy - Dummi
Total Transit 2 (2615 MD - Camco BKR-5 3
Total Transit 3 (3625 MD - Camco BKR-5 3
Example 3:
6 GL valves
Dummy Valve in 1st and 5th Mandrel
Unloading in 2nd, 3rd, 4th Mandrel
Orifice in 6th Mandrel

Feb. 7 - 11, 2011 2011 Gas-Lift Workshop 19
WellTracer Analysis- Example 3De
pth (m
eters)
-0
200
400
600
800
1000
1200
1400
1600
1800
Pressure (kPag)
-0 1000 2000 3000 4000 5000 6000
Depth vs Pressure (D vs. P) Well: [GLUE] WORK,EXAMPLE,EXAMPLE 3,23 24-Jan-2011 20:16:19
Production Pressure Model: MMSM
Measured Injection Pressure Model
Measured Valve Opening Pressure
Measured VPC Valve Begin Flow Pressure

Feb. 7 - 11, 2011 2011 Gas-Lift Workshop 20
Any Questions ??

Feb. 7 - 11, 2011 2011 Gas-Lift Workshop 21
CopyrightRights to this presentation are owned by the company(ies) and/or author(s) listed on the title page. By submitting this presentation to the Gas-Lift Workshop, they grant to the Workshop, the Artificial Lift Research and Development Council (ALRDC), and the American Society of Mechanical Engineers (ASME), rights to:
– Display the presentation at the Workshop.– Place it on the www.alrdc.com web site, with access to the site to be as
directed by the Workshop Steering Committee.– Place it on a CD for distribution and/or sale as directed by the Workshop
Steering Committee.Other uses of this presentation are prohibited without the expressed written permission of the company(ies) and/or author(s) who own it and the Workshop Steering Committee.
Feb. 7 - 11, 2011 2011 Gas-Lift Workshop 22
DisclaimerThe following disclaimer shall be included as the last page of a Technical Presentation or Continuing Education Course. A similar disclaimer is included on the front page of the Gas-Lift Workshop Web Site.The Artificial Lift Research and Development Council and its officers and trustees, and the Gas-Lift Workshop Steering Committee members, and their supporting organizations and companies (here-in-after referred to as the Sponsoring Organizations), and the author(s) of this Technical Presentation or Continuing Education Training Course and their company(ies), provide this presentation and/or training material at the Gas-Lift Workshop "as is" without any warranty of any kind, express or implied, as to the accuracy of the information or the products or services referred to by any presenter (in so far as such warranties may be excluded under any relevant law) and these members and their companies will not be liable for unlawful actions and any losses or damage that may result from use of any presentation as a consequence of any inaccuracies in, or any omission from, the information which therein may be contained.The views, opinions, and conclusions expressed in these presentations and/or training materials are those of the author and not necessarily those of the Sponsoring Organizations. The author is solely responsible for the content of the materials.The Sponsoring Organizations cannot and do not warrant the accuracy of these documents beyond the source documents, although we do make every attempt to work from authoritative sources. The Sponsoring Organizations provide these presentations and/or training materials as a service. The Sponsoring Organizations make no representations or warranties, express or implied, with respect to the presentations and/or training materials, or any part thereof, including any warrantees of title, non-infringement of copyright or patent rights of others, merchantability, or fitness or suitability for any purpose.