gao-04-982t energy markets: mergers and other factors … · energy markets mergers and other...
TRANSCRIPT

Testimony Before the Subcommittee on Energy and Air Quality, Committee on Energy and Commerce, House of Representatives
United States Government Accountability Office
GAO
For Release on Delivery Expected at 11:00 a.m. EDT Thursday, July 15, 2004 ENERGY MARKETS
Mergers and Other Factors that Affect the U.S. Refining Industry
Statement of Jim Wells, Director Natural Resources and Environment
GAO-04-982T

www.gao.gov/cgi-bin/getrpt?GAO-04-982T. To view the full product, including the scope and methodology, click on the link above. For more information, contact Jim Wells at (202) 512-3841 or [email protected].
Highlights of GAO-04-982T, a report to Subcommittee on Energy and Air Quality, Committee on Energy and Commerce, House of Representatives
July 15, 2004
ENERGY MARKETS
Mergers and Other Factors that Affect the U.S. Refining Industry
Mergers have altered the structure of the U.S. petroleum industry, including the refining market. Over 2,600 mergers have occurred in the U.S. petroleum industry since the 1990s, mostly later in the period. Industry officials cited various reasons for the mergers, particularly the need for increased efficiency and cost savings. Economic literature also suggests that firms sometimes merge to enhance their ability to control prices. Partly because of the mergers, market concentration has increased in the industry, mostly in the downstream (refining and marketing) segment. For example, market concentration in refining increased from moderately to highly concentrated in the East Coast and from unconcentrated to moderately concentrated in the West Coast. Concentration in the wholesale gasoline market increased substantially from the mid-1990s so that by 2002, most states had either moderately or highly concentrated wholesale gasoline markets. Anecdotal evidence suggests that mergers also have changed other factors affecting competition, such as the ability of new firms to enter the market. Two major changes have occurred in U.S. gasoline marketing related to mergers, according to industry officials. First, the availability of generic gasoline, which is generally priced lower than branded gasoline, has decreased substantially. Second, refiners now prefer to deal with large distributors and retailers, which has motivated further consolidation in distributor and retail markets. Based on data from the mid-1990s through 2000, GAO’s econometric analyses indicate that mergers and increased market concentration generally led to higher wholesale gasoline prices in the United States. Six of the eight mergers GAO modeled led to price increases, averaging about 1 cent to 2 cents per gallon. Increased market concentration, which reflects the cumulative effects of mergers and other competitive factors, also led to increased prices in most cases. For example, wholesale prices for boutique fuels sold in the East and Gulf Coasts—fuels supplied by fewer refiners than conventional gasoline—increased by about 1 cent per gallon, while prices forboutique fuels sold in California increased by over 7 cents per gallon. GAO also identified price increases of one-tenth of a cent to 7 cents that were caused by other factors included in the models, particularly low gasoline inventories relative to demand, supply disruptions in some regions, and high refinery capacity utilization rates. For example, we found that a 1 percent increase in refinery capacity utilization rates resulted in price increases of one-tenth to two-tenths of a cent per gallon. FTC disagreed with GAO’s methodology and findings. However, GAO believes its analyses are sound.
Gasoline is subject to dramatic price swings. A multitude of factors affect U.S. gasoline markets, including world crude oil costs and limited refining capacity. Since the 1990s, another factor affecting U.S. gasoline markets has been a wave of mergers in the petroleum industry, several between large oil companies that had previously competed with each other. For example, in 1999, Exxon, the largest U.S. oil company, merged with Mobil, the second largest. This testimony is based primarily on Energy Markets: Effects of
Mergers and Market
Concentration in the U.S.
Petroleum Industry (GAO-04-96, May 17, 2004). This report examined mergers in the industry from the 1990s through 2000, the changes in market concentration (the distribution of market shares among competing firms) and other factors affecting competition in the industry, how U.S. gasoline marketing has changed since the 1990s, and how mergers and market concentration in the industry have affected U.S. gasoline prices at the wholesale level. To address these issues, GAO purchased and analyzed a large body of data and developed state-of-the art econometric models for isolating the effects of eight specific mergers and increased market concentration on wholesale gasoline prices. Experts peer-reviewed GAO’s analysis.
Page 1 GAO-04-982T Refining Industry
Mr. Chairman and Members of the Subcommittee:
We are pleased to be here today to participate in discussing issues related to the “Status of the U.S. Refining Industry.” Refining transforms crude oil into a wide range of petroleum products, with gasoline accounting for about half of U.S. refinery output.
Data from the Energy Information Administration (EIA) indicate that there are currently 149 refineries in the United States with a total crude oil distillation capacity of about 16.9 million barrels per day. As we testified in 2001, each day vehicles in the United States consume about 10 million barrels of petroleum fuels, primarily gasoline and diesel, and according to projections, the figure will rise to about 15 million barrels per day by 2010, raising concerns about our ability to satisfy this growing demand. According to the United States Energy Association, no new major refinery has been built on the U.S. mainland in the last 25 years, and the nation’s overall distillation capacity has declined more than 10 percent since the peak in 1981.
Concerns have also been raised about recent price increases for gasoline. EIA data show that the average retail price for regular gasoline (the type of gasoline used most in the United States) recently hit a nationwide high of $2.06 cents/gallon by the end of May 2004, an increase of about 58 cents/gallon or 39 percent over the same time last year. In some parts of the country, such as the West Coast, gasoline prices reached an average of $2.34 cents/gallon by the end of May 2004, an increase of about 65 cents/gallon or 38 percent over the same time last year. Although prices have recently begun to fall, elevated gasoline prices can be an economic burden to American consumers and the economy.
A broad range of factors affects gasoline prices and its volatility. These factors typically include changes in crude oil costs, refinery capacity, inventory levels relative to demand, supply disruptions, and regulatory factors—such as many different gasoline formulations that are required to meet varying federal and state environmental laws. Federal and state taxes are also a component of U.S. gasoline prices, but these do not fluctuate often. We have addressed many of these issues in several studies on energy markets. Among other things, our past studies showed that
• the U.S. economy is vulnerable to oil supply disruptions and options were identified to mitigate their effects;
Page 2 GAO-04-982T Refining Industry
• the Clean Air Act specifically requires refiners to produce reformulated gasoline, and the requirement to provide a specific blend for a specific area can present challenges to refiners and other suppliers if there are supply disruptions;
• most spikes in gasoline prices appear to result from such factors as increases in world crude oil prices, unexpected refinery outages, or larger-than-expected increase in demand; and
• gasoline price spikes were generally higher in California from January 1995 through December 1999 than in the rest of the nation, partly because there were unplanned refinery outages and it was difficult to substitute for the loss of supply of CARB, the special reformulated gasoline used in California. Market consolidation is another factor that can affect the price of gasoline. Our testimony today will focus on our recent study that examined the effects of market consolidation—including increased market concentration in refining—and other factors related to the U. S. petroleum industry.1
Since the 1990s, the U.S. petroleum industry has experienced a wave of mergers, acquisitions, and joint ventures, several of them between large oil companies that had previously competed with each other for the sale of petroleum products.2 A few examples include the merger between British Petroleum (BP) and Amoco in 1998 to form BPAmoco, which later merged with ARCO, and the merger in 1999 between Exxon, the largest U.S. oil company, and Mobil, the second largest. In general, mergers raise concerns about potential anticompetitive effects on the U.S. petroleum industry and ultimately on gasoline prices because mergers could result in greater market power for the merged companies, potentially allowing
1See U.S. General Accounting Office, Energy Markets: Effects of Mergers and Market
Concentration in the U.S. Petroleum Industry, GAO-04-96 (Washington, D.C., May 17, 2004). Additional related GAO studies include U.S. Ethanol Market: MTBE Ban in
California, GAO-02-440R (Washington, D.C., Feb. 27, 2002); Alternative Motor Fuels and
Vehicles: Impact on the Transportation Sector, GAO-01-957T (Washington, D.C., July 10, 2001); Motor Fuels: California Gasoline Price Behavior, GAO/RCED-96-121 (Washington, D.C., Apr. 28, 2000); International Energy Agency: How the Agency Prepares Its World
Market Statistics, GAO/RCED-99-142 (Washington, D.C., May 7, 1999); and Energy
Security: Evaluating U.S. Vulnerability to Oil Supply Disruptions and Options for
Mitigating Their Effects, GAO/RCED-97-6 (Washington, D.C., Dec. 12, 1996).
2We refer to all of these transactions as mergers.

Page 3 GAO-04-982T Refining Industry
them to increase prices above competitive levels.3 On the other hand, mergers could also yield cost savings and efficiency gains, which may be passed on to consumers in lower prices. Ultimately, the impact depends on whether market power or efficiency dominates.
Our report examined mergers in the U.S. petroleum industry from the 1990s through 2000; the changes in market concentration (the distribution of market shares among competing firms) in the different segments, including refining, and other factors affecting competition in the U.S. petroleum industry; how U.S. gasoline marketing has changed since the 1990s; and how mergers and market concentration in the U.S. petroleum industry have affected U.S. gasoline prices at the wholesale level.
To address these issues, we purchased and analyzed a large body of data on mergers and wholesale gasoline prices, as well as data on other relevant economic factors, including refinery capacity. We also developed econometric models for examining the effects of eight specific mergers and increased market concentration on U.S. wholesale gasoline prices nationwide. It is noteworthy that using econometric models allowed us to measure the effects of mergers and market concentration while isolating the effects of several other factors that could influence wholesale gasoline prices, such as world crude oil costs, limited refining capacity, or low inventories relative to demand. For our market concentration model, we used concentration data measured at the refining level. We believe that the source of potential market power in the wholesale gasoline market is at the refining level because the refinery market is imperfectly competitive and refiners essentially control gasoline sales at the wholesale level.
In the course of our work, we consulted with Dr. Severin Borenstein,4 a recognized expert in the modeling of gasoline markets; interviewed officials across the industry spectrum; and reviewed relevant economic literature and numerous related studies. We also used an extensive peer review process to obtain comments from experts in academia and relevant
3Federal Trade Commission and Department of Justice have defined market power for a seller as the ability profitably to maintain prices above competitive levels for a significant period of time.
4Dr. Borenstein is E.T. Grether Professor of Business Administration and Public Policy at the Haas School of Business, University of California, Berkeley. He is also the Director of the University of California Energy Institute.

Page 4 GAO-04-982T Refining Industry
government agencies. We conducted our work in accordance with generally accepted government auditing standards.
In summary, we found the following:
• Over 2,600 mergers occurred in the petroleum industry from 1991 through 2000, mostly during the second half of the decade. Petroleum industry officials cited various reasons for this wave of mergers, particularly the need for increased efficiency and cost savings. Economic literature suggests that firms also sometimes use mergers to enhance their market power. Ultimately, the reasons cited by both sources generally relate to the merging companies’ desire to maximize profit or shareholder wealth.
• Market concentration, which is commonly measured by the Herfindahl-Hirschman Index (HHI), has increased in the downstream (refining and marketing) segment of the U.S. petroleum industry since the 1990s, partly as a result of merger activities, while changing very little in the upstream (exploration and production) segment. Of particular interest to this subcommittee, market concentration in refining increased, although the levels as well as the changes varied geographically. For example, market concentration in refining increased from moderately to highly concentrated in the East Coast and from unconcentrated to moderately concentrated in the West Coast; it increased but remained moderately concentrated in the Rocky Mountain region. Concentration in the wholesale gasoline market increased substantially from the mid-1990s so that by 2002, most states had either moderately or highly concentrated wholesale gasoline markets. Anecdotal evidence suggests that mergers may also have affected other factors that impact competition, such as the ability of new firms to enter the market.
• According to industry officials, two major changes have occurred in U.S. gasoline marketing since the 1990s, partly related to mergers. First, the availability of unbranded (generic) gasoline has decreased substantially. Unbranded gasoline is generally priced lower than branded gasoline, which is marketed under the refiner’s trademark. Industry officials generally attributed the decreased availability of unbranded gasoline to, among other factors, a reduction in the number of independent refiners that typically supply unbranded gasoline. Second, industry officials said that refiners now prefer dealing with large distributors and retailers. This preference, according to the officials, has motivated further consolidation in both the distributor and retail markets, including the rise of hypermarkets—a relatively new breed of gasoline market participants that includes such large retail warehouses as Wal-Mart and Costco.

Page 5 GAO-04-982T Refining Industry
• Our econometric analyses, using data from the mid-1990s through 2000, show that oil industry mergers generally led to higher wholesale gasoline prices (measured in our report as wholesale prices less crude oil prices), although prices sometimes decreased. Six of the eight specific mergers we modeled—which mostly involved large, fully vertically integrated companies—generally resulted in increases in wholesale prices for branded and/or unbranded gasoline of about 2 cents per gallon, on average. Two of the mergers generally led to price decreases averaging about 1 cent per gallon. The preponderance of price increases over decreases indicates that the market power effects, which tend to increase prices, for the most part outweighed the efficiency effects, which tend to decrease prices.
• Our econometric analyses also show that increased market concentration, which captures the cumulative effects of mergers as well as other market structure factors, also generally led to higher prices for conventional gasoline and for boutique fuels—gasoline that has been reformulated for certain areas in the East Coast and Gulf Coast regions and in California to lower pollution. The price increases were particularly large in California, where they averaged about 7 cents per gallon.
• Higher wholesale gasoline prices were also a result of other factors: high refinery capacity utilization rate; low gasoline inventories, which typically occur in the summer driving months; and supply disruptions, which occurred in the Midwest and on the West Coast. We identified price increases of one-tenth of 1 cent to 7 cents per gallon that were caused by other factors included in our models—particularly low gasoline inventories relative to demand, high refinery capacity utilization rates, and supply disruptions that occurred in some regions. For example, we found that a 1 percent increase in refinery capacity utilization rates resulted in price increases of one-tenth to two-tenths of a cent per gallon. We found that prices were higher because higher refinery capacity utilization rates leave little room for error in predicting short-run demand. During the period of our study, refinery capacity utilization rates at the national level averaged about 94 percent per week. Just last week, DOE testified that U.S. refineries are running at near total capacity of about 96 percent. As I noted earlier, we used extensive peer review to obtain comments from outside experts, including FTC and EIA, and we incorporated those comments as appropriate. FTC disagreed with our methodology and findings and provided extensive comments, which we have addressed in our report. Our findings are generally consistent with previous studies of the effects of specific oil mergers and of market concentration on gasoline prices. We believe, however, that ours is the first comprehensive study to

Page 6 GAO-04-982T Refining Industry
model the impact of the industry’s 1990s wave of mergers on wholesale gasoline prices for the entire United States, an effort that required us to acquire large datasets and perform complex analyses.
Many firms of varying sizes make up the U.S. petroleum industry. While some firms engage in only limited activities within the industry, such as exploration for and production of crude oil and natural gas or refining crude oil and marketing petroleum products, fully vertically integrated oil companies participate in all aspects of the industry. Before the 1970s, major oil companies that were fully vertically integrated controlled the global network for supplying, pricing, and marketing crude oil. However, the structure of the world crude oil market has dramatically changed as a result of such factors as the nationalization of oil fields by oil-producing countries, the emergence of independent oil companies, and the evolution of futures and spot markets in the 1970s and 1980s. Since U.S. oil prices were deregulated in 1981, the price paid for crude oil in the United Stated has been largely determined in the world oil market, which is mostly influenced by global factors, especially supply decisions of the Organization of Petroleum Exporting Countries (OPEC) and world economic and political conditions.
The United States currently imports over 60 percent of its crude oil supply. In contrast, the bulk of the gasoline used in the United States is produced domestically. In 2001, for example, gasoline refined in the United States accounted for over 90 percent of the total domestic gasoline consumption. Companies that supply gasoline to U.S. markets also post the domestic gasoline prices. Historically, the domestic petroleum market has been divided into five regions: the East Coast region, the Midwest region, the Gulf Coast region, the Rocky Mountain region, and the West Coast region. (See fig. 1.) These regions are known as Petroleum Administration for Defense Districts (PADDs).
Background

Page 7 GAO-04-982T Refining Industry
Figure 1: Petroleum Administration for Defense Districts
Proposed mergers in all industries, including the petroleum industry, are generally reviewed by federal antitrust authorities—including the Federal Trade Commission (FTC) and the Department of Justice (DOJ)—to assess the potential impact on market competition. According to FTC officials, FTC generally reviews proposed mergers involving the petroleum industry because of the agency’s expertise in that industry. FTC analyzes these mergers to determine if they would likely diminish competition in the

Page 8 GAO-04-982T Refining Industry
relevant markets and result in harm, such as increased prices. To determine the potential effect of a merger on market competition, FTC evaluates how the merger would change the level of market concentration, among other things. Conceptually, the higher the concentration, the less competitive the market is and the more likely that firms can exert control over prices. The ability to maintain prices above competitive levels for a significant period of time is known as market power.
According to the merger guidelines jointly issued by DOJ and FTC, market concentration as measured by HHI is ranked into three separate categories: a market with an HHI under 1,000 is considered to be unconcentrated; if HHI is between 1,000 and 1,800 the market is considered moderately concentrated; and if HHI is above 1,800, the market is considered highly concentrated.5
While concentration is an important aspect of market structure—the underlying economic and technical characteristics of an industry—other aspects of market structure that may be affected by mergers also play an important role in determining the level of competition in a market. These aspects include barriers to entry, which are market conditions that provide established sellers an advantage over potential new entrants in an industry, and vertical integration.
Over 2,600 merger transactions occurred from 1991 through 2000 involving all three segments of the U.S. petroleum industry. Almost 85 percent of the mergers occurred in the upstream segment (exploration and production), while the downstream segment (refining and marketing of petroleum) accounted for about 13 percent, and the midstream segment (transportation) accounted for over 2 percent. The vast majority of the mergers—about 80 percent—involved one company’s purchase of a segment or asset of another company, while about 20 percent involved the acquisition of a company’s total assets by another so that the two became one company. Most of the mergers occurred in the second half of the decade, including those involving large partially or fully vertically integrated companies.
5HHI is calculated by summing the squares of the market shares of all the firms within a given market.
Mergers Occurred in All Segments of the U.S. Petroleum Industry in the 1990s for Several Reasons

Page 9 GAO-04-982T Refining Industry
Petroleum industry officials and experts we contacted cited several reasons for the industry’s wave of mergers in the 1990s, including achieving synergies, increasing growth and diversifying assets, and reducing costs. Economic literature indicates that enhancing market power is also sometimes a motive for mergers. Ultimately, these reasons mostly relate to companies’ desire to maximize profit or stock values.
Mergers in the 1990s contributed to increases in market concentration in the downstream (refining and marketing) segment of the U.S. petroleum industry, while the upstream segment experienced little change.
Overall, the refining market experienced increasing levels of market concentration (based on refinery capacity) in all five PADDs during the 1990s, especially during the latter part of the decade, but the levels as well as the changes of concentration varied geographically.
In PADD I—the East Coast—the HHI for the refining market increased from 1136 in 1990 to 1819 in 2000, an increase of 683 (see fig. 2). Consequently, this market went from moderately concentrated to highly concentrated. Compared to other U.S. PADDs, a greater share of the gasoline consumed in PADD I comes from other supply sources—mostly from PADD III and imports—than within the PADD. Consequently, some industry officials and experts believe that the competitive impact of increased refiner concentration within the PADD could be mitigated.6
6However, if the same PADD I refiners are also mostly responsible for importing gasoline into the PADD, it could have implications for the PADD’s wholesale gasoline market concentration. In addition, the extent to which these companies control vital infrastructure, such as terminals and pipelines, within the region could impact competitive conditions.
Mergers Contributed to Increases in Market Concentration and to Other Changes That Affect Competition

Page 10 GAO-04-982T Refining Industry
Figure 2: Refining Market Concentration for PADD I Based on Crude Oil Distillation Capacity (1990-2000)
Note: Data for 1996 and 1998 were unavailable.
For PADD II (the Midwest), the refinery market concentration increased from 699 to 980 —an increase of 281—between 1990 and 2000. However, as figure 3 shows, this PADD’s refining market remained unconcentrated at the end of the decade. According to EIA’s data, as of 2001, the quantity of gasoline refined in PADD II was slightly less than the quantity consumed within the PADD.

Page 11 GAO-04-982T Refining Industry
Figure 3: Refining Market Concentration for PADD II Based on Crude Oil Distillation Capacity (1990-2000)
Note: Data for 1996 and 1998 were unavailable.
The refining market in PADD III (the Gulf Coast), like PADD II, was unconcentrated as of the end of 2000, although its HHI increased by 170—from 534 in 1990 to 704 in 2000 (see fig. 4). According to EIA’s data, much more gasoline is refined in PADD III than is consumed within the PADD, making PADD III the largest net exporter of gasoline to other parts of the United States.

Page 12 GAO-04-982T Refining Industry
Figure 4: Refining Market Concentration for PADD III Based on Crude Oil Distillation Capacity (1990-2000)
Note: Data for 1996 and 1998 were unavailable.
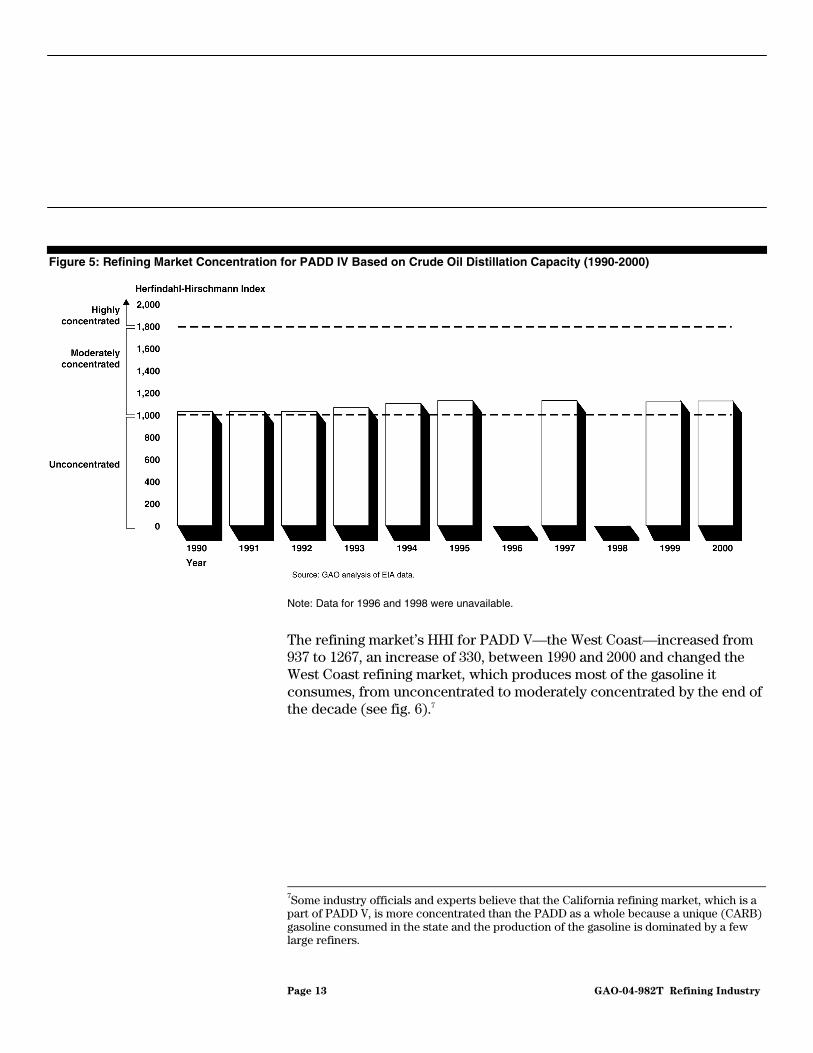
The HHI for the refining market in PADD IV—the Rocky Mountain region—where gasoline production and consumption are almost balanced—increased by 95 between 1990 and 2000. This increase changed the PADD’s refining market from 1029 in 1990 to 1124 in 2000, within the moderate level of market concentration (see fig. 5).
Page 13 GAO-04-982T Refining Industry
Figure 5: Refining Market Concentration for PADD IV Based on Crude Oil Distillation Capacity (1990-2000)
Note: Data for 1996 and 1998 were unavailable.
The refining market’s HHI for PADD V—the West Coast—increased from 937 to 1267, an increase of 330, between 1990 and 2000 and changed the West Coast refining market, which produces most of the gasoline it consumes, from unconcentrated to moderately concentrated by the end of the decade (see fig. 6).7
7Some industry officials and experts believe that the California refining market, which is a part of PADD V, is more concentrated than the PADD as a whole because a unique (CARB) gasoline consumed in the state and the production of the gasoline is dominated by a few large refiners.

Page 14 GAO-04-982T Refining Industry
Figure 6: Refining Market Concentration for PADD V Based on Crude Oil Distillation Capacity (1990-2000)
Note: Data for 1996 and 1998 were unavailable.
We estimated a high and statistically significant degree of correlation between merger activity and the HHIs for refining in PADDs I, II, and V for 1991 through 2000. Specifically, the corresponding correlation numbers are 91 percent for PADD V (West Coast), 93 percent for PADD II (Midwest), and 80 percent for PADD I (East Coast). While mergers were positively correlated with refining HHIs in PADDs III and IV—the Gulf Coast and the Rocky Mountains—the estimated correlations were not statistically significant.
In wholesale gasoline markets, market concentration increased broadly throughout the United States between 1994 and 2002. Specifically, we found that 46 states and the District of Columbia had moderately or highly concentrated markets by 2002, compared to 27 in 1994.
Evidence from various sources indicates that, in addition to increasing market concentration, mergers also contributed to changes in other aspects of market structure in the U.S. petroleum industry that affect competition—specifically, vertical integration and barriers to entry.

Page 15 GAO-04-982T Refining Industry
However, we could not quantify the extent of these changes because of a lack of relevant data.
Vertical integration can conceptually have both pro- and anticompetitive effects. Based on anecdotal evidence and economic analyses by some industry experts, we determined that a number of mergers that have occurred since the 1990s have led to greater vertical integration in the U.S. petroleum industry, especially in the refining and marketing segment. For example, we identified eight mergers that occurred between 1995 and 2001 that might have enhanced the degree of vertical integration, particularly in the downstream segment.
Concerning barriers to entry, our interviews with petroleum industry officials and experts provide evidence that mergers had some impact on the U.S. petroleum industry. Barriers to entry could have implications for market competition because companies that operate in concentrated industries with high barriers to entry are more likely to possess market power. Industry officials pointed out that large capital requirements and environmental regulations constitute barriers for potential new entrants into the U.S. refining business. For example, the officials indicated that a typical refinery could cost billions of dollars to build and that it may be difficult to obtain the necessary permits from the relevant state or local authorities.
According to some petroleum industry officials that we interviewed, gasoline marketing in the United States has changed in two major ways since the 1990s. First, the availability of unbranded gasoline has decreased, partly due to mergers. Officials noted that unbranded gasoline is generally priced lower than branded. They generally attributed the decreased availability of unbranded gasoline to one or more of the following factors:
• There are now fewer independent refiners, who typically supply mostly unbranded gasoline. These refiners have been acquired by branded companies, have grown large enough to be considered a brand, or have simply closed down.
• Partially or fully vertically integrated oil companies have sold or mothballed some refineries. As a result, some of these companies now have only enough refinery capacity to supply their own branded needs, with little or no excess to sell as unbranded.
U.S. Gasoline Marketing Has Changed in Two Major Ways

Page 16 GAO-04-982T Refining Industry
• Major branded refiners are managing their inventory more efficiently, ensuring that they produce only enough gasoline to meet their current branded needs. We could not quantify the extent of the decrease in the unbranded gasoline supply because the data required for such analyses do not exist. The second change identified by these officials is that refiners now prefer dealing with large distributors and retailers because they present a lower credit risk and because it is more efficient to sell a larger volume through fewer entities. Refiners manifest this preference by setting minimum volume requirements for gasoline purchases. These requirements have motivated further consolidation in the distributor and retail sectors, including the rise of hypermarkets.
Our econometric modeling shows that the mergers we examined mostly led to higher wholesale gasoline prices in the second half of the 1990s. The majority of the eight specific mergers we examined—Ultramar Diamond Shamrock (UDS)-Total, Tosco-Unocal, Marathon-Ashland, Shell-Texaco I (Equilon), Shell-Texaco II (Motiva), BP-Amoco, Exxon-Mobil, and Marathon Ashland Petroleum (MAP)-UDS—resulted in higher prices of wholesale gasoline in the cities where the merging companies supplied gasoline before they merged. The effects of some of the mergers were inconclusive, especially for boutique fuels sold in the East Coast and Gulf Coast regions and in California.
• For the seven mergers that we modeled for conventional gasoline, five led to increased prices, especially the MAP-UDS and Exxon-Mobil mergers, where the increases generally exceeded 2 cents per gallon, on average.
• For the four mergers that we modeled for reformulated gasoline, two—Exxon-Mobil and Marathon-Ashland—led to increased prices of about 1 cent per gallon, on average. In contrast, the Shell-Texaco II (Motiva) merger led to price decreases of less than one-half cent per gallon, on average, for branded gasoline only.
• For the two mergers—Tosco-Unocal and Shell-Texaco I (Equilon)—that we modeled for gasoline used in California, known as California Air Resources Board (CARB) gasoline, only the Tosco-Unocal merger led to price increases. The increases were for branded gasoline only and exceeded 6 cents per gallon, on average.
Mergers and Increased Market Concentration Generally Led to Higher U.S. Wholesale Gasoline Prices

Page 17 GAO-04-982T Refining Industry
For market concentration, which captures the cumulative effects of mergers as well as other competitive factors, our econometric analysis shows that increased market concentration resulted in higher wholesale gasoline prices.
• Prices for conventional (non-boutique) gasoline, the dominant type of gasoline sold nationwide from 1994 through 2000, increased by less than one-half cent per gallon, on average, for branded and unbranded gasoline. The increases were larger in the West than in the East—the increases were between one-half cent and one cent per gallon in the West, and about one-quarter cent in the East (for branded gasoline only), on average.
• Price increases for boutique fuels sold in some parts of the East Coast and Gulf Coast regions and in California were larger compared to the increases for conventional gasoline. The wholesale prices increased by an average of about 1 cent per gallon for boutique fuel sold in the East Coast and Gulf Coast regions between 1995 and 2000, and by an average of over 7 cents per gallon in California between 1996 and 2000. Our analysis shows that wholesale gasoline prices were also affected by other factors included in the econometric models, including gasoline inventories relative to demand, supply disruptions in some parts of the Midwest and the West Coast, and refinery capacity utilization rates. For refinery capacity utilization rates, we found that prices were higher by about an average of one-tenth to two-tenths of 1 cent per gallon when utilization rates increased by 1 percent. We found that prices were higher because higher refinery capacity utilization rates leave little room for error in predicting short-run demand. During the period of our study, refinery capacity utilization rates at the national level averaged about 94 percent per week.
Mr. Chairman, this concludes my prepared statement. I would be happy to respond to any questions that you or other Members of the Subcommittee may have.
For further information about this testimony, please contact me at (202) 512-3841. Key contributors to this testimony included Godwin Agbara, John A. Karikari, and Cynthia Norris.
GAO Contacts and Staff Acknowledgments
(360503)

This is a work of the U.S. government and is not subject to copyright protection in the United States. It may be reproduced and distributed in its entirety without further permission from GAO. However, because this work may contain copyrighted images or other material, permission from the copyright holder may be necessary if you wish to reproduce this material separately.

GAO’s Mission The Government Accountability Office, the audit, evaluation and investigative arm of Congress, exists to support Congress in meeting its constitutional responsibilities and to help improve the performance and accountability of the federal government for the American people. GAO examines the use of public funds; evaluates federal programs and policies; and provides analyses, recommendations, and other assistance to help Congress make informed oversight, policy, and funding decisions. GAO’s commitment to good government is reflected in its core values of accountability, integrity, and reliability.
Obtaining Copies of GAO Reports and Testimony
The fastest and easiest way to obtain copies of GAO documents at no cost is through GAO’s Web site (www.gao.gov). Each weekday, GAO posts newly released reports, testimony, and correspondence on its Web site. To have GAO e-mail you a list of newly posted products every afternoon, go to www.gao.gov and select “Subscribe to Updates.”
Order by Mail or Phone The first copy of each printed report is free. Additional copies are $2 each. A check or money order should be made out to the Superintendent of Documents. GAO also accepts VISA and Mastercard. Orders for 100 or more copies mailed to a single address are discounted 25 percent. Orders should be sent to:
U.S. Government Accountability Office441 G Street NW, Room LMWashington, D.C. 20548
To order by Phone: Voice: (202) 512-6000 TDD: (202) 512-2537 Fax: (202) 512-6061
To Report Fraud, Waste, and Abuse in Federal Programs
Contact:
Web site: www.gao.gov/fraudnet/fraudnet.htmE-mail: [email protected] answering system: (800) 424-5454 or (202) 512-7470
Congressional Relations
Gloria Jarmon, Managing Director, [email protected] (202) 512-4400U.S. Government Accountability Office, 441 G Street NW, Room 7125 Washington, D.C. 20548
Public Affairs Jeff Nelligan, Managing Director, [email protected] (202) 512-4800U.S. Government Accountability Office, 441 G Street NW, Room 7149 Washington, D.C. 20548