gao-02-835 collective bargaining rights: information on
TRANSCRIPT

Report to Congressional RequestersU.S. Senate
United States General Accounting Office
GAO
September 2002 COLLECTIVEBARGAININGRIGHTS
Information on theNumber of Workerswith and withoutBargaining Rights
GAO-02-835

Page i GAO-02-835 Collective Bargaining
Letter 1
Results in Brief 2Background 4Three-Quarters of U.S. Workers Have Collective Bargaining Rights 5Over 32 Million Workers Do Not Have Collective Bargaining Rights 10Percentage of Total Labor Force with Bargaining Rights Likely
Increased Since 1959 14Two Recent Supreme Court Cases Could Affect Gains in Coverage
over the Last 40 Years 18
Appendix I Methodology 23
Overall Approach 23Legal Review 23Definition of Bargaining Rights 23Workforce Estimations and Analysis 24
Tables
Table 1: Number of Workers Receiving Collective BargainingRights from 1959 through February 2001 16
Table 2: Net Effects of Changes in Excluded Groups on Percent ofthe Labor Force That Has Bargaining Rights, 1959 and 2001 17
Table 3: Minimum Annual Dollar Sales Volumes for Coverage underNLRA 27
Table 4: Definitions of Supervisory Leveling Factors, 1997 NCS 30Table 5: Comparison of NLRA Definitions of Private Sector
Excluded Groups and Those Used in GAO’s QuantitativeEstimates 35
Table 6: Census Level Estimates of the Foreign-Born Population byMigrant Status in 2000 37
Table 7: Estimates of Residual Foreign-Born by Age 37
Figures
Figure 1: Private Sector Collective Bargaining Coverage and KeyGroups with No Rights, February 2001 6
Figure 2: Comparison of Number of Workers with CollectiveBargaining Rights with Total Number of Workers, byIndustry, February 2001 7
Contents

Page ii GAO-02-835 Collective Bargaining
Figure 3: Percent of Work Force That Has Collective BargainingRights and Percent Who Are Independent Contractors byPrivate Sector Industry, February 2001 8
Figure 4: Percentage of Workers Affected by the Board’s DollarSales Volume Standards, by Industry, February 2001 28
Abbreviations
AFSCME American Federation of State, County, and MunicipalEmployees
BLS Bureau of Labor StatisticsCES Current Employment Statistics SurveyCPS Current Population SurveyINS Immigration and Naturalization ServiceIRCA Immigration Reform and Control Act of 1986NCS National Compensation SurveyNLRA National Labor Relations ActSBA Small Business AdministrationSIC Standard Industry ClassificationSOC Standard Occupational ClassificationUSDA U.S. Department of Agriculture

Page 1 GAO-02-835 Collective Bargaining
September 13, 2002
The Honorable Edward M. KennedyChairman, Committee on Health, Education, Labor, and PensionsUnited States Senate
The Honorable Paul WellstoneChairman, Subcommittee on Employment, Safety and Training,Committee on Health, Education, Labor, and PensionsUnited States Senate
In 1935, the federal National Labor Relations Act (NLRA),1 also known asthe Wagner Act, provided many U.S. workers the right to bargain overwages, hours, and other terms and conditions of employment with theiremployers, forming the framework for collective bargaining in the UnitedStates. The NLRA not only allowed workers to join together to formunions, but also required that employers recognize certified employeeunions and bargain “in good faith.” While the NLRA applied broadly to“employees,” it and subsequent amendments excluded certain groups ofworkers from its coverage. Since then, other federal, state, and localstatutes have provided rights to some persons in these excluded groups.
As Congress reviews the extent that American workers have bargainingrights, you asked us to determine and assess (1) how many workers havestatutory collective bargaining rights2 in the current civilian U.S.workforce, (2) the types and numbers of workers without such rights,(3) how the extent of collective bargaining rights among the workforcemay have changed during the past 40 years and (4) the potential impact of
129 U.S.C. 151 et seq.
2For this report, we consider statutes as providing “collective bargaining rights” if they notonly permit individuals to join together and form unions, but also require employers torecognize employee organizations and to “bargain in good faith.” Note that havingcollective bargaining rights does not necessarily imply the exercise of those rights throughunion membership or other forms of collective action. Although not statutes, in severalinstances we included workers who received rights through gubernatorial executiveorders.
United States General Accounting Office
Washington, DC 20548

Page 2 GAO-02-835 Collective Bargaining
two recent Supreme Court decisions—the Kentucky River and Hoffman
Plastic cases3—on the types and numbers of workers without collectivebargaining rights.
To provide you with this information, we reviewed the NLRA of 1935 andsubsequent amendments and Supreme Court decisions and National LaborRelations Board (Board) cases with regard to the scope of the act’scoverage. We also identified and reviewed those other federal, state, orlocal statutes that provide collective bargaining rights to employees. Wemet with staff, Board members, and the General Counsel of the Board andoutside organizations and experts to assist in our review. We thendeveloped a methodology, using data from the February 2001 CurrentPopulation Survey (CPS) Supplement collected by the Bureau of theCensus and from other data sets, to construct a quantitative estimate ofthe percentage of the labor force that currently has statutory collectivebargaining rights. Our work was conducted between November 2001 andJune 2002 in accordance with generally accepted government auditingstandards.
We estimate that about three-quarters of the civilian workforce—or about103 million of the approximate 135 million people in the labor force as ofFebruary 2001—had some form of collective bargaining rights fromfederal, state, or local statutes. Among the 115 million private sectorworkers, about 78 percent had bargaining rights, mostly from coverageunder the NLRA. Coverage varied among industries, being the highest(90 percent) for the 20.4 million workers in the manufacturing sector. Ingeneral, coverage in the private sector was higher than that in the publicsector, where about 66 percent of 20 million government workers hadsome form of collective bargaining rights, most often under state or localstatutes.
In contrast, about 32 million civilian workers were without collectivebargaining rights under any law, either federal or state. The largest groupswithout rights were about 8.5 million independent contractors; 5.5 millionemployees of certain small businesses; 10.2 million supervisory/managerialemployees (including 8.6 million first-line supervisors); 6.9 million federal,
3National Labor Relations Board v. Kentucky River Community Care, Inc., 532 U.S. 706
(2001) and Hoffman Plastic Compounds, Inc. v. National Labor Relations Board, 122S.Ct. 1275 (2002).
Results in Brief

Page 3 GAO-02-835 Collective Bargaining
state and local government workers; approximately 532,000 domesticworkers; and 357,000 agricultural workers.
Our analysis of available data suggests that the proportion of the totallabor force with collective bargaining rights has likely increased since1959. Since 1959, no major group of workers has lost bargaining rightsunder the NLRA. However, other federal, state, and local laws haveextended rights to some workers in the groups excluded from the NLRA,providing bargaining rights to about 14.5 million workers, primarilynonprofit health care workers; federal, state, and local governmentworkers; and agricultural workers. In addition, because of inflation, therehas likely been a decline in the proportion of the labor force employed insmall businesses with annual dollar sales volumes too small to be underthe Board’s jurisdiction. While other excluded groups like managers andsupervisors may have increased in size, it is unlikely that their growth wassufficiently large to offset the gains in the number of workers obtainingrights.4
Under two recent Supreme Court cases affecting Board decisions, someworkers currently with bargaining rights may either lose bargaining rightsor have their rights diminished. In the Kentucky River decision, theSupreme Court ruled that the Board should revise its test for determiningwhether a worker is a supervisor, an excluded group under the NLRA,finding that the Board’s test served to categorically include certainemployees as covered under the act. Because any future tests used by theBoard to determine whether or not employees are supervisors should beless categorical and more case-specific, the Kentucky River decision couldincrease the number of employees considered supervisory and thusexcluded from coverage under the act. The Board has not yet devisedalternative tests in response to the decision, and given the case-by-casedetermination required by the Court, we are unable to estimate thenumber of employees that could potentially be deemed supervisors as aresult of this decision. In the case of Hoffman Plastic, the Court reversedthe Board’s decision to award back pay to an undocumented alien workerwho was fired for union activity. While the Court did not excludeundocumented alien workers from protection under the NLRA, per se, itprohibited the Board from awarding back pay to these undocumentedalien workers whose rights had been violated, stating that this remedywould conflict with federal immigration law. Since back pay is one of the
4For specifics on our methodology, see app. I.
Page 4 GAO-02-835 Collective Bargaining
major remedies available to workers for a violation of their rights, theCourt’s decision effectively diminishes the bargaining rights of suchworkers under the NLRA. Undocumented alien workers potentiallyaffected by the Hoffman decision are estimated to number about 5.5million.
The NLRA, enacted in 1935, is the cornerstone of labor relations andcollective bargaining in the United States, providing the basic frameworkgoverning private sector labor-management relations. It providesemployees the right to form unions and bargain collectively and requiresemployers to recognize employee unions that demonstrate support from amajority of employees and to bargain in good faith. The act includes thepayment of back pay and the reinstatement of employment as remedies forcertain violations of the act.5 It also created an agency called the NationalLabor Relations Board (Board) to administer and enforce the act.Subsequently, in 1947, the Taft-Hartley Act6 and the Landrum-Griffin Act in19597 amended the NLRA, among other things, to clarify coverage underthe NLRA, prohibit certain union activities, and set requirements on uniongovernance. Together, these statutes established the basic policies andprocedures under which most private sector collective bargaining stilloperates today.
Although the NLRA applies in general to all “employees,” certain groups ofworkers are excluded from its provisions, either by express statutorylanguage in the original act and its amendments or by Board or judicialinterpretation. Among the groups of workers excluded from the act are(1) supervisors and managers; (2) independent contractors; (3) employeesof certain small businesses; (4) domestic workers; (5) agriculturalworkers; and (6) federal, state, and local government employees.8 These
5Back pay is monetary compensation, including interest, for the wages lost because of theviolation.
6Labor-Management Relations Act, ch. 120, 61 Stat. 136 (1947).
7Labor-Management Reporting and Disclosure Act of 1959, P.L. 86-257 (1959).
8Other groups of excluded employees include workers who are employees of a parent or aspouse, U.S. employees of international organizations like the World Bank, confidentialassistants of labor relations managers, and lay teachers at religious schools. Because wewere unable to accurately estimate the numbers of these workers in the total workforceusing a national database, we have not included these groups in our estimates. However,we believe that the numbers of workers in these groups to be small, particularly in relationto the total workforce, and thus would not have a major impact on our overall estimates.
Background

Page 5 GAO-02-835 Collective Bargaining
categories of excluded workers have been defined through various tests,which the Board can apply to determine coverage of the act. For example,the act sets forth a three-part test for determining supervisory status.Employees are statutory supervisors if (1) they hold the authority toengage in any 1 of 12 listed supervisory functions—hire, transfer, suspend,lay off, recall, promote, discharge, assign, reward, or discipline otheremployees or responsibility to direct them, to adjust their grievances, oreffectively to recommend such action; (2) their exercise of such authorityis not of a merely routine or clerical nature, but requires the use ofindependent judgment; and (3) their authority is held in the interest of theemployer.
While the NLRA underpins much collective bargaining activity in theUnited States, other federal, state, and local statutes also providebargaining rights to many individuals excluded from the NLRA,particularly government workers and agricultural workers. The bargainingrights and procedures under these statutes generally differ from thoseunder the NLRA, with variation in important areas such as what may bebargained for, and how disputes are handled. For example, many statelaws covering public employees prohibit the right to strike, while theNLRA does not.
We estimate that about 103 million workers had collective bargainingrights in their primary job in February 2001.9 These workers constitutedabout 77 percent of the 135 million people in the civilian workforce.10 Thepercentage of workers with bargaining rights varied among industries andbetween the private and public sector. As certain workers are not coveredunder the NLRA but rather under various other federal, state, and localstatutes, not all workers—particularly agricultural workers and publicsector workers—have rights equivalent to those under the NLRA.
9This estimate is for the entire workforce and includes workers who were both theemployed and unemployed. For those workers who were unemployed, we determinedwhether they had rights or not on the basis of their most recent primary job.
10In February 2001, the total workforce of full-time and part-time workers included about141 million people aged 16 and above. From this total, we subtracted about 5.8 millionpeople we classified as “self employeds”—those self-employed who were not independentcontractors—resulting in a workforce of about 135 million people. (See app. I.)
Three-Quarters ofU.S. Workers HaveCollective BargainingRights

Page 6 GAO-02-835 Collective Bargaining
Nearly an estimated 90 million private sector workers had collectivebargaining rights, about 78 percent of all persons who worked for privateemployers.11 (See fig.1.) The percentage of covered private sector workersvaried by industry, with certain industries having coverage below70 percent—agriculture/forestry, construction, and finance/real estate.Coverage also varied between the private and public sectors, with overallcoverage among government workers (about 66 percent of 20 millionworkers) markedly lower than that among all private sector workers.Figure 2 compares the number of workers with bargaining rights with thetotal number of workers, by industry.
Figure 1: Private Sector Collective Bargaining Coverage and Key Groups with NoRights, February 2001
Source: GAO’s analysis of February 2001 CPS Supplement, the 1997 Economic Census, and the1997 Bureau of Labor Statistics National Compensation Survey.
11An alternative methodology to counting the number of workers with rights would be tocount the number of jobs covered by these laws. When we compared our CPS estimateswith those from the job-based Current Employment Statistics survey, we found littledifference in the percentage of the nonagricultural labor force with collective bargainingrights. (See app. I.)
Private Sector CoverageVaries by Industry whilePublic Sector CoverageVaries by State
Excludedgroups
22%
Bargainingcoverage
78%
Independent contractors7%
Small business employees5%
Supervisors9%
Domestic workers 0.3%Agricultural workers 0.5%

Page 7 GAO-02-835 Collective Bargaining
Figure 2: Comparison of Number of Workers with Collective Bargaining Rights withTotal Number of Workers, by Industry, February 2001
Source: GAO’s analysis of February 2001 CPS Supplement.
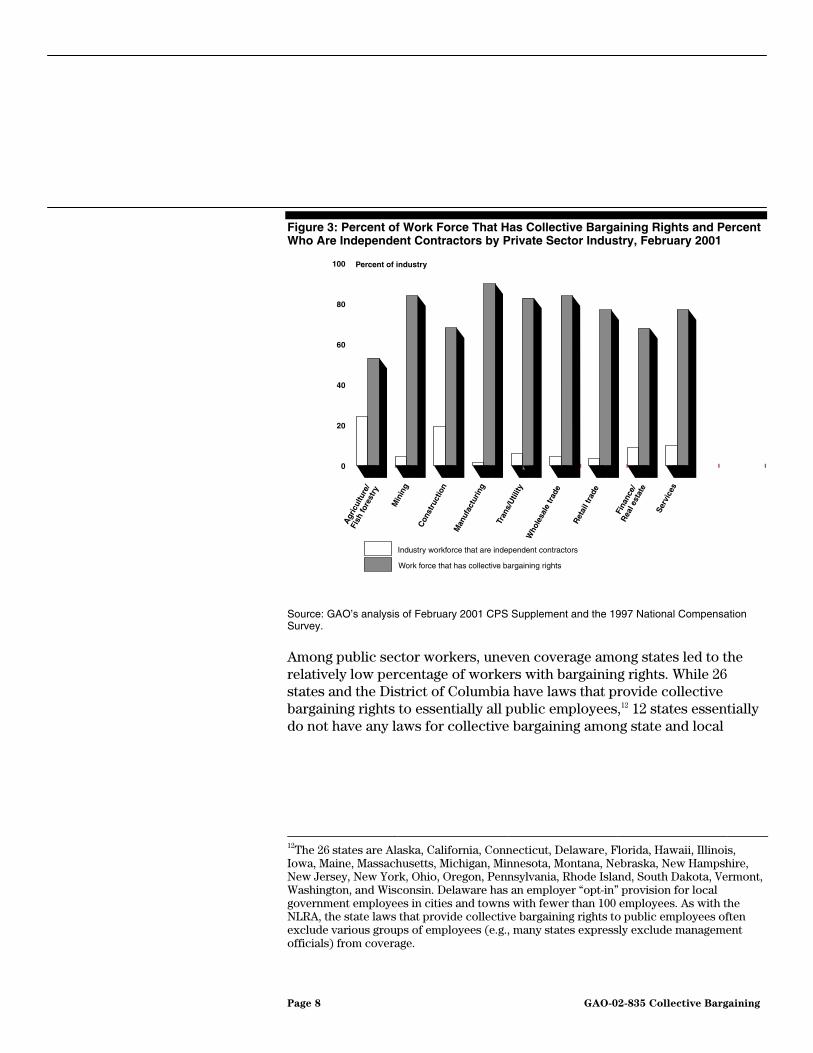
Coverage varied largely with the proportion of excluded workers acrosseach industry. However, in general, the industries with the lowestcoverage rates were also those with a greater proportion of independentcontractors. (See fig. 3.)
Total labor force in industry (in millions)
0
5
10
15
20
25
30
35
40
45
Agr
icul
ture
/
Fish
fore
stry
Min
ing
Con
stru
ctio
n
Man
ufac
turin
g
Tran
s/U
tility
Who
lesa
le tr
ade
Ret
ail t
rade
Rea
l est
ate
Serv
ices
Gov
ernm
ent
empl
oyee
s
Fina
nce/
Number of workers without collective bargaining rights
Number of workers with collective bargaining rights
Page 8 GAO-02-835 Collective Bargaining
Figure 3: Percent of Work Force That Has Collective Bargaining Rights and PercentWho Are Independent Contractors by Private Sector Industry, February 2001
Source: GAO’s analysis of February 2001 CPS Supplement and the 1997 National CompensationSurvey.
Among public sector workers, uneven coverage among states led to therelatively low percentage of workers with bargaining rights. While 26states and the District of Columbia have laws that provide collectivebargaining rights to essentially all public employees,12 12 states essentiallydo not have any laws for collective bargaining among state and local
12The 26 states are Alaska, California, Connecticut, Delaware, Florida, Hawaii, Illinois,Iowa, Maine, Massachusetts, Michigan, Minnesota, Montana, Nebraska, New Hampshire,New Jersey, New York, Ohio, Oregon, Pennsylvania, Rhode Island, South Dakota, Vermont,Washington, and Wisconsin. Delaware has an employer “opt-in” provision for localgovernment employees in cities and towns with fewer than 100 employees. As with theNLRA, the state laws that provide collective bargaining rights to public employees oftenexclude various groups of employees (e.g., many states expressly exclude managementofficials) from coverage.
Percent of industry
0
20
40
60
80
100
Work force that has collective bargaining rights
Industry workforce that are independent contractors
Agr
icul
ture
/
Fish
fore
stry
Min
ing
Con
stru
ctio
n
Man
ufac
turin
g
Tran
s/U
tility
Who
lesa
le tr
ade
Ret
ail t
rade
Rea
l est
ate
Serv
ices
Fina
nce/

Page 9 GAO-02-835 Collective Bargaining
employees.13 The remaining 12 states have laws that provide bargainingrights to specific groups of workers (e.g. state workers, teachers, orfirefighters) but not to all state and local government workers.14
Among workers with bargaining rights, most are covered by the federalNLRA. However, other federal, state, or local statutes cover some privatesector workers as well as those public workers who currently have rights.While some of these statutes provide broader rights than those availableunder the NLRA, other statutes offer substantially fewer rights than thoseprovided by the NLRA. Although we did not attempt to either catalog orassess the other bargaining statutes, we did outline some of their keydifferences.
Within the private sector, airline and railroad employees have somewhatdifferent collective bargaining rights than other workers. Airline andrailroad employees are covered by the federal Railway Labor Act,15 a lawthat predates the NLRA by 9 years. Among other differences, the RailwayLabor Act applies to “all subordinate officials,” thereby permitting manysupervisory employees to join in collective bargaining.
While agricultural workers are excluded from the NLRA, nine statesprovide these workers with bargaining rights. However, these statutes varyfrom the NLRA’s provisions. For example, in Arizona the state agriculturalstatute has different standards for bargaining unit determination than theNLRA. California also has different standards for bargaining unit
13Twelve states do not have collective bargaining laws for public employees. They areAlabama, Arizona, Arkansas, Colorado, Louisiana, Mississippi, New Mexico, NorthCarolina, South Carolina, Texas, Virginia, and West Virginia. In addition, Texas prohibitscollective bargaining for most groups of public employees. However, firefighters andpolice may bargain in jurisdictions with approval from a majority of voters.
14These states are Georgia, Indiana, Idaho, Kansas, Kentucky, Maryland, Missouri, Nevada,North Dakota, Oklahoma, Tennessee, and Wyoming. Three of these states, Indiana,Kentucky and Missouri, extend collective bargaining rights to certain public employeesthrough an executive order from the governor. Many public employees may be covered bylocal laws, for example, in Maryland they do not have a comprehensive law covering allpublic employees. All state employees are covered under state labor laws, but state statutescover local employees only in certain counties. Local governments in Maryland may havetheir own ordinances giving local public employees collective bargaining rights, but theseordinances do not exist in every county.
1545 U.S.C. 151-188. Employees covered by the Railway Labor Act are excluded from theprovisions of the NLRA. 29 U.S.C. 152(3).
Bargaining RightsConferred under OtherLaws Are Not Identical toThose under the NLRA

Page 10 GAO-02-835 Collective Bargaining
determination than the NLRA and allows agricultural workers to usesecondary boycotts,16 actions prohibited under the NLRA.
Within the public sector, where federal, state, and local governmentworkers rely on an array of federal, state, and local statutes for bargainingrights, most workers are prohibited from striking. Although some statesallow certain workers the right to strike for at least some employees,17
many states18 provide compulsory binding interest arbitration (a procedureunavailable under the NLRA that requires an arbitrator to resolvedifferences in the event of an unsettled dispute between the unionrepresenting the employees and the employer).
We estimate that about 32 million workers currently do not have anycollective bargaining rights. These workers include over 25 million privatesector workers—8.5 million independent contractors, 5.5 millionemployees of certain small businesses, 10.2 million managers andsupervisors (including 8.6 million first-line supervisors), 532,000 domesticworkers,19 and 357,000 agricultural workers. Those groups without rightsalso include over 6.9 million federal, state, and local governmentemployees. In general, these workers do not have bargaining rights underany federal or state statute.20
16A secondary boycott is an organized refusal to purchase the products of, do businesswith, or perform services for (such as deliver goods) a company that is doing business withanother company where the employees are on strike or in a labor dispute.
17According to the American Federation of State, County, and Municipal Employees, aunion that represents 1.3 million public employees, 11 states provide the right to strike tosome public employees.
18Twenty-one states and the District of Columbia have such provisions. In many cases,mandatory binding arbitration serves as a “quid pro quo” for the prohibition of strikes bypublic employees.
19These 532,000 domestic workers do not include an additional 126,000 domestic workerswho classify themselves as independent contractors.
20It is likely that some of these workers, particularly the employees of certain smallbusinesses, have bargaining rights under state labor relations statutes. Eighteen states havestate labor relations acts or “little Wagner Acts,” modeled after the federal NLRA, andalthough many exclude the same groups as under the NLRA, some do not expresslyexclude agricultural workers, supervisors, or independent contractors and only oneexcludes employees of small businesses. (See app. I.) Except for agricultural workers, wedid not have sufficient information to determine the number of workers affected by thesestatutes.
Over 32 MillionWorkers Do Not HaveCollective BargainingRights

Page 11 GAO-02-835 Collective Bargaining
About 7 percent (8.5 million) of all private sector workers classifiedthemselves as independent contractors21 in February 2001. The percentageof independent contractors in private sector industries varied widely. Forexample, for the construction sector this figure was 19 percent and for themanufacturing sector it was 1.5 percent. (See fig. 3.) Although the NLRAspecified that its provisions applied to employees,22 it was not until the1947 Taft-Hartley amendments that “independent contractors” wereexpressly excluded from the act. Traditionally, the Board and the SupremeCourt have looked at the factual circumstances underlying the relationshipbetween the worker and the employer to determine whether the worker isan independent contractor or an employee.23
Although the NLRA provides the Board with broad jurisdiction, theBoard’s jurisdiction does not extend to retail employers with annual dollarsales volumes less than $500,000 and many non-retail employers with salesvolumes less than $50,000. Since the standards were modified in 1958, theannual dollar sales volumes in the standards have remained unchanged.24
21Using the February 2001CPS Supplement, we first subtracted the sole proprietors or self-employeds—those people identifying themselves as self-employed but not an independentcontractor—from the labor force. For our group of independent contractors, we countedall persons who identified themselves as self-employed and as independent contractors orwho were wage/salary workers and independent contractors. Independent contractors aredefined as workers who typically have control and judgment over how contracted servicesare performed and, therefore, they decide the time and place the work is to be done, supplytheir own necessary tools and instruments, and have a risk of financial profit or loss. Theyalso typically perform work that requires a particular skill not ordinarily used in the courseof business.
22However, according to the act, this shall not include any individual employed as anagricultural laborer or in the domestic service of any family or person in his or her home orin any individual employed by his or her parent or spouse.
23To do this, the Board has considered factors such as a worker’s autonomy to performwork and where the work is being performed. See National Labor Relations Board v.
United Insurance Co. of America, 390 U.S. 254 (1968).
24Since 1950, the Board has held that its jurisdiction does not extend to labor disputesinvolving certain small businesses. Requiring a “pronounced impact” on interstatecommerce before it asserts federal jurisdiction, the Board set minimum standards forspecific types of employers, generally stated in terms of a yearly sales volume. In 1959,however, the Landrum-Griffin amendments to the NLRA upheld the Board’s interpretationof its jurisdictional thresholds, but limited such exclusions to the standards in effect as ofAugust 1, 1959. Our analysis extended only to those industries with a specified dollar salesvolume. (See app. I.)
About 7 Percent of PrivateWorkforce WereIndependent Contractors,Not Employees
About 5 Percent of PrivateSector Workers Employedby Firms Too Small forBoard Jurisdiction

Page 12 GAO-02-835 Collective Bargaining
We estimate in February 2001 that about 5 percent (5.5 million) of privatesector workers were employed in firms with dollar sales volumes belowthe Board’s jurisdictional reach. For most industries, the percentage ofemployees excluded under these standards is very small—less than1 percent for mining, construction, and manufacturing. However for retailtrade, the $500,000 sales limit excludes about 12 percent of all workers inthat industry (about 2.6 million workers). The standards also exclude11 percent of the workers in the finance/real estate sector (mainly realestate brokers) and 4 percent of service workers. (See app. I.)
We estimate that about 10.2 million25 (including 8.6 million first-linesupervisors) of 115 million private sector workers were either first-linesupervisors or higher-level managers in February 2001.26 This groupcomprised about 9 percent of the total private sector labor force. Althoughthe original NLRA, as enacted in 1935, was silent on the exclusion ofsupervisors and management officials, early Board rulings interpreted theNLRA as excluding managers from its protections. However, whethersupervisors—particularly the first-line supervisors (or the so-called“foremen”)—should be excluded as managerial officials was muchdebated in the years following the enactment of the NLRA in 1935.27 In1947, the Taft-Hartley amendments to the NLRA specifically excludedsupervisors from coverage of the NLRA.28 The Board and the courtscontinue to interpret the act as excluding managers.
25The 10.2 million estimate is based on 1997 NCS calculations on full-time employees. Tothe extent that part-time employees are also supervisors, the total number of employees inthis group is underestimated. In addition, some managers and supervisors had already beenexcluded when we corrected for employees in those firms deemed too small for Boardjurisdiction. We do not include them here to avoid double counting. (See app. I.)
26In keeping with the 1997 NCS definitions, we define first-line supervisor as one whodirects staff through face-to-face meetings and where performing the same work assubordinates is not the principal duty. Consistent with the NCS, we define second linesupervisors as one who directs staff through intermediate supervisors. See James Smith,Supervisory Duties and the National Compensation Survey, in Compensation andWorking Conditions, Spring 2000, and appendix I.
27The Supreme Court’s holding in Packard Motor Car Co. v. NLRB, 330 U.S. 485 (1947) thatgeneral foremen (supervisors and managers) were entitled as a class to bargaining rightsunder the NLRA served to spur the subsequent enactment of Taft-Hartley, whichspecifically excluded supervisors from coverage.
2829 U.S.C. 152(11).
Supervisors and ManagersAre the Largest Group ofEmployees withoutCollective BargainingRights

Page 13 GAO-02-835 Collective Bargaining
Domestic workers—“domestic servants” employed by any homeowner orresident of the home in which the services are rendered—have beenexpressly excluded from NLRA since 1935. Moreover, most if not all statesthat enacted labor relations acts similar to the NLRA expressly excludeddomestic workers.29 In February 2001, there were about 658,000 domesticworkers in private households. However, about 20 percent of theseworkers were classified as wage employees working as independentcontractors. Therefore, in our analysis, these workers were counted asindependent contractors, while the remaining 532,000 were considereddomestic workers.
In 1935, the NLRA excluded any individual employed as an “agriculturallaborer.”30 Due to the federal exclusion of agricultural laborers, nine stateshave either enacted a separate agricultural labor relations act (Arizona,California, Oregon, and Maine) or did not expressly exclude agriculturalworkers in a state labor relations act (Hawaii, Massachusetts, New Jersey,and Wisconsin), with one state (Kansas) in both categories. Thus,agricultural workers have obtained some collective bargaining rightsunder these state statutes. In February 2001, we estimate about 680,000agricultural workers whose primary job included “any task associated withrunning or manufacturing a farm.”31 Approximately 357,000 of theseworkers resided in a state that had some bargaining rights for agriculturalworkers. Thus, about one-half of all agricultural workers were withoutfederal or state bargaining rights.
29However, in California, the state labor code provides workers the right to organize intounions, and it has been held to apply to employees in a private household. See Annenberg
v. Southern California District Council of Laborers and its Affiliated Local 1184, 38 Cal.App. 3d 637 (1974). We did not incorporate this or other state exceptions into our domesticworker estimate.
30Subsequently, the definition of agricultural laborer was expanded to include not only cropworkers but also workers who work on a farm in practices incidental to farming, such aspacking produce for shipment from the farm. Because the number of workers matching thesecondary definition is not available using national survey data, we limited our analysis oflaborers to agricultural workers who work with crops and livestock. Thus, we may beoverestimating the percentage of agricultural workers who have collective bargainingrights.
31Our data are based on February 2001 employment levels. For most agriculturalcommodities, February represents the annual employment “trough.” Employment inagriculture fluctuates significantly over the year and, in 2001, had an annual monthlyaverage of about 745,000 individuals employed as agricultural laborers.
Over One-Half MillionEmployees Excluded asDomestic Workers
About 357,000 AgriculturalWorkers Excluded fromBargaining Rights

Page 14 GAO-02-835 Collective Bargaining
We estimate that about 6.9 million federal, state, and local governmentworkers out of about 20 million government workers did not havecollective bargaining rights as of February 2001. These include about900,000 federal employees who are not eligible to collectively bargaineither because they are considered management employees or becausethey work for a noncovered agency.32 They also include state and localpublic employees in the 12 states without bargaining rights, and those inthe 12 states where only some of the employees have rights. The other13 million workers have some collective bargaining rights.
Federal, state, and local government workers were excluded from theNLRA in 1935. For many federal employees, the Federal Service LaborManagement Relations Statute33 provides collective bargaining rights,specifically for employees of most executive branch agencies as well asemployees of the Library of Congress and the Government Printing Office.In addition, all but 12 states have some collective bargaining rights for atleast one group of government worker, and 26 states as well as the Districtof Columbia have collective bargaining procedures that cover most publicemployees.
Our analysis of available data suggests that the proportion of the laborforce with statutory collective bargaining rights has likely increased since1959. Over this period, no major groups of workers have lost collectivebargaining rights, and about 14.5 million workers have gained bargainingrights through the enactment of federal, state, and local laws. In addition,the proportion of the labor force employed in small businesses that areexcluded from NLRA’s jurisdiction has likely declined, because thestandard for determining NLRA’s jurisdiction dollar sales volume has notbeen corrected for inflation. While some excluded groups like independentcontractors, managers, and supervisors may have increased in size, it is
32Among the major agencies not covered include: the Federal Bureau of Investigation, theCentral Intelligence Agency, the National Security Agency, the Tennessee Valley Authority,and the U.S. Secret Service. 5 U.S.C. 7103(a)(3).
335 U.S.C. 7101.
About 6.9 Million PublicEmployees Do Not HaveBargaining Rights
Percentage of TotalLabor Force withBargaining RightsLikely IncreasedSince 1959
Page 15 GAO-02-835 Collective Bargaining
unlikely that their growth was sufficient to offset the gains in the numberof workers obtaining rights.34
The major categories of workers excluded from the NLRA—managers andsupervisors, independent contractors, employees of small businessesaffected by the Board’s jurisdiction standards, agricultural workers,domestic workers, government workers, and workers covered by theRailway Labor Act—were all established by 1959. The original 1935 actexcluded agricultural workers, domestic workers, government workers,and workers covered by the Railway Labor Act. Subsequently, supervisorsand independent contractors were excluded in 1947, and between 1950and 1959, the Board set size standards for determining which smallbusinesses would be under its jurisdiction based on annual dollar salesvolume.
Since 1959, federal, state, and local laws have extended rights to some ofthe groups excluded under the NLRA’s coverage. Federal laws allowedmany federal workers bargaining rights, and added nonprofit health careworkers to those covered by the NLRA. State and local statutes providedbargaining rights to many state and local government workers, as well asto many agricultural workers. We estimate that about 14.5 million workersin today’s workforce have bargaining rights as a result of the federal, state,and local laws enacted since 1959. (See table 1.)
34We chose 1959 because it was the last year when major comprehensive amendments weremade to the NLRA and when the Board jurisdiction standards were last revised. However,it may be that this analysis is sensitive to the comparison dates used. As one expert haspointed out, while the percentage of workers with bargaining rights has likely increasedbetween 1959 and 2001, this might not be true, for example, for the period 1981 to 2001. By1981, nonprofit health care workers and some agricultural workers had already gainedrights, and major increases in public sector rights had also occurred. This would leave lessgrowth to balance out any increase in excluded groups like independent contractors orsupervisors. The early 1980s are considered an important period by some industrial expertsbecause it heralded the economic restructuring of a number of key industries and a shift inthe industrial relations policies of many employers. However, data were not available toaddress this concern.
About 14.5 Million WorkersGained Bargaining RightsSince Last Major Exclusionin 1959

Page 16 GAO-02-835 Collective Bargaining
Table 1: Number of Workers Receiving Collective Bargaining Rights from 1959through February 2001
aA few states did confer collective bargaining rights to certain groups of public employees prior to1959.
bPostal Reorganization Act, 39 U.S.C. 1001, provided collective bargaining rights to postal workers.
Source: GAO’s analysis, analysis of the February 2001 CPS Supplement and Draft ComprehensiveTransformation Plan, U.S. Postal Service, October 1, 2001.
Our analysis of available data on the key groups of employees excludedunder the NLRA suggests that the extent of collective bargaining rightsamong the total civilian U.S. workforce has increased since 1959. Thenumber and proportion of public employees and supervisors withbargaining rights increased over this period, and the effects of inflation onthe Board’s small business jurisdictional exclusions have likely reducedthe number of small business employees excluded from the act.35 Theproportion of the labor force with bargaining rights has increased evenwith the conservative assumptions that the percentage of the labor forcein businesses excluded from the Board’s jurisdiction has not changedsince 1959, not correcting for the extension of bargaining rights tononprofit health care workers. It also assumes that the proportion of thelabor force excluded as independent contractors, managers, andsupervisors had more than doubled over this period. (See table 2.)
35Regarding trends in private sector bargaining rights alone, increases in workers withrights in agriculture and health care and the effects of inflation on the Board’s smallbusiness jurisdiction standards must be counterbalanced by increases in the percentage ofthe workforce that are independent contractors, supervisors, or managers. Datalimitations, however, preclude a definitive answer.
Years bargainingrights received Worker group affected
Number ofworkers
1959-2001 State and local government workers About 10,000,000a
1978 Federal workers 1,500,0001970b Postal workers 700,0001972-1997 Agricultural workers 360,0001974 Nonprofit health care workers 1,900,000Total About 14,500,000
Net Increase Likely since1959, Even with Growth inSome Major ExcludedGroups

Page 17 GAO-02-835 Collective Bargaining
Table 2: Net Effects of Changes in Excluded Groups on Percent of the Labor Force That Has Bargaining Rights, 1959 and2001
Excluded group Trend
Approximatepercentage point
change in labor forcewith bargaining rights
since 1959Public employees About 12.2 million public employees have gained bargaining rights since 1959.a
+9Employees of smallbusinesses excludedunder Board jurisdictionstandards
The number of workers affected by the Board's small business jurisdictionexclusion was about 4 percent of the total civilian labor force in 2001. Theannual sales volumes required by the minimum standards for the Board’sjurisdiction over a business have not been adjusted for inflation since 1959. Forexample, the current Board standard for retail employers of $500,000 annualsales would be about $3 million in 2001, if adjusted for inflation. In 2001, aboutone-third of all retail employees (over 7 million) worked for firms with annualsales under $3 million, while only about 12 percent (about 2.6 million) work forfirms with annual sales less than $500,000.b We assume no change in thepercentage of the labor force excluded under these standards between 1959and 2001, a conservative assumption.
0
Independent contractors Comparable data on independent contractors for 1959 and 2001 are notavailable.c We assume, conservatively, that the 6.5 percent of the 2001 totalcivilian labor force who were independent contractors had more than doubledsince 1959, increasing 3.5 percentage points.
-3.5
Managers and supervisors Although some evidence suggests that private sector managers andsupervisors may have grown in number and as a share of the total civilian laborforce over this period, little data are available on these groups for 1959 and2001.d We assume that the 7.5 percent of the 2001 total civilian labor force whowere managers and supervisors had more than doubled since 1959, increasing4 percentage points.
-4
Agricultural workers anddomestic workers
Domestic workers were a small proportion of the labor force in 1959 and 2001.Virtually no agricultural workers had statutory bargaining rights in 1959 whileabout half of those workers had such rights in 2001. This would increase thepercentage of the total labor force in 2001 that had bargaining rights. Weassume, conservatively, that there was no change in the relative size of eithergroup as a percent of the labor force since 1959.
0
Net effect since 1959 +1.5aA few states did confer bargaining rights to certain groups of public employees prior to 1959. Dataare unavailable to estimate the number of public employees in these states with rights prior to 1959.The percentage of the nonfarm civilian labor force that the public employees in these statescomprised in 2001 was 0.5 percent, and we apply this same percentage to 1959.
bIt is possible that industry shifts in the economy towards sectors where businesses are typically ofsmaller size could have led to a relative increase in the number of employees below the dollar limitand thus an increase in the number of employees without rights. Although, on balance, the sixfoldincrease in inflation since 1959 more than likely resulted in a net increase in the number ofemployees in smaller businesses with bargaining rights; we assumed no change in the relative size ofthis exclusion between 1959 and 2001.
cHowever, data on independent contractors suggests that this group exhibited no growth between1995 and 2001. U.S. General Accounting Office, Contingent Workers: Income and Benefits LagBehind Those in Rest of Workforce, GAO-00-76, June 30, 2000, Washington, D.C.

Page 18 GAO-02-835 Collective Bargaining
dAvailable evidence suggests that while managers and supervisors have increased significantly as apercentage of the labor force, they have not increased at the levels necessary to reduce the percentof the labor force that has collective bargaining rights. A recent Department of Labor study found thatthe percentage of supervisors in the services sector increased from 8.6 to 12.8 percent between 1969and 1999, about a 67 percent increase. In retail trade, the percentage of supervisors increased from7.5 to 12.0 percent between 1959 and 1999, a 63 percent increase. See U.S. Department of Labor,The “New Economy” and Its Impact on Executive, Administrative and Professional Exemptions to theFair Labor Standards Act (January 2001).
Source: GAO’s analysis of Bureau of Labor Statistics National Employment, Hours and Earningsdata, 1959 and 2001.
Under two recent Supreme Court rulings, some workers currently withbargaining rights may either lose bargaining rights or have their rightsdiminished. The Kentucky River ruling affected the test that the Boarduses to determine supervisory status, a status that can determine coverageof the act and, therefore, bargaining rights. The Court ruled that theBoard’s test was inconsistent with the NLRA in that it introduced acategorical restriction on the term “independent judgment,” a key conceptin the statutory definition of a supervisor. Because any future tests used bythe Board to determine whether or not employees are supervisors shouldbe less categorical and more fact-specific, the Kentucky River decisioncould have the effect of increasing the number of employees consideredsupervisory and thus excluded from coverage under the act. Given that theBoard has not yet devised alternative tests in response to the opinion, weare unable to estimate the number of employees who could potentially bedeemed supervisors as a result of this decision. In the Hoffman Plastic
case, the Supreme Court ruled that undocumented alien workers were noteligible for back pay under the NLRA. This case did not excludeundocumented alien workers from coverage of the NLRA; however,because back pay is one of the major remedies available for a violation,this decision diminished the legal bargaining rights available to theseworkers under the act. We estimate that this group of workers potentiallyaffected by this decision numbers about 5.5 million.
In the Kentucky River case, the Court ruled that the Board should reviseits test for determining supervisory status, a status that can determinecoverage under the act and, therefore, bargaining rights, for certain groupsof employees, in this instance, charge nurses. Specifically, the casefocused on the portion of this test that examines whether the nurses’exercise of supervisory authority is not merely routine, but requires theuse of “independent judgment.” A previous line of Board decisions statedthat employees did not use independent judgment when they exercised“ordinary professional or technical judgment in directing less-skilledemployees to deliver services in accordance with employer-specified
Two Recent SupremeCourt Cases CouldAffect Gains inCoverage over theLast 40 Years
Kentucky River Requires aDetermination ofSupervisory Status on aCase-by-Case Basis

Page 19 GAO-02-835 Collective Bargaining
standards” and thus were not supervisors excluded by the act’s coverage.The Board reasoned, in this line of cases, that judgment informed byprofessional or technical training or experience is not “independent,” andthus, the employee should not be considered to be a supervisor.
The Court rejected the Board’s test in determining supervisory status andheld that for employees involved, the question of supervisory status turnson whether the employee is exercising independent judgment. Thisdetermination, according to the Court, must be based solely on the degreeof judgment exercised by the employee, not the type of judgment, that is,professional or technical.36 For this group of employees, the Court wouldnot accept an automatic or categorical finding that they are notsupervisors; rather, on a case-by-case basis, the Board must focus solelyon the degree of independent judgment that the employee exercises.37
Because any future tests used by the Board to determine whether or notcertain employees are supervisors should be less categorical and morefact-dependent, the Kentucky River decision could have the effect ofincreasing the number of employees considered supervisory and thusexcluded from coverage under the act.38 However, given the uncertainty ofthe Board’s response to the opinion and the fact-intensive nature of thelegal tests involved, we are unable to estimate the number of employeeswho could potentially be deemed supervisors as a result of the Kentucky
River case.
36While the Court clearly rejected the Board’s approach in these cases, the Court pointedout that it falls within the Board’s discretion to determine, within reason, what scope ofdiscretion qualifies as independent so as to deem the employee a supervisor.
37In considering the potential reach of this decision, it is important to note that the decisionrequires a change in how the Board will determine supervisory status for that group ofemployees who exercise “…ordinary professional or technical judgment in directingless-skilled employees to deliver services in accordance with employer-specifiedstandards.”
38In a recent case, the Board applied a revised test, in accordance with Kentucky River, todetermine supervisory status of certain tugboat pilots. Reversing an earlier decision, theBoard found that these pilots exercised independent judgment in carrying out supervisoryfunctions and thus were supervisors under the act. See American Commercial Barge Line
Company et al., 337 N.L.R.B. 168 (2002).
Page 20 GAO-02-835 Collective Bargaining
The Supreme Court ruling in the Hoffman Plastic case reversed a Boarddecision awarding back pay, a key remedy under the NLRA, toundocumented alien workers.39 The case involved a Board decisionconcerning an employer’s termination of an undocumented alien workerto rid itself of known union supporters, a violation of the act. The Boardhad ruled that the employer should award back pay and conditionalreinstatement40 and, in doing so, applied the protections and remedies ofthe act to undocumented alien workers in the same manner as it does toother workers. The Supreme Court reversed this decision and ruled thatback pay remedies cannot be awarded to an undocumented alien becausesuch awards are in conflict with the Immigration Reform and Control Actof 1986 (IRCA), which makes it unlawful for employees to use fraudulentdocuments to establish employment.
To remedy a violation of the NLRA, the Board had traditionally found thatunlawfully discharged employees were entitled to unconditionalreinstatement with back pay to make them whole for any losses they mayhave suffered because of the unlawful layoffs. The Board maintained thatthe congressional objective of deterring unauthorized immigrationembodied in IRCA and the labor law protections of the NLRA arecomplementary. Specifically, according to the Board, coverage ofundocumented workers by the NLRA furthers IRCA’s goals by helping toboth ensure reasonable working conditions by decreasing competitionfrom illegal aliens willing to accept substandard wages and employmentconditions and to eliminate economic advantages—and thus incentives—to employers for hiring undocumented workers in preference to Americancitizens or alien employees working lawfully. The Board, therefore,concluded that awarding back pay effectuates the policies of both IRCAand NLRA.
While the Court acknowledged that the NLRA vests the Board with broaddiscretion in choosing an appropriate remedy where it has substantiatedan unfair labor practice, the Court concluded that awarding back pay to
39An undocumented alien worker is a non-U.S. citizen present in the United States inviolation of the U.S. immigration laws, e.g., a person who entered the United States withoutbeing inspected by an Immigration officer or a non-U.S. citizen who entered legally butoverstays or violates his or her immigration status.
40The Board stated that the employer’s reinstatement of the discharged workers isdependent upon the employer demonstrating appropriate documentation of eligibility forU.S. employment as required under the Immigration Reform and Control Act of 1986. SeeA.P.R.A. Fuel Oil Buyers Group, Inc., 320 N.L.R.B. 408 (1995).
About 5.5 MillionUndocumented AlienWorkers Have RightsDiminished

Page 21 GAO-02-835 Collective Bargaining
undocumented alien workers lies outside the limits of the Board’sdiscretion. Although the Court’s decision reinforces the goals of federalimmigration policy, it diminishes the legal protections available toundocumented alien immigrant workers under the NLRA. Back pay is animportant remedy under the act because it provides an incentive to reportlaw-violating behavior and imposes financial penalties on an employer andjob protection for the workers.
Adjusting year 2000 U.S. Census data on the foreign-born population, weestimate a total of 8.7 million undocumented immigrants, of which7.1 million are between the ages of 18 and 65.41 Applying an estimate that77 percent of private sector workers have collective bargaining rightsunder the NLRA, we calculated that approximately 5.5 millionunauthorized immigrants are in the workforce and have collectivebargaining rights under the NLRA.42 We were unable, however, todisaggregate this number by industry.
As agreed with office, unless you publicly announce the contents of thisreport earlier, we plan no further distribution until 30 days from the reportdate. At that time we will send copies of this report to the chairman,members and general counsel of the National Labor Relations Board, theSecretary of Labor, and other interested parties. In addition, the report willbe available at no charge on the GAO Web site at http://www.gao.gov.
41This estimate also includes persons in “quasi-legal” status, persons who cannot beconclusively determined as being in the country legally or illegally. (See app. I.)
42We derived our 77-percent estimate for NLRA coverage from our total private sectorcoverage estimate of 78 percent and correcting for coverage under the Railway Labor Act.(See app. I for further details.)

Page 22 GAO-02-835 Collective Bargaining
If you or your staff should have any questions, please call me at(202) 512-9889. The major contributors to this report are Charles AJeszeck, Assistant Director, who can be reached at (202) 512-7036;Nancy Peters, Analyst in Charge; Kara Kramer, Analyst; and Tom Beall,Paula Bonin, Mark Ramage, and Joan Vogel.
Robert E. RobertsonDirector, Education, Workforce and Income Security Issues

Appendix I: Methodology
Page 23 GAO-02-835 Collective Bargaining
Our methodology consists of a review of key statutes, National LaborRelations Board and U.S. Supreme Court decisions, a statistical analysis ofseveral national representative data sets, and discussions with Board staffand officials and organizations that are active and familiar with bargainingrights outside of the National Labor Relations Act of 1935 (NLRA). Theorganizing concept for the review of key statutes and the statisticalanalysis was the NLRA (or the Wagner Act). We reviewed the original actand subsequent amendments, and Supreme Court and Board decisions toidentify those segments of the labor force that were excluded fromcoverage under the act. We then conducted a review of other relevantfederal, state, and local laws to identify those excluded workers whoobtained bargaining rights from other statutes. We consulted with Boardstaff and representatives of several outside organizations for theirtechnical advice. Once we completed this review, we used a variety ofnationally representative data sets to construct a quantitative estimate.Using an estimate of the workforce in February 2001, we subtracted thosegroups of workers identified as excluded from the NLRA and then addedback those groups of workers who obtained bargaining rights from otherlaws.
The NLRA is the central law governing private sector labor managementrelations in the United States. We reviewed the NLRA and subsequentamendments to identify the key groups of employees who were excludedfrom coverage under the act. We also reviewed pertinent Supreme Courtand Board decisions affecting the act’s scope of coverage. In particular weanalyzed Kentucky River and Hoffman Plastic Supreme Court decisions.We identified and reviewed those other federal state and local laws thatprovided certain bargaining rights to employees excluded from coverageunder the NLRA. These include the Railway Labor Act and the FederalService Labor-Management Relations Statute.
An important issue in this analysis is the definition of bargaining rights.There is variation in the rights provided under the NLRA, the RailwayLabor Act and the many state and local laws governing collectivebargaining. These differences span a host of issues, from the proceduresgoverning representation elections, the right to strike, and bindingarbitration, to the scope of bargaining and the remedies for violations.Although the right to strike could be considered part of a “core definitionof bargaining rights,” we based our definition on the concepts of unionrecognition—permitting individuals to join together and form unions andthe requirement that employers recognize employee organizations—and
Appendix I: Methodology
Overall Approach
Legal Review
Definition ofBargaining Rights

Appendix I: Methodology
Page 24 GAO-02-835 Collective Bargaining
“good faith bargaining”—bargaining with intent to reach an agreement.1
These are key elements of the rights granted under the NLRA.2
Different definitions of collective bargaining rights would likely lead todifferent empirical estimates of the percentage of the labor force that hasbargaining rights. However, because of the predominance of the NLRA andthe Railway Labor Act in the private sector, most of the differences amonglaws occur in the public sector. Thus, for many alternative definitions, forexample, one based on the right to strike, the change in the percent of thelabor force with rights would be largely limited to changes in the numberof public employees who had this right.
To develop our quantitative estimates of the number of workers withcollective bargaining rights, we started with an estimate of the total laborforce and then subtracted those groups of workers we identified asexcluded from coverage under the NLRA. We then added back thosegroups of excluded workers who obtained bargaining rights from otherstatutes.
For our quantitative estimates, we relied on the February 2001 CurrentPopulation Survey (CPS) Supplement collected by the U.S. Bureau of theCensus. We used the CPS to estimate the total percentage of workers inthe civilian labor force with collective bargaining rights on their primaryjobs because it is a nationally representative dataset that also hasinformation available for independent contractors, a key group excludedfrom coverage under the NLRA. Using the CPS, we adjusted our estimatesfor six key groups excluded from coverage under the NLRA:(1) supervisors and managers; (2) independent contractors; (3) employeesof certain small businesses; (4); domestic workers; (5) agriculturalworkers; and (6) federal, state, and local government employees. We didnot attempt to construct estimates for the other groups excluded underthe NLRA, for example, religious organization employees and studentemployees, because reliable data were not readily available. Because these
1This definition would exclude laws that only provide that parties “meet and confer.”
2This report does not assess the adequacy of the rights granted under the NLRA, in terms offostering collective bargaining nor to how it compares with any international standards oncollective bargaining or workers rights, nor the degree to which those rights are protected.
WorkforceEstimations andAnalysis

Appendix I: Methodology
Page 25 GAO-02-835 Collective Bargaining
other groups are small, we believe that their exclusion from our estimateswould have only a small effect.3
Using CPS data, we first subtracted out sole proprietors or the “self-employeds”4—those persons identifying themselves as self-employed butnot independent contractors—from our labor force estimates.Independent contractors are all those who were identified as independentcontractors, consultants, and freelance workers in the supplement,regardless of whether they were identified as wage and salary workers orself-employed in the responses to basic CPS labor force status questions.For our group of independent contractors, we added together thosepersons identifying themselves as being self-employed and independentcontractors and those who identified themselves as wage/salary workersand independent contractors and subtracted this total from the totalcivilian labor force. The CPS defines independent contractors as workerswho typically have control and judgment over how contracted services areperformed and, therefore, they decide the time and place the work is done,supply their own necessary tools and instruments, and have a risk offinancial profit or loss. They also typically perform work that requires aparticular skill not ordinarily used in the course of business. About88 percent of independent contractors were identified as self-employed inthe main questionnaire, while 12 percent were identified as wage andsalary workers. Conversely, about half of the self-employed wereidentified as independent contractors. Workers identified as self-employedin the basic CPS are those workers who obtain customers on their own toprovide a product or service.
3The excluded groups we did not estimate include religious organization employees,employees of international organizations, children or spouses employed by parents orspouses, and student employees. Not estimating these excluded groups will tend tooverstate the percentage of the labor force with bargaining rights. Employees covered bythe Railway Labor Act and employees of nonprofit healthcare providers and educationalinstitutions and are included in our estimates.
4The sequencing of our analysis was an important consideration so that we could avoidpotential double counting and potential overestimation of workers in particular excludedgroups. We first subtracted the self-employeds and independent contractors out of the totallabor force. We then calculated the number of employees excluded by the Board’sjurisdictional standards on business size, then managers and supervisors and other groups.
Self-employed Persons andIndependent Contractors

Appendix I: Methodology
Page 26 GAO-02-835 Collective Bargaining
Although the Board has broad jurisdiction under the NLRA, it typicallydeclines jurisdiction over certain small employers with annual dollar salesvolumes less than a specified level as well as employers who meet certainother criteria. (See table 3.) However, the CPS does not identify workersby firm size, where size is determined by annual dollar sales volume of thefirm. To identify those employees who would be excluded under theBoard’s jurisdictional standards, we applied these sales volume standardsto 1997 data we obtained from the Small Business Administration (SBA).SBA periodically requests that the Census calculate the number ofemployees employed by firms with specific dollar sales volumes, byindustry classification. We chose the SBA data because this was the onlydataset available that categorically separates each industry by volume ofsales receipt. We chose data for 1997 because that was the most recentdata available that still used the Standard Industrial Classification (SIC)code system of industry classification and thus would be comparable withthe classification used in the CPS. The SBA data identifies the number ofworkers by firms’ annual dollar sales volumes so that we were able tocalculate the number of employees with and without bargaining rightsaccording to the Board’s jurisdictional standards. We estimated theexclusionary effect of the Board’s small business jurisdictional standardsby calculating a percent of employees in each industry who would beemployed by a firm with annual dollar sales below the Board’s standardand thus exempt under the Board’s guidelines. We then applied theseindustry exclusion percentages to the February 2001 CPS Supplementestimates of the total number of workers in each industry classification,yielding a number of excluded workers for each industry classification.5
(See fig. 4.) Once we estimated these excluded industry totals, wesubtracted them from the CPS labor force total. Summing all of theindustry totals provides an estimate of the total number of employeeseffectively excluded from NLRA coverage by the Board’s jurisdictional
5We applied the percentages derived from the 1997 SBA data to our 2001 CPS industryworkforce estimates. To the extent that the distribution of small businesses acrossindustries has changed demonstrably over the time interval, we may not have an accurateestimate of the number of workers excluded by these standards in 2001. However, SBAofficials believe that the industrial distribution of small businesses changes very slowlyover time so this should not be a major problem.
Employees of SmallBusinesses with AnnualDollar Sales VolumesBelow the BoardJurisdictional LimitStandards

Appendix I: Methodology
Page 27 GAO-02-835 Collective Bargaining
standards.6 We did not attempt to estimate those Board jurisdictionalstandards that did not specify an annual dollar sales volume.
Table 3: Minimum Annual Dollar Sales Volumes for Coverage under NLRA
Industry/economic activity Minimum annual sales volume for NLRA jurisdictionNonretail industries $50,000Retail $500,000Office buildings and shopping centers $100,000Public utilities $250,000Newspapers $200,000Radio and TV stations $100,000Hotels, motels, apartments, and condominiums $500,000National defense enterprises Substantial impact on national defense, irrespective of whether
other standards are met.Employer association If any member meets other jurisdictional standards or the
combined operations of all members meet any such standard.Single employer engaged in multiple enterprises Overall operations meet any standard.Instrumentalities links and channels of interstate commerce $50,000Other transit systemsa $250,000Restaurants and country clubs $500,000
aLocal and suburban transit, interurban highway passenger transportation, and transportation utilities.The Board also extends NLRA jurisdiction to secondary employers involved in labor disputes.
Source: Hardin, P. (1992). Developing Labor Law: The Board, the Courts, and the National LaborRelations Act. Bureau of National Affairs.
6The total number of employees excluded under the Board’s jurisdictional standards alsoincludes supervisors and managers in those firms; these employees would still be excludedfrom NLRA coverage even if there were no Board jurisdictional limits. Assuming that thepercent of supervisors in these small businesses was the same as our estimate for the laborforce as a whole, about 9 percent or about 500,000 employees in these excluded smallbusinesses would be excluded under NLRA’s supervisor/manager exclusion.

Appendix I: Methodology
Page 28 GAO-02-835 Collective Bargaining
Figure 4: Percentage of Workers Affected by the Board’s Dollar Sales VolumeStandards, by Industry, February 2001
Note: The Agriculture/Fish/Forestry, Mining, Manufacturing, and Wholesale Trade industries all hadless than 1 percent of their workers excluded by the Board’s jurisdictional standards. The numbers inthe chart refer to the estimated number of workers affected by the Board’s jurisdictional standards inFebruary 2001.
Source: GAO’s analysis of February 2001 CPS Supplement, 2000 Economic Census, and the 1997NCS.
The NLRA also excludes managers and supervisors from coverage. Toestimate the percentage of managers and supervisors by industry, we useddata from the 1997 Bureau of Labor Statistics’ National Compensation
Supervisors/Managers
Percent of industry work force
0
2
4
6
8
10
12
14
Con
stru
ctio
n
Tran
s/U
tility
Ret
ail t
rade
Serv
ices
Fina
nce/
Rea
l est
ate
Indu
stry
tota
l
80,862122,491
2,652,123
1,594,191
988,854
115,024,759

Appendix I: Methodology
Page 29 GAO-02-835 Collective Bargaining
Survey (NCS).7 The NCS provides recent nationally representativeemployer-reported data on job duties at the establishment level, permittingthe estimation of the number of jobs in a particular industry that aresupervisory or managerial in nature. Among the information collected inthe job survey is a ranking or leveling factor measuring supervisory duties.This factor is designed to account for the additional responsibilities ofsupervisors and to indicate the hierarchical level of the positioning of theorganization. Using this generic leveling factor, jobs are classifiedaccording to their supervisory duties. (See table 4.)
.
7BLS collects data for the NCS from more than 16,000 establishments, weighted torepresent more than 335,000 establishments employing almost 67 million workers. When anestablishment is first surveyed, specific jobs are selected through a sampling procedureand then classified to an appropriate occupation. The work level of the particular job isestablished by assessing the duties and responsibilities of the job according to the survey’snine generic leveling factors: (1) knowledge, (2) supervision received, (3) guidelines,(4) complexity, (5) scope and effect, (6) personal contacts, (7) purpose of contacts,(8) physical demands, and (9) work environment. Each factor contains a number of levels,and every level has an associated description and point value. See James Smith,Supervisory Duties and the National Compensation Survey, Compensation and WorkingConditions, Spring 2000.

Appendix I: Methodology
Page 30 GAO-02-835 Collective Bargaining
Table 4: Definitions of Supervisory Leveling Factors, 1997 NCS
Level DefinitionTeam leader, group leader,or lead workera
Employee sets pace of work for the group and shows otherworkers in the group how to perform assigned tasks. He orshe performs the same work as the group in addition tolead duties.
First line supervisor Directs staff through face-to-face meetings. Organizationalstructure is not complex, and internal and administrativeprocedures are simple. Performing the same work assubordinates is not the principal duty.
Second line supervisor Directs staff through intermediate supervisors. Internalprocedures and administrative controls are formal.Organization structure is complex and is divided intosubordinate groups that may differ from each other as tosubject matter and function.
Third line supervisor Directs staff through two or more subordinate supervisorylevels with several subdivisions at each level. Programsare usually interlocked on a direct and continuing basiswith other organization segments, requiring constantattention to extensive formal coordination, clearances, andprocedural controls.
Note: An additional leveling factor is no supervisory responsibilities. This category would include lineworkers.
aTeam leaders, group leaders, or lead workers are considered in the NCS as representingnonsupervisory positions. Based on the NCS, there are approximately 3.4 million private sector full-time employees who would fall into the “team leader” category, including 1.7 million team leaders inprofessional and technical occupations. Team leaders include employees in professional andtechnical occupations who may exercise considerable independent judgment. Professional andtechnical occupations have a much higher percentage of team leaders than first line supervisors;examples of these occupations would include registered and licensed practical nurses, computersystems analysts, and computer scientists.
Source: James Smith, Supervisory Duties and the National Compensation Survey, Compensationand Working Conditions, Spring 2000.
We obtained NCS-based estimates of the supervisory level percentages forwage and salary employees with full-time status by industry. We thenapplied these percentages to the CPS full-time workforce estimates byindustry to estimate the number of full-time managerial and supervisoryemployees. We defined supervisors as first-line supervisors and managersas second-line and third-line supervisors.
We assume the industry percentage of supervisors applies to all firms in anindustry regardless of size. To avoid double counting, we applied the NCSindustry level supervisor percentages to the CPS total labor force estimateof full-time wage and salary workers by industry net of the small business

Appendix I: Methodology
Page 31 GAO-02-835 Collective Bargaining
exclusion.8 To calculate the percentage of workers excluded as managersand supervisors, we divided the total number of full-time supervisors bythe total number of private sector employees. To the extent that managersand supervisors are part-time employees, we underestimated the totalnumber of employees in that category, although we believe that thisnumber is small.
The NCS, while it provides reasonable data to estimate the number ofsupervisors excluded under the NLRA, has several limitations. The NCSdata used in this report were collected in 1996 and thus may notcompletely reflect the hierarchical structure of establishments in 2001. Inaddition, the NCS data are based on a description of jobs, and whilereasonable conceptually, it is not strictly comparable with our worker-based estimates from the CPS. In addition, there were certain occupationsthat could not be leveled (e.g., musicians), and there are some smallgroups of jobs that were restricted to a certain level (e.g., personnelmanagers were restricted to supervisory duties of the first tier or higher).However, we believe that these limitations are probably not large enoughto have a significant effect on our estimate.
The NLRA excludes coverage of domestic workers. Using the February2001 CPS, we estimated the number of domestic workers to be excludedby first focusing on the personal service/private household (SIC 761).Within that SIC, we then defined domestic workers as employees in thefollowing Standard Occupational Classification (SOC) codes:laundry/ironers: 403, cooks 404, child-care providers 406, andcleaner/servant/housekeeper 407. We summed the total number ofemployees in these SOC codes to estimate the number of those excludedin this category and then subtracted them from the CPS total labor force.9
Using the U.S. Department of Agriculture (USDA) definition for “hiredhands,” we estimated all excluded agricultural workers from the CPS
8The Railway Labor Act has a different definition of supervisor than the NLRA. For thoseindustries covered by the Railway Labor Act, we defined supervisors as second-levelsupervisors and managers as third-level supervisors.
9Because of sampling limitations, we did not correct our estimated number of domesticworkers by subtracting those domestic workers, for example, those in California, whomight have rights under other laws. Making such a correction would slightly increase thepercentage of the labor force that has collective bargaining rights.
Domestic Workers
Agricultural Workers

Appendix I: Methodology
Page 32 GAO-02-835 Collective Bargaining
estimates for agricultural wage and salary workers.10 USDA defines hiredhands as SOC 475 for managers, farms, excluding horticultural; 476 formanagers, horticultural specialty farms; 477 for supervisors, farm workers;479 for general farm workers; and 484 for general nursery workers. Weused these same SOC codes as a definition to exclude agricultural workersfrom the workforce in the CPS. Because nine states have separate lawsthat give agricultural laborers bargaining rights with either (1) anagricultural labor act11 or (2) private employer labor relation acts withoutexclusion of agricultural workers,12 we added the estimates of agriculturalworkers from these states back into the total estimate to account for stateand local laws. The estimated number of total agricultural workers in theCPS is likely low because the CPS tends to undercount agriculturalworkers and February is often the low employment month for many crops.It is unclear how these factors affect our estimate of the number ofagricultural workers with collective bargaining rights.
Although the NLRA excludes public employees from coverage, manypublic employees have rights under other laws.13 To estimate the numberof state and local public employees with rights, we used data from the
10USDA conducted its research using the CPS as a basis to define agricultural workers andalso uses the National Agricultural Statistical Survey to estimate and describe thispopulation. We chose USDA’s definition because it is derived from a 12-month data filingmethod to calculate the number of agricultural workers in the United States so that wewould be able to separate the number of agricultural workers in February to correspondwith our data. See J. Runyan, USDA, (2001), which also includes annual demographic andgeographic averages of these workers.
11These states are Arizona, California, Oregon, Kansas, and Maine.
12These states are Hawaii, Massachusetts, New Jersey, Wisconsin, and Kansas.
13Prior to 1995, the Board declined jurisdiction over employers whose employees workedunder a contract with a government entity, i.e., an entity not covered by the NLRA, wherethe employer/contractor lacked control over the essential terms and conditions ofemployment. See Res-Care, Inc., 280 N.L.R.B. 670 (1986). The Board no longer limits itsjurisdiction in this way. Management Training Corporation, 317 N.L.R.B. 1355 (1995). Inthis report, such workers are treated as private sector employees.
Public Employees

Appendix I: Methodology
Page 33 GAO-02-835 Collective Bargaining
2000 Census Annual Survey of Government Employment,14 a data sourcethat provides detailed information on state and local governmentemployees. We applied all of the state and local laws that excluded certainoccupations from coverage—in many cases police officers, firefighters,and teachers—to estimate a percentage of workers with collectivebargaining rights within those occupations.15 We applied a similarmethodology for federal employees. Starting with the CPS estimates forthe total number of federal employees, we first subtracted the number ofemployees in the legislative and judicial branches of government and inthe U.S. Postal Service, using their relative shares of federal employmentas estimated in using the Federal Civilian Workforce Statistics:Employment and Trends as of March 2001.16 We then adjusted for thoseagencies, for example, the Central Intelligence Agency, who have beenexempted from bargaining rights.17 We then calculated the percentage offederal employees who were managers or supervisors using the September2001 Office or Personnel Management’s Central Personnel Data File(CPDF) and reduced the remainder by the number of exempted managerand supervisors in the executive branch workforce.18 For postal workers,
14The U.S. Census Annual Survey of Government Employment provides data on full-timeand part-time government employment. The survey reports on hours worked and payrollstatistics by type of government (state, county, city, township, special district, schooldistrict) and by government function (elementary and secondary education, highereducation, police protection, fire protection, financial administration, other governmentadministration, judicial and legal, highways, public welfare, solid waste management,sewerage, parks and recreation, health, hospitals, water supply, electric power, gas supply,transit, natural resources, correction, libraries, air transportation, water transport andterminals, other education, state liquor stores, social insurance administration, and housingand community development). See The U.S. Census Annual Survey of Government
Employment 2001.
15For purposes of enumeration, we counted as having collective bargaining rights thosepublic employees in three states who obtained rights meeting our definitional criteria froma gubernatorial executive order, rather than a statute. In those states with collectivebargaining laws that include an “opt-in” provision, we also counted as having rights thoseemployees who received rights from public employers who actually opted to provide thoserights.
16Federal Civilian Workforce Statistics: Employment and Trends as of March 2001,
U.S. Office of Personnel Management, OMSCE-OW1-05-01, May 2001.
17We assumed this estimate to be about 15 percent of the federal workforce. However, wedid not review all federal agencies to identify those workers who are exempted.Furthermore, for some of these agencies, like the National Security Agency, theemployment levels are unavailable. See Federal Civilian Workforce Statistics:
Employment and Trends as of March 2001, U.S. Office of Personnel Management,OMSOE-OW1-05-01, May 2001, note on p. 7.
18This estimate from the CPDF was 12.6 percent.

Appendix I: Methodology
Page 34 GAO-02-835 Collective Bargaining
we applied the percentage of the postal workforce estimated by theU.S. Postal Service to be management employees and then added theremainder back to the number of net non-postal federal workers to obtaina total number of federal employees with bargaining rights.19
While our datasets define many of the employee categories relevant to theNLRA, few of these groups are definitionally identical to those specified inthe NLRA. (See table 5.) For example, although we were able to use theNLRA’s definitions to estimate the number of employees excluded by theBoard’s small business jurisdictional standards, the definitions ofindependent contractors, supervisors, and agricultural workers from thedatasets that we used are not identical to the NLRA’s definitions. To theextent that the definitions of these groups we use in our datasetsoperationally diverge from the NLRA, our estimates may not accuratelycapture the size of the NLRA’s defined groups. However, we believe thatthere is considerable overlap between the two sets of definitions and thatthere is no systematic bias that we can identify in using the CPS and otherdatasets to estimate the NLRA categories.
19This estimate was 10.8 percent. See Draft Comprehensive Transformation Plan,U.S. Postal Service, October 1, 2001, p. 19.
Definitional DifferencesBetween the CPS, NCS,and NLRA

Appendix I: Methodology
Page 35 GAO-02-835 Collective Bargaining
Table 5: Comparison of NLRA Definitions of Private Sector Excluded Groups and Those Used in GAO’s QuantitativeEstimates
Excluded group NLRA definition Definition Used in quantitative estimatesIndependent contractor An independent contractor relationship is
determined by applying the common law agencytest and considering all incidents of the individual’srelationship to the employing entity. See NLRB v.United Insurance Co. of America, 390 U.S. 254(1968); Roadway Package System, Inc., 326N.L.R.B. 842 (1998); and Dial-a-Mattress OperatingCorp., 326 N.R.L.B. 884 (1998).
Wage and salary workers or self-employed inthe CPS who answered affirmatively to thequestion, “Last week, were you working as anindependent contractor, an independentconsultant, or a free-lance worker? That is,someone who obtains customers on their ownto provide a product or service.”
Supervisor/manager A supervisor is one who has the authority, in theinterest of the employer, to hire, transfer, suspend,lay off, recall, promote, discharge, assign, reward,or discipline other employees or responsibly todirect them, or to adjust their grievances, oreffectively to recommend such action, if . . . suchauthority is not merely of a routine or clerical nature,but requires the use of independent judgment. 29U.S.C. § 152(11).A managerial employee is one who formulates andeffectuates management policies by expressing andmaking operative the decisions of their employer,who exercises discretion within, or evenindependently of, established employer policy, andwho is aligned with management. NLRB v. YeshivaUniversity, 444 U.S. 672 (1980).
First, second and third-line supervisors asdefined in table 4.
Domestic worker A domestic worker is one whose employment fallswithin the commonly accepted meaning of the term“domestic servant.” Ankh Services, Inc., 243 NLRB478 (1979); 29 U.S.C. § 152(3).
Employees in SOC codes 403: laundry/ironers,404: cooks, 406: child-care providers, and 407:cleaner/servant/housekeeper, employed in SICcode 761, personal service/private household.
Agricultural worker An agricultural worker is one who engages infarming in all its branches, including the cultivationand tillage of the soil, dairying, the production,cultivation, growing, and harvesting of anyagricultural or horticultural commodities, the raisingof livestock, bees, fur-bearing animals, or poultry,and any practices (including any forestry orlumbering operations) performed by a farmer or ona farm as an incident to or in conjunction with suchfarming operations, including preparation formarket, delivery to storage or to market or tocarriers for transportation to market. National LaborRelations Board Appropriation Act, 60 Stat. 698, ch.672, Title IV (1947), referring to the Fair LaborStandards Act, 27 U.S.C. § 203(f).
“Hired hands” defined as SOC Codes 475:managers, farms, excluding horticultural; 476:managers, horticultural specialty farms; 477:supervisors, farm workers; 479: general farmworkers; 484: general nursery workers.
Employees of certain smallbusinesses
See table 3. Same annual sales dollar volume.
Source: GAO legal analysis and definitions from selected datasets.

Appendix I: Methodology
Page 36 GAO-02-835 Collective Bargaining
We also constructed an estimate of the undocumented alien immigrantpopulation that could have their rights diminished by the Hoffman Plastic
decision. To construct this estimate, we used the U.S. Census Bureau’sestimated number of 8.7 million for the residual foreign-born population(see table 6) and adjusted it for a variety of factors.20 First, to estimate thenumber of eligible workforce participants, we counted only those abovethe age of 18 and below 65 in the 8.7 million number, yielding a total ofabout 7.1 million persons. (See table 6.) We then accounted for the percentthat are likely to be covered by collective bargaining rights in theworkforce. We apply an estimate of the private sector labor force coveredby the NLRA of 77 percent to obtain an estimate of about 5.5 millionpersons (5,485,538). Although the bulk of this estimate containsundocumented alien workers, it also includes a small group of so-calledquasi-legal residents; persons who are in a variety of transitionalimmigrant categories but at the time do not have explicit legal or illegalstatus.21
20This residual foreign-born population is not an estimate of the number of unauthorizedimmigrants. This estimate also includes people who are here legally but are not yetincluded in the official estimates of legal migrants and refugees. Because the method wasderived from a residual methodology, any limitations in the methods or in the measurementof other migration components are reflected in the residual number. For a discussion ofissues in estimating undocumented alien workers see Lindsay Lowell and Robert Suro(2002). How Many Undocumented? The Numbers Behind the U.S.- Mexico Migration
Talks. The Pew Hispanic Center. Bean, F., R. Corona, R. Tuiran, K. Woodrow-Lafield and J.Van Hook. (2001). Circular, Invisible, and Ambiguous Migrants: Components of
Difference in Estimates of the Number of Unauthorized Mexican Migrants in the United
States. Demography 38:411-422. Passel, Jeffrey S., Estimates of Undocumented Immigrants
Living in the United States: 2000, The Urban Institute. August 2001.21The Census estimates the quasi-legal migrant population to be approximately 1.7 million.This estimate includes refugees (who have not yet adjusted status) and asylum applicants(awaiting claim adjudication) (200,000 and 400,000, respectively), migrants deported duringthe decade (200,000), and population legalizing (adjusting status) during the decade(900,000).
Estimation of the Numberof Undocumented AlienWorkers

Appendix I: Methodology
Page 37 GAO-02-835 Collective Bargaining
Table 6: Census Level Estimates of the Foreign-Born Population by Migrant Statusin 2000
Migrant status NumberForeign-born population 31,098,945Legal immigrants 21,612,023Temporary immigrants 781,507Residual foreign-born 8,705,419a
aThe residual foreign-born estimate also includes people in quasi-legal status who are awaiting actionon their legal migration requests.
Source: J. Gregory Robinson. ESCAP II: Demographic Analysis Results (2001). U.S. Census Bureau.
Table 7: Estimates of Residual Foreign-Born by Age
Age of work eligible Total number of persons in that age group18-29 3,483,80230-49 2,605,12350+ 627,53850-64 407,613Total 7,124,076
Note: The number of persons in each age group includes persons of all races.
Source: Costanzo, J., Davis, C., Caribert, I., Goodkind, D., and Ramirez, R. Estimating the ResidualForeign Born Population in 1990 and 2000. U.S. Census, Population Division. May 2002.
There were several limitations to consider when determining the estimateof undocumented alien immigrants due to the characteristics andcircumstances of this population. We include the quasi-legal population inthe residual foreign-born estimate because it includes people who arewaiting for action to be taken on their legal migration requests. Weincluded this group in our total estimate because they were assumed to beillegal at the time they were counted in the Census.22
To obtain an estimate of the workers affected by the Hoffman Plastic
decision, we assumed that the distribution of undocumented alien workersacross industries was identical to that of the total civilian labor force. Ourmethodology for the entire workforce was conducted in February 2001while the Census estimates are for the entire year of 2000. In addition,
22We also assumed that this group continuously replaces itself by new quasi-legalimmigrants of similar characteristics who are awaiting legal action on their migrationrequests so it would not affect our estimates of the total work eligible population.

Appendix I: Methodology
Page 38 GAO-02-835 Collective Bargaining
although undocumented alien workers are likely not to be distributed inthis manner, it is unclear what their distribution is. For example,undocumented alien workers are probably less likely to be employed ingovernment employment, although they may be more likely to work insmall businesses that are exempt from Board jurisdiction and as domesticworkers. In addition, we based our assumption that the percentage ofprivate sector workers with collective bargaining rights under the NLRA(77 percent), on our private sector estimate of 78 percent, and thencorrected for coverage under the Railway Labor Act. 23 However, there is ahigh percentage of undocumented alien workers in agriculture, anotherindustry excluded from the NLRA, suggesting that the 77 percent may bean overestimate. On the other hand, undocumented workers may be morelikely to be rank and file workers rather than supervisors and thus coveredby the NLRA. We also assumed 100 percent Census coverage of theforeign-born population, although, historically, Hispanic populations havebeen undercounted in the Census, and the majority of undocumented alienimmigrants are of Hispanic origin. Such an undercount would imply thatour estimate is an undercount as well. However, there is currently noavailable data on the size of the undercounted population in the Census.24
On balance, the 77-percent estimate appears to represent a reasonableapproach.
We chose to estimate the percentage of the labor force with bargainingrights using data based on persons because bargaining rights is a conceptassociated with persons and not jobs. However, because some workers aremultiple jobholders, it is possible that deciding whether workers haverights on the basis of their primary job could result in discrepantmisclassifications.25 An alternative methodology would be to identify thosejobs that would confer rights to individuals. Using the 2001 CurrentEmployment Statistics Survey (CES) that collects information through the
23Using the CPS Supplement, there were approximately 1.3 million workers in the airlineand railway industries, or about 1 percent of the civilian labor force, in 2001.
24We also assumed a labor force participation rate (the total of the employed andunemployed) for undocumented alien workers of 100 percent. While data are not availableto estimate the labor force participation rate of undocumented workers, it is likely to bequite high.
25For example, a worker who was primarily an independent contractor but who alsoworked at a covered job secondarily would not be counted under our methodology.
Estimates of thePercentage of the LaborForce with CollectiveBargaining Rights Basedon “Jobs” Data
Appendix I: Methodology
Page 39 GAO-02-835 Collective Bargaining
survey of employers,26 we constructed estimates for the percentage of thenon-farm non-supervisory, private labor force that would have bargainingrights and then compared the estimates with the CPS. While we found thatthe CES survey had a total nonfarm private workforce estimate that wassomewhat higher than the CPS, our estimates for the percentage of thenonfarm private labor force with bargaining rights were quite close.27
Our estimates of workers either having or not having collective bargainingrights are imprecise. For the most part, our final national populationestimates are derived from data obtained from different national surveysamples of the worker population taken at different times. These surveysare subject to both nonsampling and sampling errors. Nonsampling errorscan stem from many sources, such as a failure to sample a segment of thepopulation, inability to obtain information from respondents in the sample,differences in interpretation of a question, or errors made in the collectionor processing of the data obtained.
Sampling errors occur because the observations used to develop anestimate are not based on the entire population but rather on one of anumber of samples of the same size that could have been selected usingthe sample design. For any given survey, estimates derived from thedifferent samples would differ from each other. A measure of suchvariation in samples, known as the standard error or sampling error, canbe used to develop a confidence interval around an estimate. Theconfidence interval establishes an upper and lower bound on the estimatethat would encompass the true population value with an expressed degreeof probability.28
26The CES survey is an establishment payroll survey administered to a monthly sample ofnearly 400,000 business establishments nationwide. The primary statistics derived from thesurvey are monthly estimates of employment, hours, and earnings for the nation, states,and major metropolitan areas.
27While the number of nonfarm private sector workers was about 90 percent of comparableCES figures, the percentage of the labor force with bargaining rights in the CPS was about1 percent point higher (83 percent of nonfarm workers in the private sector had rights inthe CPS compared with 82 percent in the CES).
28For extensive discussion of survey errors and their evaluation, see The Office ofManagement and Budget’s Statistical Policy Working Paper 31: Measuring and
Reporting Sources of Error in Surveys, June 2001.
Reliability of WorkforceEstimates

Appendix I: Methodology
Page 40 GAO-02-835 Collective Bargaining
In an effort to partially reflect the imprecision associated with ourestimates, we also developed an associated estimate of an upper and lowerbound to convey a range in which the true population value was mostlikely to fall. The estimates that we developed are based on estimates ofsampling error only. We did not attempt to assess or account for thevarious other sources of error in the data sources we used to develop ourworkforce estimates of eligibility for collective bargaining. For example,we do not know nor can we assess the errors associated with using datareferring to different years, based on somewhat different industryclassification systems, or being collected from individuals versusestablishments.
For our estimates of the following labor segments—independentcontractors, domestic workers, agricultural workers, employees of certainsmall businesses, federal, state and local government employees, andfederal, state and local government employees eligible for collectivebargaining rights--we produced confidence intervals at the 95-percent levelbased on standard error estimates provided in the technicaldocumentation for the February 2001 CPS.
Our confidence interval estimates for independent contractors, employeesof certain small businesses, and state and local government employeeswere at or below + 3 percent of the figures reported. Federal employeeswere at or below + 6 percent of the figures reported. For domesticworkers and agricultural workers, our confidence interval estimates wereat or below + 15 percent of the figures reported.
We also used February 2001 CPS standard error estimates to calculate theconfidence intervals for our estimates of certain labor segments by privatesector industries. For all industries, our confidence intervals for estimatesof the proportion that are employees of certain small businesses is + 1percentage point or less. The independent contractor confidence intervalsfor all industries is + 3 percentage points or less.
For the NCS, which we used to obtain estimates of managers andsupervisors in the private sector and the state and local governmentworkforce, there were no available estimates of sampling error foremployee estimates. In preparing the NCS data on occupational wages andbenefits, BLS only produces measures of sampling error on earnings andnot estimates of the number of employees whose job characteristicsinclude supervisory or managerial work factors. Instead, we developedapproximate estimates of sampling error using information about the

Appendix I: Methodology
Page 41 GAO-02-835 Collective Bargaining
allocation of the NCS sample29 and applying a conservative assumption ofthe survey’s design effect.
Our confidence interval estimate for excluded private sector managers andsupervisors overall is + 18 percent of the figure reported. For first-linesupervisors, our estimated interval is + 21 percent.
The multiple steps and data sources used in our estimation proceduresprecluded direct computation of confidence intervals for our overallestimates of workers eligible for collective bargaining either nationally orby industry. In an effort to provide some quantified bounds reflecting theimprecision of our national and overall industry estimates, we used meanand variance estimates (by industry) for various components of the overallestimates to approximate the sampling distributions for each of thosecomponents. We then used these distributions to simulate how our overallestimate would vary due to sampling.30
Our overall bounds estimate for the total civilian workforce, totalgovernment workforce, and total private sector workforce eligible forcollective bargaining rights is + 3 percent or less. For all industries exceptmining and construction, our bounds estimates of the proportion that areeligible for bargaining rights is + 6 percentage points or less. Forconstruction, the bound is + 9 percentage points, and for mining it is + 19percentage points.
Although we made an effort to identify and count those workers whomight have rights from laws other than the NLRA, there are some forwhom we did not do so. In particular, one group of these employees wouldbe those covered by state private sector labor relations laws (LittleWagner Acts). There are 18 states that have laws that provide collectivebargaining rights to some employees who would otherwise be excluded
29Technical Note in Occupational Compensation Survey: Occupational Wages in the
United States, 1997, Bureau of Labor Statistics, U.S. Department of Labor, RevisedSeptember 1999.
30While there are no widely accepted methodologies for combining sampling errorsassociated with estimates derived from multiple data sources, we believe that thisnonparametric approach is a reasonable method to use for approximating bounds aroundour national estimates.
State Labor Relations Laws

Appendix I: Methodology
Page 42 GAO-02-835 Collective Bargaining
from the federal NLRA.31 Of these 18 states, 17 states extend coverage toemployees of small businesses, 11 states to independent contractors,8 states include supervisors, 5 to agricultural laborers, and 1 includesdomestic servants. 32 Except for agriculture, we did not incorporate thecoverage under these state laws into our quantitative estimates and onbalance this would lead to an underestimation of the percentage of thelabor force with collective bargaining rights.
31The states with a state labor relations act are Colorado, Connecticut, Hawaii, Kansas,Massachusetts, Michigan, Minnesota, New Jersey, New York, North Dakota, Oregon,Pennsylvania, Rhode Island, South Dakota, Utah, Vermont, West Virginia, and Wisconsin.
32State labor relations laws covering agricultural laborers are Colorado, Connecticut,Michigan, Minnesota, and Wisconsin. Wisconsin’s labor relations law covers domesticservants. State labor relations laws covering supervisors are Connecticut, Kansas,Massachusetts, New Jersey, New York, Pennsylvania, Rhode Island, and Utah. State laborrelations laws covering independent contractors: are Connecticut, Kansas, Massachusetts,Michigan, Minnesota, New Jersey, New York, Pennsylvania, Rhode Island, South Dakota,and Utah. Those states covering employees of small businesses are Colorado, Connecticut,Kansas, Massachusetts, Michigan, Minnesota, New Jersey, New York, North Dakota,Oregon, Pennsylvania, Rhode Island, South Dakota, Utah, Vermont, West Virginia, andWisconsin.
(130097)

Appendix I: Methodology
Page 43 GAO-02-835 Collective Bargaining


The General Accounting Office, the investigative arm of Congress, exists tosupport Congress in meeting its constitutional responsibilities and to helpimprove the performance and accountability of the federal government for theAmerican people. GAO examines the use of public funds; evaluates federalprograms and policies; and provides analyses, recommendations, and otherassistance to help Congress make informed oversight, policy, and fundingdecisions. GAO’s commitment to good government is reflected in its core valuesof accountability, integrity, and reliability.
The fastest and easiest way to obtain copies of GAO documents at no cost isthrough the Internet. GAO’s Web site (www.gao.gov) contains abstracts and full-text files of current reports and testimony and an expanding archive of olderproducts. The Web site features a search engine to help you locate documentsusing key words and phrases. You can print these documents in their entirety,including charts and other graphics.
Each day, GAO issues a list of newly released reports, testimony, andcorrespondence. GAO posts this list, known as “Today’s Reports,” on its Web sitedaily. The list contains links to the full-text document files. To have GAO e-mailthis list to you every afternoon, go to www.gao.gov and select “Subscribe to dailyE-mail alert for newly released products” under the GAO Reports heading.
The first copy of each printed report is free. Additional copies are $2 each. Acheck or money order should be made out to the Superintendent of Documents.GAO also accepts VISA and Mastercard. Orders for 100 or more copies mailed to asingle address are discounted 25 percent. Orders should be sent to:
U.S. General Accounting Office441 G Street NW, Room LMWashington, D.C. 20548
To order by Phone: Voice: (202) 512-6000TDD: (202) 512-2537Fax: (202) 512-6061
Contact:
Web site: www.gao.gov/fraudnet/fraudnet.htmE-mail: [email protected] answering system: (800) 424-5454 or (202) 512-7470
Jeff Nelligan, managing director, [email protected] (202) 512-4800U.S. General Accounting Office, 441 G Street NW, Room 7149Washington, D.C. 20548
GAO’s Mission
Obtaining Copies ofGAO Reports andTestimony
Order by Mail or Phone
To Report Fraud,Waste, and Abuse inFederal Programs
Public Affairs