games workshop group plc - s19485.pcdn.co · our business and our warhammer hobby are in great...
TRANSCRIPT

PRESS ANNOUNCEMENT
GAMES WORKSHOP GROUP PLC
9 January 2018
HALF-YEARLY REPORT Games Workshop Group PLC (“Games Workshop” or the “Group”) announces its half-yearly results for the six months to 26 November 2017.
Highlights:
Six months to
Six months to
26 November 27 November
2017 2016
Revenue £108.9m £70.9m
Revenue at constant currency* £108.6m £70.9m
Operating profit pre-change in accounting estimates and royalties receivable £33.4m £9.7m Impact of change in accounting estimates £1.2m £0.8m
Operating profit pre-royalties receivable £34.6m £10.5m
Royalties receivable £4.2m £3.3m
Operating profit and pre-tax profit £38.8m £13.8m
Cash generated from operations £41.2m £19.6m
Basic earnings per share 97.6p 34.0p
Dividend per share declared in the period 61p 25p
Kevin Rountree, CEO of Games Workshop, said: “Our business and our Warhammer Hobby are in great shape. We are pleased to report record sales and profit levels in the period. It is encouraging that sales and profit growth continue across all regions and channels. Given the high levels of operational gearing and our relentless management of our costs, our improving sales performance has translated into record profit and cash levels. Our sales for the month of December have also shown good growth trends.”
…Ends…
For further information, please contact: Games Workshop Group PLC 0115 900 4003 Kevin Rountree, CEO Rachel Tongue, Group Finance Director Investor relations website investor.games-workshop.com General website www.games-workshop.com *Constant currency revenue is calculated by comparing results in the underlying currencies for 2016 and 2017, both converted at the average exchange rates for the six months ended 27 November 2016.

FIRST HALF HIGHLIGHTS
Six months to
Six months to
26 November 27 November 2017 2016
Revenue £108.9m £70.9m
Revenue at constant currency* £108.6m £70.9m
Operating profit pre-change in accounting estimates and royalties receivable £33.4m
£9.7m
Impact of change in accounting estimates £1.2m £0.8m
Operating profit pre-royalties receivable £34.6m £10.5m
Royalties receivable £4.2m £3.3m
Operating profit and pre-tax profit £38.8m £13.8m
Cash generated from operations £41.2m £19.6m
Basic earnings per share 97.6p 34.0p
Dividends per share declared in the period 61p 25p
Revenue by segment
Six months to
Six months to
Six months to
Six months to
26 November 27 November 26 November 27 November 2017 2016 2017 2016 Constant
currency Constant currency
Actual rates
Actual rates
Trade £48.0m £29.3m £48.0m £29.3m Retail £39.3m £29.2m £39.6m £29.2m Mail order £21.3m £12.4m £21.3m £12.4m
Operating profit by segment
Six months to
Six months to
Six months to
Six months to
26 November 27 November 26 November 27 November 2017 2016 2017 2016 Constant
currency Constant currency
Actual rates
Actual rates
Trade £13.1m £8.8m £13.5m £8.8m Retail £1.5m £(2.4)m £1.8m £(2.4)m Mail order £13.6m £6.7m £13.6m £6.7m Product and supply £18.4m £6.4m £17.9m £6.4m Royalties £3.8m £3.0m £3.8m £3.0m Other costs £(11.9)m £(8.7)m £(11.8)m £(8.7)m
INTERIM MANAGEMENT REPORT Our business and our Warhammer Hobby are in great shape. We are pleased to report record sales and profit levels in the period. It is encouraging that sales and profit growth continue across all regions and channels. Given the high levels of operational gearing and our relentless management of our costs, our improving sales performance has translated into record profit and cash levels. Our sales for the month of December have also shown good growth trends. These cracking results are built on hard work continuing to focus on making and selling an ever better range of Warhammer miniatures. We’re proud of the improving trends, but we are not taking anything for granted, our feet remain firmly on the ground as we stride into the year ahead. We will continue to focus on the core values and activities that drive our business. In the second half of this financial year I will continue to invest appropriately in my team and facilities to ensure we can deliver our ambitious operational plans.
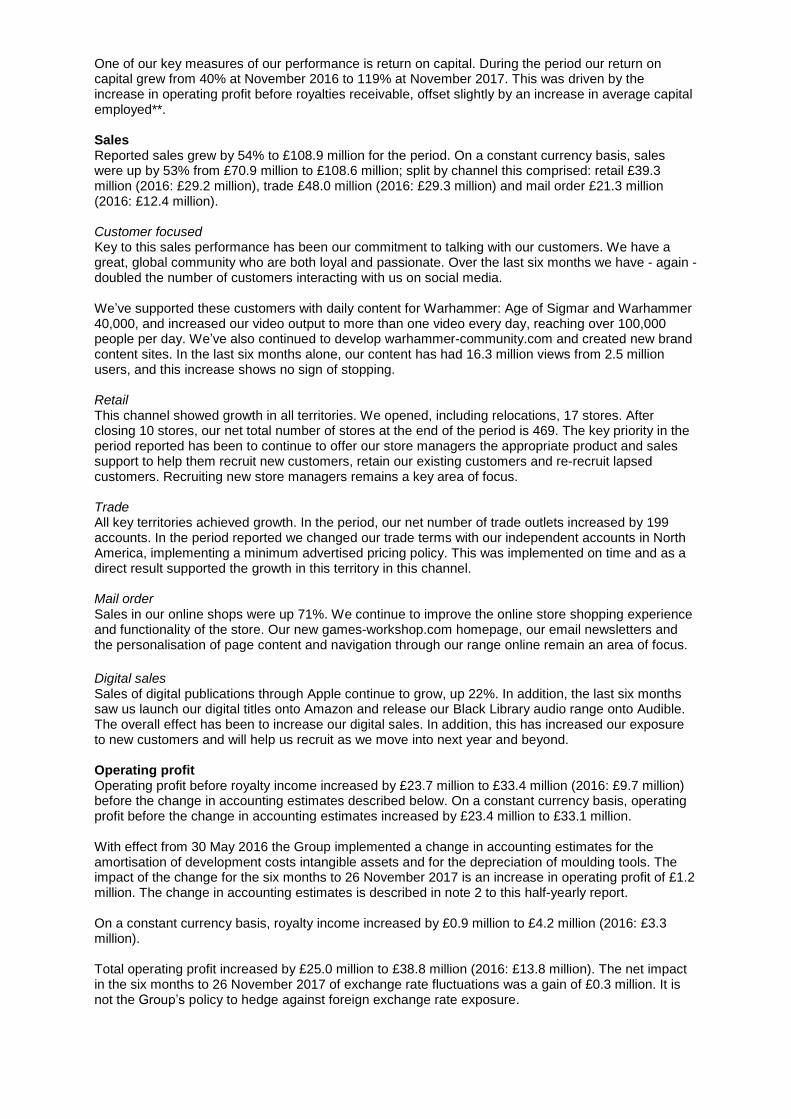
One of our key measures of our performance is return on capital. During the period our return on capital grew from 40% at November 2016 to 119% at November 2017. This was driven by the increase in operating profit before royalties receivable, offset slightly by an increase in average capital employed**. Sales Reported sales grew by 54% to £108.9 million for the period. On a constant currency basis, sales were up by 53% from £70.9 million to £108.6 million; split by channel this comprised: retail £39.3 million (2016: £29.2 million), trade £48.0 million (2016: £29.3 million) and mail order £21.3 million (2016: £12.4 million). Customer focused Key to this sales performance has been our commitment to talking with our customers. We have a great, global community who are both loyal and passionate. Over the last six months we have - again - doubled the number of customers interacting with us on social media. We’ve supported these customers with daily content for Warhammer: Age of Sigmar and Warhammer 40,000, and increased our video output to more than one video every day, reaching over 100,000 people per day. We’ve also continued to develop warhammer-community.com and created new brand content sites. In the last six months alone, our content has had 16.3 million views from 2.5 million users, and this increase shows no sign of stopping. Retail This channel showed growth in all territories. We opened, including relocations, 17 stores. After closing 10 stores, our net total number of stores at the end of the period is 469. The key priority in the period reported has been to continue to offer our store managers the appropriate product and sales support to help them recruit new customers, retain our existing customers and re-recruit lapsed customers. Recruiting new store managers remains a key area of focus. Trade All key territories achieved growth. In the period, our net number of trade outlets increased by 199 accounts. In the period reported we changed our trade terms with our independent accounts in North America, implementing a minimum advertised pricing policy. This was implemented on time and as a direct result supported the growth in this territory in this channel. Mail order Sales in our online shops were up 71%. We continue to improve the online store shopping experience and functionality of the store. Our new games-workshop.com homepage, our email newsletters and the personalisation of page content and navigation through our range online remain an area of focus. Digital sales Sales of digital publications through Apple continue to grow, up 22%. In addition, the last six months saw us launch our digital titles onto Amazon and release our Black Library audio range onto Audible. The overall effect has been to increase our digital sales. In addition, this has increased our exposure to new customers and will help us recruit as we move into next year and beyond. Operating profit Operating profit before royalty income increased by £23.7 million to £33.4 million (2016: £9.7 million) before the change in accounting estimates described below. On a constant currency basis, operating profit before the change in accounting estimates increased by £23.4 million to £33.1 million. With effect from 30 May 2016 the Group implemented a change in accounting estimates for the amortisation of development costs intangible assets and for the depreciation of moulding tools. The impact of the change for the six months to 26 November 2017 is an increase in operating profit of £1.2 million. The change in accounting estimates is described in note 2 to this half-yearly report. On a constant currency basis, royalty income increased by £0.9 million to £4.2 million (2016: £3.3 million). Total operating profit increased by £25.0 million to £38.8 million (2016: £13.8 million). The net impact in the six months to 26 November 2017 of exchange rate fluctuations was a gain of £0.3 million. It is not the Group’s policy to hedge against foreign exchange rate exposure.
Operating expenses increased by £5.4 million due to an investment in sales facing activities relating to new retail store costs and increased retail variable pay, continued investment in marketing and IT teams, as well as an increased profit share payment paid to all employees. Capital employed Average capital employed** increased by £4.3 million to £46.1 million. The book value of tangible and intangible assets increased by £2.8 million, mainly due to the ongoing investment in the implementation of a new ERP system and the change in accounting estimates for development costs and moulding tools. Whilst trade and other receivables increased by £2.2 million, inventory increased by £2.8 million due to the timing of product launches, provisions decreased by £0.3 million and current liabilities increased by £3.8 million. Cash generation During the period, the Group’s core operating activities generated £33.2 million of cash after tax payments (2016: £14.5 million). The Group also received cash of £2.8 million in respect of royalties in the year (2016: £3.6 million). After purchases of tangible and intangible assets and product development costs of £8.4 million (2016: £6.8 million), dividends of £17.7 million (2016: £8.0 million), proceeds from issue of share capital of £0.9 million (2016: £nil) and foreign exchange losses of £0.1 million (2016: gains of £0.8 million) there were net funds at the end of the period £28.6 million (2016: £15.9 million). Dividends In the period we paid dividends of 20 pence per share and 35 pence per share (2016: 25 pence) amounting to £6.4 million and £11.3 million respectively (2016: £8.0 million). Also in the period a further 6 pence per share, amounting to £1.9 million, was distributed by way of a rectification dividend. The rectification dividend was satisfied by the release of Company shareholders from the liability to repay the amount received in the year ended 28 May 2017 in the form of an unlawful dividend. In addition, a dividend of 30 pence per share was declared on 13 December 2017 amounting to £9.7 million. Risks and uncertainties The board has overall responsibility for ensuring risk is appropriately managed across the Group. As discussed in the 2017 annual report, the top five risks to the Group are reviewed at each board meeting. The risks are rated as to their business impact and their likelihood of occurring. In addition, the Group has a disaster recovery plan to ensure ongoing operations are maintained. The principal risks for the balance of the year are the same as those identified in the 2017 annual report and are discussed below: ERP change - we are changing our core ERP system in the UK. This is a complicated project with the risk of widespread business disruption if it is not implemented well. Our new Global Head of IT and her team are making steady progress. Store manager recruitment - this comprises both recruitment of managers for new stores as well as replacing poor performing managers. Retail is our primary method of recruiting new customers and so we need great managers in all our stores. Our new recruiting website and tools are on track to go live in 2018. Supply chain - our new mail order warehouse system went live in September 2017. This is part of an ongoing programme of continuous improvement for our warehouse systems. We have strengthened the team with a new Global Head of Logistics joining us in January 2018. In relation to factory capacity, given the step change in our performance in the last two years we need to ensure we have the appropriate infrastructure to support the new levels of product volumes in our vertically integrated business. We are making the necessary and appropriate investments in factory capacity to manage these risks. Range management - we are reviewing our range to ensure that we are exploring all opportunities. The risk is that we don’t fully exploit all the opportunities that are available to us. We have strengthened the team and a new Global Head of Merchandising will be joining us in February 2018. Distractions - this is anything else that gets in the way of us delivering our goals. Games Workshop relies upon the continued availability and integrity of its IT systems. Our business critical systems are monitored and disaster recovery plans are in place and reviewed to ensure they remain up to date. The security of our systems is reviewed with software updates applied and equipment updated as required. We do not consider that we have material solvency or liquidity risks. We also feel that it is too early to tell what the effects will be on Games Workshop of the UK Government invoking Article 50 of the Treaty of Lisbon, notifying the European Council of its intention to withdraw from the European Union.

The greatest risk is the same one that we repeat each year, namely, management. So long as we have great people we will be fine. Problems will arise if the board allows egos and private agendas to rule. I will do my utmost to ensure that this does not happen. Going concern After making appropriate enquiries, the directors have a reasonable expectation that the Group has adequate resources to continue in operational existence for at least twelve months from the date of approval of the condensed consolidated interim financial information. For this reason they have adopted the going concern basis in preparing this condensed consolidated interim financial information. Statement of directors’ responsibilities The directors confirm that this condensed consolidated interim financial information has been prepared in accordance with IAS 34, ‘Interim Financial Reporting’, as adopted by the European Union, and that the interim management report herein includes a fair review of the information required by DTR 4.2.7 and DTR 4.2.8, namely: an indication of important events that have occurred during the first six months and their impact on the condensed set of financial statements, and a description of (i) the principal risks and uncertainties for the remaining six months of the financial year; (ii) material related-party transactions in the first six months and (iii) any material changes in the related-party transactions described in the last annual report. Tom Kirby retired from the board at the 2017 AGM and Nick Donaldson was appointed as non-executive chairman. There have been no other changes to the board since the annual report for the year to 28 May 2017. A list of all current directors is maintained on the investor relations website at investor.games-workshop.com. By order of the board K D Rountree CEO R F Tongue Group Finance Director 9 January 2018 *Constant currency revenue is calculated by comparing results in the underlying currencies for 2016 and 2017, both converted at the average exchange rates for the six months ended 27 November 2016.
**We use average capital employed to take account of the significant fluctuation in working capital which occurs as the business builds both inventories and trade receivables in the pre-Christmas trading period. Return is defined as operating profit before royalty income, and the average capital employed is adjusted by deducting assets and adding back liabilities in respect of cash, borrowings, taxation and dividends.
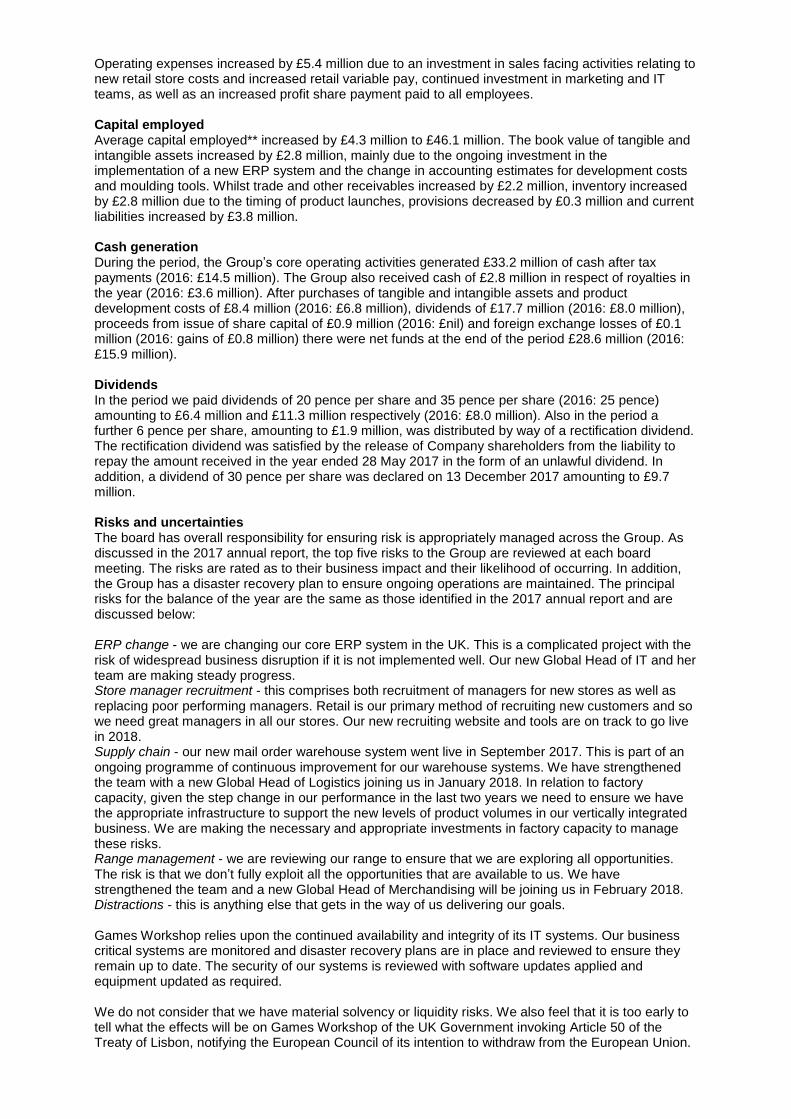
CONSOLIDATED INCOME STATEMENT
Six months to 26 November
2017
Six months to 27 November
2016
Year to 28 May
2017 Notes £000 £000 £000 Revenue 3 108,852 70,935 158,114
Cost of sales pre-change in accounting estimates* (31,103) (22,171) (45,224) Cost of sales impact of change in accounting estimates* 1,233 798 1,533
Cost of sales (29,870) (21,373) (43,691) ---------- ---------- ---------- Gross profit 78,982 49,562 114,423 Operating expenses (44,425) (39,065) (83,591) Other operating income – royalties receivable 4,216 3,261 7,491 ---------- ---------- ----------
Operating profit pre-change in accounting estimates* 37,540 12,960 36,790 Operating profit impact of change in accounting estimates* 1,233 798 1,533
Operating profit 3 38,773 13,758 38,323 Finance income 51 29 87 Finance costs (50) - (7) ---------- ---------- ---------- Profit before taxation 5 38,774 13,787 38,403 Income tax expense 6 (7,371) (2,857) (7,856) ---------- ---------- ---------- Profit attributable to owners of the parent 31,403 10,930 30,547 ====== ====== ====== Basic earnings per ordinary share 7 97.6p 34.0p 95.1p Diluted earnings per ordinary share 7 96.8p 33.9p 94.5p Basic earnings per ordinary share pre-change in accounting estimates* 7 94.5p 32.0p 91.2p Diluted earnings per ordinary share pre-change in accounting estimates* 7 93.7p 31.9p 90.7p
CONSOLIDATED STATEMENT OF COMPREHENSIVE INCOME AND EXPENSE
Six months to
26 November 2017
Six months to 27 November
2016
Year to 28 May
2017 £000 £000 £000 Profit attributable to owners of the parent 31,403 10,930 30,547 Other comprehensive (expense)/income Items that may be subsequently reclassified to profit or loss Exchange differences on translation of foreign operations (419) 2,687 2,663 --------- --------- ---------- Other comprehensive (expense)/income for the period (419) 2,687 2,663 --------- --------- ---------- Total comprehensive income attributable to owners of the parent 30,984 13,617 33,210 ====== ====== =======
The following notes form an integral part of this condensed consolidated interim financial information. *With effect from 30 May 2016 the Group implemented a change in accounting estimates for the amortisation of development costs intangible assets and for the depreciation of moulding tools. The change in accounting estimates is described in note 2 to this condensed consolidated interim financial information.

CONSOLIDATED BALANCE SHEET
As at
As at
As at 26 November 27 November 28 May 2017 2016 2017 Notes £000 £000 £000 Non-current assets Goodwill 1,433 1,433 1,433 Other intangible assets 9 14,271 12,824 12,917 Property, plant and equipment 10 24,367 22,112 22,132 Trade and other receivables 1,505 1,413 1,081 Deferred tax assets 4,509 2,881 5,399 ---------- ---------- ---------- 46,085 40,663 42,962 ---------- ---------- ---------- Current assets Inventories 16,277 11,224 12,421 Trade and other receivables 15,329 11,507 12,976 Current tax assets 513 982 596 Cash and cash equivalents 28,639 15,877 17,910 ---------- ---------- ---------- 60,758 39,590 43,903 ---------- ---------- ---------- Total assets 106,843 80,253 86,865 ---------- ---------- ---------- Current liabilities Trade and other payables (22,622) (16,761) (16,515) Current tax liabilities (6,579) (2,689) (5,840) Provisions for other liabilities and charges 11 (757) (838) (689) ---------- ---------- ---------- (29,958) (20,288) (23,044) ---------- ---------- ---------- Net current assets 30,800 19,302 20,859 ---------- ---------- ---------- Non-current liabilities Other non-current liabilities (537) (416) (494) Provisions for other liabilities and charges 11 (536) (662) (495) ---------- ---------- ---------- (1,073) (1,078) (989) ---------- ---------- ---------- Net assets 75,812 58,887 62,832 ====== ====== ====== Capital and reserves Called up share capital 1,617 1,606 1,607 Share premium account 11,531 10,533 10,599 Other reserves 3,911 4,354 4,330 Retained earnings 58,753 42,394 46,296 ---------- ---------- ---------- Total equity 75,812 58,887 62,832 ====== ====== ====== The following notes form an integral part of this condensed consolidated interim financial information.

CONSOLIDATED STATEMENT OF CHANGES IN TOTAL EQUITY
Called up Share share premium Other Retained Total capital account reserves earnings equity £000 £000 £000 £000 £000 At 28 May 2017 and 29 May 2017 1,607 10,599 4,330 46,296 62,832 Profit for the six months to 26 November 2017 - - - 31,403 31,403 Exchange differences on translation of foreign operations - - (419) - (419) ---------- ---------- ---------- ---------- ---------- Total comprehensive (expense)/income for the period - - (419) 31,403 30,984 Transactions with owners: Share-based payments - - - 60 60 Shares issued under employee sharesave scheme 10 932 - - 942 Deferred tax credit relating to share options - - - 279 279 Corporate tax credit relating to exercised share options - - - 292 292 Dividends paid to Company shareholders - - - (19,577) (19,577) ---------- ---------- ---------- ---------- ----------
Total transactions with owners 10 932 - (18,946) (18,004) ---------- ---------- ---------- ---------- ---------- At 26 November 2017 1,617 11,531 3,911 58,753 75,812 ====== ====== ====== ====== ======
Called up Share share premium Other Retained Total capital account reserves earnings equity £000 £000 £000 £000 £000 At 29 May 2016 and 30 May 2016 1,606 10,519 1,667 39,371 53,163 Profit for the six months to 27 November 2016 - - - 10,930 10,930 Exchange differences on translation of foreign operations - - 2,687 - 2,687 ---------- ---------- ---------- ---------- ---------- Total comprehensive income for the period - - 2,687 10,930 13,617 Transactions with owners: Share-based payments - - - 82 82 Shares issued under employee sharesave scheme - 14 - - 14 Deferred tax credit relating to share options - - - 42 42 Dividends paid to Company shareholders - - - (8,031) (8,031) ---------- ---------- ---------- ---------- ----------
Total transactions with owners - 14 - (7,907) (7,893) ---------- ---------- ---------- ---------- ---------- At 27 November 2016 1,606 10,533 4,354 42,394 58,887 ====== ====== ====== ====== ======
Called up Share share premium Other Retained Total capital account reserves earnings equity £000 £000 £000 £000 £000 At 29 May 2016 and 30 May 2016 1,606 10,519 1,667 39,371 53,163 Profit for the year to 28 May 2017 - - - 30,547 30,547 Exchange differences on translation of foreign operations - - 2,663 - 2,663 ---------- ---------- ---------- ---------- ---------- Total comprehensive income for the period - - 2,663 30,547 33,210 Transactions with owners: Share-based payments - - - 160 160 Shares issued under employee sharesave scheme 1 80 - - 81 Deferred tax credit relating to share options - - - 14 14 Current tax credit relating to exercised share options - - - 5 5 Dividends paid to Company shareholders - - - (23,801) (23,801) ---------- ---------- ---------- ---------- ---------- Total transactions with owners 1 80 - (23,622) (23,541) ---------- ---------- ---------- ---------- ---------- At 28 May 2017 1,607 10,599 4,330 46,296 62,832 ====== ====== ====== ====== ======
The following notes form an integral part of this condensed consolidated interim financial information.

CONSOLIDATED CASH FLOW STATEMENT
Six months to
Six months to
Year to 26 November 27 November 28 May 2017 2016 2017 Notes £000 £000 £000 Cash flows from operating activities Cash generated from operations 8 41,206 19,621 49,370 UK corporation tax paid (4,602) (1,313) (5,212) Overseas tax paid (566) (155) (270) ---------- ---------- ---------- Net cash generated from operating activities 36,038 18,153 43,888 ---------- ---------- ---------- Cash flows from investing activities Purchases of property, plant and equipment (4,948) (2,484) (5,409) Proceeds on disposal of property, plant and equipment 1 - - Purchases of other intangible assets (927) (1,187) (1,749) Expenditure on product development (2,554) (3,167) (5,686) Interest received 51 35 87 ---------- ---------- ---------- Net cash used in investing activities (8,377) (6,803) (12,757) ---------- ---------- ---------- Cash flows from financing activities
Proceeds from issue of ordinary share capital 942 14 81 Interest paid (49) - (4) Loans to Company shareholders - - (1,901) Dividends paid to Company shareholders (17,676) (8,031) (23,801) ---------- ---------- ---------- Net cash used in financing activities (16,783) (8,017) (25,625) ---------- ---------- ---------- Net increase in cash and cash equivalents 10,878 3,333 5,506
Opening cash and cash equivalents 17,910 11,775 11,775 Effects of foreign exchange rates on cash and cash equivalents
(149)
769 629
---------- ---------- ---------- Closing cash and cash equivalents 28,639 15,877 17,910 ====== ====== ====== The following notes form an integral part of this condensed consolidated interim financial information.

NOTES TO THE FINANCIAL INFORMATION 1. Basis of preparation The Company is a limited liability company, incorporated and domiciled in the United Kingdom. The address of its registered office is Willow Road, Lenton, Nottingham, NG7 2WS. The Company has its listing on the London Stock Exchange. This condensed consolidated interim financial information does not comprise statutory accounts within the meaning of section 434 of the Companies Act 2006. Statutory accounts for the year ended 28 May 2017 were approved by the board of directors on 24 July 2017 and have been delivered to the Registrar of Companies. The report of the auditors on those accounts was unqualified, did not contain an emphasis of matter paragraph and did not contain any statement under either section 498 (2) or section 498 (3) of the Companies Act 2006. This condensed consolidated interim financial information has not been audited or reviewed pursuant to the Auditing Practices Board guidance on ‘Review of Interim Financial Information’ and does not include all of the information required for full annual financial statements. This condensed consolidated interim financial information for the six months ended 26 November 2017 has been prepared in accordance with the Disclosure and Transparency Rules of the Financial Conduct Authority and with IAS 34, ‘Interim Financial Reporting’ as adopted by the European Union. The condensed consolidated interim financial information should be read in conjunction with the annual financial statements for the year ended 28 May 2017 which have been prepared in accordance with IFRSs as adopted by the European Union. After making appropriate enquiries, the directors have a reasonable expectation that the Group has adequate resources to continue in operational existence for the foreseeable future. For this reason they have adopted the going concern basis in preparing this condensed consolidated interim financial information. This condensed consolidated interim financial information was approved for issue on 9 January 2018. This condensed consolidated interim financial information is available to shareholders and members of the public on the Company’s website at investor.games-workshop.com. The preparation of interim financial information requires management to make judgements, estimates and assumptions that affect the application of accounting policies and the reported amounts of assets and liabilities, revenues and expenses. Actual results may differ from these estimates. In preparing this condensed consolidated interim financial information, the significant judgements made by management in applying the Group’s accounting policies and the key sources of estimation uncertainty were the same as those that applied to the consolidated financial statements for the year ended 28 May 2017. The accounting policies applied are consistent with those of the annual financial statements for the year ended 28 May 2017, as described in those financial statements. With effect from 30 May 2016 the Group implemented a change in accounting estimate for the amortisation of development costs intangible assets and the accounting estimate for the depreciation of moulding tools. These are described in note 2 below along with the impact on the results for the six months to 26 November 2017. Taxes on income in the interim periods are accrued using the tax rate that would be applicable to expected total annual earnings. There are no new accounting standards or interpretations effective in the current period which are relevant to the Group. New standards, amendments to standards and interpretations which have been published but are not yet effective which are relevant to the Group are:
- IFRS 16 ‘Leases’ (effective for the year ending 31 May 2020). Under this new standard all leases will be required to be recognised on balance sheet. Currently under IAS 17 ‘Leases’ only leases categorised as finance leases are recognised on balance sheet, with leases categorised as operating leases not recognised. In broad terms the impact will be to recognise a lease liability and corresponding asset for the Group’s operating lease commitments. The Group is assessing the impact of the new standard.
- IFRS 15 ‘Revenue from contracts with customers’ (effective for the year ending 2 June 2019). Under this new standard the royalty minimum guarantee income is expected to be taken as revenue up front. Currently the minimum guarantee income is deferred and released in line with licensee sales. In addition, amounts receivable from customers in respect of delivery charges will be recognised as revenue. Currently these are offset against the carriage cost to the Group within cost of sales. The Group is assessing the impact of the new standard and expects to have a clearer view of the financial impact by the year end.
- IFRS 9 ‘Financial instruments’ (effective for the year ending 2 June 2019). Under this new standard, provisions for impairment of trade receivables will be recognised at an amount based on expected credit losses and will be calculated from the initial recognition of the asset. Currently provisions for impairment of trade receivables are not recognised until there is an indication of impairment. The Group is assessing the impact of the new standard and expects to have a clearer view of the financial impact by the year end.
The Group does not consider that any other standards, amendments or interpretations issued by the IASB, but not yet applicable, will have a significant effect on the financial statements. 2. Change in accounting estimates
With effect from 30 May 2016 the Group implemented a change in accounting estimates for the amortisation of development costs intangible assets and the depreciation of moulding tools. Previously product development costs recognised as intangible assets were amortised on a straight line basis over periods ranging between 1 and 48 months. These development costs intangible assets are now amortised on a reducing balance basis with rates ranging from 50% to 80%. Previously moulding tools were depreciated on a straight line basis over a period of 48 months. Moulding tools relating to specific products are now amortised on a reducing balance basis at 50%.

2. Change in accounting estimates continued
The changes were made in order to better match the expenditure incurred to the expected revenue generated from the subsequent product release. In accordance with IAS 8 ‘Accounting policies, changes in accounting estimates and errors’, the changes have been recognised prospectively since 30 May 2016. The impact of the change on the results for the six months to 26 November 2017 is shown in the table below:
Pre-change in
accounting estimates
Impact of change in
accounting estimates
Total six months to 26 November
2017 £000 £000 £000
Cost of sales (31,103) 1,233 (29,870) Gross profit 77,749 1,233 78,982 Operating profit 37,540 1,233 38,773 Income tax expense (7,137) (234) (7,371) Profit attributable to owners of the parent 30,404 999 31,403 Retained earnings brought forward 45,054 1,242 46,296 Other intangible assets 10,952 3,319 14,271 Property, plant and equipment 24,919 (552) 24,367 Deferred tax assets 4,404 105 4,509 Current tax liabilities (5,948) (631) (6,579) Net assets 73,571 2,241 75,812 Basic earnings per share 94.5p 3.1p 97.6p Diluted earnings per share 93.7p 3.1p 96.8p The impact of the change in accounting estimates in future periods will depend on the release mix and nature of products being developed in those years. A benefit relating to the changes in accounting estimates is expected until the year ending 31 May 2020, when the change will no longer materially impact the financial statements. 3. Segment information As Games Workshop is a vertically integrated business, management assesses the performance of sales channels and manufacturing and distribution channels separately. At 26 November 2017, the Group is organised as follows:
- Sales channels. These channels sell product to external customers, through the Group’s network of retail stores, independent retailers and directly via the global web stores. The sales channels have been aggregated into segments where they sell products of a similar nature, have similar production processes, similar customers, similar distribution methods, and if they are affected by similar economic factors. The segments are as follows:
- Trade. This sales channel sells globally to independent retailers, agents and distributors. It also includes the Group’s magazine newsstand business and the distributor sales from the Group’s publishing business (Black Library).
- Retail. This includes sales through the Group’s retail stores, the Group’s visitor centre in Nottingham and global exhibitions.
- Mail order. This includes sales through the Group’s global web stores and digital sales through external affiliates.
- Product and supply. This includes the design and manufacture of the products and incorporates the production facility in the UK and the Group logistics and stock management costs. This also includes adjustments for the profit in stock arising from inter-segment sales and charges for inventory provisions.
- Central costs. These include the Company overheads, head office site costs and the costs of running the Games Workshop Academy.
- Service centre costs. Provides support services (IT, accounting, payroll, personnel, procurement, legal, health and safety, customer services and credit control) to activities across the Group and undertakes strategic projects.
- Royalties. This is royalty income earned from third party licensees after deducting associated licensing costs.
The chief operating decision-maker assesses the performance of each segment based on operating profit, excluding share option charges recognised under IFRS 2, ‘Share-based payment’, charges in respect of the Group’s profit share scheme and, for the year to 28 May 2017, the discretionary payment to employees. This has been reconciled to the Group’s total profit before taxation below. The segment information reported to the executive directors for the periods included in this financial information is as follows:
Six months to
Six months to
Year to 26 November 27 November 28 May 2017 2016 2017 £000 £000 £000 Trade 47,961 29,341 61,254 Retail 39,615 29,168 64,848 Mail order 21,276 12,426 32,012 ------------- ------------- ------------ Total external revenue 108,852 70,935 158,114 ======== ======== =======

3. Segment information continued
For information, we analyse external revenue further below:
Six months to
Restated*
Six months to
Year to 26 November 27 November 28 May 2017 2016 2017 £000 £000 £000 Trade UK and Continental Europe 19,652 12,958 25,442 North America 21,345 12,178 27,207 Australia and New Zealand 2,407 1,261 2,472 Asia 2,025 1,109 2,257 Rest of world 1,260 648 1,580 Black Library 1,272 1,187 2,296 ------------- ------------- ------------- Total Trade 47,961 29,341 61,254 ------------- ------------- ------------- Retail UK 13,077 10,275 22,474 Continental Europe 10,321 7,869 16,859 North America 10,587 7,141 16,759 Australia and New Zealand 4,586 3,338 7,471 Asia 1,044 545 1,285 ------------- ------------- ------------- Total Retail 39,615 29,168 64,848 ------------- ------------- ------------- Mail order 21,276 12,426 32,012 ------------- ------------- ------------- Total external revenue 108,852 70,935 158,114 ======== ======== ======== *Segment revenue of £5,915,000 for the six months to 27 November 2016 previously reported as non-core trade has been reclassified within the trade segment as UK and Continental Europe (£2,542,000), North America (£1,047,000), Australia and New Zealand (£128,000), Asia (£363,000), Rest of world (£648,000) and Black Library (£1,187,000) to reflect the management structure in place at 28 May 2017 and 26 November 2017. Segment revenue of £1,752,000 for the six months to 27 November 2016 previously reported as non-core retail has been reclassified within the retail segment as UK (£1,648,000), North America (£97,000) and Asia (£7,000) to reflect the management structure in place at 28 May 2017 and 26 November 2017. In addition mail order segment revenue of £2,143,000 for the six months to 27 November 2016 previously reported as non-core mail order and £10,283,000 previously reported as Citadel and Forge World are now reported together as Mail order which reflects the management structure in place at 28 May 2017 and 26 November 2017.
Operating expenses by segment are regularly reviewed by the executive directors and are provided below:
Six months to
Restated*
Six months to
Year to 26 November 27 November 28 May 2017 2016 2017 £000 £000 £000 Trade (5,734) (5,388) (10,855) Retail (23,020) (21,222) (42,849) Mail order (2,719) (2,595) (5,290) Product and supply (1,412) (1,261) (2,618) Central costs (3,743) (3,143) (6,215) Service centre costs (6,360) (4,738) (11,824) Royalties (352) (192) (371) ------------- ------------- ------------- Total segment operating expenses (43,340) (38,539) (80,022) Share-based payment charge (60) (82) (160) Profit share scheme charge (1,025) (444) (444) Discretionary payment to employees - - (2,965) ------------- ------------- ------------ Total group operating expenses (44,425) (39,065) (83,591) ======== ======== ======== *Operating expenses of £18,000 for the six months to 27 November 2016 relating to certain marketing costs have been reclassified from product and supply to central costs which reflects the management structure in place at 28 May 2017 and 26 November 2017.

3. Segment information continued
Total segment operating profit is as follows and is reconciled to profit before taxation below:
Six months to
Restated* Six months to
Year to 26 November 27 November 28 May 2017 2016 2017 £000 £000 £000 Trade 13,471 8,791 17,956 Retail 1,813 (2,369) 461 Mail order 13,626 6,651 18,788 Product and supply 17,901 6,356 16,286 Central costs (4,397) (3,406) (6,724) Service centre costs (6,360) (4,738) (11,824) Royalties 3,804 2,999 6,949 ------------- ------------- ---------- Total segment operating profit 39,858 14,284 41,892 Share-based payment charge (60) (82) (160) Profit share scheme charge (1,025) (444) (444) Discretionary payment to employees - - (2,965) ------------- ------------- ---------- Total group operating profit 38,773 13,758 38,323 Finance income 51 29 87 Finance costs (50) - (7) ------------- ------------- ------------- Profit before taxation 38,774 13,787 38,403 ======== ======== ======== *A segment loss of £281,000 for the six months to 27 November 2016 relating to certain marketing costs has been reclassified from product and supply to central costs. This reflects the management structure in place at 28 May 2017 and 26 November 2017.
4. Dividends Dividends of £6,428,000 (20 pence per share) and £11,248,000 (35 pence per share) were declared and paid in the six months to 26 November 2017. In addition a further £1,901,000 (6 pence per share) was distributed in the six months to 26 November 2017 by way of a rectification dividend. The rectification dividend was satisfied by the release of Company shareholders from the liability to repay the amount received in the year ended 28 May 2017 in the form of an unlawful dividend. A dividend of £8,031,000 (25 pence per share) was declared and paid in the six months to 27 November 2016. Dividends of £8,031,000 (25 pence per share), £9,638,000 (30 pence per share), and £6,132,000 (19 pence per share) were declared and paid during the year ended 28 May 2017. 5. Profit before taxation The following costs have been incurred in the reported periods in respect of ongoing redundancies, inventory provisions, impairments and loss-making retail stores:
Six months to
Six months to
Year to 26 November 27 November 28 May
2017 2016 2017 £000 £000 £000 Redundancy costs and compensation for loss of office 177 345 1,009 (Reversal) of/charge for impairment of property, plant and equipment (17) 16 (55) Charge for impairment of computer software - - 833 Net charge/(credit) to property provisions including closed or loss-making retail stores 28 197 (185) Net inventory provision creation 1,610 235 1,376 6. Tax The taxation charge for the six months to 26 November 2017 is based on an estimate of the full year effective rate of 19.0% (2016: 20.7%). Although overseas tax rates are higher than the UK rate of 19%, these are offset by the release of prior provisions against tax uncertainties.

7. Earnings per share Basic earnings per share Basic earnings per share is calculated by dividing the profit attributable to owners of the parent by the weighted average number of ordinary shares in issue throughout the relevant period.
Six months to
Six months to
Year to 26 November 27 November 28 May 2017 2016 2017 Profit attributable to owners of the parent (£000) 31,403 10,930 30,547 ------------- ------------- ------------- Weighted average number of ordinary shares in issue (thousands) 32,166 32,121 32,126 ------------- ------------- ------------- Basic earnings per share (pence per share) 97.6 34.0 95.1
======== ======== ========
Basic earnings per share pre-change in accounting estimates Basic earnings per share pre-change in accounting estimates is calculated by dividing the profit attributable to owners of the parent, before the impact of the change in accounting estimates, by the weighted average number of ordinary shares in issue throughout the relevant period.
Six months to
Six months to
Year to 26 November 27 November 28 May 2017 2016 2017 Profit attributable to owners of the parent pre-change in accounting estimates (£000) 30,404 10,286 29,305 ------------- ------------- ------------- Weighted average number of ordinary shares in issue (thousands) 32,166 32,121 32,126 ------------- ------------- ------------- Basic earnings per share pre-change in accounting estimates (pence per share) 94.5 32.0 91.2 ======== ======== ======== Diluted earnings per share The calculation of diluted earnings per share has been based on the profit attributable to owners of the parent and the weighted average number of shares in issue throughout the relevant period, adjusted for the dilution effect of share options outstanding at the period end.
Six months to
Six months to
Year to 26 November 27 November 28 May 2017 2016 2017 Profit attributable to owners of the parent (£000) 31,403 10,930 30,547 ------------- ------------- ------------- Weighted average number of ordinary shares in issue (thousands) 32,166 32,121 32,126 Adjustment for share options (thousands) 280 77 199 ------------- ------------- ------------- Weighted average number of ordinary shares for diluted earnings per share (thousands)
32,446
32,198
32,325
------------- ------------- ------------- Diluted earnings per share (pence per share) 96.8 33.9 94.5
======== ======== ========
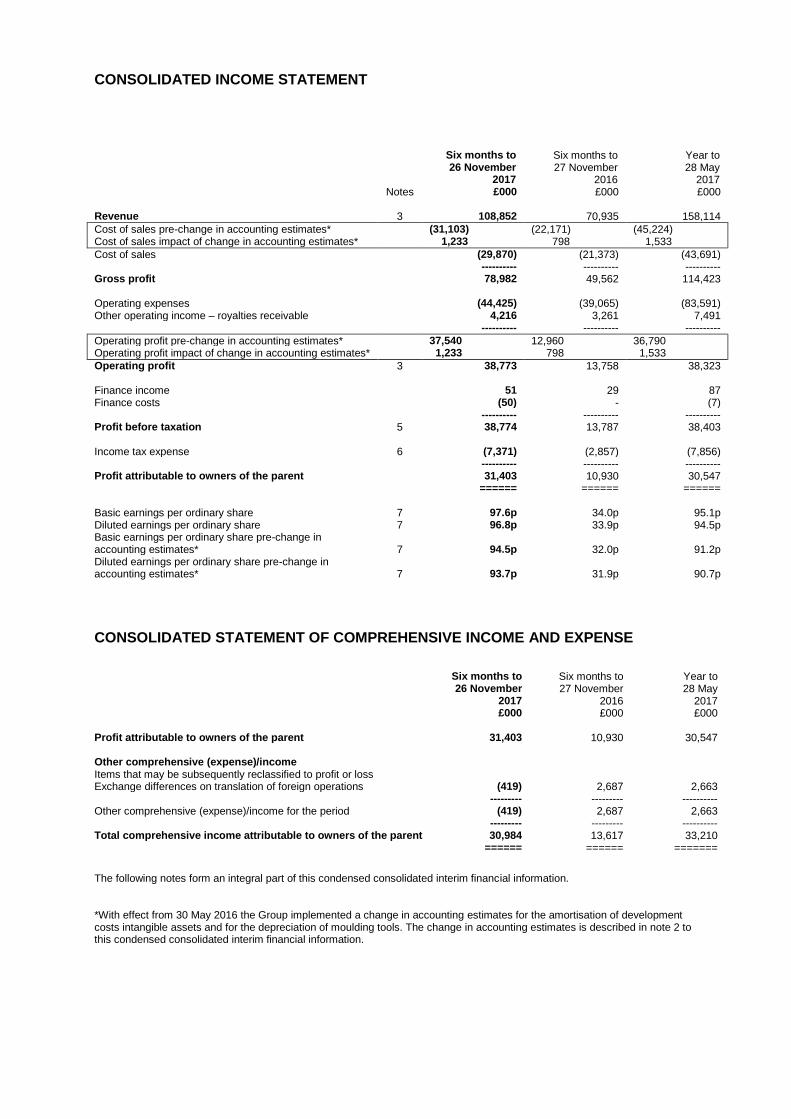
7. Earnings per share continued Diluted earnings per share pre-change in accounting estimates The calculation of diluted earnings per share has been based on the profit attributable to owners of the parent, before the impact of the change in accounting estimates, and the weighted average number of shares in issue throughout the relevant period, adjusted for the dilution effect of share options outstanding at the period end.
Six months to
Six months to
Year to 26 November 27 November 28 May 2017 2016 2017 Profit attributable to owners of the parent pre-change in accounting estimates (£000) 30,404 10,286 29,305 ------------- ------------- ------------- Weighted average number of ordinary shares in issue (thousands) 32,166 32,121 32,126 Adjustment for share options (thousands) 280 77 199 ------------- ------------- ------------- Weighted average number of ordinary shares for diluted earnings per share (thousands)
32,446
32,198
32,325
------------- ------------- ------------- Diluted earnings per share pre-change in accounting estimates (pence per share) 93.7 31.9 90.7 ======== ======== ======== 8. Reconciliation of profit to net cash from operating activities
Six months to
Six months to
Year to 26 November 27 November 28 May 2017 2016 2017 £000 £000 £000 Operating profit 38,773 13,758 38,323 Depreciation of property, plant and equipment 2,635 3,156 6,107 Net (reversal) of impairment/impairment of property, plant and equipment (17) 16 (55) Loss on disposal of property, plant and equipment 20 23 111 Impairment of intangible assets - - 833 Loss on disposal of intangible assets - - 14 Amortisation of capitalised development costs 1,630 1,557 2,900 Amortisation of other intangibles 651 604 1,217 Share-based payments 60 82 160 Changes in working capital: -Increase in inventories (4,128) (1,805) (2,984) -Increase in trade and other receivables (4,813) (1,298) (379) -Increase in trade and other payables 6,279 3,585 3,491 -Increase/(decrease) in provisions 116 (57) (368) ---------- ---------- --------- Net cash from operating activities 41,206 19,621 49,370 ====== ====== ====== 9. Other intangible assets 26 November 27 November 28 May 2017 2016 2017 £000 £000 £000 Net book value at beginning of period 12,917 10,501 10,501 Additions 3,635 4,479 7,376 Exchange differences - 5 4 Disposals - - (14) Amortisation charge (2,281) (2,161) (4,117) Impairment - - (833) ---------- ---------- ---------- Net book value at end of period 14,271 12,824 12,917
====== ====== ======

10. Property, plant and equipment 26 November 27 November 28 May 2017 2016 2017 £000 £000 £000 Net book value at beginning of period 22,132 22,621 22,621 Additions 4,912 2,348 5,372 Exchange differences (39) 338 302 Disposals (20) (23) (111) Charge for the period (2,635) (3,156) (6,107) Reversal of impairment/(impairment) 17 (16) 55 ---------- ---------- ---------- Net book value at end of period 24,367 22,112 22,132 ====== ====== ====== 11. Provisions for other liabilities and charges Analysis of total provisions: 26 November 27 November 28 May 2017 2016 2017 £000 £000 £000 Current 757 838 689 Non-current 536 662 495 ---------- ---------- ---------- 1,293 1,500 1,184 ====== ====== ====== Employee Other benefits Property Total £000 £000 £000 £000 At 29 May 2016 - 547 897 1,444 Charged to the income statement - 99 197 296 Exchange differences - 53 60 113 Utilised - (47) (306) (353) ---------- ---------- ---------- ---------- At 27 November 2016 - 652 848 1,500 ====== ====== ====== ======
Employee Other benefits Property Total £000 £000 £000 £000 At 29 May 2016 - 547 897 1,444 Charged/(credited) to the income statement - 153 (185) (32) Exchange differences - 47 57 104 Utilised - (67) (265) (332) -------- -------- -------- ---------- At 28 May 2017 - 680 504 1,184 Charged to the income statement 50 150 28 228 Exchange differences (1) (5) (6) (12) Utilised - (61) (46) (107) ---------- ---------- ---------- ---------- At 26 November 2017 49 764 480 1,293 ====== ====== ====== ====== 12. Seasonality The Group’s monthly sales profile demonstrates an element of seasonality around the Christmas period which impacts sales in the month of December. 13. Commitments
Capital expenditure contracted for at the balance sheet date but not yet incurred is £2,480,000 (2016: £996,000).
14. Related-party transactions There were no material related-party transactions during the period.