gama aviation plc half year results 2017
TRANSCRIPT
Gama Aviation PlcHalf year results 2017
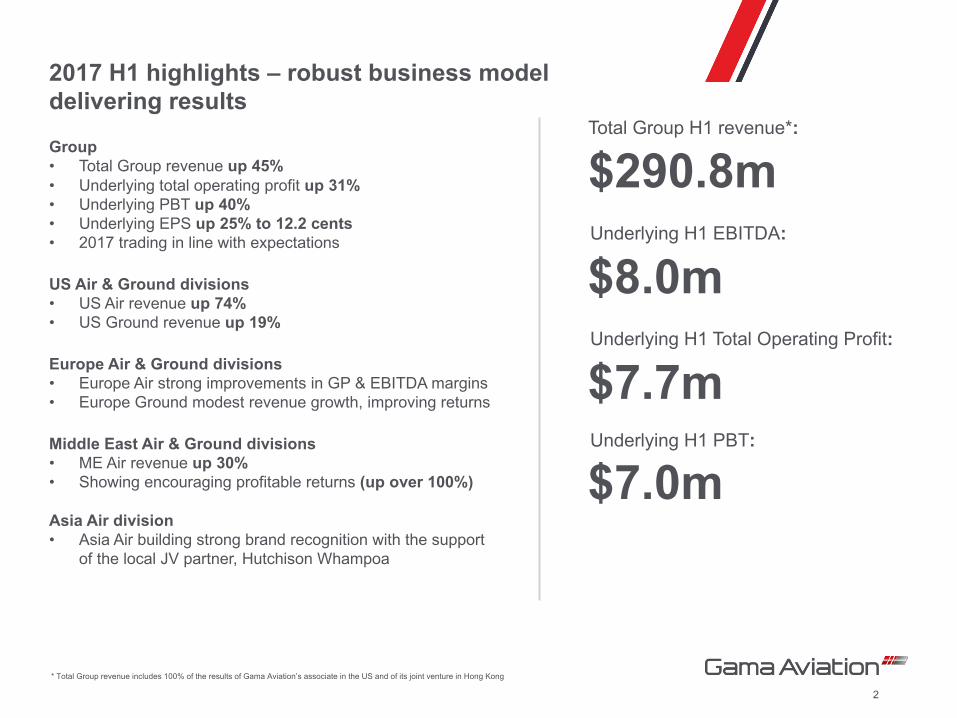
2017 H1 highlights – robust business modeldelivering results
Group• Total Group revenue up 45%• Underlying total operating profit up 31%• Underlying PBT up 40%• Underlying EPS up 25% to 12.2 cents• 2017 trading in line with expectations
US Air & Ground divisions• US Air revenue up 74%• US Ground revenue up 19%
Europe Air & Ground divisions• Europe Air strong improvements in GP & EBITDA margins• Europe Ground modest revenue growth, improving returns
Middle East Air & Ground divisions• ME Air revenue up 30%• Showing encouraging profitable returns (up over 100%)
Asia Air division• Asia Air building strong brand recognition with the support
of the local JV partner, Hutchison Whampoa
Total Group H1 revenue*:
$290.8mUnderlying H1 EBITDA:
$8.0m
Underlying H1 PBT:
$7.0m
* Total Group revenue includes 100% of the results of Gama Aviation’s associate in the US and of its joint venture in Hong Kong
Underlying H1 Total Operating Profit:
$7.7m
2
Company overview
Growing global multi-disciplined aviation services business • Leading positions in highly fragmented markets
• Good forward visibility with over 70% of gross profit contracted
• Associate in the US with BBA Aviation Plc and JV in the Far East with Hutchinson Whampoa
• Management substantially aligned with shareholders and own over 30% of the issued share capital
Robust & resilient business model with two established and complementary divisions• Air division with total operating profit margin target of 5%, currently at 2.9%
• Ground division with total operating profit margin target of 20%, currently at 13.6%
Capital light business model with low risk profile• No exposure to aircraft residual value risk
• No exposure to fuel variations
• Gross profits derived from availability of aircraft not usage
3
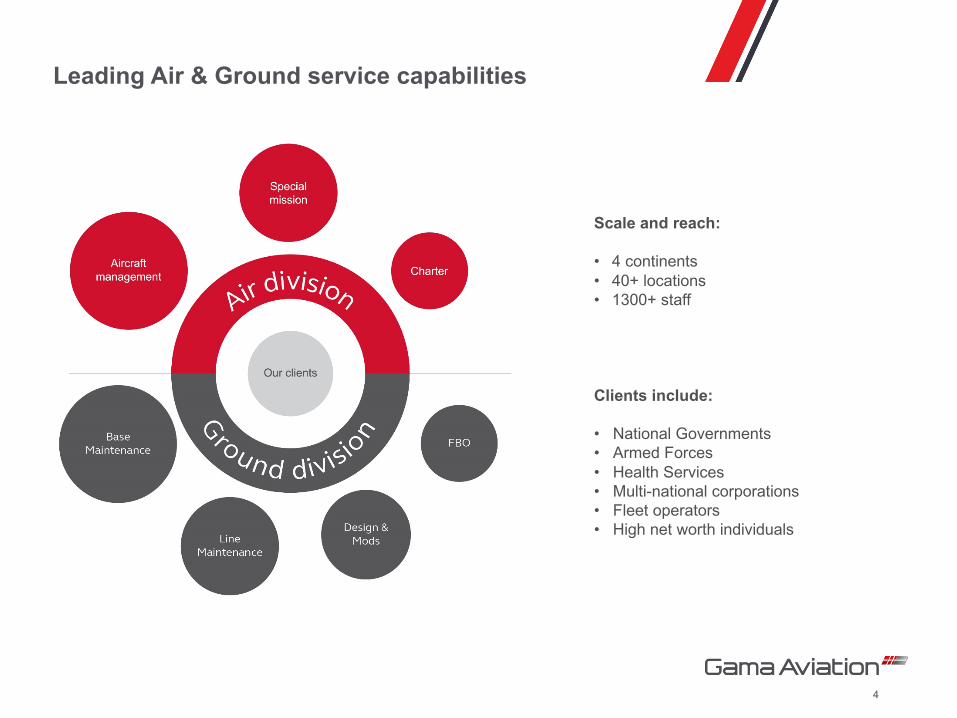
Leading Air & Ground service capabilities
Scale and reach:
• 4 continents • 40+ locations • 1300+ staff
Clients include:
• National Governments• Armed Forces• Health Services• Multi-national corporations• Fleet operators • High net worth individuals
4
2017 H1Financial review
Financial highlights 2017 H1
June 17 June 16Constant currency2
June 16
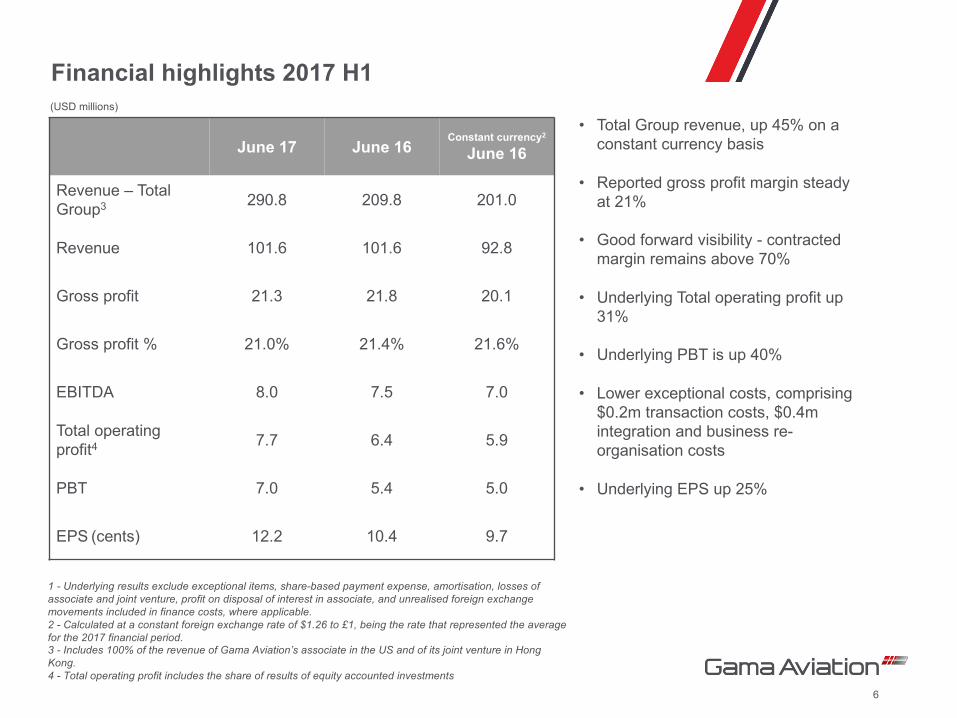
Revenue – Total Group3 290.8 209.8 201.0
Revenue 101.6 101.6 92.8
Gross profit 21.3 21.8 20.1
Gross profit % 21.0% 21.4% 21.6%
EBITDA 8.0 7.5 7.0
Total operating profit4 7.7 6.4 5.9
PBT 7.0 5.4 5.0
EPS (cents) 12.2 10.4 9.7
• Total Group revenue, up 45% on a constant currency basis
• Reported gross profit margin steady at 21%
• Good forward visibility - contracted margin remains above 70%
• Underlying Total operating profit up 31%
• Underlying PBT is up 40%
• Lower exceptional costs, comprising $0.2m transaction costs, $0.4m integration and business re-organisation costs
• Underlying EPS up 25%
1 - Underlying results exclude exceptional items, share-based payment expense, amortisation, losses of associate and joint venture, profit on disposal of interest in associate, and unrealised foreign exchange movements included in finance costs, where applicable.2 - Calculated at a constant foreign exchange rate of $1.26 to £1, being the rate that represented the average for the 2017 financial period.3 - Includes 100% of the revenue of Gama Aviation’s associate in the US and of its joint venture in Hong Kong. 4 - Total operating profit includes the share of results of equity accounted investments
(USD millions)
6
Cash 2017 H1
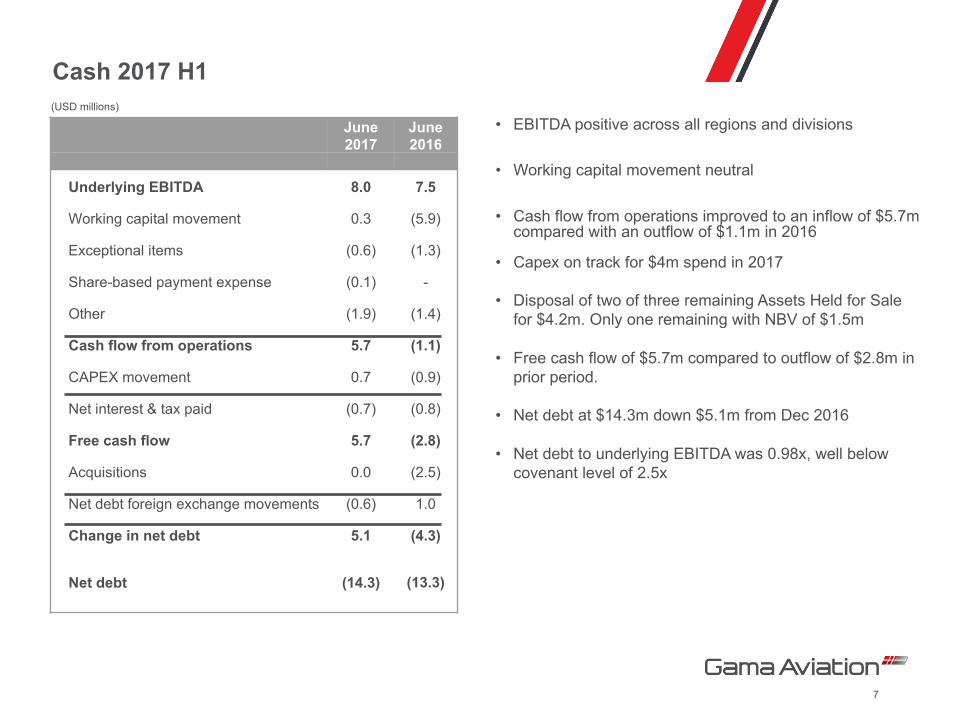
• EBITDA positive across all regions and divisions
• Working capital movement neutral
• Cash flow from operations improved to an inflow of $5.7m compared with an outflow of $1.1m in 2016
• Capex on track for $4m spend in 2017
• Disposal of two of three remaining Assets Held for Sale for $4.2m. Only one remaining with NBV of $1.5m
• Free cash flow of $5.7m compared to outflow of $2.8m in prior period.
• Net debt at $14.3m down $5.1m from Dec 2016
• Net debt to underlying EBITDA was 0.98x, well below covenant level of 2.5x
June2017
June2016
Underlying EBITDA 8.0 7.5
Working capital movement 0.3 (5.9)
Exceptional items (0.6) (1.3)
Share-based payment expense (0.1) -
Other (1.9) (1.4)
Cash flow from operations 5.7 (1.1)
CAPEX movement 0.7 (0.9)
Net interest & tax paid (0.7) (0.8)
Free cash flow 5.7 (2.8)
Acquisitions 0.0 (2.5)
Net debt foreign exchange movements (0.6) 1.0
Change in net debt 5.1 (4.3)
Net debt (14.3) (13.3)
7
(USD millions)
Strong Air performance
US Europe Middle East Asia Total
2017 2016 2017 2016 2017 2016 2017 2016 2017 2016
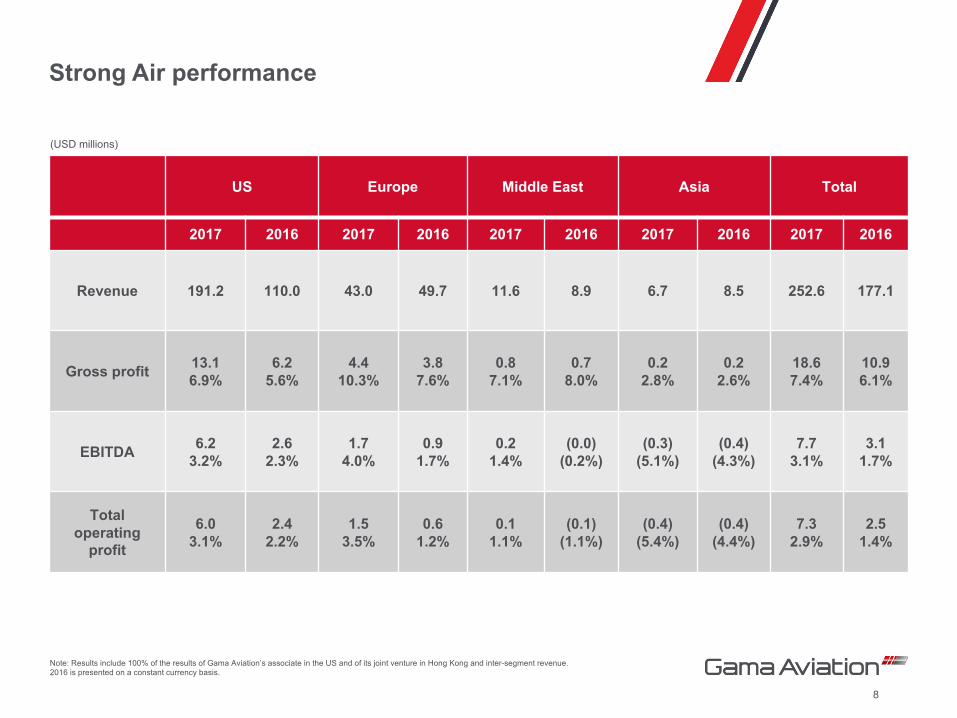
Revenue 191.2 110.0 43.0 49.7 11.6 8.9 6.7 8.5 252.6 177.1
Gross profit 13.16.9%
6.25.6%
4.410.3%
3.87.6%
0.87.1%
0.78.0%
0.22.8%
0.22.6%
18.67.4%
10.96.1%
EBITDA 6.23.2%
2.62.3%
1.74.0%
0.91.7%
0.21.4%
(0.0)(0.2%)
(0.3)(5.1%)
(0.4)(4.3%)
7.73.1%
3.11.7%
Totaloperating
profit
6.03.1%
2.42.2%
1.53.5%
0.61.2%
0.11.1%
(0.1)(1.1%)
(0.4)(5.4%)
(0.4)(4.4%)
7.32.9%
2.51.4%
(USD millions)
Note: Results include 100% of the results of Gama Aviation’s associate in the US and of its joint venture in Hong Kong and inter-segment revenue. 2016 is presented on a constant currency basis.
8
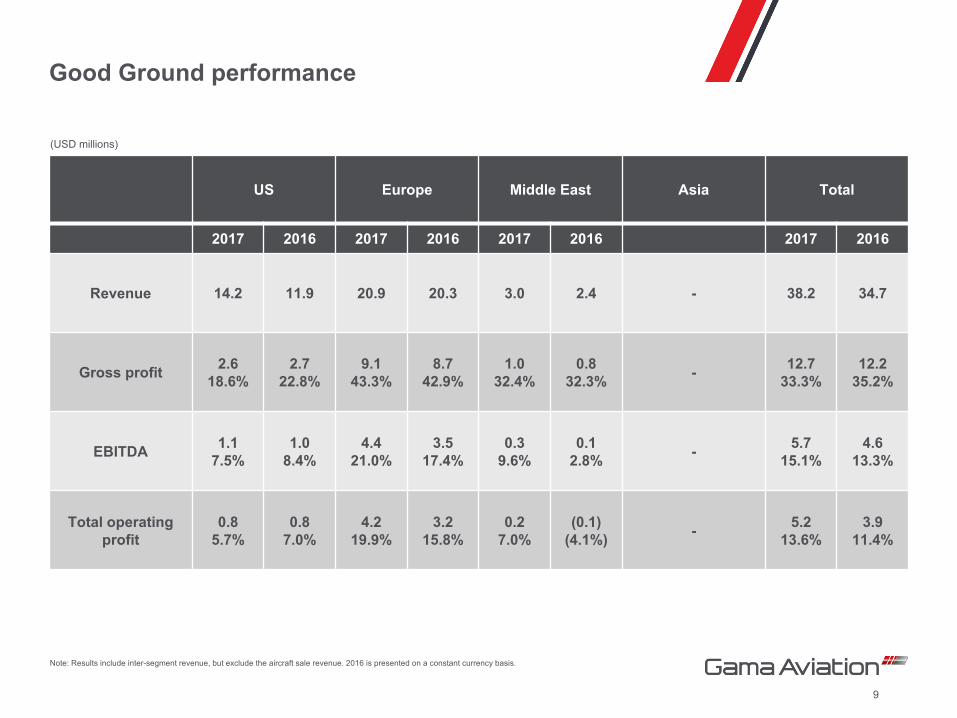
Good Ground performance
(USD millions)
US Europe Middle East Asia Total
2017 2016 2017 2016 2017 2016 2017 2016
Revenue 14.2 11.9 20.9 20.3 3.0 2.4 - 38.2 34.7
Gross profit 2.618.6%
2.722.8%
9.143.3%
8.742.9%
1.032.4%
0.832.3% - 12.7
33.3%12.2
35.2%
EBITDA 1.17.5%
1.08.4%
4.421.0%
3.517.4%
0.39.6%
0.12.8% - 5.7
15.1%4.6
13.3%
Total operating profit
0.85.7%
0.87.0%
4.219.9%
3.215.8%
0.27.0%
(0.1)(4.1%) - 5.2
13.6%3.9
11.4%
Note: Results include inter-segment revenue, but exclude the aircraft sale revenue. 2016 is presented on a constant currency basis.
9
Strategy & outlook
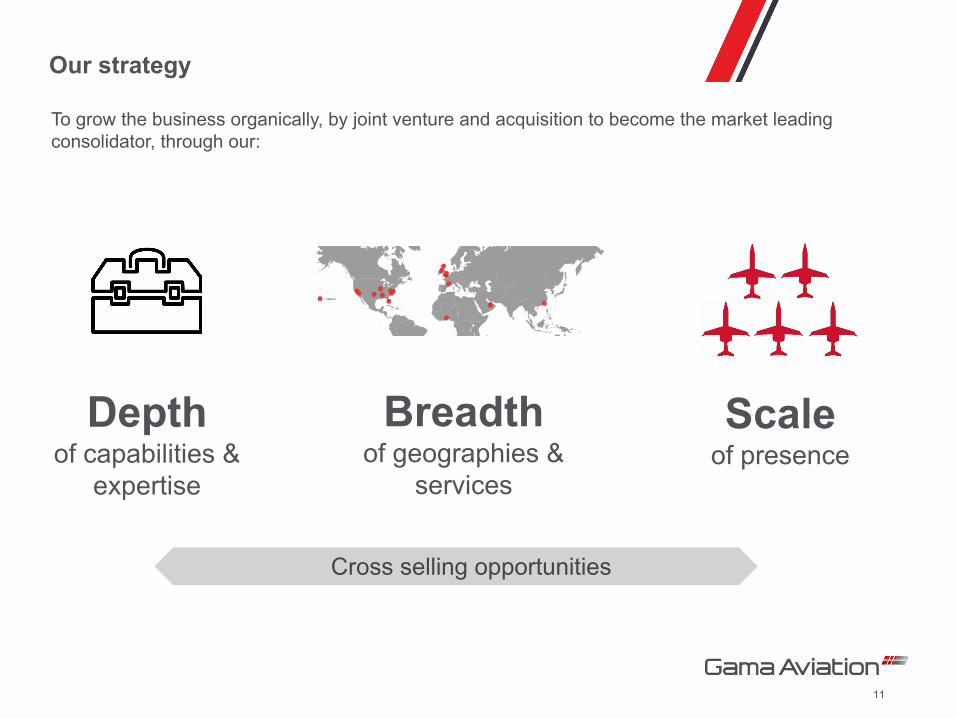
Our strategy
Scale of presence
Breadth of geographies &
services
To grow the business organically, by joint venture and acquisition to become the market leading consolidator, through our:
Depth of capabilities &
expertise
Cross selling opportunities
11
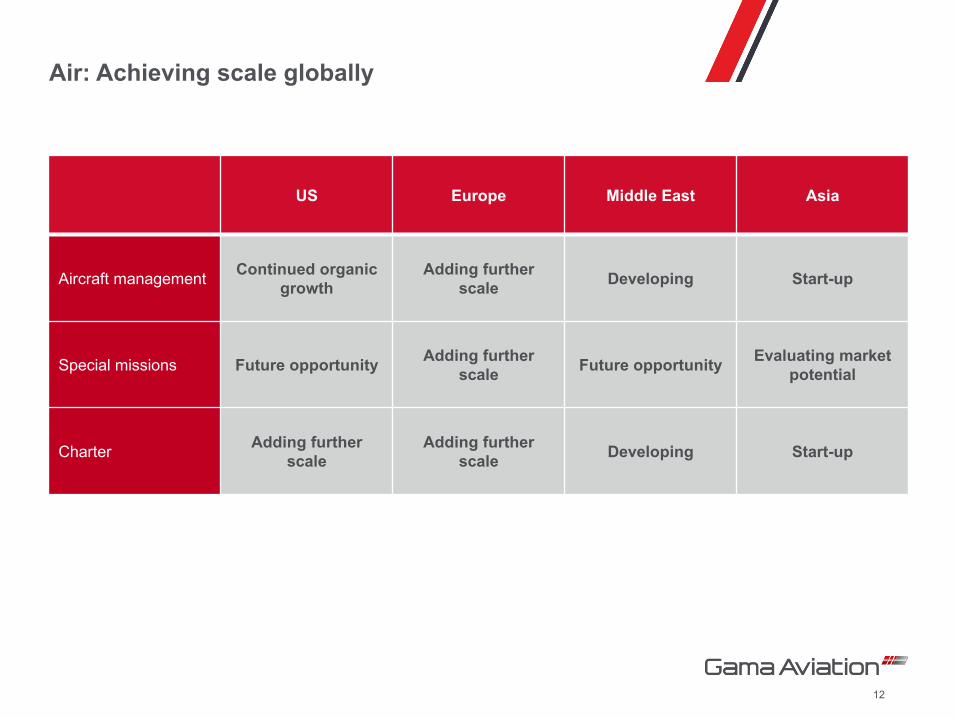
Air: Achieving scale globally
US Europe Middle East Asia
Aircraft management Continued organic growth
Adding further scale Developing Start-up
Special missions Future opportunity Adding further scale Future opportunity Evaluating market
potential
Charter Adding furtherscale
Adding further scale Developing Start-up
12

Ground: increasing depth of service & leveraging scale
US Europe Middle East Asia
Base maintenance Evaluatingopportunities
Adding furtherscale Future opportunity Launching
Line maintenance Adding furtherscale Developing Developing Launching
Design & modifications Future opportunity Adding further
scale Future opportunity Evaluate market potential
FBO services N/A Developing Developing Evaluate market potential
13
Update on acquisitions and JVs
Bolt-on acquisitions• 2016 acquisitions: Aviation Beauport and FlyerTech are fully integrated and performing
above expectations
BBA merger and integration proceeding as planned • Market leading platform to expand Gama Aviation’s US presence
• National US coast to coast coverage
• Diversification of client base
• Significant additional cross selling opportunities for US Ground
• On track to deliver significant cost synergies of not less than $2m over two years
CASL collaboration • Proceeding as planned
• Regulatory approvals obtained
• Revenue generating in Q4 2017
14
Summary & outlook
• Strength and resilience of business model demonstrable
• Cash generative characteristics of business increasingly evident
• Capital light business with low risk profile
• Fragmented market place providing opportunities for growth and value accretive deals
• Confident in meeting full year expectations
• Capital Markets afternoon: Thursday 21st September 2017 at Farnborough Airport
15
Appendix one
The Board

Appendix one: The Gama Aviation Board
Executive Board members
Non-executive Board members
Marwan Khalek, CEO Kevin Godley, CFO Steve Wright, Executive Director
Sir Ralph Robins, Chairman Peter Brown Michael Peagram
17
Appendix two
Top 10 shareholdings
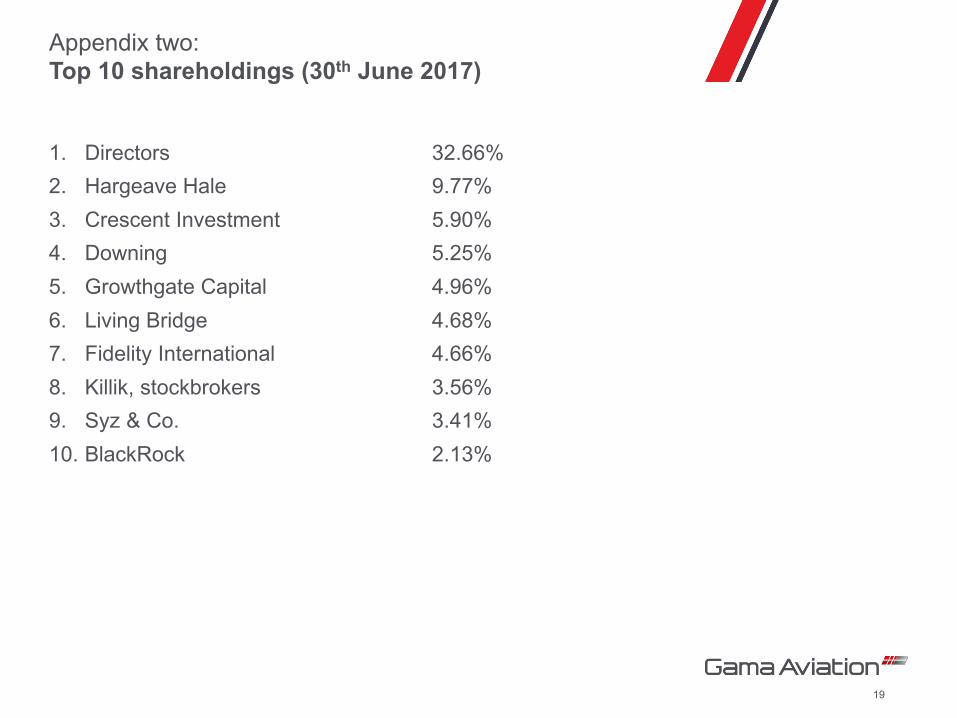
Appendix two: Top 10 shareholdings (30th June 2017)
1. Directors 32.66%2. Hargeave Hale 9.77%3. Crescent Investment 5.90%4. Downing 5.25%5. Growthgate Capital 4.96%6. Living Bridge 4.68%7. Fidelity International 4.66%8. Killik, stockbrokers 3.56%9. Syz & Co. 3.41%10. BlackRock 2.13%
19
Appendix three
Summary of locations and services
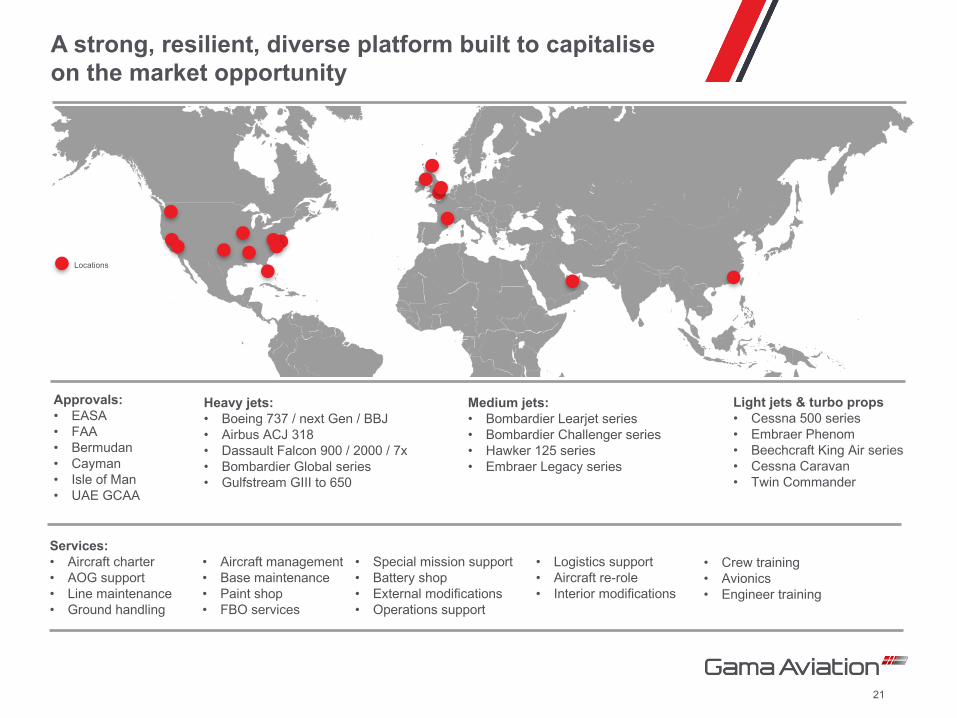
A strong, resilient, diverse platform built to capitalise on the market opportunity
Approvals:• EASA• FAA• Bermudan• Cayman• Isle of Man• UAE GCAA
Heavy jets:• Boeing 737 / next Gen / BBJ• Airbus ACJ 318• Dassault Falcon 900 / 2000 / 7x• Bombardier Global series• Gulfstream GIII to 650
Medium jets:• Bombardier Learjet series• Bombardier Challenger series• Hawker 125 series• Embraer Legacy series
Light jets & turbo props• Cessna 500 series• Embraer Phenom• Beechcraft King Air series• Cessna Caravan• Twin Commander
Locations
Services:• Aircraft charter• AOG support• Line maintenance• Ground handling
• Aircraft management• Base maintenance• Paint shop• FBO services
• Special mission support• Battery shop• External modifications• Operations support
• Logistics support• Aircraft re-role• Interior modifications
• Crew training • Avionics• Engineer training
21

Disclaimer
This presentation contains forward looking statements, which are based on the Gama Aviation Board's current expectationsand assumptions and may involve known and unknown risks and uncertainties that could cause actual results,performance or events to differ materially from those expressed or implied in such statements. Any forward lookingstatements contained in this presentation are based on past trends or activities and should not be taken as arepresentation that such trends or activities will continue in the future.
It is believed that the expectations reflected in these statements are reasonable, but they may be affected by a number ofvariables which could cause actual results or trends to differ materially, including, but not limited to: conditions in themarket, market position of Gama Aviation and its technologies, earnings, financial position, cash flows, anticipatedinvestments and economic conditions; the Group's ability to obtain capital/additional finance; a reduction in demand bycustomers; an increase in competition; an unexpected decline in revenue or profitability; legislative, fiscal and regulatorydevelopments, including, but not limited to, changes in environmental regulations.
No statement in this presentation is intended to constitute a profit forecast, nor should any statements be interpreted tomean that potential commercial opportunities, earnings or earnings per share will necessarily be greater or lesser thanthose for the relevant preceding financial periods for the Group. Each forward looking statement relates only as of the dateof the particular statement. Except as required by the AIM Rules, the Disclosure and Transparency Rules, the LondonStock Exchange or otherwise by law, the Group expressly disclaims any obligation or undertaking to release publicly anyupdates or revisions to any forward looking statements contained herein to reflect any change in the Group's expectationswith regard thereto or any change in events, conditions or circumstances on which any such statement is based.
The information in this presentation does not constitute an offer to sell or an invitation to buy shares in Gama Aviation Plcor an invitation or inducement to engage in any other investment activity.
22