bba aviation plc 2017 interim financial report … aviation plc – interim results, 1 august 2017 2...
TRANSCRIPT

1
BBA Aviation plc
2017 Interim Financial Report
Results for the half year ended
30 June 2017
For further information please contact: David Crook, Group Finance Director (020) 7514 3999 Matt Denham, Investor Relations BBA AVIATION PLC
David Allchurch/Michelle Clarke (020) 7353 4200 TULCHAN COMMUNICATIONS
A video with Wayne Edmunds, Interim Group Chief Executive, and David Crook, Group Finance Director, is now available on www.bbaaviation.com A live audio webcast of the analyst presentation will be available from 09:00 today on www.bbaaviation.com

BBA Aviation plc – Interim Results, 1 August 2017
2
INTERIM FINANCIAL REPORT FOR PERIOD ENDED 30 JUNE 2017
GROUP
Underlying results1 Statutory results H1 2017 H1 2016 H1 2017 H1 2016
$m Continuing Total2 Continuing Total2 % Change3 Continuing Total2 Continuing Total2 % Change3
Revenue 1,145.5 1,183.7 1,020.6 1,229.4 12.2% 1,145.5 1,183.7 1,020.6 1,229.4 12.2% EBITDA 218.0 217.8 178.6 195.3 22.1% 212.7 212.5 156.3 173.0 36.1% Operating profit 174.9 174.7 135.6 149.6 29.0% 122.9 122.7 62.1 75.4 97.9% Profit/(loss) before tax 143.5 143.3 105.5 119.4 36.0% 91.5 84.7 (153.3) (269.0) Profit/(loss) after tax 117.3 117.1 88.0 100.3 33.3% 84.6 52.5 (129.7) (247.0) Basic adjusted earnings /(loss) per share4
11.4¢ 11.4¢ 8.6¢ 9.8¢ 32.6% 8.2¢ 5.1¢ (12.7)¢ (24.1)¢
Return on invested capital5
10.7% 10.1% 60bps
Free cash flow 56.6 91.7 (38.3)% Net debt5 (1,256.3) (1,335.3) (5.9)% Dividend per share 3.81¢ 3.63¢ 5.0%
1. Adjusted performance measures are defined in note 17 2. Total includes discontinued operations 3. % change based on continuing operations for operating performance 4. Statutory measure is basic earnings per share 5. 2016 return on invested capital and net debt are for the full year
Highlights
Continuing underlying operating profit up 29% to $174.9 million; enlarged Signature network performing well
Divisional summary: o Flight Support (86% of continuing Group underlying OP)
Organic revenue up 3.2% and operating profit up 13.6%, with strong drop through US B&GA market up 3% in H1 Network contract negotiations with Signature’s largest customers successfully concluded Short-term negative impact on fuel volumes relative to market
o Aftermarket Services (14% of continuing Group underlying OP)
Operating profit growth of 134% to $26.0m, driven by Ontic Ontic – GE avionics delivering as expected, good contribution from 2016 licence acquisitions ERO – improved operating performance H1 2017 vs H1 2016, stable vs H2 2016
Sale of ASIG for $202m completed 31 January 2017
Statutory continuing operating profit increased by 97.9% in H1 2017 compared to H1 2016
Free cash flow of $56.6 million, de-levered to 2.9x net debt/EBITDA as anticipated (FY 2016: 3.1x on covenant basis)
Group ROIC increased by 0.6% points to 10.7%
Basic adjusted EPS increased by 32.6% to 11.4¢
Interim dividend increased by 5% to 3.81¢ cents reflecting continued confidence in the Group’s future growth prospects
Wayne Edmunds, BBA Aviation Interim Group Chief Executive, commented:
“We are pleased with BBA Aviation’s performance overall in the first half of 2017. Against the background of a US B&GA market that grew 3%, we are making encouraging progress in delivering the benefits of Signature’s unique global network of FBOs. We successfully concluded during the first half of the year negotiations with our largest customers regarding the delivery of our services across the enlarged, market-leading network and believe that the outcome demonstrates Signature’s unrivalled ability to satisfy the needs of its customer base. Although we experienced a short-term negative impact on volumes relative to market during the period, Signature’s strong drop through continues to demonstrate our ability to grow underlying operating profit ahead of market growth. In Aftermarket Services, Ontic had a good first half and we are pleased with the contribution of the portfolio of legacy avionics products acquired from GE Aviation at the end of 2016. Ontic continues to have a strong pipeline of growth opportunities. Although ERO continues to be impacted by reduced legacy mid-cabin fixed wing flying, the slight improvement in operating performance seen in the second half of 2016 was maintained in to the first half of this year. In summary, the Board’s confidence of good growth in 2017 remains unchanged.”

BBA Aviation plc – Interim Results, 1 August 2017
3
INTERIM FINANCIAL REPORT 2017
Overview
BBA Aviation performed well in the first half of 2017 and made further progress with the implementation of its strategy. Flight Support (“Signature”) delivered good operating profit growth of 13.6% against US B&GA movements that grew 3% during the first six months of the year. With the Landmark Aviation acquisition successfully integrated in 2016, Signature is making encouraging headway in realising the benefits of its unique and high quality global network of FBOs and in enhancing its network performance. Ontic continues to perform well, with the legacy avionics business acquired from GE Aviation at the end of 2016 contributing as expected. While trading conditions in Engine Repair & Overhaul (ERO) remain challenging, the actions being taken to reduce the cost and complexity of this business supported a stable operating performance following the slight improvement during the second half of 2016. Continuing Group revenue increased by 12.2% to $1,145.5 million (H1 2016: $1,020.6 million) including a $74m contribution from acquisitions. Continuing Signature revenue increased 18.0%, reflecting organic growth of 3.2%, a $52.8m contribution from acquisitions - principally an additional month of contribution from the Landmark Aviation acquisition (completed February 2016) - and the net positive impact of higher fuel prices and adverse foreign exchange movements, which increased revenue by $45.9 million. Aftermarket Services revenue increased by 0.8% reflecting the contribution from the 2016 acquisitions in Ontic, largely offset by an organic revenue decrease in ERO. Continuing Group underlying operating profit was $174.9 million (H1 2016: $135.6 million). There was a good operating performance in Signature, with strong drop through and a $3.6 million net contribution from acquisitions less the impact of disposals completed in H1 2016. Underlying operating profit at Aftermarket Services more than doubled, including an $8.4 million contribution from acquisitions, and now accounts for 13.9% of the continuing Group. Ontic delivered as anticipated, and the slight improvements seen in ERO’s operating performance in the second half of 2016 were maintained in to the first half of 2017. Continuing Group underlying operating profit margin increased to 15.3% (H1 2016 constant fuel price: 12.6%) with positive margin development in Signature and Aftermarket Services. Net interest increased by $1.3 million to $31.4 million (H1 2016: $30.1 million), mostly due to higher interest rates and other interest costs offset partly by lower debt. Net debt decreased to $1,256.3 million (FY 2016: $1,335.3 million). Net debt to EBITDA reduced to 2.9x on a covenant basis (FY 2016: 3.1x) and 2.9x on a reported basis (FY 2016: 3.2x). Interest cover increased to 6.7x for the 12 months to 30 June 2017 (FY 2016: 6.5x). Continuing underlying profit before tax increased to $143.5 million (H1 2016: $105.5 million). The Group’s underlying tax rate for continuing operations was 18.3% (H1 2016: 16.6%). Adjusted earnings per share for continuing operations was up 32.6% to 11.4¢ (H1 2016: 8.6¢). Exceptional and other items after tax, for continuing and discontinued operations, totalled $64.6 million. Key components of this for continuing operations are the non cash amortisation of acquired intangibles ($46.7 million), restructuring expenses ($5.3 million) and a tax credit of $19.3 million. Discontinued operations includes the disposal of ASIG ($6.6 million) and an associated tax charge on the disposal ($25.3 million). Continuing statutory profit before tax was $91.5 million versus a $153.3 million statutory loss for the first half of 2016. The improvement arises principally from the lower level of exceptional and other items charged during the first six months of 2017, with the first six months of 2016 including impairment charges in relation to the assets of ERO and ASIG. Free cash inflow was $35.1 million lower at $56.6 million (H1 2016: $91.7 million). There was a $65.1 million outflow of working capital in the first half of 2017 (H1 2016: $9.3 million inflow, FY 2016: $36.1 million inflow) principally due to the expected reversal of the 2016 year end working capital outperformance for continuing operations and a working capital outflow of $24.8 million on ASIG discontinued operations prior to its disposal on 31 January 2017. It is expected that approximately $15 million of the further outflow on continuing operations will reverse in the second half. Gross capital expenditure amounted to $38.2 million (H1 2016: $49.6 million), including the construction of a new FBO terminal at Boeing Field, Seattle, which completed in June 2017. Cash flows on exceptional and other items are largely as a result of restructuring expenses. The Group made $2.1 million of pension scheme payments (H1 2016: $2.6 million). The Group’s tax payments during the period were $18.8 million (H1 2016: $7.0 million) and interest payments were $28.8 million (H1 2016: $29.5 million). The dividend payment was $91.5 million (H1 2016: $87.2 million). Total spend on acquisitions and licences completed during the period was $61.3 million (H1 2016: $2,092.0 million), which included $59.3 million for the GE Aviation avionics acquisition in Ontic. The first half of 2016 included the acquisition of Landmark Aviation for $2,086.9 million. Proceeds from disposals of $180.4 million (H1 2016: $186.5 million) relate to the disposal of ASIG, net of costs.

BBA Aviation plc – Interim Results, 1 August 2017
4
Return on Invested Capital (ROIC) increased to 10.7% (FY 2016: 10.1%). Business Review – Continuing Operations
Flight Support (86.1% of continuing operations’ underlying operating profit)
The Flight Support division (“Signature”) provides specialist on-airport services including refuelling and ground handling to the business & general aviation (B&GA) market.
$m H1 2017 H1 2016 % Change Revenue 802.8 680.5 18.0% Underlying operating profit 160.8 141.6 13.6% Underlying operating margin 20.0% 18.3%1 1.7% pts Statutory operating profit 119.7 77.4 54.7% Operating cash flow 154.0 145.8 5.6% Divisional return on invested capital 11.4% 11.2%* 0.2% pts
1 H1 2016 operating margin adjusted for constant fuel prices and disposals (unadjusted H1 2016 operating margin: 20.8%)
*Return on invested capital for full year 2016 Revenue at Signature increased by 18.0% to $802.8 million (H1 2016: $680.5 million). This included a $52.8 million contribution from acquisitions - principally an additional month of contribution from the Landmark Aviation acquisition (completed February 2016) - and the net positive impact of higher fuel prices and adverse foreign exchange movements, which increased revenue by $45.9 million. Signature’s organic revenue, excluding the contribution from acquisitions, increased by 3.2%. This was against the background of US B&GA movements up 3% and European B&GA movements up 6%. Following the successful integration of Landmark Aviation in 2016, Signature has focused on optimising its unique and high quality global network and on enhancing network performance. This has included Signature engaging during the first half of the year in negotiations with its customers regarding the provision of its services across the enlarged network, focusing initially on Signature’s heaviest users. During the first half, a range of important contract negotiations were successfully concluded, including with many of Signature’s largest customers, and the Group is confident that the outcome demonstrates the ability of Signature’s unrivalled network to deliver value and satisfy the needs of its customers. Signature is continuing to work with its broader customer base to deliver value across the network. As previously guided, Signature is focused on delivering underlying operating profit growth ahead of the growth in its market. Although there was a negative impact on fuel volumes in the first half of 2017 while negotiations with Signature’s customers were underway, drop through to profit was strong. Underlying operating profit at Signature increased by 13.6% to $160.8 million (H1 2016: $141.6 million) and on an organic basis, adjusting for the net impact of acquisitions and disposals ($3.6 million) and FX ($(0.9) million), increased by 12.4%. The Group remains confident in Signature’s ability to continue to deliver significant value creation across the enlarged network. Underlying operating margin was slightly lower at 20.0% (H1 2016: 20.8%) due primarily to the increase in fuel prices and disposals in 2016. After adjusting for constant fuel prices and disposals, Signature’s underlying operating margin increased by 1.7% points compared to the prior period. Statutory operating profit of $119.7 million has increased by 54.7% (H1 2016: $77.4 million). This increase is a result of organic growth, the impact of acquisitions, net of disposals and lower charges for exceptional and other items. Operating cash flow for continuing Signature improved to $154.0 million (H1 2016: $145.8 million), principally due to increased EBITDA from organic growth and the acquisition of Landmark Aviation, which completed in February 2016. Return on invested capital increased to 11.4% (FY 2016: 11.2%).
During the period, Signature continued to invest in its existing network, with the opening of its newly constructed facility at Boeing Field, Seattle. It also secured a new strategic lease at Washington Dulles International Airport, Virginia. The number of locations in the Group’s affiliate FBO programme, Signature SelectTM, remains at 18. The Group continues to see opportunities to expand the Signature SelectTM network. There are now 202 locations in Signature’s global network.

BBA Aviation plc – Interim Results, 1 August 2017
5
Aftermarket Services (13.9% of continuing operations’ underlying operating profit) The Aftermarket Services division is focused on the support of maturing aerospace platforms through Ontic, the Group’s Legacy Support business, and the repair and overhaul of engines through the Group’s Engine Repair and Overhaul (ERO) businesses.
$m H1 2017 H1 2016 % Change Revenue 342.7 340.1 0.8% Underlying operating profit 26.0 11.1 134.2% Underlying operating margin 7.6% 3.3% 430bps Statutory operating profit 16.7 1.8 827.8% Operating cash flow (14.7) (6.8) (116.2)% Divisional ROIC 10.2% 6.9%* 3.3% pts
*Return on invested capital for full year 2016
In Aftermarket Services, revenue increased by 0.8% to $342.7 million (H1 2016: $340.1 million). On an organic basis, adjusting for FX ($(6.3) million) and acquisitions ($21.2 million), revenue decreased by 3.7%. This decrease was driven by ERO. Underlying operating profit of $26.0 million increased by 134% (H1 2016: $11.1 million). Both Ontic and ERO contributed to the uplift in profitability. Growth at Ontic was driven by the acquisition of a portfolio of avionics products from GE Aviation at the end of last year and the 2016 licence acquisitions. In ERO, the improved operating performance seen in the second half of 2016 was maintained in to the first half of 2017. On an organic basis, operating profit increased 72.5%. Operating margins improved to 7.6% (H1 2016: 3.3%). Statutory operating profit of $16.7 million has increased by $14.9 million (H1 2016: $1.8 million), principally as a result of the improvement in underlying operating profit as outlined above. There was an operating cash outflow for the division of $14.7 million (H1 2016: $6.8 million outflow) reflecting the expected reversal of working capital outperformance from the year end offset by improved EBITDA, including the benefit of acquisitions. Return on invested capital increased to 10.2% (FY 2016: 6.9%). Ontic, the Group’s legacy support business, continues to perform well, with revenue increasing 34.2% to $94.2 million (H1
2016: $70.2 million). On an organic basis, revenue was up 8.6%. The first half performance included a significant contribution from the portfolio of legacy avionics products acquired from GE Aviation in December 2016. The acquired portfolio of products is delivering as expected and the transfer of the business into Ontic’s existing UK facility in Cheltenham is underway, with completion expected in the second half of 2017. Ontic also benefited from the licences added in 2016 with Ultra Electronics, for the Q400 PEC, and with Safran Nacelles, to support the Saab 2000 nacelles and AWACS CFM56 thrust reverser, together with the expansion last year of its licensor relationship with Pratt & Whitney Canada Corp, increasing its portfolio of JT15D products. Furthermore, Ontic benefited in the first six months of 2017 from initiatives being undertaken to achieve a more balanced annual performance profile. As such, a more even split is expected in Ontic’s performance between the first and second half of 2017 than in previous years. Ontic continues to assess a strong pipeline of opportunities in relation to new products and licence adoptions. Engine Repair and Overhaul’s revenue declined by $21.4 million to $248.5 million (H1 2016: $269.9 million). While
market conditions remain challenging, ERO’s operating performance was stable in the first half of 2017 following the slight improvement in the second half of 2016. Volumes in legacy mid-cabin engines and rotorcraft engine overhauls remained depressed through the period, with reduced workscopes and competitive pricing. Nevertheless, while the small thrust engine repair and overhaul market remains competitive and volatile month-to-month, ERO did see improvements in demand for overhauls in certain Pratt & Whitney and Tay markets, as well as market share gains for the TFE731 over the course of the first half. ERO’s footprint rationalisation programme is nearing completion. The new overhaul facility at Dallas Forth Worth (DFW) is successfully delivering the overhaul operations formerly undertaken at the Neosho and Forest Park facilities. The sale of the Forest Park site continues to be expected this year. It continues to be anticipated that ongoing operational improvements and cost reduction will help to improve flexibility, customer service and financial performance. Central costs
Underlying central costs have decreased during the first half of 2017 by $5.2 million to $11.9 million (H1 2016: $17.1 million). This primarily reflects the costs of supporting ASIG being absorbed under the transitional service agreement with John Menzies as part of the ASIG disposal.

BBA Aviation plc – Interim Results, 1 August 2017
6
Discontinued Operations
Discontinued operations for all periods presented include the results of the Group’s ASIG business. The disposal of ASIG, which completed on 31 January 2017, generated proceeds of $180.4 million, net of costs during the period. ASIG’s results are included up to the date of its disposal. Other Financial Information
Net debt reduced by $79.0 million to $1,256.3 million (FY 2016: $1,335.3 million). At 30 June 2017 the Group had total borrowings of $1,416.1 million (FY 2016 $1,547.7 million), obligations under finance leases of $1.5 million (FY 2016 $1.7 million) and cash and cash equivalents of $152.6 million for continuing operations (FY 2016: $182.5 million) and cash and cash equivalents for discontinued operations of $nil (FY 2016 $22.8 million). Net debt to EBITDA reduced to 2.9x on a covenant basis (FY 2016: 3.1x) and 2.9x on a reported basis (FY 2016: 3.2x). Interest cover increased to 6.7x for the 12 months to 30 June 2017 (FY 2016: 6.5x). Pensions
The Group’s net defined benefit pension and other post-retirement benefits liabilities reduced by $2.7 million during the first half of 2017 from $82.8 million at 31 December 2016 to $80.1 million at 30 June 2017, reflecting the favourable impact of better than expected returns on plan assets and employer contributions, more than offsetting the unfavourable impact of foreign exchange movements, net interest costs and administration expenses. Dividend
The Board is declaring an increased interim dividend of 3.81¢ (H1 2016: 3.63¢) up 5% on an underlying basis reflecting the Board’s progressive dividend policy and its continued confidence in the Group’s future growth prospects. Board Changes
As previously announced, Simon Pryce stood down as Group Chief Executive and from the Board with effect from 30 June 2017. Wayne Edmunds has been appointed Interim Group Chief Executive until the process of finding a permanent successor is complete. David Crook succeeded Mike Powell as Group Finance Director on 1 June 2017.
Outlook
We are pleased with BBA Aviation’s performance overall in the first half of 2017. Against the background of a US B&GA market that grew 3%, we are making encouraging progress in delivering the benefits of Signature’s unique global network of FBOs. We successfully concluded during the first half of the year negotiations with our largest customers regarding the delivery of our services across the enlarged, market-leading network and believe that the outcome demonstrates Signature’s unrivalled ability to satisfy the needs of its customer base. Although we experienced a short-term negative impact on volumes relative to market during the period, Signature’s strong drop through continues to demonstrate our ability to grow underlying operating profit ahead of market growth. In Aftermarket Services, Ontic had a good first half and we are pleased with the contribution of the portfolio of legacy avionics products acquired from GE Aviation at the end of 2016. Ontic continues to have a strong pipeline of growth opportunities. Although ERO continues to be impacted by reduced legacy mid-cabin fixed wing flying, the slight improvement in operating performance seen in the second half of 2016 was maintained in to the first half of this year. In summary, the Board’s confidence of good growth in 2017 remains unchanged.

7
Going concern
The Directors have carried out a review of the Group’s trading outlook and borrowing facilities, with due regard to the risks and uncertainties to which the Group is exposed, the uncertain economic climate and the impact that this could have on trading performance. Based on this review, the Directors believe that the Company and the Group have adequate resources to continue in operational existence for the foreseeable future. Accordingly, the financial statements have been prepared on a going concern basis. Directors’ responsibilities
The Directors confirm that to the best of their knowledge:
a) the condensed consolidated set of financial statements has been prepared in accordance with IAS 34 “Interim Financial Reporting”;
b) the interim financial report includes a fair review of the information required by DTR 4.2.7R (indication of important events during the first six months and description of principal risks and uncertainties for the remaining six months of the year); and,
c) the interim financial report includes a fair review of the information required by DTR 4.2.8R (disclosure of related parties’ transactions and changes therein).
Signed on behalf of the Board, Wayne Edmunds David Crook
Interim Group Chief Executive Group Finance Director 31 July 2017 31 July 2017 This interim financial report contains forward-looking statements including, without limitation, statements relating to: future demand and markets of the Group’s products and services; research and development relating to new products and services; liquidity and capital; and implementation of restructuring plans and efficiencies. These forward-looking statements involve risks and uncertainties because they relate to events and depend on circumstances that will or may occur in the future. Accordingly, actual results may differ materially from those set out in the forward-looking statements as a result of a variety of factors including, without limitation: changes in interest and exchange rates, commodity prices and other economic conditions; negotiations with customers relating to renewal of contracts and future volumes and prices; events affecting international security, including global health issues and terrorism; changes in regulatory environment; and the outcome of litigation. The Company undertakes no obligation to publicly update or revise any forward-looking statement, whether as a result of new information, future events or otherwise. This interim financial report has been drawn up and presented in accordance with and in reliance on applicable English company law and the liabilities of the directors in connection with this report shall be subject to the limitations and restrictions provided by such law.
This report is available in electronic format from the Company’s website www.bbaaviation.com
8
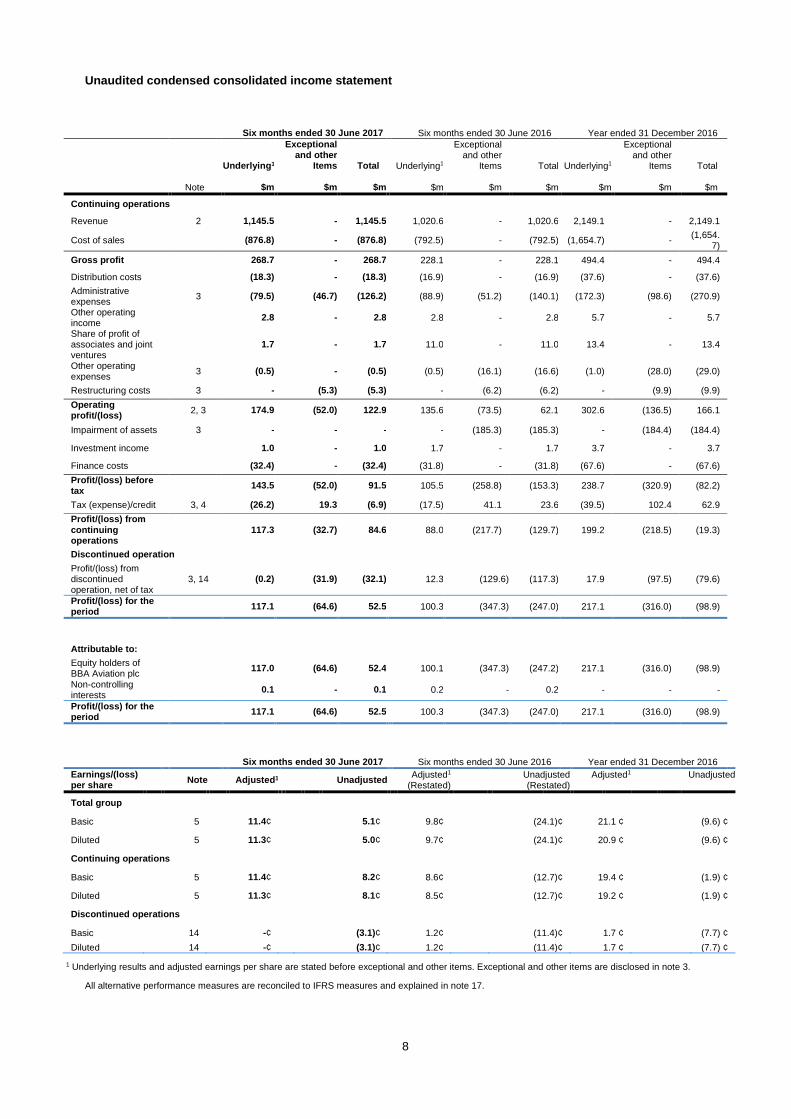
Unaudited condensed consolidated income statement
Six months ended 30 June 2017
Six months ended 30 June 2016
Year ended 31 December 2016
Underlying1
Exceptional and other
Items Total Underlying1
Exceptional and other
Items Total Underlying1
Exceptional and other
Items Total
Note $m $m $m $m $m $m $m $m $m
Continuing operations
Revenue 2 1,145.5 - 1,145.5 1,020.6 - 1,020.6 2,149.1 - 2,149.1
Cost of sales
(876.8) - (876.8) (792.5) - (792.5) (1,654.7) - (1,654.
7)
Gross profit 268.7 - 268.7 228.1 - 228.1 494.4 - 494.4
Distribution costs (18.3) - (18.3) (16.9) - (16.9) (37.6) - (37.6)
Administrative expenses
3 (79.5) (46.7) (126.2) (88.9) (51.2) (140.1) (172.3) (98.6) (270.9)
Other operating income
2.8 - 2.8 2.8 - 2.8 5.7 - 5.7
Share of profit of associates and joint ventures
1.7 - 1.7 11.0 - 11.0 13.4 - 13.4
Other operating expenses
3 (0.5) - (0.5) (0.5) (16.1) (16.6) (1.0) (28.0) (29.0)
Restructuring costs 3 - (5.3) (5.3) - (6.2) (6.2) - (9.9) (9.9)
Operating profit/(loss)
2, 3 174.9 (52.0) 122.9 135.6 (73.5) 62.1 302.6 (136.5) 166.1
Impairment of assets 3 - - - - (185.3) (185.3) - (184.4) (184.4)
Investment income 1.0 - 1.0 1.7 - 1.7 3.7 - 3.7
Finance costs (32.4) - (32.4) (31.8) - (31.8) (67.6) - (67.6)
Profit/(loss) before tax
143.5 (52.0) 91.5 105.5 (258.8) (153.3) 238.7 (320.9) (82.2)
Tax (expense)/credit 3, 4 (26.2) 19.3 (6.9) (17.5) 41.1 23.6 (39.5) 102.4 62.9
Profit/(loss) from continuing operations
117.3 (32.7) 84.6 88.0 (217.7) (129.7) 199.2 (218.5) (19.3)
Discontinued operation
Profit/(loss) from discontinued operation, net of tax
3, 14 (0.2) (31.9) (32.1) 12.3 (129.6) (117.3) 17.9 (97.5) (79.6)
Profit/(loss) for the period
117.1 (64.6) 52.5 100.3 (347.3) (247.0) 217.1 (316.0) (98.9)
Attributable to:
Equity holders of BBA Aviation plc
117.0 (64.6) 52.4 100.1 (347.3) (247.2) 217.1 (316.0) (98.9)
Non-controlling interests
0.1 - 0.1 0.2 - 0.2 - - -
Profit/(loss) for the period
117.1 (64.6) 52.5 100.3 (347.3) (247.0) 217.1 (316.0) (98.9)
Six months ended 30 June 2017
Six months ended 30 June 2016
Year ended 31 December 2016
Earnings/(loss) per share
Note Adjusted1 Unadjusted Adjusted1
(Restated) Unadjusted (Restated)
Adjusted1
Unadjusted
Total group
Basic 5 11.4¢ 5.1¢ 9.8¢ (24.1)¢ 21.1 ¢ (9.6) ¢
Diluted 5 11.3¢ 5.0¢ 9.7¢ (24.1)¢ 20.9 ¢ (9.6) ¢
Continuing operations
Basic 5 11.4¢ 8.2¢ 8.6¢ (12.7)¢ 19.4 ¢ (1.9) ¢
Diluted 5 11.3¢ 8.1¢ 8.5¢ (12.7)¢ 19.2 ¢ (1.9) ¢
Discontinued operations
Basic 14 -¢ (3.1)¢ 1.2¢ (11.4)¢ 1.7 ¢ (7.7) ¢
Diluted 14 -¢ (3.1)¢ 1.2¢ (11.4)¢ 1.7 ¢ (7.7) ¢
1 Underlying results and adjusted earnings per share are stated before exceptional and other items. Exceptional and other items are disclosed in note 3.
All alternative performance measures are reconciled to IFRS measures and explained in note 17.

BBA Aviation plc – Interim Results, 1 August 2017
9
Unaudited condensed consolidated statement of comprehensive income
Six months ended 30 June
2017
Six months
ended 30 June 2016
Year ended
31 December 2016
$m $m $m
Profit/(loss) for the period 52.5 (247.0) (98.9)
Other comprehensive income/(loss)
Items that will not be reclassified subsequently to profit or loss
Actuarial gains/(losses) on defined benefit pension schemes 4.5 (11.5) (52.3)
Tax (charge)/credit relating to components of other comprehensive income/(loss) that will not be reclassified subsequently to profit or loss
(0.9) 2.5 9.8
3.6 (9.0) (42.5)
Items that may be reclassified subsequently to profit or loss
Exchange difference on translation of foreign operations (98.5) 158.6 309.0
Recycling of translational exchange differences accumulated in equity upon disposal of subsidiary
6.4 - -
Gains/(losses) on net investment hedges 87.0 (158.1) (308.0)
Fair value movements in available for sale investments - - (2.0)
Fair value movements in foreign exchange cash flow hedges 7.0 (1.5) 1.3
Transfer to profit or loss from other comprehensive income on foreign exchange cash flow hedges
(1.9) (2.3) (4.5)
Fair value movement in interest rate cash flow hedges (1.9) (21.4) (5.4)
Transfer to profit or loss from other comprehensive income on interest rate cash flow hedges
2.3 3.8 7.3
Tax relating to components of other comprehensive income that may be subsequently reclassified to profit or loss
(1.1) 5.7 2.8
(0.7) (15.2) 0.5
Other comprehensive income/(loss) for the period 2.9 (24.2) (42.0)
Total comprehensive income/(loss) for the period 55.4 (271.2) (140.9)
Attributable to:
Equity holders of BBA Aviation plc 55.3 (271.2) (141.1)
Non-controlling interests 0.1 - 0.2
55.4 (271.2) (140.9)

BBA Aviation plc – Interim Results, 1 August 2017
10
Unaudited condensed consolidated balance sheet
As at
30 June 2017 As at
30 June 2016
As at
31 December 2016
Note $m $m $m
Non-current assets
Goodwill 1,118.3 1,117.8 1,113.9
Other intangible assets 1,339.8 1,373.8 1,378.3
Property, plant and equipment 867.1 870.2 875.6
Interests in associates and joint ventures 40.4 47.1 40.1
Trade and other receivables 19.9 36.0 19.2
Deferred tax asset 0.7 14.8 0.4
3,386.2 3,459.7 3,427.5
Current assets
Inventories 243.3 237.0 235.8
Trade and other receivables 289.4 270.3 296.8
Cash and cash equivalents 7 152.6 164.8 182.5
Tax recoverable 1.1 0.7 1.4
Assets held for sale - 255.6 267.7
686.4 928.4 984.2
Total assets 2 4,072.6 4,388.1 4,411.7
Current liabilities
Trade and other payables (451.8) (433.2) (543.2)
Tax liabilities (63.1) (44.1) (36.8)
Obligations under finance leases (0.2) (0.4) (0.2)
Borrowings 7 (124.4) (0.2) (1.0)
Provisions (26.1) (40.0) (27.6)
Liabilities held for sale - (85.3) (89.3)
(665.6) (603.2) (698.1)
Net current assets 20.8 325.2 286.1
Non-current liabilities
Borrowings 7 (1,291.7) (1,652.8) (1,546.7)
Trade and other payables due after one year (3.1) (19.3) (4.0)
Pensions and other post-retirement benefits 13 (80.1) (49.4) (82.8)
Deferred tax liabilities (108.2) (211.7) (120.5)
Obligations under finance leases (1.3) (1.6) (1.5)
Provisions (38.0) (30.8) (39.5)
(1,522.4) (1,965.6) (1,795.0)
Total liabilities 2 (2,188.0) (2,568.8) (2,493.1)
Net assets 1,884.6 1,819.3 1,918.6
Equity
Share capital 15 508.8 508.6 508.7
Share premium account 1,594.5 1,594.4 1,594.5
Other reserve 0.3 1.0 (1.0)
Treasury reserve (91.7) (89.9) (91.0)
Capital reserve 47.1 40.1 45.1
Hedging and translation reserves (87.9) (109.4) (87.1)
Retained earnings (88.2) (127.1) (52.2)
Equity attributable to equity holders of BBA Aviation plc
1,882.9 1,817.7 1,917.0
Non-controlling interest 1.7 1.6 1.6
Total equity 1,884.6 1,819.3 1,918.6

BBA Aviation plc – Interim Results, 1 August 2017
11
Unaudited condensed consolidated cash flow statement
Six months ended 30 June 2017
Six months ended 30 June 2016
Year ended 31 December 2016
Note $m $m $m
Operating activities
Net cash flow from operating activities 9 121.4 160.0 374.9
Investing activities
Interest received 0.5 1.7 2.7
Dividends received from associates 1.9 3.2 2.4
Purchase of property, plant and equipment (35.9) (48.1) (101.6)
Purchase of intangible assets † (2.3) (8.3) (11.4)
Proceeds from disposal of property, plant and equipment 0.3 7.6 11.1
Acquisition of businesses, net of cash/(debt) acquired 10 (61.3) (2,085.2) (2,098.2)
Investment in joint ventures and associates (0.5) - -
Proceeds from disposal of subsidiaries and associates, net of cash/(debt) disposed 11
180.4 186.5 186.6
Net cash inflow/(outflow) from investing activities 83.1 (1,942.6) (2,008.4)
Financing activities
Interest paid (29.2) (31.1) (64.5)
Interest element of finance leases paid (0.1) (0.1) (0.1)
Dividends paid 6 (91.5) (87.2) (124.3)
(Losses) / gains from realised foreign exchange contracts (5.0) 10.5 42.7
Proceeds from issue of ordinary shares net of issue costs 0.1 - 0.3
Purchase of own shares †† (2.1) (0.4) (1.3)
(Decrease)/increase in loans (134.0) 1,125.7 1,035.3
(Decrease)/increase in finance leases (0.2) 2.0 1.7
Increase/(decrease) in overdrafts 2.5 (11.8) (11.0)
Net cash (outflow)/inflow from financing activities (259.5) 1,007.6 878.8
Decrease in cash and cash equivalents (55.0) (775.0) (754.7)
Cash and cash equivalents at beginning of the period 205.3 966.4 966.4
Exchange adjustments 2.3 (1.7) (6.4)
Cash and cash equivalents at end of the period 152.6 189.7 205.3
Comprised of:
Cash and cash equivalents at end of the period 152.6 164.8 182.5
Cash included in Assets held for sale at end of the period - 24.9 22.8
Net debt at beginning of the period (1,335.3) 456.5 456.5
Decrease in cash and cash equivalents (55.0) (775.0) (754.7)
Decrease/(increase) in loans 134.0 (1,125.7) (1,035.3)
Decrease/(increase) in finance leases 0.2 (2.0) (1.7)
(Increase)/decrease in overdrafts (2.5) 11.8 11.0
Exchange adjustments 2.3 (2.6) (11.1)
Net debt at end of the period ††† (1,256.3) (1,437.0) (1,335.3)
† Purchase of intangible assets includes $nil million (30 June 2016: $6.8 million; 31 December 2016: $10.6 million) paid in relation to Ontic licences.
††Purchase of own shares includes shares purchased for the Employee Benefit Trust and shares purchased from employees to settle their tax liabilities as part of the share scheme.
††† Within the Group’s definition of net debt the US private placement is included at its face value of $500 million (30 June 2016: $500 million; 31 December 2016: $500 million) reflecting the fact that the liabilities will be in place until maturity. This is $8.7 million (30 June 2016: $28.3 million; 31 December 2016: $8.8 million) lower than its carrying value.

BBA Aviation plc – Interim Results, 1 August 2017
12
Unaudited condensed consolidated statement of changes in equity
Share
capital Share
premium Retained earnings
Other reserves Total
Non-controlling
interests Total
equity
$m $m $m $m $m $m $m
Balance at 1 January 2017 508.7 1,594.5 (52.2) (134.0) 1,917.0 1.6 1,918.6
Profit for the period - - 52.4 - 52.4 0.1 52.5
Other comprehensive income for the period - - 2.4 0.5 2.9 - 2.9
Total comprehensive income for the period
- - 54.8 0.5 55.3 0.1 55.4
Dividends - - (91.5) - (91.5) - (91.5)
Issue of share capital 0.1 - - - 0.1 - 0.1
Movement on treasury reserve - - - (2.1) (2.1) - (2.1)
Credit to equity for equity-settled share-based payments
- - - 3.9 3.9 - 3.9
Tax on share-based payment transactions - - 0.2 - 0.2 - 0.2
Transfer to retained earnings - - 0.5 (0.5) - - -
Balance at 30 June 2017 508.8 1,594.5 (88.2) (132.2) 1,882.9 1.7 1,884.6
Balance at 1 January 2016 508.5 1,594.4 208.2 (137.9) 2,173.2 (4.8) 2,168.4
(Loss)/profit for the period - - (247.2) - (247.2) 0.2 (247.0)
Other comprehensive loss for the period - - (3.3) (20.9) (24.2) - (24.2)
Total comprehensive (loss)/income for the period
- - (250.5) (20.9) (271.4) 0.2 (271.2)
Dividends - - (87.2) - (87.2) - (87.2)
Issue of share capital 0.1 - - - 0.1 - 0.1
Movement on treasury reserve - - - (0.4) (0.4) - (0.4)
Credit to equity for equity-settled share-based payments
- - - 3.4 3.4 - 3.4
Changes in non-controlling interest - - - - - 6.2 6.2
Transfer to retained earnings - - 2.4 (2.4) - - -
Balance at 30 June 2016 508.6 1,594.4 (127.1) (158.2) 1,817.7 1.6 1,819.3
Balance at 1 January 2016 508.5 1,594.4 208.2 (137.9) 2,173.2 (4.8) 2,168.4
Loss for the period - - (98.9) - (98.9) - (98.9)
Other comprehensive loss for the period - - (39.7) (2.1) (41.8) (0.2) (42.0)
Total comprehensive loss for the period - - (138.6) (2.1) (140.7) (0.2) (140.9)
Dividends - - (124.3) - (124.3) - (124.3)
Issue of share capital 0.2 0.1 - - 0.3 - 0.3
Movement on treasury reserve - - - (1.3) (1.3) - (1.3)
Credit to equity for equity-settled share-based payments
- - - 9.1 9.1 - 9.1
Changes in non-controlling interest - - - - - 6.6 6.6
Tax on share-based payment transactions - - 0.7 - 0.7 - 0.7
Transfer to retained earnings - - 1.8 (1.8) - - -
Balance at 31 December 2016 508.7 1,594.5 (52.2) (134.0) 1,917.0 1.6 1,918.6

BBA Aviation plc – Interim Results, 1 August 2017
13
Notes to the condensed consolidated half yearly financial statements
1 Basis of preparation The unaudited condensed consolidated financial statements of BBA Aviation plc (the “Group”), for the six months ended 30 June 2017 have been prepared in accordance with the Disclosure and Transparency Rules of the UK’s Financial Conduct Authority and International Accounting Standard IAS 34: Interim Financial Reporting (IAS 34) which permits the presentation of the financial information on a condensed basis. These condensed consolidated half yearly financial statements do not comprise statutory accounts within the meaning of Section 434 of the Companies Act 2006, and therefore should be read in conjunction with the Group’s Annual Report for the year ended 31 December 2016. The Group’s annual financial statements for the year ended 31 December 2016 have been reported upon by the Group’s auditor and delivered to the Registrar of Companies. The report of the auditor was unqualified, did not include a reference to any matters to which the auditor drew attention by way of emphasis without qualifying their report and did not contain statements under section 498(2) or 498(3) of the Companies Act 2006. These condensed consolidated half yearly financial statements have been prepared in accordance with the accounting policies, presentation and methods of calculation as set out in the Group’s consolidated financial statements for the year ended 31 December 2016, which were prepared in accordance with International Financial Reporting Standards (IFRS) endorsed for use in the European Union and the Companies Act 2006, and comply with Article 4 of the EU IAS Regulation. Going concern
The directors are satisfied that, at the time of approving the condensed consolidated financial statements, it is appropriate to continue to adopt the going concern basis of accounting. Further information is given on page 7 of the interim statement. New financial reporting requirements
A number of EU-endorsed amendments to existing standards and interpretations are effective for annual periods
beginning on or after 1 January 2017 and have been applied in preparing the Condensed Consolidated Financial Statements of the Group. There is no impact on the Condensed Consolidated Financial Statements of the Group from
applying these standards.
Financial reporting standards applicable for future financial periods
A number of EU-endorsed standards and amendments to existing standards and interpretations, which are described
below, are effective for annual periods beginning on or after 1 January 2018 and have not been applied in preparing the Consolidated Financial Statements of the Group.
The most significant changes to the IFRS framework in these forthcoming standards and amendments to standards are IFRS 9: Financial Instruments (IFRS 9), IFRS 15: Revenue from contracts with customers (IFRS 15) and IFRS 16: Leases. IFRS 9 addresses the classification, measurement and recognition of financial assets and financial liabilities, impairment and hedge accounting. IFRS 15 addresses recognition of revenue from customer contracts and impacts on the amounts and timing of the recognition of such revenue. In 2016 both standards were endorsed by the EU and will become effective on 1 January 2018. The assessment of the impact of IFRS 9 and IFRS 15 on the Group’s Consolidated Financial Statements is substantially complete and management’s expectations remain that the impact will not be material. The IASB released IFRS 16: Leases on 13 January 2016. The standard has not yet been adopted into EU-IFRS. Management have not yet completed their assessment of the impact of the final standard on the Group’s financial statements. However, the Group has substantial operating lease commitments and the standard is expected to have a material impact on the Group.
2 Segmental analysis
IFRS 8 requires operating segments to be identified on the basis of internal reports about components of the Group that are regularly reviewed by the Chief Operating Decision Maker (for the Group, this is the Chief Executive) to allocate resources to the segments and to assess their performance.
Based on the above, the reportable segments of the Group are Flight Support and Aftermarket Services.
The businesses within the Flight Support segment provide re-fuelling, ground handling and other services to the business, general and commercial aviation markets. The businesses within the Aftermarket Services segment maintain and support engines and aerospace components, sub-systems and systems. Sales between segments are immaterial.
There has been no change to the Group's reportable segments since the last annual report.

BBA Aviation plc – Interim Results, 1 August 2017
14
2 Segmental analysis - continued
As at, and for the six months ended 30 June 2017
Flight Support1
Aftermarket Services Total
Unallocated Corporate2 Total
Business segments Note
$m $m $m $m $m
External revenue
External revenue from continuing and discontinued operations
841.0 342.7 1,183.7 - 1,183.7
Less external revenue from discontinued operations
14 (38.2) - (38.2) - (38.2)
External revenue from continuing operations
802.8 342.7 1,145.5 - 1,145.5
Underlying operating profit
Underlying operating profit/(loss) from continuing and discontinued operations
160.6 26.0 186.6 (11.9) 174.7
Less underlying operating loss from discontinued operations
14 0.2 - 0.2 - 0.2
Adjusted for intergroup charges for discontinued operations
14 - - - - -
Underlying operating profit/(loss) from continuing operations
160.8 26.0 186.8 (11.9) 174.9
Underlying operating margin from continuing operations
20.0% 7.6% 16.3% - 15.3%
Exceptional and other items
Exceptional and other items from continuing and discontinued operations
(41.1) (9.3) (50.4) (1.6) (52.0)
Less exceptional and other items from discontinued operations
14 - - - - -
Exceptional and other items from continuing operations
3 (41.1) (9.3) (50.4) (1.6) (52.0)
Operating profit/(loss) from continuing operations
119.7 16.7 136.4 (13.5) 122.9
Impairment of fixed assets -
Net finance costs (31.4)
Profit before tax from continuing operations
91.5
Other information
Capital additions cash flows 32.0 6.2 38.2 - 38.2
Depreciation and amortisation
75.4 14.2 89.6 0.2 89.8
Balance sheet
Total assets 3,203.7 773.2 3,976.9 95.7 4,072.6
Total liabilities (297.9) (141.2) (439.1) (1,748.9) (2,188.0)
Net assets/(liabilities) 2,905.8 632.0 3,537.8 (1,653.2) 1,884.6
1 Flight Support’s segment result includes $1.7 million (30 June 2016: $11.0 million; 31 December 2016: $13.4 million) relating to profits of associates and joint ventures. 2 Unallocated corporate balances include debt, tax, provisions, pensions, insurance captives and trading balances from central activities.

BBA Aviation plc – Interim Results, 1 August 2017
15
2 Segmental analysis - continued
As at, and for the six months ended 30 June 2016
Flight Support
Aftermarket Services Total
Unallocated Corporate Total
Business segments Note
$m $m $m $m $m
External revenue
External revenue from continuing and discontinued operations
889.3 340.1 1,229.4 - 1,229.4
Less external revenue from discontinued operations
14 (208.8) - (208.8) - (208.8)
External revenue from continuing operations
680.5 340.1 1,020.6 - 1,020.6
Underlying operating profit
Underlying operating profit/(loss) from continuing and discontinued operations
146.3 11.1 157.4 (7.8) 149.6
Less underlying operating profit from discontinued operations
14 (4.7) - (4.7) - (4.7)
Adjusted for intergroup charges for discontinued operations
14 - - - (9.3) (9.3)
Underlying operating profit/(loss) from continuing operations
141.6 11.1 152.7 (17.1) 135.6
Underlying operating margin from continuing operations
20.8% 3.3% 15.0% - 13.3%
Exceptional and other items
Exceptional and other items from continuing and discontinued operations
(64.9) (9.3) (74.2) - (74.2)
Less exceptional and other items from discontinued operations
14 0.7 - 0.7 - 0.7
Exceptional and other items from continuing operations
3 (64.2) (9.3) (73.5) - (73.5)
Operating profit/(loss) from continuing operations
77.4 1.8 79.2 (17.1) 62.1
Impairment of fixed assets (185.3)
Net finance costs (30.1)
Loss before tax from continuing operations
(153.3)
Other information
Capital additions cash flows 38.5 17.8 56.3 0.1 56.4
Depreciation and amortisation
83.6 13.7 97.3 0.3 97.6
Balance sheet
Total assets 3,507.7 673.0 4,180.7 207.4 4,388.1
Total liabilities (347.0) (170.5) (517.5) (2,051.3) (2,568.8)
Net assets/(liabilities) 3,160.7 502.5 3,663.2 (1,843.9) 1,819.3
BBA Aviation plc – Interim Results, 1 August 2017
16
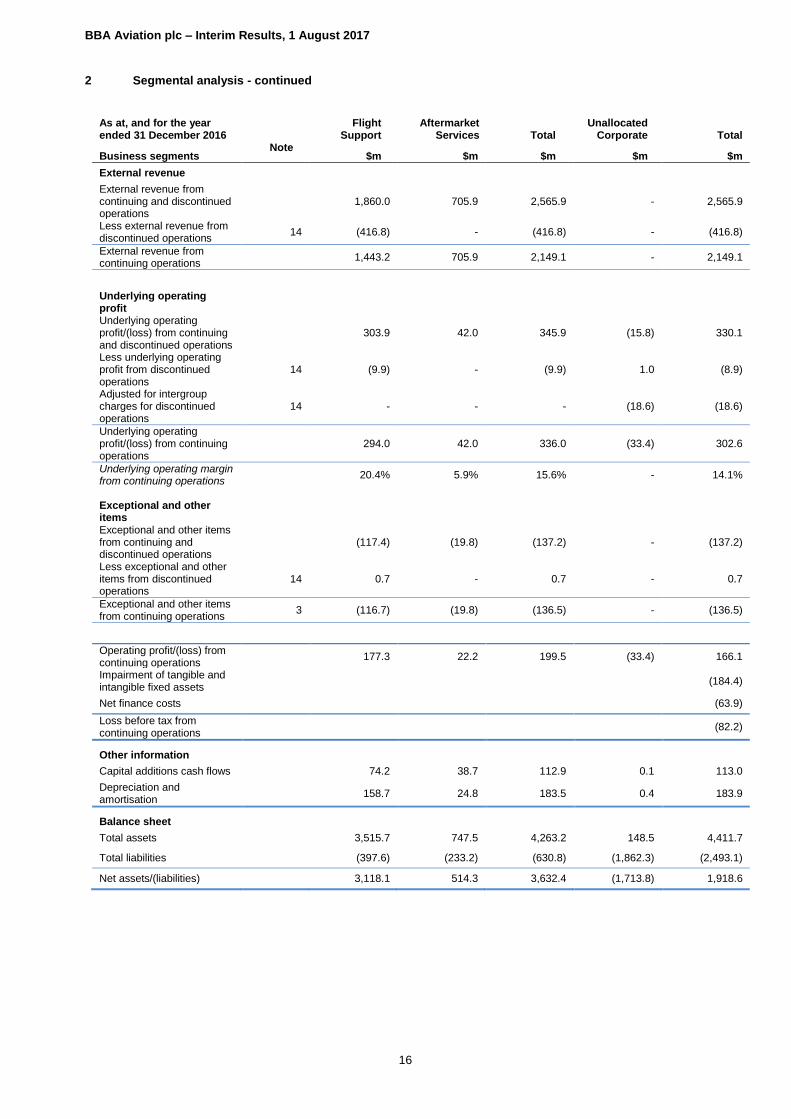
2 Segmental analysis - continued
As at, and for the year ended 31 December 2016
Flight Support
Aftermarket Services Total
Unallocated Corporate Total
Business segments Note
$m $m $m $m $m
External revenue
External revenue from continuing and discontinued operations
1,860.0 705.9 2,565.9 - 2,565.9
Less external revenue from discontinued operations
14 (416.8) - (416.8) - (416.8)
External revenue from continuing operations
1,443.2 705.9 2,149.1 - 2,149.1
Underlying operating profit
Underlying operating profit/(loss) from continuing and discontinued operations
303.9 42.0 345.9 (15.8) 330.1
Less underlying operating profit from discontinued operations
14 (9.9) - (9.9) 1.0 (8.9)
Adjusted for intergroup charges for discontinued operations
14 - - - (18.6) (18.6)
Underlying operating profit/(loss) from continuing operations
294.0 42.0 336.0 (33.4) 302.6
Underlying operating margin from continuing operations
20.4% 5.9% 15.6% - 14.1%
Exceptional and other items
Exceptional and other items from continuing and discontinued operations
(117.4) (19.8) (137.2) - (137.2)
Less exceptional and other items from discontinued operations
14 0.7 - 0.7 - 0.7
Exceptional and other items from continuing operations
3 (116.7) (19.8) (136.5) - (136.5)
Operating profit/(loss) from continuing operations
177.3 22.2 199.5 (33.4) 166.1
Impairment of tangible and intangible fixed assets
(184.4)
Net finance costs (63.9)
Loss before tax from continuing operations
(82.2)
Other information
Capital additions cash flows 74.2 38.7 112.9 0.1 113.0
Depreciation and amortisation
158.7 24.8 183.5 0.4 183.9
Balance sheet
Total assets 3,515.7 747.5 4,263.2 148.5 4,411.7
Total liabilities (397.6) (233.2) (630.8) (1,862.3) (2,493.1)
Net assets/(liabilities) 3,118.1 514.3 3,632.4 (1,713.8) 1,918.6

BBA Aviation plc – Interim Results, 1 August 2017
17
2 Segmental analysis - continued
Geographical segments
Revenue by destination
Revenue by origin
Capital additions cash
flows Non-current
assets1
$m $m $m $m
As at, and for the six months ended 30 June 2017
United Kingdom 39.8 137.0 2.2 236.9
Mainland Europe 103.2 26.5 0.3 48.8
North America 993.7 1,010.1 35.2 3,066.2
Rest of world 47.0 10.1 0.5 20.0
Total from continuing and discontinued operations 1,183.7 1,183.7 38.2 3,371.9
Less discontinued operations (38.2) (38.2) - -
Total from continuing operations 1,145.5 1,145.5 38.2 3,371.9
As at, and for the six months ended 30 June 2016
United Kingdom 63.6 155.5 8.6 166.5
Mainland Europe 96.5 24.3 0.1 50.4
North America 1,002.1 1,028.6 45.8 3,175.3
Rest of world 67.2 21.0 1.9 21.3
Total from continuing and discontinued operations 1,229.4 1,229.4 56.4 3,413.5
Less discontinued operations (208.8) (208.8) (10.8) -
Total from continuing operations 1,020.6 1,020.6 45.6 3,413.5
As at, and for the year ended 31 December 2016
United Kingdom 128.0 320.8 14.7 226.7
Mainland Europe 200.9 54.5 0.2 46.1
North America 2,098.5 2,148.0 92.1 3,117.2
Rest of world 138.5 42.6 6.0 23.5
Total from continuing and discontinued operations 2,565.9 2,565.9 113.0 3,413.5
Less discontinued operations (416.8) (416.8) (10.3) -
Total from continuing operations 2,149.1 2,149.1 102.7 3,413.5
1 The disclosure of non-current assets by geographical segment has been amended to exclude balances related to deferred tax and financial instruments in all periods, as required under IFRS 8.

BBA Aviation plc – Interim Results, 1 August 2017
18
3 Exceptional and other items
Underlying profit is shown before exceptional and other items on the face of the income statement because the directors consider that this gives a useful indication of underlying performance and better visibility of key performance indicators.
Exceptional and other items on discontinued operations are presented in note 14. Exceptional and other items on continuing operations are as follows:
Six months ended 30 June 2017
Six months
ended 30 June 2016
Year ended 31
December 2016
Administrative expenses
Other operating expenses
Restructuring costs Total Total Total
$m $m $m $m $m $m
Restructuring expenses
ERO footprint rationalisation - - 3.7 3.7 6.2 9.9
Central costs rationalisation - - 1.6 1.6 - -
Acquisition related
Amortisation of intangibles assets arising on acquisition and valued in accordance with IFRS 3
46.7 - - 46.7 51.2 98.6
Landmark integration costs - - - - 16.1 24.9
Transaction costs1 - - - - - 1.5
Other - - - - - 1.6
Operating loss on continuing operations
46.7 - 5.3 52.0 73.5 136.5
Impairment loss - 185.3 184.4
Net finance costs - - -
Loss before tax on continuing operations 52.0 258.8 320.9
Tax impact of exceptional and other items
(19.3) (41.1) (102.4)
Loss for the year on continuing operations 32.7 217.7 218.5
Loss from discontinued operation, net of tax, see note 14
31.9 129.6 97.5
Total exceptional and other items 64.6 347.3 316.0
1 All transaction costs presented in exceptional and other items related to the acquisition of Landmark Aviation.
4 Income tax
Six months ended
30 June 2017 Six months ended 30
June 2016 Year ended 31 December 2016
Recognised in the income statement $m $m $m
Current tax (credit)/expense (3.8) 10.6 16.0
Adjustments in respect of prior periods – current tax (1.2) - (1.6)
Current tax (5.0) 10.6 14.4
Deferred tax expense/(credit) 11.9 (34.2) (78.7)
Adjustments in respect of prior periods – deferred tax - - 1.4
Deferred tax 11.9 (34.2) (77.3)
Income tax expense/(credit) for the period from continuing operations
6.9 (23.6) (62.9)
Tax expense/(credit) relating to discontinued operations 25.3 1.6 (2.8)
Total income tax expense/(credit) 32.2 (22.0) (65.7)
Corporation tax on continuing operations for the interim period is charged at an effective rate of 18.3% (30 June 2016: 16.6%; 31 December 2016: 16.5%) on underlying profit before tax, representing the best estimate of the weighted average annual corporation tax expected for the full financial year. The total income tax expense for the six months ended 30 June 2017 includes a tax credit of $19.3 million (30 June 2016: $41.1 million; 31 December 2016: $102.4 million) relating to exceptional and other items (see note 3).

BBA Aviation plc – Interim Results, 1 August 2017
19
4 Income tax - continued
Tax credited to other comprehensive income and equity is as follows:
Six months ended 30 June 2017
Six months ended 30 June 2016
Year ended 31 December 2016
Recognised in other comprehensive income and equity $m $m $m
Recognised in other comprehensive income
Tax on items that will not be reclassified subsequently to profit or loss
Current tax credit on pension deficit payments - - 0.5
Deferred tax (expense)/credit on actuarial gains/(losses) (0.9) 2.5 9.3
(0.9) 2.5 9.8
Tax on items that may be reclassified subsequently to profit or loss
Current tax credit on foreign exchange movements - 5.7 0.7
Deferred tax (expense)/credit on derivative instruments (1.1) - 2.1
(1.1) 5.7 2.8
Total tax (expense)/credit within other comprehensive income (2.0) 8.2 12.6
Recognised in equity
Current tax credit on share-based payments movements 0.1 - 0.1
Deferred tax credit on share-based payments movements 0.1 - 0.6
Total tax credit within equity 0.2 - 0.7
Total tax (expense)/credit within other comprehensive income and equity
(1.8) 8.2 13.3
5 Earnings/(loss) per share
The calculation of the basic and diluted earnings/(loss) per share is based on the following data:
Continuing Total
Six months ended 30
June 2017
Six months
ended 30 June 2016
Year ended 31
December 2016
Six months ended 30
June 2017
Six months
ended 30 June 2016
Year ended 31
December 2016
$m $m $m $m $m $m
Basic and diluted:
Earnings:
Profit/(loss) for the period 84.6 (129.7) (19.3) 52.5 (247.0) (98.9)
Non-controlling interests (0.1) (0.1) (0.4) (0.1) (0.2) -
Basic earnings/(loss) attributable to ordinary shareholders
84.5 (129.8) (19.7) 52.4 (247.2) (98.9)
Exceptional and other items net of tax 32.7 217.7 218.5 64.6 347.3 316.0
Adjusted earnings for adjusted earnings per share
117.2 87.9 198.8 117.0 100.1 217.1
Underlying deferred tax 29.6 9.3 27.7 29.6 10.3 35.6
Adjusted earnings for cash earnings per share
146.8 97.2 226.5 146.6 110.4 252.7

BBA Aviation plc – Interim Results, 1 August 2017
20
5 Earnings/(loss) per share - continued
Continuing Total
Six months ended 30
June 2017
Restated Six months
ended 30 June 2016
Year ended
31 December 2016
Six months ended 30
June 2017
Restated Six months
ended 30 June 2016
Year ended
31 December 2016
$m $m $m $m $m $m Number of shares
Weighted average number of 29 16/21p ordinary shares:
For basic earnings per share 1,027.5 1,026.3 1,026.6 1,027.5 1,026.3 1,026.6
Dilutive potential ordinary shares from share options
12.1 4.7 9.9 12.1 4.7 9.9
For diluted earnings per share 1,039.6 1,031.0 1,036.5 1,039.6 1,031.0 1,036.5
For diluted losses per share 1,027.5 1,026.3 1,026.6 1,027.5 1,026.3 1,026.6
Potential ordinary shares are only treated as dilutive when their conversion to ordinary shares would decrease earnings
per share, or increase the loss per share.
Continuing Total
Six months ended 30
June 2017
Restated Six months
ended 30 June 2016
Year ended
31 December
2016
Six months ended 30
June 2017
Restated Six months
ended 30 June 2016
Year ended
31 December 2016
Earnings per share:
Basic:
Adjusted 11.4¢ 8.6¢ 19.4¢ 11.4¢ 9.8¢ 21.1¢
Cash 14.3¢ 9.5¢ 22.1¢ 14.3¢ 10.8¢ 24.6¢
Unadjusted 8.2¢ (12.7)¢ (1.9)¢ 5.1¢ (24.1)¢ (9.6)¢
Diluted:
Adjusted 11.3¢ 8.5¢ 19.2¢ 11.3¢ 9.7¢ 20.9¢
Cash 14.1¢ 9.4¢ 21.9¢ 14.1¢ 10.7¢ 24.4¢
Unadjusted 8.1¢ (12.7)¢ (1.9)¢ 5.0¢ (24.1)¢ (9.6)¢
Earnings per share on discontinued operations is presented in note 14. Adjusted earnings per share is presented calculated on earnings before exceptional and other items (note 17). Cash earnings per share is presented calculated on earnings before exceptional and other items (note 17) and using current tax charge, not the total tax charge for the period thereby excluding the deferred tax charge. Both adjustments have been made because the directors consider that this gives a useful indication of underlying performance.
The prior period adjusted earnings per share figures were restated to use the statutory weighted average number of
shares as opposed to an adjusted measure. The change ensures that the comparative period is presented on a
consistent basis with the current measure as used in the 2016 annual report and accounts.

BBA Aviation plc – Interim Results, 1 August 2017
21
6 Equity dividends on ordinary shares
Six months
ended 30 June 2017
Six months ended 30
June 2016
Year ended 31
December 2016
$m $m $m
Paid during the period:
Final dividend for the year ended 31 December 2016: 9.12 cents per share (30 June 2016: Final dividend for the year ended 31 December 2015 of 8.68 cents per share; 31 December 2016: Final dividend for the year ended 31 December 2015 of 8.68 cents per share and 2016 interim dividend of 3.63 cents per share)
91.5 87.2 124.3
The 2017 interim dividend of 3.81 cents per share (2016: 3.63 cents per share; $37.1 million in total) was approved by the Board of Directors on 31 July 2017 and will be paid on 3 November 2017 to ordinary shareholders registered on 15 September 2017. Shareholders will receive their dividends in sterling unless they complete and submit to the Company’s registrars by 5.30pm on 9 October 2017 an election form stating their wish to receive their dividends in US dollars. The sterling dividend will be converted at a prevailing exchange rate on 10 October 2017 and this exchange rate will be announced on 11 October 2017.
7 Cash and cash equivalents and borrowings
The carrying value of cash and cash equivalents for continuing operations of $152.6 million (30 June 2016: $164.8 million; 31 December 2016: $182.5 million) approximates to its fair value.
Borrowings
As at 30 June 2017
$m
As at 30 June 2016
$m
As at 31 December
2016
$m
Bank overdrafts 3.5 0.2 1.0
Bank loans 902.2 1,123.1 1,036.2
Loan notes 507.2 526.4 507.3
Other loans 3.2 3.3 3.2
1,416.1 1,653.0 1,547.7
The borrowings are repayable as follows:
On demand or within one year 124.4 0.2 1.0
In the second year 455.5 123.7 121.8
In the third to fifth years inclusive 624.6 1,308.4 1,214.4
After five years 211.6 220.7 210.5
1,416.1 1,653.0 1,547.7
Less: Amount due for settlement within 12 months (shown within current liabilities)
(124.4) (0.2) (1.0)
Amount due for settlement after 12 months 1,291.7 1,652.8 1,546.7
Bank loans and loan notes are stated after their respective transaction costs and related amortisation.

BBA Aviation plc – Interim Results, 1 August 2017
22
7 Cash and cash equivalents and borrowings - continued
As at 30 June 2017
Type Facility
Amount Headroom Principal
Amortisation
costs
Fair value
adjustment Drawn Facility Date Maturity Date
$m $m $m $m $m $m
Multicurrency revolving bank credit facility 650.0 445.0 205.0 (1.4) - 203.6 Apr 2014 Apr 2019
Acquisition facility bank term loan – Facility B1 253.4 - 253.4 (1.5) - 251.9 Sep 2015 Feb 2019
Acquisition facility Bank term loan – Facility C1 450.0 - 450.0 (3.3) - 446.7 Sep 2015 Sep 2020
Total bank loans 1,353.4 445.0 908.4 (6.2) - 902.2
$300m US private placement senior notes – Series A 120.0 - 120.0 (0.4) 1.3 120.9 May 2011 May 2018
$300m US private placement senior notes – Series B 120.0 - 120.0 (0.4) 4.3 123.9 May 2011 May 2021
$300m US private placement senior notes – Series C 60.0 - 60.0 (0.2) 0.6 60.4 May 2011 May 2023
$200m US private placement senior notes – Series A 50.0 - 50.0 (0.1) 1.2 51.1 Dec 2014 Dec 2021
$200m US private placement senior notes – Series B 100.0 - 100.0 (0.3) 0.8 100.5 Dec 2014 Dec 2024
$200m US private placement senior notes – Series C 50.0 - 50.0 (0.1) 0.5 50.4 Dec 2014 Dec 2026
Total loan notes 500.0 - 500.0 (1.5) 8.7 507.2
Total bank and loan notes 1,853.4 445.0 1,408.4 (7.7) 8.7 1,409.4
Bank overdraft 3.5
Other loans 3.2
Borrowings 1,416.1
As at 31 December 2016
Type
Facility Amount Headroom Principal
Amortisation
costs
Fair value
adjustment Drawn Facility Date Maturity Date
$m $m $m $m $m $m
Multicurrency revolving bank credit facility 650.0 420.0 230.0 (1.8) - 228.2 Apr 2014 Apr 2019
Acquisition facility bank term loan – Facility B1 363.4 - 363.4 (1.8) - 361.6 Sep 2015 Feb 2019
Acquisition facility Bank term loan – Facility C1 450.0 - 450.0 (3.6) - 446.4 Sep 2015 Sep 2020
Total bank loans 1,463.4 420.0 1,043.4 (7.2) - 1,036.2
$300m US private placement senior notes – Series A 120.0 - 120.0 (0.3) 2.1 121.8 May 2011 May 2018
$300m US private placement senior notes – Series B 120.0 - 120.0 (0.3) 4.1 123.8 May 2011 May 2021
$300m US private placement senior notes – Series C 60.0 - 60.0 (0.2) 0.2 60.0 May 2011 May 2023
$200m US private placement senior notes – Series A 50.0 - 50.0 (0.2) 1.7 51.5 Dec 2014 Dec 2021
$200m US private placement senior notes – Series B 100.0 - 100.0 (0.3) 0.4 100.1 Dec 2014 Dec 2024
$200m US private placement senior notes – Series C 50.0 - 50.0 (0.2) 0.3 50.1 Dec 2014 Dec 2026
Total loan notes 500.0 - 500.0 (1.5) 8.8 507.3
Total bank and loan notes 1,963.4 420.0 1,543.4 (8.7) 8.8 1,543.5
Bank overdraft 1.0
Other loans 3.2
Borrowings 1,547.7

BBA Aviation plc – Interim Results, 1 August 2017
23
7 Cash and cash equivalents and borrowings - continued
As at 30 June 2016
Type Facility
Amount Headroom Principal
Amortisation
costs
Fair value
adjustment Drawn Facility Date Maturity Date
$m $m $m $m $m $m
Multicurrency revolving bank credit facility 650.0 331.0 319.0 (2.4) - 316.6 Apr 2014 Apr 2019
Acquisition facility bank term loan – Facility B1 363.4 - 363.4 (2.4) - 361.0 Sep 2015 Feb 2019
Acquisition facility Bank term loan – Facility C1 450.0 - 450.0 (4.5) - 445.5 Sep 2015 Sep 2020
Total bank loans 1,463.4 331.0 1,132.4 (9.3) - 1,123.1
$300m US private placement senior notes – Series A 120.0 - 120.0 (0.5) 4.1 123.6 May 2011 May 2018
$300m US private placement senior notes – Series B 120.0 - 120.0 (0.4) 10.2 129.8 May 2011 May 2021
$300m US private placement senior notes – Series C 60.0 - 60.0 (0.2) 4.2 64.0 May 2011 May 2023
$200m US private placement senior notes – Series A 50.0 - 50.0 (0.2) 2.7 52.5 Dec 2014 Dec 2021
$200m US private placement senior notes – Series B 100.0 - 100.0 (0.4) 4.4 104.0 Dec 2014 Dec 2024
$200m US private placement senior notes – Series C 50.0 - 50.0 (0.2) 2.7 52.5 Dec 2014 Dec 2026
Total loan notes 500.0 - 500.0 (1.9) 28.3 526.4
Total bank and loan notes 1,963.4 331.0 1,632.4 (11.2) 28.3 1,649.5
Bank overdraft 0.2
Other loans 3.3
Borrowings 1,653.0
¹ Drawings carried forward under the Landmark Aviation acquisition debt facilities from 2016 were $363.4m for Facility B and $450m for
Facility C. Following the completion of the sale of ASIG to John Menzies plc, part of the net proceeds was used to prepay part of Facility
B under the requirements of the loan documentation.
As at 30 June 2017, the Group had $500 million of U.S. private placement senior loan notes outstanding with $400 million accounted for at fair value through profit and loss as the fair value interest rate risk has been hedged from fixed to floating rates. The remainder is accounted for at amortised cost.
Under IFRS hedge accounting rules the fair value movement on the loan notes is booked to interest and is offset by the fair value movement on the underlying interest rate swaps.
The Group excludes the fair value movement on its loan notes from its definition of net debt (note 17), as this movement is offset by the change in fair value of the underlying interest rate swaps. The fair value gain on its loan notes at 30 June 2017 was $8.7 million (30 June 2016: $28.3 million; 31 December 2016: $8.8 million).
All other borrowings are held at amortised cost.

BBA Aviation plc – Interim Results, 1 August 2017
24
8 Financial instruments
Categories of financial instruments
The carrying values of the financial instruments of the Group are analysed below:
30 June
2017 30 June
2016 31 December
2016
Carrying
value Carrying
value Carrying
value
$m $m $m
Financial assets
Fair value through profit or loss – foreign exchange contracts a - 13.7 2.7
Derivative instruments held in fair value hedges b 5.8 24.6 5.5
Derivative instruments held in cash flow hedges 4.7 0.3 3.9
Available for sale investments 4.5 6.6 4.5
Trade and other receivables (including cash and cash equivalents) c, d 380.2 371.3 406.5
395.2 416.5 423.1
Financial liabilities
Fair value through profit or loss – foreign exchange contracts a (4.8) (0.9) (0.9)
Derivative instruments held in cash flow hedges b (4.7) (25.1) (9.4)
Financial liabilities at amortised cost (1,305.5) (1,516.5) (1,507.4)
Financial liabilities at fair value (406.3) (422.0) (406.4)
(1,721.3) (1,964.5) (1,924.1)
a The foreign exchange contracts disclosed as fair value through profit or loss are not designated in a formal hedging relationship and are used to hedge foreign currency flows
through the BBA Aviation plc company bank accounts to ensure that the Group is not exposed to foreign exchange risk through the management of its international cash
management structure.
b Derivative instruments held in fair value hedges are designated in formal hedging relationships and are used to hedge the change in fair value of fixed rate US dollar borrowings.
c Recoveries from third parties in respect of environmental and other liabilities totalling $5.7 million (30 June 2016: $4.8 million; 31 December 2016: $5.7m) are included within trade
and other receivables.
d The carrying value of trade and other receivables, and other payables approximates their fair value.
Derivative financial instruments
The fair values and notional amounts of derivative financial instruments are shown below. The fair value on initial recognition is the transaction price unless part of the consideration given or received is for something other than the instrument itself. The fair value of derivative financial instruments is subsequently calculated using discounted cash flow techniques or other appropriate pricing models. All valuation techniques take into account assumptions based upon available market data at the balance sheet date. The notional amounts are based on the contractual gross amounts at the balance sheet date.
The fair values of the available for sale investments and derivative financial instruments are categorised within Level 2 of the fair value hierarchy on the basis that their fair value has been calculated using inputs that are observable in active markets which are related to the individual asset or liability. The Group does not have any derivative financial instruments which would be categorised as either Level 1 or 3 of the fair value hierarchy.

BBA Aviation plc – Interim Results, 1 August 2017
25
8 Financial instruments - continued
30 June 2017 30 June 2017 30 June 2016 30 June 2016 31 December
2016 31 December
2016
Notional amount Fair value
Notional amount Fair value
Notional amount Fair value
Derivative financial assets $m $m $m $m $m $m
Derivatives not in a formal hedging relationship
Foreign exchange forward contracts 1.6 - 175.9 13.7 159.9 2.7
Fair value hedges
Interest rate swaps (400.0) 5.8 (400.0) 24.6 (400.0) 5.5
Cash flow hedges
Interest rate swaps (567.5) 2.8 - - (590.0) 3.4
Foreign exchange forward contracts (55.3) 1.9 4.5 0.3 1.9 0.5
(1,021.2) 10.5 (219.6) 38.6 (828.2) 12.1
30 June 2017 30 June 2017 30 June 2016 30 June 2016
31 December 2016
31 December 2016
Notional amount Fair value
Notional amount Fair value
Notional amount Fair value
Derivative financial liabilities $m $m $m $m $m $m
Derivatives not in a formal hedging relationship
Foreign exchange forward contracts 351.9 (4.8) (9.1) (0.9) 48.4 (0.9)
Cash flow hedges
Interest rate swaps (275.0) (2.5) (1,085.3) (19.6) (455.0) (3.5)
Foreign exchange forward contracts (19.8) (2.2) (55.4) (5.5) (55.5) (5.9)
57.1 (9.5) (1,149.8) (26.0) (462.1) (10.3)
Adjustments relating to the credit risk of BBA Aviation plc and its counterparties, as defined within IFRS 13, are immaterial in the current period and prior periods.

BBA Aviation plc – Interim Results, 1 August 2017
26
9 Net cash flow from operating activities
Six months
ended 30 June 2017
Restated Six months
ended 30 June 2016
Restated Year ended
31 December 2016
$m $m $m
Operating profit 122.9 62.1 166.1
Operating (loss) / profit from discontinued operations (0.2) 13.3 26.8
Share of profit from associates and joint ventures (1.7) (11.0) (13.4)
Profit from operations 121.0 64.4 179.5
Depreciation of property, plant and equipment 35.5 38.1 69.7
Amortisation of intangible assets 54.3 59.5 114.2
Loss / (profit) on sale of property, plant and equipment 0.6 (2.2) (4.3)
Share-based payment expense 3.9 3.1 6.1
(Decrease) / increase in provisions (4.8) (0.1) (7.8)
Pension scheme payments (2.1) (2.6) (6.6)
Other non-cash items (2.5) (3.1) 2.5
Unrealised foreign exchange movements (0.6) 0.6 1.3
Operating cash inflows before movements in working capital 205.3 157.7 354.6
Increase / (decrease) in working capital (65.1) 9.3 36.1
Cash generated by operations 140.2 167.0 390.7
Net income taxes paid (18.8) (7.0) (15.8)
Net cash inflow from operating activities 121.4 160.0 374.9
10 Acquisitions
On 29 March 2017 the Group’s Ontic business acquired the manufacturing rights and processes from Pratt & Whitney
Canada for selected JT15D engine component parts for a total consideration of $1.9 million, of which is $0.7m is deferred. The rights and processes acquired in this acquisition constitute a business under the definition of IFRS 3.
In the period since acquisition, the operations acquired have contributed $0.1 million to revenue and operating profit
respectively. If the acquisitions had occurred on the first day of the financial year, the total revenue and operating profi t from these acquisitions is estimated to be $0.1 million respectively.
As disclosed in the 2016 annual report and accounts Ontic completed the acquisition of the GE Aviation portfolio and the
Q400 parts series. These transactions remain in their measurement period, work on the finalisation of the purchase price accounting remains ongoing.
In the prior year the Group acquired Landmark Aviation which was a material acquisition. Further information in relation to
the purchase price accounting for the acquisition is available in the 2016 annual report and accounts.
11 Disposals
On 31 January 2017 the Group completed the sale of its ASIG business and received gross proceeds of $202.0 million. The net proceeds of $180.4 million are stated after disposal costs and a provisional working capital and net debt adjustment to the proceeds.

BBA Aviation plc – Interim Results, 1 August 2017
27
12 Related party transactions
Transactions between the Group and its subsidiaries, which are related parties, have been eliminated on consolidation and are not disclosed in this note. Details of transactions between the Group and other related parties are detailed below.
During the period, Group companies entered into the following transactions with related parties who are not members of the Group:
Sales of goods Purchases of goods
Six months ended
30 June 2017
Six months ended
30 June 2016
Year ended 31 December
2016
Six months ended
30 June 2017
Six months ended
30 June 2016
Year ended 31 December
2016
$m $m $m $m $m $m
Associates and joint ventures 2.1 8.5 5.7 303.6 138.9 292.5
Amounts owed by related parties Amounts owed to related parties
30 June
2017 30 June
2016 31 December
2016 30 June
2017 30 June
2016 31 December
2016
$m $m $m $m $m $m
Associates and joint ventures 1.2 1.5 1.5 91.6 62.2 46.8
Purchases of goods principally relates to the purchase of aviation fuel. Purchases were made at market price, discounted to reflect the quantity of goods purchased. The amounts outstanding are unsecured and will be settled in cash. No guarantees have been given or received.
In addition, in the prior year Group companies had loan receivables from an associated undertaking at the comparative balance sheet dates (30 June 2016: $2.4 million; 31 December 2016: $2.2 million). The loans were unsecured, were expected to be settled in cash, and were made on terms which reflect the relationships between the parties. The loans were settled through the sale of the ASIG business, see note 14.
The Group has various pension and other post-retirement benefit schemes for its employees. Details are set out in note 13.
13 Pensions and other post-retirement benefits
The Group operates a number of plans worldwide, both of the defined benefit and defined contribution type. The defined benefit obligation at 30 June 2017 is estimated based on the latest actuarial valuations (31 March 2015 for the Group’s main UK plan and 1 January 2017 for the Group’s US plans) with assumptions updated where appropriate to reflect market conditions as at 30 June 2017 and plan assets updated to reflect their market value as at 30 June 2017. Pension costs are calculated by independent qualified actuaries, using the projected unit method and assumptions appropriate to the arrangements in place. As at 30 June 2017, the Group’s net defined benefit liability amounted to $80.1 million (30 June 2016: $49.4 million; 31 December 2016: $82.8 million). The reduction in the net deficit of $2.7 million since 31 December 2016 reflects the favourable impact of better than expected returns on plan assets and employer contributions, more than offsetting unfavourable impacts from foreign exchange movements, net interest costs and administration expenses.

BBA Aviation plc – Interim Results, 1 August 2017
28
14 Discontinued operations
It was announced on 16 September 2016 that the Group had reached agreement with John Menzies plc ("Menzies") on the terms of the sale of ASIG, a leading commercial aviation services company, for $202 million in cash. On 31 January 2017 the Group announced the completion of the sale and that all the terms of the transaction remain as outlined in the announcement made on 16 September 2016. As a major line of the Group’s business the ASIG operations have been classified as a discontinued operation. Results of discontinued operations
Six months ended 30 June 2017
Restated Six months ended 30 June 2016
Year ended 31 December 2016
Underlying1
Exceptional and other
Items Total Underlying1
Exceptional and other
Items Total Underlying1
Exceptional and other
Items Total
Note $m $m $m $m $m $m $m $m $m
Revenue 2 38.2 - 38.2 208.8 - 208.8 416.8 - 416.8
Cost of sales (35.7) - (35.7) (190.0) - (190.0) (373.9) - (373.9)
Gross profit
2.5 - 2.5 18.8 - 18.8 42.9 - 42.9
Distribution costs - - - (0.7) - (0.7) (2.0) - (2.0)
Administrative expenses (2.7) - (2.7) (13.5) (0.7) (14.2) (31.9) (0.7) (32.6)
Other operating income
- - - 1.2 - 1.2 1.1 - 1.1
Other operating expenses - - - (1.1) - (1.1) (1.2) - (1.2)
Operating (loss)/profit incl. group charges
(0.2) - (0.2) 4.7 (0.7) 4.0 8.9 (0.7) 8.2
Elimination of internal group charges
- - - 9.3 - 9.3 18.6 - 18.6
Operating (loss)/profit 2 (0.2) - (0.2) 14.0 (0.7) 13.3 27.5 (0.7) 26.8
Impairment and other charges on classification as held for sale
- (6.6) (6.6) - (128.9) (128.9) - (109.1) (109.1)
Investment income - - - 0.1 - 0.1 0.3 - 0.3
Finance costs - - - (0.2) - (0.2) (0.4) - (0.4)
(Loss)/profit before tax (0.2) (6.6) (6.8) 13.9 (129.6) (115.7) 27.4 (109.8) (82.4)
Tax (expense)/credit - (25.3) (25.3) (1.6) - (1.6) (9.5) 12.3 2.8
(Loss)/profit for the period
(0.2) (31.9) (32.1) 12.3 (129.6) (117.3) 17.9 (97.5) (79.6)
Attributable to:
Equity holders of BBA Aviation plc
(0.2) (31.9) (32.1) 12.4 (129.6) (117.2) 18.3 (97.5) (79.2)
Non-controlling interests
- - - (0.1) - (0.1) (0.4) - (0.4)
(Loss)/profit for the period
(0.2) (31.9) (32.1) 12.3 (129.6) (117.3) 17.9 (97.5) (79.6)
Earnings per share Note Adjusted1 Unadjusted Adjusted1 Unadjusted Adjusted1 Unadjusted
Basic 5 -¢ (3.1)¢ 1.2¢ (11.4)¢ 1.7¢ (7.7)¢
Diluted 5 -¢ (3.1)¢ 1.2¢ (11.4)¢ 1.7¢ (7.7)¢
1 Underlying profit and adjusted earnings per share is stated before exceptional and other items.
All exceptional and other items relate to the amortisation of intangible assets arising on acquisition and valued in accordance with IFRS 3.

BBA Aviation plc – Interim Results, 1 August 2017
29
14 Discontinued operations - continued
Cash flows (used in)/from discontinued operations
Six months
ended 30 June 2017
Six months ended 30 June
2016
Year ended 31 December
2016
$m $m $m
Net cash (outflow)/inflow from operating activities (24.8) 2.8 18.8
Net cash outflow from investing activities 0.2 (5.4) (10.0)
Net cash outflow from financing activities - (0.2) (1.7)
Net cash (outflow)/inflow for the period (24.6) (2.8) 7.1
15 Share capital
Ordinary share capital as at 30 June 2017 amounted to $508.8 million (30 June 2016: $508.6 million; 31 December 2016: $508.7 million). During the period the Group issued 0.5 million (30 June 2016: 0.4 million; 31 December 2016: 0.2 million) ordinary shares to satisfy options exercised and the vesting of share awards under the Group’s various share schemes. The consideration for shares issued in respect of share options was $0.1 million (30 June 2016: $0.1 million; 31 December 2016: $0.3 million).
The number of shares in issue as at 30 June 2017 was 1,045.4 million (30 June 2016: 1,044.9 million; 31 December 2016: 1,044.9 million).
16 Risks and uncertainties
There are a number of potential risks and uncertainties which could have a material impact on the Group's performance over the remaining six months of the financial year and could cause actual results to differ materially from expected and historical results. The directors do not consider that the principal risks and uncertainties have changed since the publication of the annual report for the year ended 31 December 2016. The risks and uncertainties are summarised below:
General economic downturn leading to a reduction in revenues and profits as a result of reduced B&GA and commercial flying and military expenditure.
Catastrophic global event (terrorism, weather) with a material impact on global air travel leading to a reduction in revenues and profits as a result of reduced B&GA and commercial flying.
Legislative changes causing a material increase to the cost of BG&A flight relative to alternatives leading to a reduction in revenues and profits as a result of a reduction in B&GA flying hours.
Ability to attract and retain high quality and capable people resulting in a loss of key personnel, lack of internal successors to key management roles, and short to medium term disruption to the business.
Potential liabilities from defects in services and products resulting in adverse reputational impact with associated deterioration in customer relationships and a loss of earnings from liability claims.
Intentional or inadvertent non-compliance with legislation leading to adverse reputational impact and exposure to potential litigation or criminal proceedings.
Environmental exposures resulting in a loss of earnings from the cost to remediate or from potential litigation, the potential for the loss of licence to operate, or greater than expected liabilities associated with historical operations.
Non-compliance with banking covenants caused by increase in debt funding as a result of the Landmark Aviation acquisition and tighter regulatory environment around sanctions compliance.
Changes in tax regulation in both the USA and EMEA could impact our effective tax rate and our cash tax liabilities.
Impact of a successful cyber attack leading to a loss of critical data or a significant disruption to the operation of the business.
The threat of competitor activity to replicate the Group’s market-leading position following the purchase of Landmark Aviation.

BBA Aviation plc – Interim Results, 1 August 2017
30
17 Alternative performance measures
Introduction
The directors assess the performance of the Group using a variety of alternative performance measures and principally discuss the Group’s results on an ‘adjusted’ and/or ‘underlying’ basis. The rationale for using adjusted measures is explained below. Results on an adjusted basis are presented before exceptional and other items. The directors also explain financial performance using measures that are not defined under IFRS and are therefore termed ‘non-GAAP’ measures or, “Alternative Performance Measures” (APMs). The APMs used in this Interim Report are: organic revenue growth, underlying operating profit and margin, underlying and reported EBITDA, underlying profit before tax, underlying deferred tax, adjusted and cash earnings per share, return on invested capital, operating cash flow, free cash flow, cash conversion, and net debt. A reconciliation from these non-GAAP measures to the nearest measure prepared in accordance with IFRS is presented below. The alternative performance measures we use may not be directly comparable with similarly titled measures used by other companies. Exceptional items
The Group’s income statement and segmental analysis separately identify trading results before exceptional and other items. The directors believe that presentation of the Group’s results in this way is relevant to an understanding of the Group’s financial performance, as exceptional and other items are identified by virtue of their size, nature or incidence. This presentation is consistent with the way that financial performance is measured by management and reported to the Board and the Executive Committee and assists in providing a meaningful analysis of the trading results of the Group. In determining whether an event or transaction is treated as an exceptional and other item, management considers quantitative as well as qualitative factors such as the frequency or predictability of occurrence. Examples of charges or credits meeting the above definition and which have been presented as exceptional and other items in the current and/or prior years include acquisitions/disposals of significant businesses and investments, regulatory settlements, business restructuring programmes, and asset impairment charges. In the event that other items meet the criteria, which are applied consistently from year to year, they are also treated as exceptional and other items. Exceptional and other items are disclosed in note 3 to the consolidated financial statements. Organic revenue growth
Organic revenue growth is a measure which seeks to reflect the performance of the Group that will contribute to long-term sustainable growth. As such organic revenue growth excludes the impact of acquisitions or disposals, fuel price movements and foreign exchange movements. We focus on the trends in organic revenue growth. A reconciliation from the growth in reported revenue, the most directly comparable IFRS measures, to the organic revenue growth, is set out below.
2017 H1 Continuing
$m
2016 H1 Continuing
$m
2016 Continuing
$m
Reported revenue prior period 1,020.6 882.3 1,714.0
Rebase for foreign exchange (12.6) (9.0) (27.9)
Rebase for fuel 52.2 (52.6) (56.9)
Rebase for disposals - - -
Like for like revenue prior period 1,060.2 820.7 1,629.2
Reported revenue 1,145.5 1,020.6 2,149.1
Less acquisitions (74.0) (246.2) (558.7)
Organic revenue current period 1,071.5 774.4 1,590.4
Organic revenue growth 1.1% (5.6%) (2.4%)

BBA Aviation plc – Interim Results, 1 August 2017
31
17 Alternative performance measures - continued
Underlying operating profit and margin
Underlying operating profit and margin are measures which seek to reflect the underlying performance of the Group that will contribute to long-term sustainable profitable growth. As such they exclude the impact of exceptional and other items. The directors focus on the trends in underlying operating profit and margins. A reconciliation from operating profit, the most directly comparable IFRS measure, to the underlying operating profit and margin, is set out below.
2017 H1 Total
$m
2017 H1 Continuing
$m
2016 H1 Total
$m
2016 H1 Continuing
$m
2016 Total
$m
2016 Continuing
$m
Reported revenue 1,183.7 1,145.5 1,229.4 1,020.6 2,565.9 2,149.1
Operating profit 122.7 122.9 75.4 62.1 192.9 166.1
Exceptional and other items 52.0 52.0 74.2 73.5 137.2 136.5
Underlying operating profit 174.7 174.9 149.6 135.6 330.1 302.6
2017 H1 Total
%
2017 H1 Continuing
%
2016 H1 Total
%
2016 H1 Continuing
%
2016 Total
%
2016 Continuing
%
Operating margin 10.4% 10.7% 6.1% 6.1% 7.5% 7.7%
Underlying operating margin 14.8% 15.3% 12.2% 13.3% 12.9% 14.1%
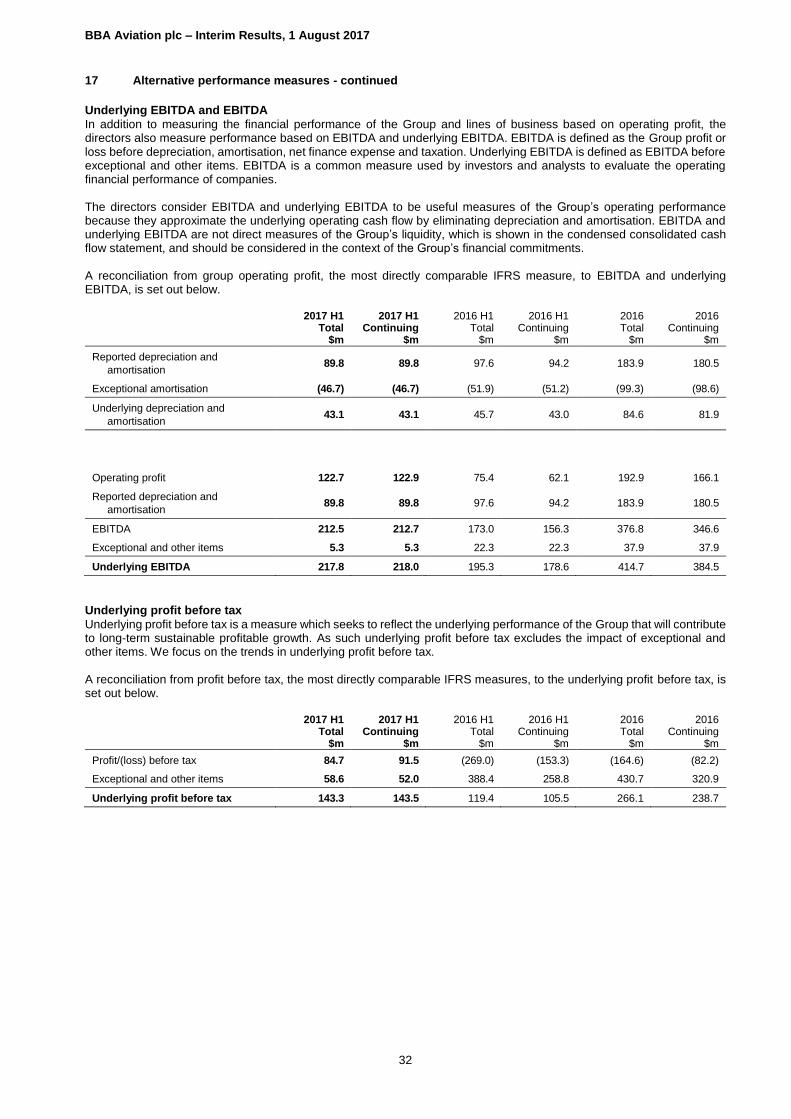
BBA Aviation plc – Interim Results, 1 August 2017
32
17 Alternative performance measures - continued
Underlying EBITDA and EBITDA
In addition to measuring the financial performance of the Group and lines of business based on operating profit, the directors also measure performance based on EBITDA and underlying EBITDA. EBITDA is defined as the Group profit or loss before depreciation, amortisation, net finance expense and taxation. Underlying EBITDA is defined as EBITDA before exceptional and other items. EBITDA is a common measure used by investors and analysts to evaluate the operating financial performance of companies. The directors consider EBITDA and underlying EBITDA to be useful measures of the Group’s operating performance because they approximate the underlying operating cash flow by eliminating depreciation and amortisation. EBITDA and underlying EBITDA are not direct measures of the Group’s liquidity, which is shown in the condensed consolidated cash flow statement, and should be considered in the context of the Group’s financial commitments. A reconciliation from group operating profit, the most directly comparable IFRS measure, to EBITDA and underlying EBITDA, is set out below.
2017 H1 Total
$m
2017 H1 Continuing
$m
2016 H1 Total
$m
2016 H1 Continuing
$m
2016 Total
$m
2016 Continuing
$m
Reported depreciation and
amortisation 89.8 89.8 97.6 94.2 183.9 180.5
Exceptional amortisation (46.7) (46.7) (51.9) (51.2) (99.3) (98.6)
Underlying depreciation and
amortisation 43.1 43.1 45.7 43.0 84.6 81.9
Operating profit 122.7 122.9 75.4 62.1 192.9 166.1
Reported depreciation and
amortisation 89.8 89.8 97.6 94.2 183.9 180.5
EBITDA 212.5 212.7 173.0 156.3 376.8 346.6
Exceptional and other items 5.3 5.3 22.3 22.3 37.9 37.9
Underlying EBITDA 217.8 218.0 195.3 178.6 414.7 384.5
Underlying profit before tax
Underlying profit before tax is a measure which seeks to reflect the underlying performance of the Group that will contribute to long-term sustainable profitable growth. As such underlying profit before tax excludes the impact of exceptional and other items. We focus on the trends in underlying profit before tax. A reconciliation from profit before tax, the most directly comparable IFRS measures, to the underlying profit before tax, is set out below.
2017 H1 Total
$m
2017 H1 Continuing
$m
2016 H1 Total
$m
2016 H1 Continuing
$m
2016 Total
$m
2016 Continuing
$m
Profit/(loss) before tax 84.7 91.5 (269.0) (153.3) (164.6) (82.2)
Exceptional and other items 58.6 52.0 388.4 258.8 430.7 320.9
Underlying profit before tax 143.3 143.5 119.4 105.5 266.1 238.7
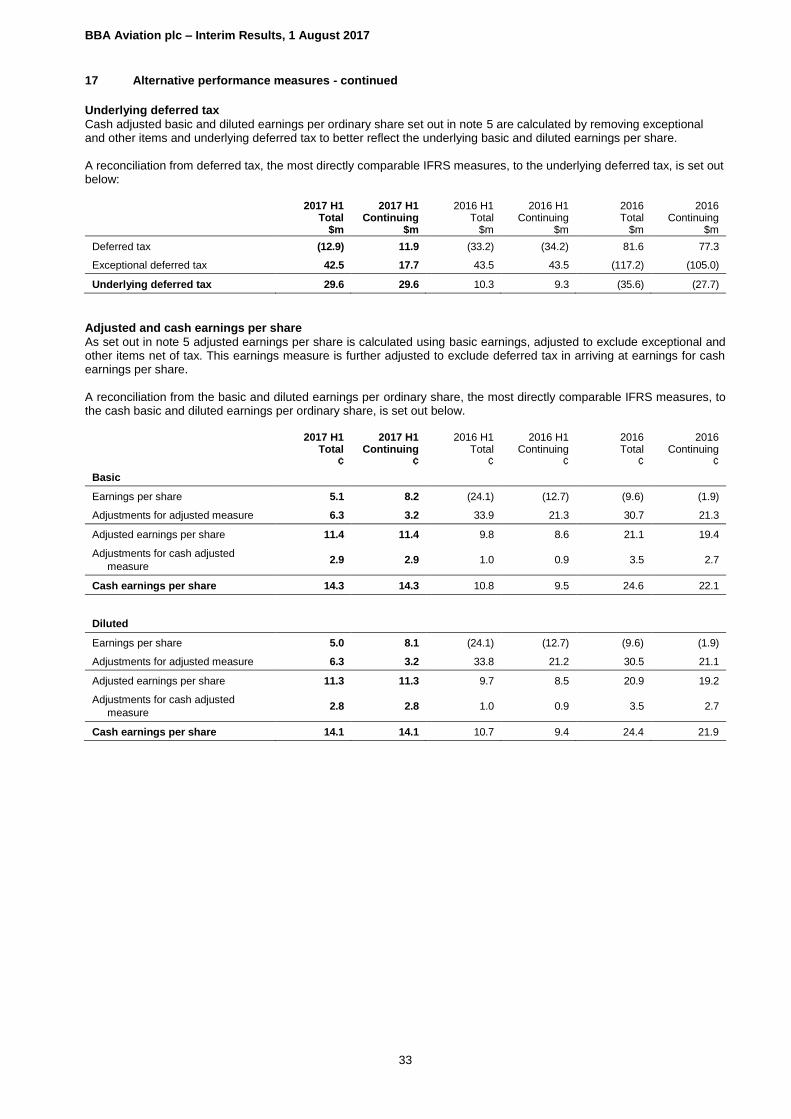
BBA Aviation plc – Interim Results, 1 August 2017
33
17 Alternative performance measures - continued
Underlying deferred tax
Cash adjusted basic and diluted earnings per ordinary share set out in note 5 are calculated by removing exceptional and other items and underlying deferred tax to better reflect the underlying basic and diluted earnings per share. A reconciliation from deferred tax, the most directly comparable IFRS measures, to the underlying deferred tax, is set out below:
2017 H1 Total
$m
2017 H1 Continuing
$m
2016 H1 Total
$m
2016 H1 Continuing
$m
2016 Total
$m
2016 Continuing
$m
Deferred tax (12.9) 11.9 (33.2) (34.2) 81.6 77.3
Exceptional deferred tax 42.5 17.7 43.5 43.5 (117.2) (105.0)
Underlying deferred tax 29.6 29.6 10.3 9.3 (35.6) (27.7)
Adjusted and cash earnings per share
As set out in note 5 adjusted earnings per share is calculated using basic earnings, adjusted to exclude exceptional and other items net of tax. This earnings measure is further adjusted to exclude deferred tax in arriving at earnings for cash earnings per share. A reconciliation from the basic and diluted earnings per ordinary share, the most directly comparable IFRS measures, to the cash basic and diluted earnings per ordinary share, is set out below.
2017 H1 Total
¢
2017 H1 Continuing
¢
2016 H1 Total
¢
2016 H1 Continuing
¢
2016 Total
¢
2016 Continuing
¢
Basic
Earnings per share 5.1 8.2 (24.1) (12.7) (9.6) (1.9)
Adjustments for adjusted measure 6.3 3.2 33.9 21.3 30.7 21.3
Adjusted earnings per share 11.4 11.4 9.8 8.6 21.1 19.4
Adjustments for cash adjusted
measure 2.9 2.9 1.0 0.9 3.5 2.7
Cash earnings per share 14.3 14.3 10.8 9.5 24.6 22.1
Diluted
Earnings per share 5.0 8.1 (24.1) (12.7) (9.6) (1.9)
Adjustments for adjusted measure 6.3 3.2 33.8 21.2 30.5 21.1
Adjusted earnings per share 11.3 11.3 9.7 8.5 20.9 19.2
Adjustments for cash adjusted
measure 2.8 2.8 1.0 0.9 3.5 2.7
Cash earnings per share 14.1 14.1 10.7 9.4 24.4 21.9
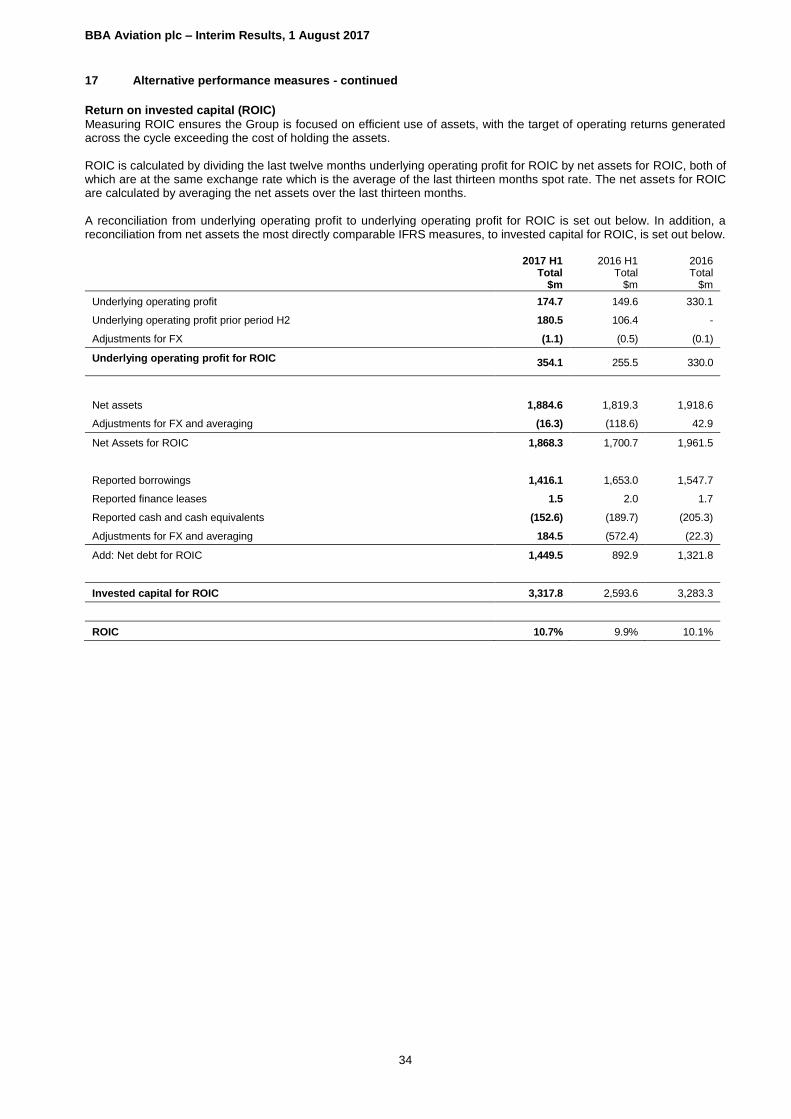
BBA Aviation plc – Interim Results, 1 August 2017
34
17 Alternative performance measures - continued
Return on invested capital (ROIC)
Measuring ROIC ensures the Group is focused on efficient use of assets, with the target of operating returns generated across the cycle exceeding the cost of holding the assets. ROIC is calculated by dividing the last twelve months underlying operating profit for ROIC by net assets for ROIC, both of which are at the same exchange rate which is the average of the last thirteen months spot rate. The net assets for ROIC are calculated by averaging the net assets over the last thirteen months. A reconciliation from underlying operating profit to underlying operating profit for ROIC is set out below. In addition, a reconciliation from net assets the most directly comparable IFRS measures, to invested capital for ROIC, is set out below.
2017 H1 Total
$m
2016 H1 Total
$m
2016 Total
$m
Underlying operating profit 174.7 149.6 330.1
Underlying operating profit prior period H2 180.5 106.4 -
Adjustments for FX (1.1) (0.5) (0.1)
Underlying operating profit for ROIC 354.1 255.5 330.0
Net assets 1,884.6 1,819.3 1,918.6
Adjustments for FX and averaging (16.3) (118.6) 42.9
Net Assets for ROIC 1,868.3 1,700.7 1,961.5
Reported borrowings 1,416.1 1,653.0 1,547.7
Reported finance leases 1.5 2.0 1.7
Reported cash and cash equivalents (152.6) (189.7) (205.3)
Adjustments for FX and averaging 184.5 (572.4) (22.3)
Add: Net debt for ROIC 1,449.5 892.9 1,321.8
Invested capital for ROIC 3,317.8 2,593.6 3,283.3
ROIC 10.7% 9.9% 10.1%

BBA Aviation plc – Interim Results, 1 August 2017
35
17 Alternative performance measures - continued
Operating cash flow
Operating cash flow is one of the key performance indicators by which our financial performance is measured. Operating cash flow is defined as the aggregate of cash generated by operations, purchase of property, plant and equipment, purchase of intangible assets less Ontic licences, and proceeds from disposal of property plant and equipment. Operating cash flow is primarily an overall operational performance measure. However, we also believe it is an important indicator of our liquidity. Operating cash flow reflects the cash we generate from operations after net capital expenditure which is a significant ongoing cash outflow associated with investing in our infrastructure. In addition, operating cash flow excludes cash flows that are determined at a corporate level independently of ongoing trading operations such as dividends, share buybacks, acquisitions and disposals, financing costs, tax payments, dividends from associates and the repayment and raising of debt. Operating cash flow is not a measure of the funds that are available for distribution to shareholders.
2017 H1 Total
$m
2016 H1 Total
$m
2016 Total
$m
Reported cash generated by operations 140.2 167.0 390.7
Reported purchase of property, plant and equipment (35.9) (48.1) (101.6)
Reported purchase of intangible assets (2.3) (8.3) (11.4)
Ontic licences - 6.8 10.6
Add: Reported proceeds from disposal of property, plant and equipment 0.3 7.6 11.1
Operating cash flow 102.3 125.0 299.4
Free cash flow
Free cash flow is reconciled to net cash inflow from operating activities, the most directly comparable IFRS measure below.
2017 H1 Total
$m
2016 H1 Total
$m
2016 Total
$m
Net cash inflow from operating activities 121.4 160.0 374.9
Dividends received from associates 1.9 3.2 2.4
Purchase of property, plant and equipment (35.9) (48.1) (101.6)
Purchase of intangible assets 1 (2.3) (1.5) (0.8)
Proceeds from disposal of property, plant and equipment 0.3 7.6 11.1
Interest received 0.5 1.7 2.7
Interest paid (29.2) (31.1) (64.5)
Interest element of finance leases paid (0.1) (0.1) (0.1)
Free cash flow 56.6 91.7 224.1
1 Purchase of intangible assets excludes $nil million (30 June 2016: $6.8 million; 31 December 2016: $10.6 million) paid in respect of Ontic licences since the directors believe these payments are more akin to expenditure in relation to acquisitions, and are therefore outside of the Group’s definition of free cash flow. These amounts are included within purchase of intangible assets on the face of the cash flow statement.
Cash conversion
Cash conversion is a key part of the Group strategy for disciplined capital management with absolute cash generation and strong cash conversion. Cash conversion is defined as operating cash flow as a percentage of continuing and discontinued operating profit. Operating cash flow has been reconciled above to the most directly comparable IFRS measure, being cash generated from operations.
2017 H1 Total
%
2016 H1 Total
%
2016 Total
%
Cash conversion 83% 166% 155%

BBA Aviation plc – Interim Results, 1 August 2017
36
17 Alternative performance measures - continued
Net debt
Net debt consists of borrowings (both current and non-current), less cash and cash equivalents and the fair value adjustment on the US Private placement loan. Net debt is a measure of the Group’s net indebtedness that provides an indicator of the overall balance sheet strength. It is also a single measure that can be used to assess both the Group’s cash position and its indebtedness. The use of the term ‘net debt’ does not necessarily mean that the cash included in the net debt calculation is available to settle the liabilities included in this measure. Net debt is considered to be an alternative performance measure as it is not defined in IFRS. The most directly comparable IFRS measure is the aggregate of borrowings (current and non-current), and cash and cash equivalents. A reconciliation from these to net debt is given below.
2017 H1 Total
$m
2017 H1 Continuing
$m
2016 H1 Total
$m
2016 H1 Continuing
$m
2016 Total
$m
2016 Continuing
$m
Reported borrowings (1,416.1) (1,416.1) (1,653.0) (1,653.0) (1,547.7) (1,547.7)
Reported finance leases (1.5) (1.5) (2.0) (2.0) (1.7) (1.7)
Reported cash and cash equivalents 152.6 152.6 189.7 164.8 205.3 182.5
Fair value adjustment on USPP 8.7 8.7 28.3 28.3 8.8 8.8
Net debt (1,256.3) (1,256.3) (1,437.0) (1,461.9) (1,335.3) (1,358.1)

BBA Aviation plc – Interim Results, 1 August 2017
37
Independent Review Report to BBA Aviation plc
We have been engaged by the Company to review the condensed set of financial statements in the half-yearly financial report for the six months ended 30 June 2017 which comprises the consolidated income statement, the consolidated statement of comprehensive (loss) / income, the consolidated balance sheet, the consolidated cash flow statement, the consolidated statement of changes in equity, and related notes 1 to 17. We have read the other information contained in the half-yearly financial report and considered whether it contains any apparent misstatements or material inconsistencies with the information in the condensed set of financial statements. This report is made solely to the Company in accordance with International Standard on Review Engagements (UK and Ireland) 2410 “Review of Interim Financial Information Performed by the Independent Auditor of the Entity” issued by the Auditing Practices Board. Our work has been undertaken so that we might state to the Company those matters we are required to state to it in an independent review report and for no other purpose. To the fullest extent permitted by law, we do not accept or assume responsibility to anyone other than the company, for our review work, for this report, or for the conclusions we have formed. Directors’ responsibilities
The half-yearly financial report is the responsibility of, and has been approved by, the directors. The directors are responsible for preparing the half-yearly financial report in accordance with the Disclosure and Transparency Rules of the United Kingdom’s Financial Conduct Authority. As disclosed in note 1, the annual financial statements of the Group are prepared in accordance with IFRSs as adopted by the European Union. The condensed set of financial statements included in this half-yearly financial report has been prepared in accordance with International Accounting Standard 34, “Interim Financial Reporting,” as adopted by the European Union. Our responsibility
Our responsibility is to express to the Company a conclusion on the condensed set of financial statements in the half-yearly financial report based on our review. Scope of review
We conducted our review in accordance with International Standard on Review Engagements (UK and Ireland) 2410 “Review of Interim Financial Information Performed by the Independent Auditor of the Entity” issued by the Auditing Practices Board for use in the United Kingdom. A review of interim financial information consists of making inquiries, primarily of persons responsible for financial and accounting matters, and applying analytical and other review procedures. A review is substantially less in scope than an audit conducted in accordance with International Standards on Auditing (UK and Ireland) and consequently does not enable us to obtain assurance that we would become aware of all significant matters that might be identified in an audit. Accordingly, we do not express an audit opinion. Conclusion
Based on our review, nothing has come to our attention that causes us to believe that the condensed set of financial statements in the half-yearly financial report for the six months ended 30 June 2017 is not prepared, in all material respects, in accordance with International Accounting Standard 34 as adopted by the European Union and the Disclosure and Transparency Rules of the United Kingdom’s Financial Conduct Authority. Deloitte LLP
Statutory Auditor London, United Kingdom 31 July 2017