gabon: selected issues - imfgabon: selected issues this selected issues paper for gabon was prepared...
TRANSCRIPT
© 2006 International Monetary Fund June 2006 IMF Country Report No. 06/232
January 29, 2001 January 29, 2001 January 29, 2001 January 29, 2001 January 29, 2001
Gabon: Selected Issues
This Selected Issues paper for Gabon was prepared by a staff team of the International Monetary Fund as background documentation for the periodic consultation with the member country. It is based on the information available at the time it was completed on May 24, 2006. The views expressed in this document are those of the staff team and do not necessarily reflect the views of the government of Gabon or the Executive Board of the IMF. The policy of publication of staff reports and other documents by the IMF allows for the deletion of market-sensitive information. To assist the IMF in evaluating the publication policy, reader comments are invited and may be sent by e-mail to [email protected].
Copies of this report are available to the public from
International Monetary Fund • Publication Services
700 19th Street, N.W. • Washington, D.C. 20431 Telephone: (202) 623-7430 • Telefax: (202) 623-7201
E-mail: [email protected] • Internet: http://www.imf.org
Price: $15.00 a copy
International Monetary Fund Washington, D.C.

1
INTERNATIONAL MONETARY FUND
GABON
Selected Issues
Prepared by Jan-Peter Olters, Oscar Melhado (both AFR), Daniel Leigh and Moataz El-Said (both FAD)
Approved by the African Department
May 24, 2006
Contents
I. Introduction ............................................................................................................................3
II. Natural Resource Depletion, Habit Formation, and Sustainable Fiscal Policy: Lessons from Gabon ..................................................................................................................4
A. Introduction...............................................................................................................4 B. Background ...............................................................................................................5 C. Theoretical Framework .............................................................................................7 D. Results and Sensitivity Tests...................................................................................13 E. Extensions................................................................................................................14 F. Concluding Remarks ...............................................................................................18 References....................................................................................................................20
III. Why Do Banks Not Want to Be Banks? Credit Growth and Socio-Economic Development in Gabon .................................................22
A. Introduction.............................................................................................................22 B. Financial Intermediation and Growth .....................................................................23 C. Banks in Gabon .......................................................................................................26 D. The Banks’ Profit Maximization Problem..............................................................31 E. Policy Implications and Preliminary Conclusions ..................................................35 References....................................................................................................................37
IV. Fuel Price Subsidies in Gabon: Fiscal Cost and Social Impact .........................................39 A. Introduction.............................................................................................................39 B. The Magnitude of Fuel Price Subsidies in Gabon...................................................40 C. Comparison with Selected Developing and Emerging Market Countries ..............43 D. Poverty and Social Impact Analysis (PSIA) of the Fuel Price Subsidies ...............44 E. Mitigating the Effect of Price Increases on the Poor...............................................48 F. Conclusion ...............................................................................................................50 References....................................................................................................................51

2
V. Gabon: Assessing the Quality of Public Investment...........................................................52 A. Introduction.............................................................................................................52 B. Measuring The Efficiency of Public Investment.....................................................52 C. Capital Expenditure Trends.....................................................................................53 D. The Efficiency of Public Investment in Gabon.......................................................54 E. Public Investment Versus PRSP Priorities ..............................................................57 F. The Quality of Fêtes Tournantes Public Investment ...............................................58 G. Conclusions.............................................................................................................58 References....................................................................................................................60
Tables II.1 Oil Production and Socio Economic Development .......................................................6 II.2 Baseline Assumptions..................................................................................................11 II.3 Sensitivity Analysis .....................................................................................................13 III.1 Sub-Saharan Africa and Transition Economies: Degree of Financial Intermediation 24 III.2 Commercial Bank Behavior, 2002/03–2004/05 ..........................................................26 III.3 Commercial Banks’ Credit Portfolios, 2002–05..........................................................29 III.4 A Commercial Bank’s Balance Sheet..........................................................................31 III.5 Banks’ Expected Loan Pay-Offs..................................................................................31 III.5 Interest-Rate Spread vs. Credit to Economy, 2001–05................................................35 IV.1 Calculation of Import Parity Price, June 2005.............................................................41 IV.2 Annual Cost of Implicit Fuel Price Subsidies, 2005–08..............................................42 IV.3 Required Retail Price Increases ...................................................................................43 IV.4 Fuel Price Subsidies in Selected Countries..................................................................44 IV.5 Required Fuel Price Increases, end-March 2006 .........................................................45 IV. 6 Energy Spending and Direct Subsidies Per Capita by Welfare Level .........................46 IV.7 Direct and Indirect Subsidies Per Capita by Welfare Level ........................................47 V.1 Efficiency Score for Investment (Output Efficiency)..................................................53 V.2. Health Indexes .............................................................................................................55 V.3 Education Indexes........................................................................................................56 Figures II.1 Oil Production Profile and World Oil Prices, 2005–45 ...............................................12 II.2 Real Oil GDP Profiles, 2005–45..................................................................................12 II.3 Optimal Adjustment Path Under Baseline Parameters, 2000–45 ................................15 II.4 Sensitivity Analysis on Habit Strength and the Optimal Adjustment Path, 2000–45 .15 II.5 Sensitivity Analysis and Estimated Permanently Sustainable Non-Oil Primary Balance ............................................................................................16 II.6 Introducing a Debt-Asset Interest Rate Spread, 2000–45............................................17 III.1 Sub-Saharan Africa and Transition Economies: Credit to the Economy, 2005 ..........25 III.2 High Oil Prices and Bank Liquidity, Jan. 2002–Jan. 2006..........................................27 III.3. Gabon: Bank Assets and Liabilities, Jan. 1996–Jan. 2006 ..........................................27 III.4 Interest Rate Structure, 1995–2006..............................................................................30 IV.1 Fiscal Cost of Fuel Price Subsidies, 2005....................................................................42 V.1. Capital ..........................................................................................................................53 V.2 Health Expenditures.....................................................................................................55 Appendix Summary of the Tax System, as of End-March 2006..............................................................61
3
I. INTRODUCTION
The sharp rise in energy prices since 2003 has presented oil-exporting countries like Gabon with both opportunities and risks. The large balance-of-payments and fiscal surpluses provide an opportunity to lower debt levels decisively, thereby reducing a major source of Gabon’s past vulnerability to shocks, and build up savings to smooth consumption for future generations even after oil resources are exhausted. But, while additional resources provide fiscal space to address urgent infrastructural and social development needs, economic policies need to ensure that these gains are sustainable over the medium term and provide the foundation for a diversification of the economy away from its dependence on exports of natural resources. Against this background, the following chapters examine key issues in the management of public resources and the scope for private-sector led growth. Chapter II looks at long-run fiscal sustainability. The analysis is based on a model of intertemporal social-welfare optimization that takes into account (i) adjustment costs in the form of habit formation and (ii) differential interest rates on sovereign debt and financial assets. It concludes that a sustainable long-run non-oil primary deficit is about 5 percent of non-oil GDP, compared to the 2005 level of 12 percent, and that, under the optimal adjustment path, fiscal policy should aim at reaching the sustainable deficit in about three to five years. Chapter III addresses the obstacles that have limited the access of the private sector to financial services, focusing on banks’ reluctance to extend credit. In seeking to explain the principal reasons behind this phenomenon, the chapter proposes a simple model in which banks maximize profits over costly monitoring. The narrowing interest-rate spread between deposits and loans, together with the banks’ inability to appraise effectively the quality of their loan portfolios, helps to explain the banks’ caution. Chapter IV estimates the fiscal cost and social impact of the freezing of domestic retail fuel prices since 2003. Rising oil prices have driven the total fiscal cost of the (implicit) subsidies to more than 3 percent of non-oil GDP in 2005. However, analysis of household data suggests that these subsidies mostly benefit higher-income households and that fuel price subsidies are an ineffective and costly way of protecting the real incomes of the poor. Chapter V examines the quality of capital expenditure in Gabon. Despite high levels of public investment, averaging about 5 percent of GDP over the last 15 years, their return has been disappointing. The chapter concludes that public investment has generally failed to target poverty reduction and the quality of expenditure linked to the regional independence celebrations, the fêtes tournantes expenditures, has been particularly low.
4
II. NATURAL RESOURCE DEPLETION, HABIT FORMATION, AND SUSTAINABLE FISCAL POLICY: LESSONS FROM GABON1
A. Introduction
Oil revenue currently comprises 60 percent of tax receipts in Gabon, but reserves are expected to be exhausted within three decades. Ensuring that fiscal policy is on a sustainable path is therefore a high priority. Doing so will prevent a situation in which the authorities would be forced to adjust fiscal policy rapidly as oil production is declining—a policy reaction that typically occurs to the detriment of the most disadvantaged segments of society. In combining fiscal adjustment with structural reforms aimed at diversifying the economy and strengthening governance, Gabon’s economy would be prepared for the post-oil era. This paper seeks to estimate the sustainable long-run non-oil primary deficit and the optimal adjustment path towards that level. The analysis is based on a model of intertemporal social-welfare optimization that takes into account (i) adjustment costs in the form of habit formation and (ii) differential rates on sovereign debt and financial assets. Introducing habits—the notion that consumers become addicted to the level of consumption enjoyed in previous periods—is important in the context of fiscal policy design as it directly addresses the social, political, and institutional constraints on the speed of fiscal adjustment. Allowing for different interest rates on debt and assets introduces further realism into the analysis of optimal fiscal policy and debt management. Three main conclusions emerge from the analysis. First, Gabon’s current fiscal deficit cannot be maintained in the future. The permanently sustainable non-oil primary deficit, estimated at 5.0 percent of non-oil GDP, is well below the 2005 level of 12.1 percent.2 Second, due to habit formation, the optimal policy spreads the bulk of the adjustment over three to five years, rather than making the single adjustment that standard permanent-income models prescribe. A phased adjustment is preferable to an abrupt fiscal contraction as it eases the pain on habit-forming households and thus increases the political acceptability of the needed adjustment. Third, the interest-rate differential between sovereign debt and financial assets creates an incentive to front-load adjustment and pay off net debt sooner than in the absence of the spread. In addition, given the uncertainty about future economic conditions, precautionary motives offer further incentive for front-loading the fiscal adjustment and targeting a smaller long-run deficit. For instance, a reversal of real oil prices to the 2000–05
1 Prepared by Daniel Leigh and Jan-Peter Olters. The authors gratefully acknowledge valuable comments from Steven Barnett, Mark De Broeck, Manmohan Kumar, Roger Nord, Anton op de Beke, Rolando Ossowski, Gonzalo Pastor, Mauricio Villafuerte, and participants in an AFR seminar on February 17, 2006 and a Ministry of Finance-organized seminar in Libreville, Gabon, on March 8, 2006. Any errors are our own.
2 This figure excludes expenditure on fuel subsidies and restructuring costs; see Chapter IV. The non-oil primary deficit of 12 percent of non-oil GDP in 2005 happens to coincide with the average deficit during 2000–05.
5
US$30/bbl average would reduce the permanently sustainable primary deficit to 3¾ percent of non-oil GDP. The remainder of the paper is structured as follows. Section B compares Gabon’s economic performance to that of other oil-producing countries. Section C describes the analytical framework and calibrates the model to fit Gabon’s economy. In Section D, the permanently sustainable primary deficit is estimated and the optimal adjustment path towards this level simulated, starting from the one in 2005. Section E discusses extensions to the analysis, while Section F summarizes the results and concludes.
B. Background
Oil-producing countries have tended to encounter considerable difficulty in formulating fiscal policies that would help them to transform natural-resource wealth into other forms of capital. Laying the economic foundation for high and sustainable rates of non-oil growth has been a continuing challenge, reflected in the generally disappointing economic performance of resource-based economies. Economists have designated these “empirical regularities” (Hausmann and Rigobon 2003) as the “natural resource curse” (Sachs and Warner 1995)—typically explained as the result of increased rent-seeking behavior, reduced incentives for economic reforms, and the real appreciation of the domestic currency, leading to a country’s loss of international competitiveness and a gradual process of deindustrialization (“Dutch disease”). The growth performance of Gabon and other oil-producing countries has, in general, been inferior to that of non-resource-dependent countries with comparable per capita income. After three decades of oil production, Gabon’s economy remains highly vulnerable to sudden changes in international markets. The volatility of oil prices has led to successive episodes of large, often wasteful public investments followed by deep economic crises. These, in turn, have been accompanied by large fiscal imbalances and the accumulation of domestic and external payment arrears. The variability in oil prices and the resultant stop-and-go approach to funding public investments have impeded a forward-looking, more long-term approach to economic policy management and, consequently, shortened the planning horizons of private companies in the country’s non-oil sectors. As a result, non-oil growth, on a per capita basis, has been negative in every year during 1998–2003 and only marginally positive in 2004–05.
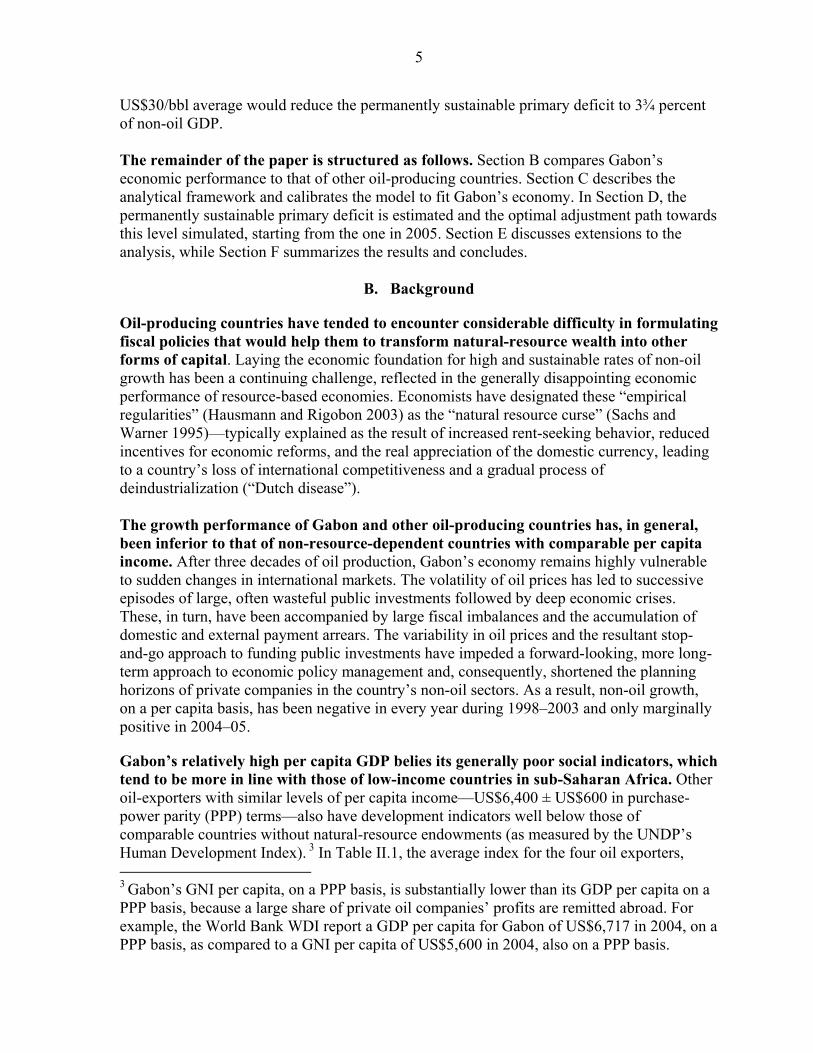
Gabon’s relatively high per capita GDP belies its generally poor social indicators, which tend to be more in line with those of low-income countries in sub-Saharan Africa. Other oil-exporters with similar levels of per capita income—US$6,400 ± US$600 in purchase-power parity (PPP) terms—also have development indicators well below those of comparable countries without natural-resource endowments (as measured by the UNDP’s Human Development Index). 3 In Table II.1, the average index for the four oil exporters, 3 Gabon’s GNI per capita, on a PPP basis, is substantially lower than its GDP per capita on a PPP basis, because a large share of private oil companies’ profits are remitted abroad. For example, the World Bank WDI report a GDP per capita for Gabon of US$6,717 in 2004, on a PPP basis, as compared to a GNI per capita of US$5,600 in 2004, also on a PPP basis.
6
0.714, would rank them 108th out of 177 countries, considerably lower than the 0.762 average (79th rank) for countries not endowed with oil. With the former group, Gabon ranks last, with an index of 0.635 (123rd rank). Increasing rent-seeking behavior could be one explanation: the corruption perception indices compiled by Transparency International show that oil exporters average 2.8 (i.e., equivalent to the 97th rank out of 158 countries—twenty places below the other countries in the same income group). This corroborates findings that weak governance is an important explanatory variable for the slow growth in resource-rich economies (Leite and Weidmann 1999).
Per Capita GDP Non-Oil Primary Non-US$ PPP1 Human Corruption Revenue4 Oil Deficit4
2003 Development1 Perception2 2004 2004
Oil-producing countries3 6,543 0.714 2.8 18.8 17.2Kazakhstan 6,671 0.761 2.6 17.9 4.8Iran 6,995 0.736 2.9 15.9 25.7Algeria 6,107 0.722 2.8 16.9 30.5Gabon 6,397 0.635 2.9 24.3 7.7
Non-oil producing countries 6,420 0.762 3.3 28.9 -0.5Tonga 6,992 0.810 … … …Panama 6,854 0.804 3.5 16.9 -2.3Macedonia 6,794 0.797 2.7 37.5 -1.6Belarus 6,052 0.786 2.6 35.3 -0.1Bosnia and Herzegovina 5,967 0.786 2.9 48.9 1.5Colombia 6,702 0.785 4.0 15.6 1.6Samoa (Western) 5,854 0.776 … … …St. Vincent and the Grenadines 6,123 0.755 … … …Belize 6,950 0.753 3.7 22.3 0.6Fiji 5,880 0.752 4.0 … …Turkey 6,772 0.750 3.5 24.5 -5.1Dominican Republic 6,823 0.749 3.0 … …Turkmenistan 5,938 0.738 1.8 … …Namibia 6,180 0.627 4.3 30.4 1.3
1 Source: UNDP, 2005, Human Development Report 2005, pp. 219-22. 2 Index between 10 (least corrupt) and 0 (most corrupt). Source: Transparency International, 2005, Corruption Perceptions Index 2005.3 Countries with fiscal petroleum revenue accounting for at least 20 percent of total fiscal revenue in 2004.4 In percent of non-oil GDP. Sources: Various IMF reports. Fiscal data for Panama are 2002.
Country Indices
Table II.1. Oil Production and Socio-Economic Development
Countries with a per capita income of US$6,400 ± US$600
7
C. Theoretical Framework
Intertemporal optimization with habit formation lies at the core of the paper’s analysis. The section starts by describing the standard Friedman (1957) permanent-income hypothesis (PIH) model used to analyze fiscal sustainability in countries with finite oil reserves. Once the PIH model been explained and solved, it is shown how the optimal fiscal policy changes with the introduction of habits. According to the PIH, agents are forward-looking and optimal policy is defined as a path of government spending that smoothes consumption over time and is consistent with the intertemporal budget constraint. The optimal spending level depends on a number of factors, among them the future path of oil and non-oil tax revenues and the real interest rate. In the model, the government chooses an expenditure policy that maximizes a social-welfare function subject to an intertemporal budget constraint and a transversality condition.4 The model Allowing the government to choose both the tax rate and the spending level is equivalent to rewriting the problem in terms of the primary deficit; see Barnett and Ossowski (2003). The problem, then, can be solved in a two stage process: (i) an inter-temporal decision (determining the size of the primary deficit); and (ii) an intra-temporal decision (determining the optimal allocation of the given deficit between spending and taxes, where the marginal benefit of spending equals the marginal cost of taxation). Since this paper focuses on intertemporal sustainability, the problem is expressed solely in terms of spending, treating the tax rate as exogenous. The government’s problem can thus be written as follows:5
(1) ( ){ }
maxs
s tsG s t
U G∞
−
=
β ⋅∑ ,
(2) s.t. 1t t t t tB R B G T Z−= ⋅ + − − , and
(3) 0lim =+∞→ stsB ,
where Bt is government debt at the end of period t; R = 1 + r, with r being the long-run interest rate (assumed to be constant); and Gt the level of primary government expenditure. As the low quality of public investment in Gabon, thus far, gives capital expenditure the characteristic of recurrent expenditure,6 this paper treats all primary government expenditure as consumption and develops a model in which households derive utility from all 4 For details on the theoretical and empirical difficulties surrounding the concept of a social-welfare function, see Olters (2004) and the literature cited therein.
5 The notation here follows Barnett and Ossowski (2003).
6 For details, see Chapter V.
8
government spending, even when it does not increase productivity. Non-oil revenue is denoted by Tt, oil revenue by Zt. The discount factor is ( ) 11 −β = + δ < 1, where δ is the rate of time preference (the degree of impatience). It is assumed that there is no uncertainty about the future. First, a solution is obtained based on the assumption of constant non-oil GDP. The government’s problem yields a solution in the form of the following Euler equation: (4) 1( ) ( )G G
t tU G R U G += β ⋅ ⋅ , where )( t
G GU denotes the marginal utility of spending in period t. Assuming that 1Rβ ⋅ = (or, equivalently, δ = r), 7 it follows that )()( 1+= t
Gt
G GUGU . This implies that government spending is constant: GGG tt == +1 . Combining equation (4) with (2) and (3) yields the optimal level of government spending:
(5) *1
1 s tN
s ts t
rG T Z r BR R
−
−=
⎛ ⎞= + ⋅ ⋅ − ⋅⎜ ⎟⎝ ⎠
∑ ,
where N is the date at which oil revenue dries up. Equation (5) implies that the optimal policy is to set spending equal to permanent income, i.e., to the return on the present discounted value of all future oil and non-oil revenues. Introducing non-oil growth complicates the algebra but does not change the form of the solution. Non-oil GDP is now assumed to grow at rate γ > 0, i.e., ( )1 1t tY Y+ = + γ ⋅ . Following Barnett and Ossowski (2003) and Tersman (1991), the government’s problem is expressed in
terms of non-oil GDP. Therefore, GgY
= is the ratio of spending to non-oil GDP, and the
budget constraint becomes
(6) 11t t t t tRb b g z−= ⋅ + − τ −+ γ
,
where τ denotes the ratio of non-oil revenue to non-oil GDP, and z and b the ratios to non-oil GDP of oil revenue and debt, respectively. Utility is also expressed in terms of non-oil GDP terms so that ( )U U g= . The standard assumption that the interest rate is higher than the non-
7 Assuming either 1Rβ⋅ > or 1Rβ⋅ < implies that government spending either declines to zero or explodes. The conventional approach is to exclude these two possibilities and assume instead that 1Rβ⋅ = .
9
oil growth rate ( )r > γ is imposed to keep the sustainability question interesting.8 Solving the model with non-oil growth implies a path for government spending that is analogous to the one in equation (5), i.e., a constant spending level in terms of non-oil GDP, as shown in equation (6):9
(7) ( )
*1
11
s tN
s ts t
r rg z bR R
− −
−=
− γ + γ − γ⎛ ⎞= τ + ⋅ ⋅ − ⋅⎜ ⎟ + γ⎝ ⎠∑ .
Introducing habit formation into the model has the advantage of greater realism with regard to the speed at which fiscal policy can adjust to macroeconomic shocks. Habit formation was developed in the consumption literature to capture the idea that consumption is addictive—i.e., the amount of utility derived from consumption today depends negatively on how much was consumed yesterday.10 Formally, introducing habits implies altering the utility function so that current-period utility depends not only on current spending, but also on past spending. Specifically, the utility function becomes ),( tt hgU rather than )( tgU , where ht represent the current stock of habits. Solving the government’s problem yields Euler equation (8) 1 1 1 1 2 2( , ) ( , ) ( , ) ( , )g h g h
t t t t t t t tU g h U g h R U g h U g h+ + + + + +⎡ ⎤+ = ⋅β⋅ + β⋅⎣ ⎦ , where ),( tt
g hgU denotes the marginal utility of an additional unit of spending in this period and ),( 11 ++ tt
h hgU the marginal utility of stronger habits in the next period (due to higher spending today). A popular formulation of habit formation in the literature is the “subtractive formulation” (Constantinides 1990, Campbell and Cochrane 1999, and Uribe 1999),
(9) ( , ) ( )t t t tU g h V g h= − α ⋅ ,
8 If the net real interest rate is negative ( )0r − γ < , it is not necessary to run primary surpluses to reduce the debt-to-GDP ratio to zero.
9 A rule that would keep the absolute spending level constant would imply that the size of government (spending as a share of GDP) shrinks to zero over time. More plausibly, the rule in equation (6) implies that government size converges to 29 percent of GDP.
10 In the context of fiscal policy, habit formation can also be interpreted as reflecting institutional and political adjustment costs faced by policymakers (for instance, cutting the public-sector wage bill abruptly may not be politically feasible). Applying habit formation to fiscal policy, Velculescu (2004) shows that the optimal fiscal response to a permanent negative shock is to spread the necessary policy adjustment over a number of periods.
10
where [0,1]α ∈ denotes habit strength, and current-period spending, gt, yields lower utility the stronger the habits, ht. A simple specification of the habit stock is 1−= tt gh , i.e., the current habit stock is simply equal to the level of spending in the previous period. Combining the Euler equation (7) with the intertemporal budget equation yields, after a number of algebraic manipulations, the following optimal path for government spending:
(10) ( )
*1 1
111
s tN
t s t ts t
r rg z b gR R R R
− −
− −=
⎡ ⎤α − γ + γ − γ α⎛ ⎞ ⎛ ⎞= − ⋅ τ + ⋅ ⋅ − ⋅ + ⋅⎢ ⎥⎜ ⎟ ⎜ ⎟ + γ⎝ ⎠ ⎝ ⎠⎢ ⎥⎣ ⎦∑ .
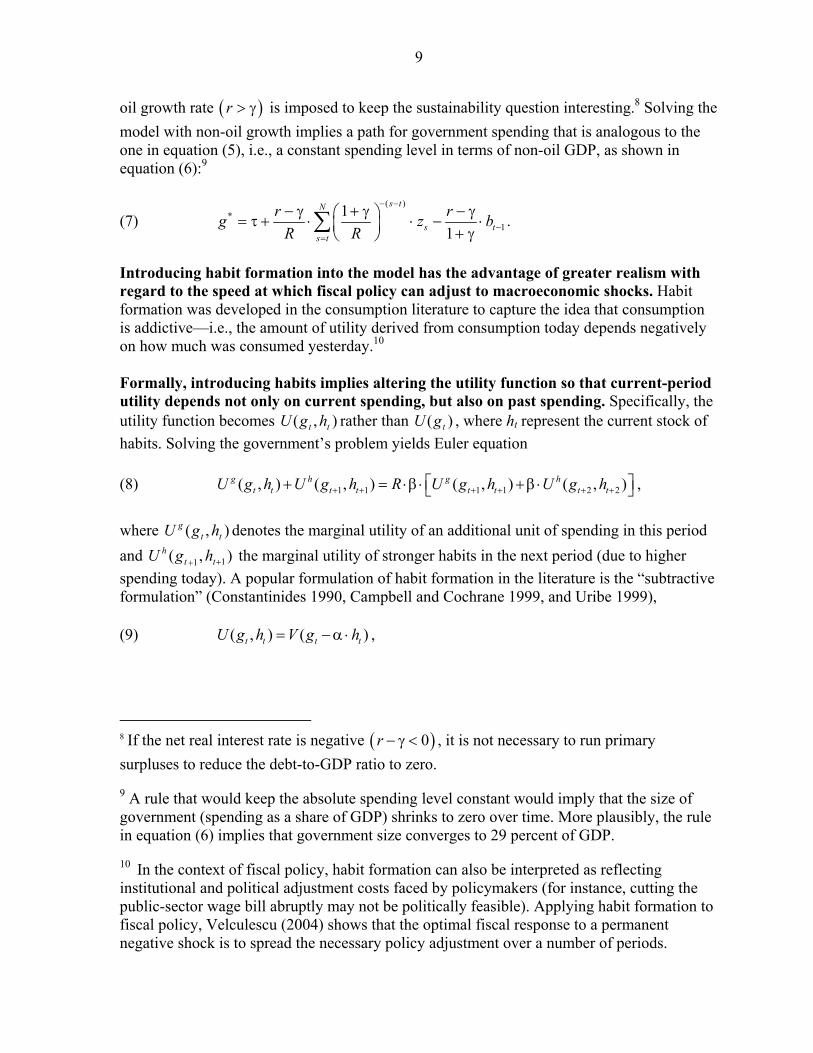
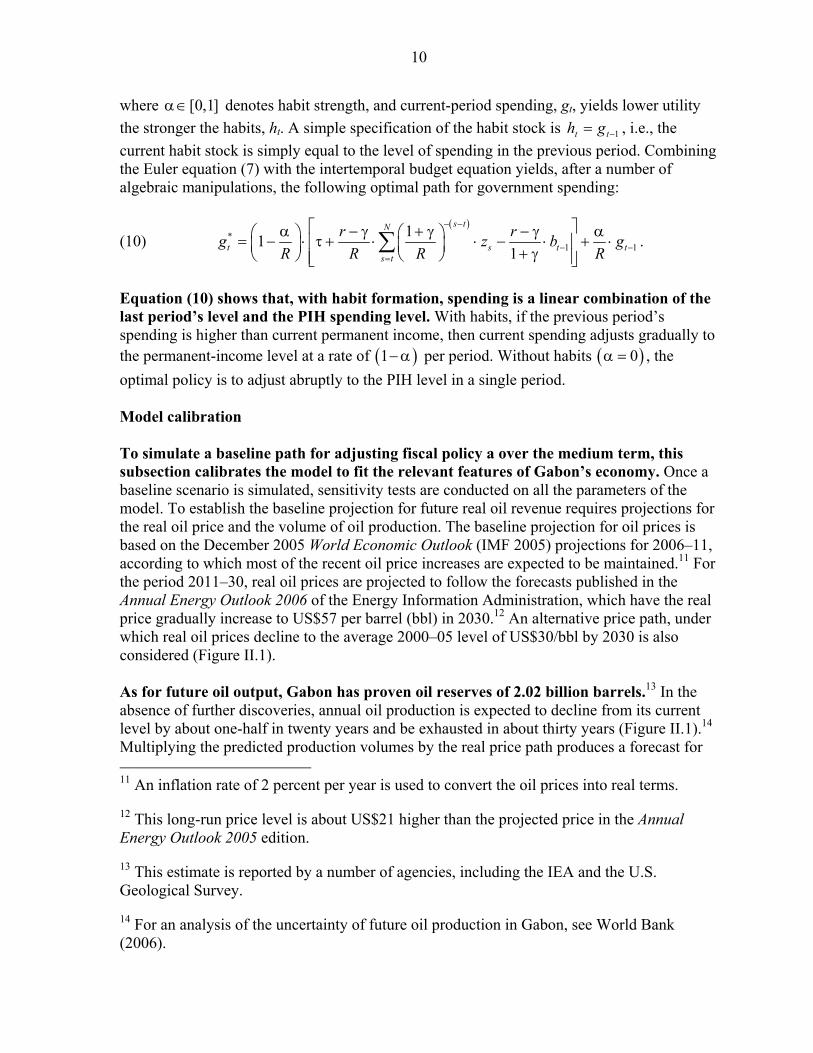
Equation (10) shows that, with habit formation, spending is a linear combination of the last period’s level and the PIH spending level. With habits, if the previous period’s spending is higher than current permanent income, then current spending adjusts gradually to the permanent-income level at a rate of ( )1− α per period. Without habits ( )0α = , the optimal policy is to adjust abruptly to the PIH level in a single period. Model calibration To simulate a baseline path for adjusting fiscal policy a over the medium term, this subsection calibrates the model to fit the relevant features of Gabon’s economy. Once a baseline scenario is simulated, sensitivity tests are conducted on all the parameters of the model. To establish the baseline projection for future real oil revenue requires projections for the real oil price and the volume of oil production. The baseline projection for oil prices is based on the December 2005 World Economic Outlook (IMF 2005) projections for 2006–11, according to which most of the recent oil price increases are expected to be maintained.11 For the period 2011–30, real oil prices are projected to follow the forecasts published in the Annual Energy Outlook 2006 of the Energy Information Administration, which have the real price gradually increase to US$57 per barrel (bbl) in 2030.12 An alternative price path, under which real oil prices decline to the average 2000–05 level of US$30/bbl by 2030 is also considered (Figure II.1). As for future oil output, Gabon has proven oil reserves of 2.02 billion barrels.13 In the absence of further discoveries, annual oil production is expected to decline from its current level by about one-half in twenty years and be exhausted in about thirty years (Figure II.1).14 Multiplying the predicted production volumes by the real price path produces a forecast for 11 An inflation rate of 2 percent per year is used to convert the oil prices into real terms.
12 This long-run price level is about US$21 higher than the projected price in the Annual Energy Outlook 2005 edition.
13 This estimate is reported by a number of agencies, including the IEA and the U.S. Geological Survey.
14 For an analysis of the uncertainty of future oil production in Gabon, see World Bank (2006).

11
real oil GDP (Figure II.2), along with the three alternative paths used in the sensitivity analysis (25 percent higher reserves, 25 percent lower reserves, and a lower long-run oil price). The discount for Gabonese crude oil relative to the Brent crude price is assumed to remain constant at 5 percent (equivalent to the average discount during 2000–04); the exchange rate is held constant at CFAF 500 per US$1; and fiscal oil revenues, as in recent years, remain at 35.9 percent of oil GDP. The non-oil tax rate is kept constant at 23.2 percent. It is also assumed that the long-run real interest rate equals 3 percent, which broadly reflects the current yields of 10-year treasury bonds in industrialized countries minus inflation. While a 3 percent real interest rate is a standard value in the literature, obtaining this yield would require institutional changes to Gabon’s fiscal oil fund (Fonds pour les générations futures, FFG), which currently earns a mere 1.6 percent nominal rate.15 The non-oil growth rate, γ, is set at 2 percent, the average of the last ten years. The habit-strength parameter, α, is set at 0.7, which is within the range of estimates in the literature.16 Table II.2 summarizes the assumptions underpinning the baseline simulation.
Variable
Total proven oil reserves 2.02 billion barrelsLong-run oil price 57.0 2005 U.S. dollars per barrel Tax take on oil activities1 35.9 percent of oil GDPEffective non-oil tax rate1 (τ ) 23.2 percent of non-oil GDPTotal primary expenditure1 (g ) 35.4 percent of non-oil GDPTotal public debt1 (b ) 94.0 percent of non-oil GDPSum of all future oil revenue (Σz ) 718.7 percent of non-oil GDPReal interest rate (r ) 3.0 percentReal non-oil growth rates (γ ) 2.0 percentHabit strength (α ) 0.7
1 These represent the actual values realized in 2005.
Table II.2. Baseline Assumptions
Values
15 Reforms that would help to raise the return on public savings could involve bringing the FFG closer in line with the Norway State Petroleum Fund, which secured an average annual real return, net of management costs, of 4.3 percent (Norges Bank 2005).
16 For estimates of the habit formation parameter, see Fuhrer (2000) and Gruber (2001).
12
Figure II.1. Gabon: Oil Production Profile and World Oil Prices, 2005–45
Gabonese oil production(millions of barrels per year)
Baseline oil price projection(2005 US dollars per barrel)
Lower oil price scenario(2005 US dollars per barrel)
0
10
20
30
40
50
60
70
80
90
100
2005
2006
2007
2008
2009
2010
2011
2012
2013
2014
2015
2016
2017
2018
2019
2020
2021
2022
2023
2024
2025
2026
2027
2028
2029
2030
2031
2032
2033
2034
2035
2036
2037
2038
2039
2040
2041
2042
2043
2044
2045
Figure II.2. Gabon: Real Oil GDP Profiles, 2005–45
0
200
400
600
800
1,000
1,200
1,400
1,600
1,800
2,000
2,200
2,400
2,600
2005
2006
2007
2008
2009
2010
2011
2012
2013
2014
2015
2016
2017
2018
2019
2020
2021
2022
2023
2024
2025
2026
2027
2028
2029
2030
2031
2032
2033
2034
2035
2036
2037
2038
2039
2040
2041
2042
2043
2044
2045
Bill
ions
of 2
005
CFA
fran
cs
Oil GDP (baseline: proven reserves)
Oil GDP (25 percent larger reserves)
Oil GDP (25 percent smaller reserves)
Oil GDP (lower long-run oil price)
13
US$30/bbl US$57/bbl
Baseline parameters 3.8 5.0
Sensitivity testsOil reserves (baseline) 100 percent (2.02 billion barrels)
Higher oil reserves 125 percent of baseline … 6.5Lower oil reserves 75 percent of baseline … 3.5
Effective oil tax take (baseline) z = 36 percent of oil GDPHigher oil tax take z = 46 percent of oil GDP 5.2 6.7Lower oil tax take z = 26 percent of oil GDP 2.4 3.3
Non-oil tax rate (baseline) τ = 23 percent of non-oil GDPHigher tax rate τ = 33 percent of non-oil GDP 4.0 5.2Lower tax rate τ = 13 percent of non-oil GDP 3.6 4.8
Interest rate (baseline) r = 3.0 percentHigher interest rate r = 3.5 percent 5.4 7.1Lower interest rate r = 2.5 percent 2.0 2.6
Non-oil growth rate (baseline) γ = 2.0 percentHigher growth rate γ = 2.5 percent 2.0 2.6Lower growth rate γ = 1.5 percent 5.4 7.1
Habit strength (baseline) α = 0.7No habits α = 0.0 4.0 5.2Stronger habits α = 0.8 3.7 4.9Weaker habits α = 0.6 3.9 5.1
(In percent of non-oil GDP)
Table II.3. Sensitivity Analysis
Assuming a Long-Run Oil Price of
Permanently SustainableNon-Oil Primary Deficit,
Definition of Variable
D. Results and Sensitivity Tests
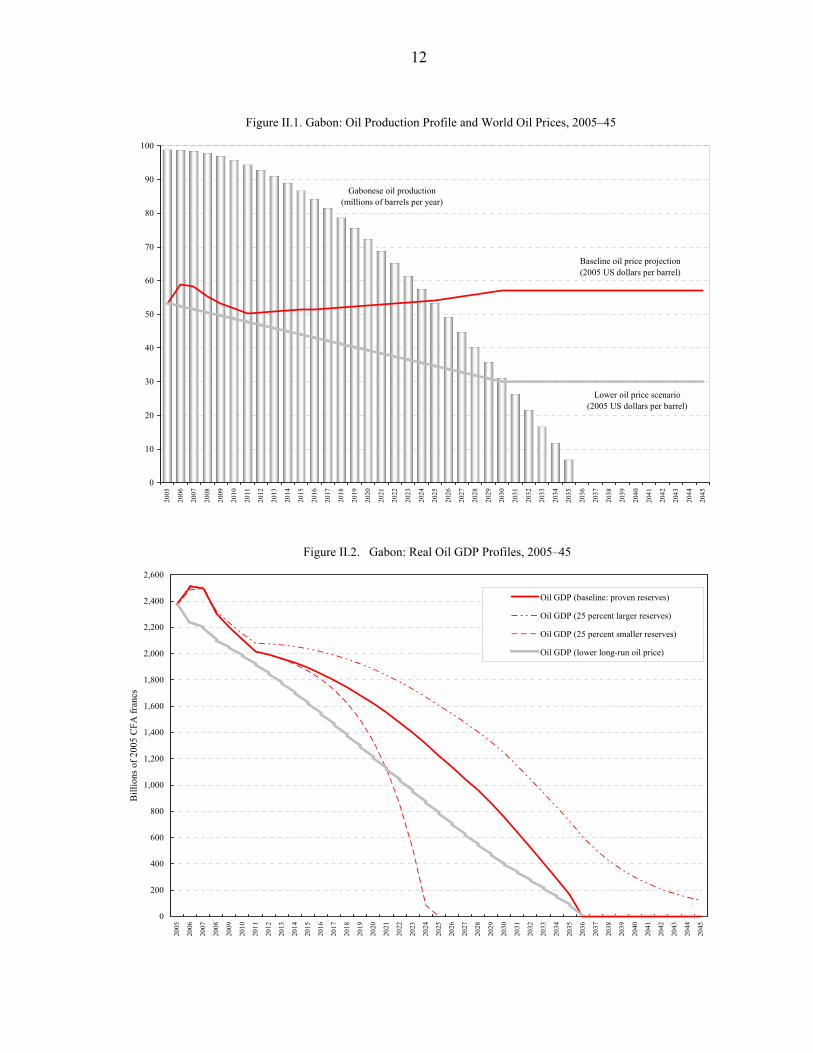
In simulating the optimal adjustment path, starting from the 2005 non-oil primary deficit level of 12.1 percent of non-oil GDP, three main results emerge:17 • First, the current level of the non-oil primary deficit is not sustainable. If the non-
oil primary deficit is maintained at the 2005 level of 12.1 percent of non-oil GDP, debt will eventually explode. With baseline assumptions, the permanently sustainable non-oil primary deficit is estimated to be 5.0 percent of non-oil GDP. That the 2005 deficit is unsustainable is a robust result from sensitivity tests on all the parameters in the model (Table II.3). For example, even if total reserves were to increase by 25 percent relative to the baseline, the sustainable deficit would rise to 6.5 percent of non-oil GDP, still well below the actual 2005 level. If the tax take on oil GDP rises by 10 percentage points to 46 percent, the sustainable non-oil primary deficit would increase to 6.7 percent of non-oil GDP, also well below the current level.
17 An Excel file that replicates all the simulation results presented in the paper is available upon request and can readily be adapted and applied to other countries with exhaustible energy resources.
14
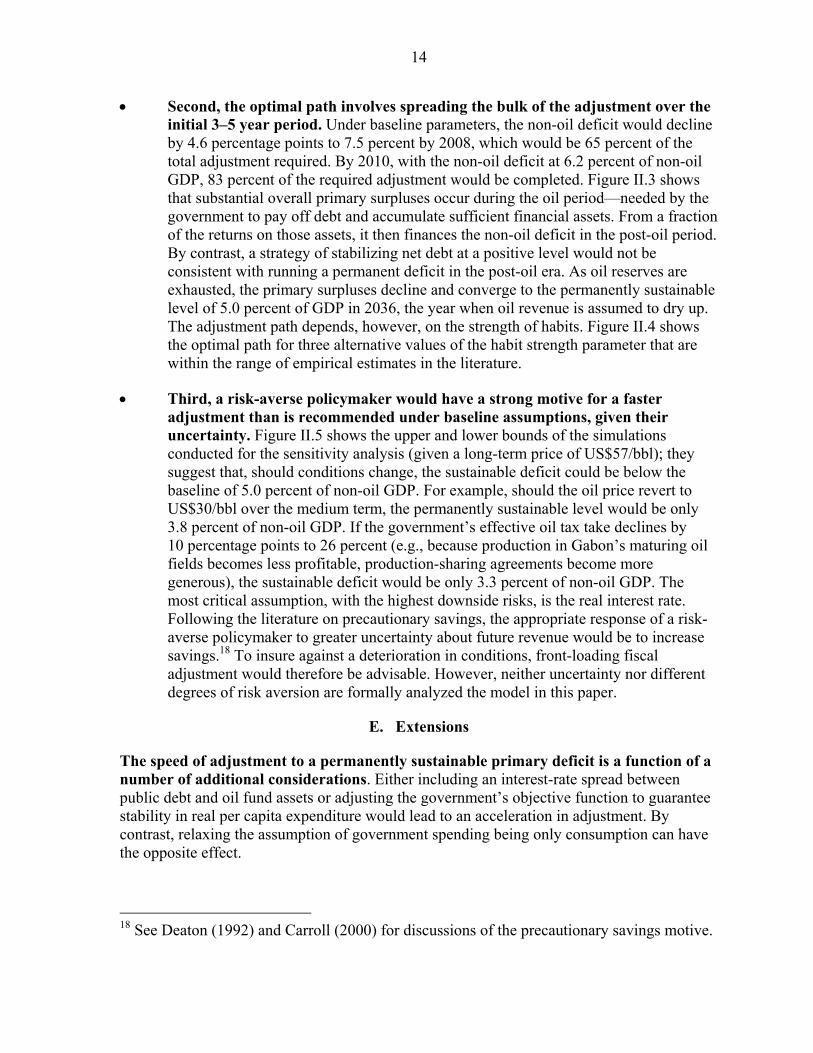
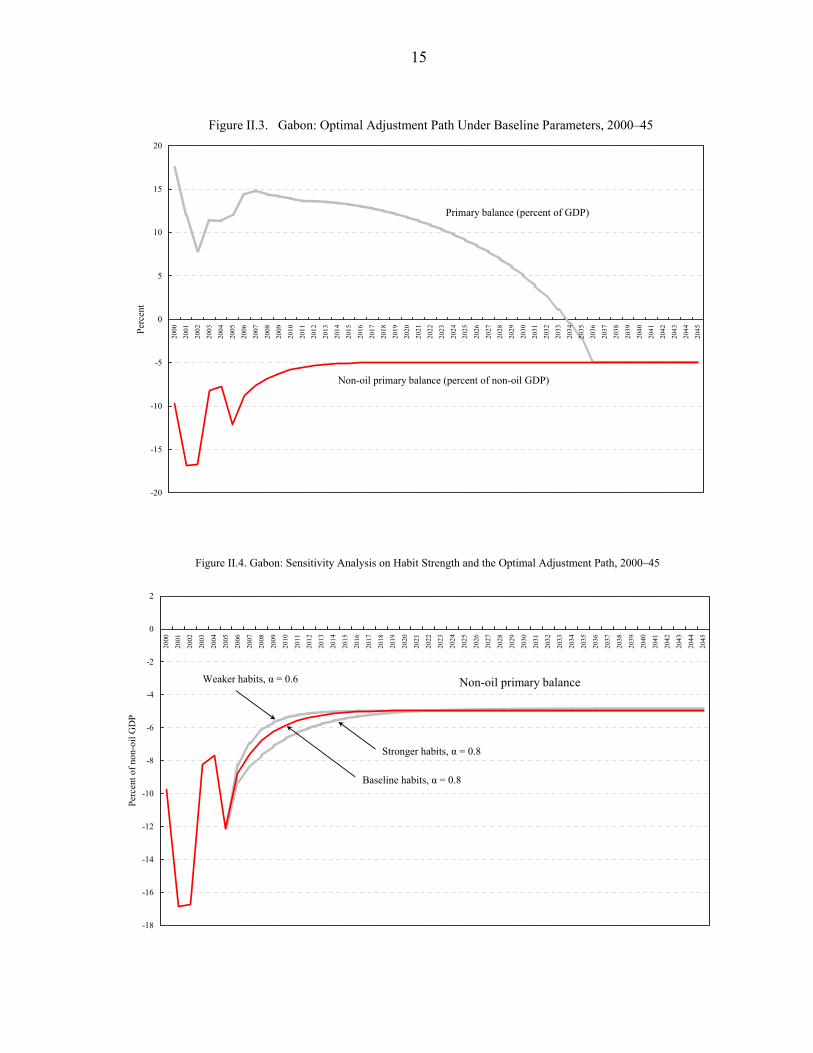
• Second, the optimal path involves spreading the bulk of the adjustment over the initial 3–5 year period. Under baseline parameters, the non-oil deficit would decline by 4.6 percentage points to 7.5 percent by 2008, which would be 65 percent of the total adjustment required. By 2010, with the non-oil deficit at 6.2 percent of non-oil GDP, 83 percent of the required adjustment would be completed. Figure II.3 shows that substantial overall primary surpluses occur during the oil period—needed by the government to pay off debt and accumulate sufficient financial assets. From a fraction of the returns on those assets, it then finances the non-oil deficit in the post-oil period. By contrast, a strategy of stabilizing net debt at a positive level would not be consistent with running a permanent deficit in the post-oil era. As oil reserves are exhausted, the primary surpluses decline and converge to the permanently sustainable level of 5.0 percent of GDP in 2036, the year when oil revenue is assumed to dry up. The adjustment path depends, however, on the strength of habits. Figure II.4 shows the optimal path for three alternative values of the habit strength parameter that are within the range of empirical estimates in the literature.
• Third, a risk-averse policymaker would have a strong motive for a faster adjustment than is recommended under baseline assumptions, given their uncertainty. Figure II.5 shows the upper and lower bounds of the simulations conducted for the sensitivity analysis (given a long-term price of US$57/bbl); they suggest that, should conditions change, the sustainable deficit could be below the baseline of 5.0 percent of non-oil GDP. For example, should the oil price revert to US$30/bbl over the medium term, the permanently sustainable level would be only 3.8 percent of non-oil GDP. If the government’s effective oil tax take declines by 10 percentage points to 26 percent (e.g., because production in Gabon’s maturing oil fields becomes less profitable, production-sharing agreements become more generous), the sustainable deficit would be only 3.3 percent of non-oil GDP. The most critical assumption, with the highest downside risks, is the real interest rate. Following the literature on precautionary savings, the appropriate response of a risk-averse policymaker to greater uncertainty about future revenue would be to increase savings.18 To insure against a deterioration in conditions, front-loading fiscal adjustment would therefore be advisable. However, neither uncertainty nor different degrees of risk aversion are formally analyzed the model in this paper.
E. Extensions
The speed of adjustment to a permanently sustainable primary deficit is a function of a number of additional considerations. Either including an interest-rate spread between public debt and oil fund assets or adjusting the government’s objective function to guarantee stability in real per capita expenditure would lead to an acceleration in adjustment. By contrast, relaxing the assumption of government spending being only consumption can have the opposite effect.
18 See Deaton (1992) and Carroll (2000) for discussions of the precautionary savings motive.
15
Figure II.3. Gabon: Optimal Adjustment Path Under Baseline Parameters, 2000–45
-20
-15
-10
-5
0
5
10
15
20
2000
2001
2002
2003
2004
2005
2006
2007
2008
2009
2010
2011
2012
2013
2014
2015
2016
2017
2018
2019
2020
2021
2022
2023
2024
2025
2026
2027
2028
2029
2030
2031
2032
2033
2034
2035
2036
2037
2038
2039
2040
2041
2042
2043
2044
2045Pe
rcen
t
Primary balance (percent of GDP)
Non-oil primary balance (percent of non-oil GDP)
Figure II.4. Gabon: Sensitivity Analysis on Habit Strength and the Optimal Adjustment Path, 2000–45
-18
-16
-14
-12
-10
-8
-6
-4
-2
0
2
2000
2001
2002
2003
2004
2005
2006
2007
2008
2009
2010
2011
2012
2013
2014
2015
2016
2017
2018
2019
2020
2021
2022
2023
2024
2025
2026
2027
2028
2029
2030
2031
2032
2033
2034
2035
2036
2037
2038
2039
2040
2041
2042
2043
2044
2045
Perc
ent o
f non
-oil
GD
P
Non-oil primary balance
Stronger habits, α = 0.8
Weaker habits, α = 0.6
Baseline habits, α = 0.8

16
Figure II.5. Gabon: Sensitivity Analysis and Estimated Permanently Sustainable Non-Oil Primary Balance
Lower bound
Upper bound
-18
-16
-14
-12
-10
-8
-6
-4
-2
0
2
2000
2001
2002
2003
2004
2005
2006
2007
2008
2009
2010
2011
2012
2013
2014
2015
2016
2017
2018
2019
2020
2021
2022
2023
2024
2025
2026
2027
2028
2029
2030
2031
2032
2033
2034
2035
2036
2037
2038
2039
2040
2041
2042
2043
2044
2045
Perc
ent o
f non
-oil
GD
P
Introducing a spread between the interest rate on sovereign debt and the interest rate on financial assets creates a further incentive to run a smaller non-oil deficit in the short-run. The objective would be to pay off debt sooner. Formally, the solution to the government’s portfolio problem now involves two first-order conditions (Barnett and Ossowski 2003). Returning, for expositional simplicity, to the simple PIH model without habits or non-oil growth, the first-order conditions become: (11) 1( ) ( )G debt G
t tU G R U G += β ⋅ ⋅ , and
(12) 1( ) ( )G Gt tU G R U G += β ⋅ ⋅ .
where debtR R> , and 1R r= + is the gross interest rate on assets as before. Equation (11) holds in the initial period if there is positive debt—if 0>B . Since debtR R> , and
1R ⋅β = as before, it holds that 1debtR ⋅β > and, by implication, tt GG >+1 . This means that government spending is increasing. Since there is debt initially, for this increasing spending to be sustainable, the initial non-oil deficit must be smaller than in the model without the interest-rate spread. Once debt has been paid off, i.e., once 0≤B and net asset accumulation begins, equation (12) holds, implying—as before—a constant path for expenditure; see equation (5).
17
Figure II.6. Gabon: Introducing a Debt-Asset Interest Rate Spread, 2000–45
With interest-rate spread
Baseline(no interest-rate spread)
-18
-16
-14
-12
-10
-8
-6
-4
-2
0
2
2000
2001
2002
2003
2004
2005
2006
2007
2008
2009
2010
2011
2012
2013
2014
2015
2016
2017
2018
2019
2020
2021
2022
2023
2024
2025
2026
2027
2028
2029
2030
2031
2032
2033
2034
2035
2036
2037
2038
2039
2040
2041
2042
2043
2044
2045
Perc
ent o
f non
-oil
GD
P
Primary non-oil balance
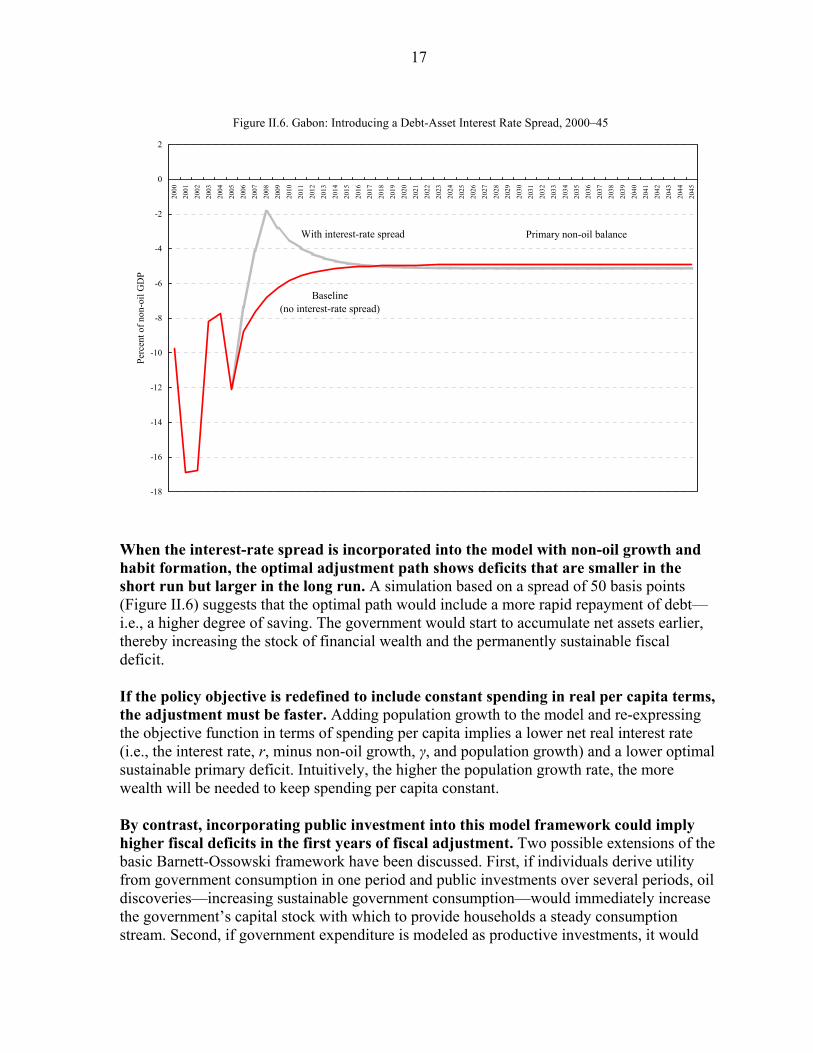
When the interest-rate spread is incorporated into the model with non-oil growth and habit formation, the optimal adjustment path shows deficits that are smaller in the short run but larger in the long run. A simulation based on a spread of 50 basis points (Figure II.6) suggests that the optimal path would include a more rapid repayment of debt—i.e., a higher degree of saving. The government would start to accumulate net assets earlier, thereby increasing the stock of financial wealth and the permanently sustainable fiscal deficit. If the policy objective is redefined to include constant spending in real per capita terms, the adjustment must be faster. Adding population growth to the model and re-expressing the objective function in terms of spending per capita implies a lower net real interest rate (i.e., the interest rate, r, minus non-oil growth, γ, and population growth) and a lower optimal sustainable primary deficit. Intuitively, the higher the population growth rate, the more wealth will be needed to keep spending per capita constant. By contrast, incorporating public investment into this model framework could imply higher fiscal deficits in the first years of fiscal adjustment. Two possible extensions of the basic Barnett-Ossowski framework have been discussed. First, if individuals derive utility from government consumption in one period and public investments over several periods, oil discoveries—increasing sustainable government consumption—would immediately increase the government’s capital stock with which to provide households a steady consumption stream. Second, if government expenditure is modeled as productive investments, it would
18
affect the economy’s production function in periods ahead, calling for a standard portfolio decision between financial and physical (social) assets. Barnett and Ossowski’s (2003) basic condition (13) ( )1tr Y K +′= τ ⋅ , states that governments—modeled in their conduct analogously to the way firms operate—should invest in all projects that will pay for themselves (irrespective of whether the country is endowed with oil reserves). This would imply that, with a tax rate of 23.2 percent and an interest rate of 3 percent, as the simulations assume, the rate of return on public investment would have to exceed 12.9 percent.19
F. Concluding Remarks
Efficiency and equity reasons suggest placing a high priority on ensuring that fiscal policy is on a sustainable path. At this critical juncture of Gabon’s history, the authorities have the choice between consciously deciding on a voluntary, gradual policy adjustment towards a sustainable fiscal-policy stance or continuing with current policies until the declining oil production or unexpectedly falling prices impose a large and rapid contraction in fiscal policies a few years later. As Gabon’s history has shown, the effects of boom-and-bust cycles are mostly felt by the already disadvantaged segments in society, skewing Gabon’s income distribution even further. Against this background, this chapter has sought to estimate the sustainable long-run non-oil primary deficit and the optimal adjustment path towards that level. The analysis—based on a model of intertemporal social-welfare optimization with habit formation—has yielded three main conclusions. • The authorities need to tighten fiscal policy to be able to smoothen government
spending over time. The permanently sustainable non-oil primary deficit, estimated at 5.0 percent of non-oil GDP, is well below the level of 12.1 percent of non-oil GDP in 2005.
• The bulk of the adjustment can be spread over three to five years. In taking into consideration the “addictive” nature of consumption (habits), the analysis suggests a gradual adjustment of the primary non-oil balance to the permanently sustainable
19 Note that public investment can potentially yield “fiscal dividends” through three channels: (i) direct financial returns, such as tolls; (ii) fiscal returns from growth (tax revenue, provided the growing sectors can be taxed and the marginal tax rate is sufficiently high); and (iii) lower debt ratios. However, if public investment is of low quality, these “fiscal dividends” may not accrue and net debt will increase. This latter characterizes the experience of Gabon thus far.
19
level rather than a single, abrupt adjustment that standard permanent-income models prescribe.
• The government should consider paying off expensive debt as soon as possible. The existence of an interest-rate spread between sovereign debt and financial assets yields an optimal policy path that front-loads fiscal adjustment, thereby increasing the permanently sustainable primary deficit in the long run. Moreover, uncertainty regarding future economic conditions provides a risk-averse policymaker with further precautionary motives for accelerating fiscal adjustment.
Having analyzed the narrow topic of a level of government spending that can be maintained even after oil reserves have been exhausted, reforms need to be complemented to ensure the increase in its quality. In order to be able to attain its GPRSP objectives, public expenditure need to “crowd in” private investments, implying that effectiveness of government spending needs to increase over time as well. Improvement in public financial management would provide assurances that government spending (including investment) will be able to generate adequate growth and social payoffs. An economic program in Gabon would therefore need to include elements that ensure (i) a phased adjustment of the primary non-oil balance to a permanently sustainable level; (ii) reforms to the management of FFG assets; (iii) a rapid repayment of foreign debt; and (iv) structural reforms aimed at improving the design and quality of public investments.

20
References
Barnett, Steven, and Rolando Ossowski, 2003, “Operational Aspects of Fiscal Policy in Oil-Producing Countries,” in Fiscal Policy Formulation and Implementation in Oil-Producing Countries ed. by Jeffrey Davis, Rolando Ossowski, and Annalise Fedelino (Washington: International Monetary Fund), pp. 45–81.
Campbell, John, and John. Cochrane, 1999, “By Force of Habit: A Consumption-Based
Explanation of Aggregate Stock Market Behavior,” Journal of Political Economy, Vol. 107, No. 2, pp. 205–51.
Carroll, Christopher D., 2000, “‘Risky Habits’ and the Marginal Propensity to Consume Out
of Permanent Income,” International Economic Journal, Vol. 14, No. 4, pp.1–41. Constantinides, George, 1990, “Habit Formation: A Resolution of the Equity Premium
Puzzle,” Journal of Political Economy, Vol. 9, No. 3, pp. 519–43. Deaton, Angus, 1992, Understanding Consumption (Oxford: Clarendon Press). Friedman, Milton, 1957, A Theory of the Consumption Function (Princeton: Princeton
University Press). Fuhrer, Jeffrey, 2000, “Habit Formation in Consumption and Its Implications for Monetary
Policy Models,” American Economic Review, Vo. 90, No. 3, pp. 367–90. Gruber, Joseph, 2001, “Habit Formation and the Dynamics of the Current Account” (thesis;
Baltimore: Johns Hopkins University). Hausmann, Ricardo, and Roberto Rigobon, 2003, “An Alternative Interpretation of the
‘Resource Curse’: Theory and Policy Implications,” in Fiscal Policy Formulation and Implementation in Oil-Producing Countries ed. by Jeffrey Davis, Rolando Ossowski, and Annalise Fedelino (Washington: International Monetary Fund), pp. 13–44.
International Monetary Fund, 2005, “Will the Oil Market Continue to Be Tight?” Chapter IV
in World Economic Outlook: Globalization and External Imbalances (Washington: International Monetary Fund), pp. 157–83.
Leite, Carlos, and Jens Weidmann, 1999, “Does Mother Nature Corrupt? Natural Resources,
Corruption, and Economic Growth,” IMF Working Paper 99/85 (Washington: International Monetary Fund).
Norges Bank, 2005, “Management of the Government Petroleum Fund: Report for the Third
Quarter of 2005,” (Oslo: Norges Bank). Olters, Jan-Peter, 2004, “The Political Business Cycle at Sixty: Towards a Neo-Kaleckian
Understanding of Political Economy” Cahiers d’économie politique, No. 46, pp. 91–130.
21
Sachs, Jeffrey, and Andrew Warner, 1995, “Natural Resource Abundance and Economic
Growth,” NBER Working Paper 5398 (Cambridge, Mass.: National Bureau of Economic Research).
Tersman, Gunnar, 1991, “Oil, National Wealth, and Current and Future Consumption
Possibilities,” IMF Working Paper 91/60 (Washington: International Monetary Fund). Uribe, Martin, 1999, “The Price Consumption Puzzle of Currency Pegs,” University of
Pennsylvania Working Paper. Velculescu, Delia, 2004, “Intergenerational Habits, Fiscal Policy, and Welfare,” Topics in
Macroeconomics, Volume 4, No. 1, Article No. 10. World Bank, 2006, “Public Expenditure Management and Financial Accountability in
Gabon” (Washington: World Bank).
22
III. WHY DO BANKS NOT WANT TO BE BANKS? CREDIT GROWTH AND SOCIO-ECONOMIC DEVELOPMENT IN GABON 20
Capital is nothing but the lever by which the entrepreneur subjects to his control the concrete goods which he needs, nothing but a means of diverting the factors
of production to new uses, or of dictating a new direction to production.
—Joseph A. Schumpeter (1912)21
A. Introduction
Gabon’s financial sector is shallow even by regional standards, and banks appear to be withdrawing further from core activities. Notwithstanding an increased availability of funds, credit to the private sector declined from a peak of 13.2 percent of GDP in 2002 to 9.0 percent in 2005 (or, respectively, from 22.6 to 19.0 percent of non-oil GDP). Excess liquidity has been transferred, in part in violation of regional prudential regulations, to correspondent banks outside the Communauté économique et monétaire de l’Afrique centrale (CEMAC). Even though these assets earn a relatively low rate of return, the net foreign asset position of commercial banks has increased by 4.7 percentage points, from –0.3 percent of GDP in 2002 to 4.4 percent in 2005. On the liability side as well, banks continue to enforce restrictions on minimum deposits and/or depositors’ minimum income as a means of limiting financial services to a few “trusted” enterprises, public-sector employees, and expatriates. The realization of Gabon’s (2006) socio-economic development objectives hinges on private-sector investments at the scale required to increase total factor productivity and, hence, the country’s non-oil growth potential. This presupposes an economic environment in which banks have enough confidence to deepen financial intermediation and extend more credit to the private sector. The limited access to bank credit in sub-Saharan Africa—especially in the CEMAC zone—is one important factor explaining the generally disappointing growth performance. This is a particularly pertinent challenge for Gabon, where real per capita GDP has declined by 17 percent over the past decade, reflecting both the reduction in oil production and anemic growth in the non-oil sector. This paper aims at identifying the principal obstacles that have precluded the deepening of financial intermediation and limited the access to credit by small and medium-sized enterprises. In seeking to explain the main reasons behind the resistance of Gabonese banks to expand credit to the economy, a simple model is proposed, in which banks maximize profits over monitoring, which is costly. The banks’ caution is thus explained by the declining
20 Prepared by Jan-Peter Olters. Valuable comments by Jakob Christensen, Anne-Marie Gulde-Wolf, Roger Nord, Anton op de Beke, Jérôme Vacher, and participants at the Ministry of Finance-organized seminar in Libreville, including those from the Banque des Etats de l’Afrique centrale (BEAC), are gratefully acknowledged. The standard disclaimer applies.
21 See Redvers Opie’s 1934 translation, p. 116.
23
interest-rate spread between deposits and loans and the banks’ inability to accurately appraise the quality of their loan portfolios. The remainder of the chapter is organized as follows. Section B identifies critical issues and surveys the literature on the link between financial markets and growth. Section C summarizes financial-sector developments in Gabon. Section D presents the analytical framework and derives a relationship between credits and the credit/deposit interest-rate differential. On that basis, Section E discusses policy measures that promise to increase access to credit, a key ingredient to Gabon’s economic reforms that seek to accelerate economic diversification and foster socio-economic development.
B. Financial Intermediation and Growth
Financial development is a robust leading indicator of long-term economic growth. An extensive literature has analyzed the link between financial depth and economic development—as well as empirical tests of the presumed causality between both variables.22 In extending the results of Goldsmith (1969), McKinnon (1973), and Shaw (1973), who stress the importance of functioning financial markets for the real sector, King and Levine (1993a, 1993b) find strong empirical evidence of financial depth inducing long-term economic growth. They show that “better financial systems stimulate faster productivity growth and growth in per capita output by funneling society’s resources to promising productivity-enhancing endeavors” (1993b). For developing countries, Jalilian and Kirkpatrick (2005) confirm these results, demonstrating that “poorer developing countries will gain most from the growth and development of the financial sector.” Within countries, Beck et al. (2004) find that financial development is “pro-poor” as it raises the income of the more disadvantaged segments of society disproportionately. Lack of access to credit can account for long-term stagnation. Rioja and Valev (2004) caution that growth effects from deepening financial intermediation are likely to occur only if banks reach a certain level of development, which they define as a ratio of private credit to GDP of at least 14 percent. Their result supports Saint-Paul’s (1992) hypothesis of multiple equilibria in financial markets, “with the economy staying either at a ‘low’ equilibrium with underdeveloped financial markets and little division of labour, or a ‘high’ equilibrium with strong financial markets and an extensive division of labour,” which “may account for the persistence of GNP level and growth rate differences between countries.” Campos and Coricelli (2002) survey the “credit crunch” literature for transition economies, which has shown that an initial shortage in private-sector loans can lead to a “bad equilibrium” with persistently low output. Heavy-handed regulation often hampers the development of the banking system in developing countries. In an environment of “financial repression” (Agénor and Montiel 1999), banks are typically required to maintain high reserve and liquidity ratios, while being 22 For literature reviews, see, e.g., Levine (1997) and—with a particular focus on developing and transition economies—Holden and Prokopenko (2001).
24
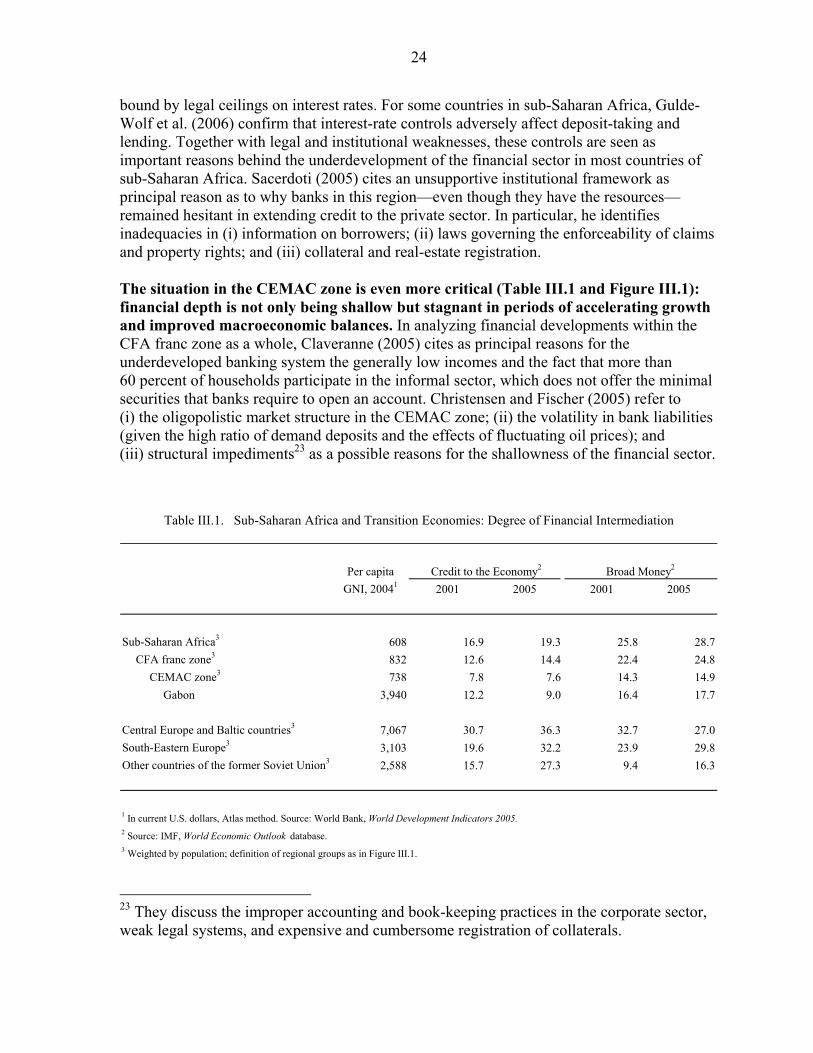
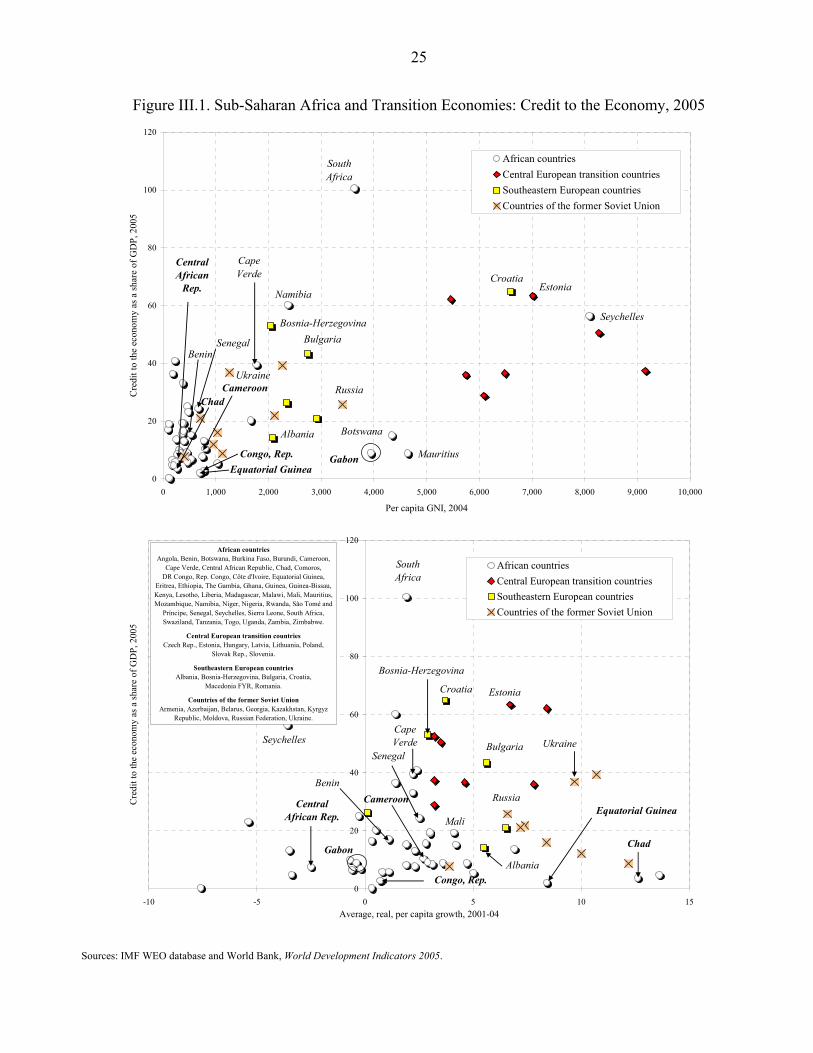
bound by legal ceilings on interest rates. For some countries in sub-Saharan Africa, Gulde-Wolf et al. (2006) confirm that interest-rate controls adversely affect deposit-taking and lending. Together with legal and institutional weaknesses, these controls are seen as important reasons behind the underdevelopment of the financial sector in most countries of sub-Saharan Africa. Sacerdoti (2005) cites an unsupportive institutional framework as principal reason as to why banks in this region—even though they have the resources—remained hesitant in extending credit to the private sector. In particular, he identifies inadequacies in (i) information on borrowers; (ii) laws governing the enforceability of claims and property rights; and (iii) collateral and real-estate registration. The situation in the CEMAC zone is even more critical (Table III.1 and Figure III.1): financial depth is not only being shallow but stagnant in periods of accelerating growth and improved macroeconomic balances. In analyzing financial developments within the CFA franc zone as a whole, Claveranne (2005) cites as principal reasons for the underdeveloped banking system the generally low incomes and the fact that more than 60 percent of households participate in the informal sector, which does not offer the minimal securities that banks require to open an account. Christensen and Fischer (2005) refer to (i) the oligopolistic market structure in the CEMAC zone; (ii) the volatility in bank liabilities (given the high ratio of demand deposits and the effects of fluctuating oil prices); and (iii) structural impediments23 as a possible reasons for the shallowness of the financial sector.
Per capitaGNI, 20041 2001 2005 2001 2005
Sub-Saharan Africa3 608 16.9 19.3 25.8 28.7CFA franc zone3 832 12.6 14.4 22.4 24.8
CEMAC zone3 738 7.8 7.6 14.3 14.9Gabon 3,940 12.2 9.0 16.4 17.7
Central Europe and Baltic countries3 7,067 30.7 36.3 32.7 27.0South-Eastern Europe3 3,103 19.6 32.2 23.9 29.8Other countries of the former Soviet Union3 2,588 15.7 27.3 9.4 16.3
1 In current U.S. dollars, Atlas method. Source: World Bank, World Development Indicators 2005.2 Source: IMF, World Economic Outlook database.3 Weighted by population; definition of regional groups as in Figure III.1.
Table III.1. Sub-Saharan Africa and Transition Economies: Degree of Financial Intermediation
Credit to the Economy2 Broad Money2
23 They discuss the improper accounting and book-keeping practices in the corporate sector, weak legal systems, and expensive and cumbersome registration of collaterals.
25
Figure III.1. Sub-Saharan Africa and Transition Economies: Credit to the Economy, 2005
0
20
40
60
80
100
120
0 1,000 2,000 3,000 4,000 5,000 6,000 7,000 8,000 9,000 10,000
Per capita GNI, 2004
Cre
dit t
o th
e ec
onom
y as
a sh
are
of G
DP,
200
5
African countriesCentral European transition countriesSoutheastern European countriesCountries of the former Soviet Union
Gabon
South Africa
Cameroon
Congo, Rep.
Botswana
Mauritius
Namibia
Equatorial Guinea
Chad
Central African
Rep.
Russia
Bulgaria
Seychelles
Albania
SenegalBenin
Bosnia-Herzegovina
Croatia
Ukraine
Estonia
Cape Verde
0
20
40
60
80
100
120
-10 -5 0 5 10 15Average, real, per capita growth, 2001-04
Cre
dit t
o th
e ec
onom
y as
a sh
are
of G
DP,
200
5
African countriesCentral European transition countriesSoutheastern European countriesCountries of the former Soviet Union
Gabon
South Africa
Cameroon
Congo, Rep.
Equatorial Guinea
Chad
Central African Rep.
Russia
BulgariaSeychelles
Albania
Senegal
African countries Angola, Benin, Botswana, Burkina Faso, Burundi, Cameroon,
Cape Verde, Central African Republic, Chad, Comoros, DR Congo, Rep. Congo, Côte d'Ivoire, Equatorial Guinea,
Eritrea, Ethiopia, The Gambia, Ghana, Guinea, Guinea-Bissau, Kenya, Lesotho, Liberia, Madagascar, Malawi, Mali, Mauritius, Mozambique, Namibia, Niger, Nigeria, Rwanda, São Tomé and
Príncipé, Senegal, Seychelles, Sierra Leone, South Africa, Swaziland, Tanzania, Togo, Uganda, Zambia, Zimbabwe.
Central European transition countries Czech Rep., Estonia, Hungary, Latvia, Lithuania, Poland,
Slovak Rep., Slovenia.
Southeastern European countries Albania, Bosnia-Herzegovina, Bulgaria, Croatia,
Macedonia FYR, Romania.
Countries of the former Soviet Union Armenia, Azerbaijan, Belarus, Georgia, Kazakhstan, Kyrgyz
Republic, Moldova, Russian Federation, Ukraine.
Benin
Mali
Bosnia-Herzegovina
Croatia
Ukraine
Estonia
CapeVerde
Sources: IMF WEO database and World Bank, World Development Indicators 2005.
26
C. Banks in Gabon
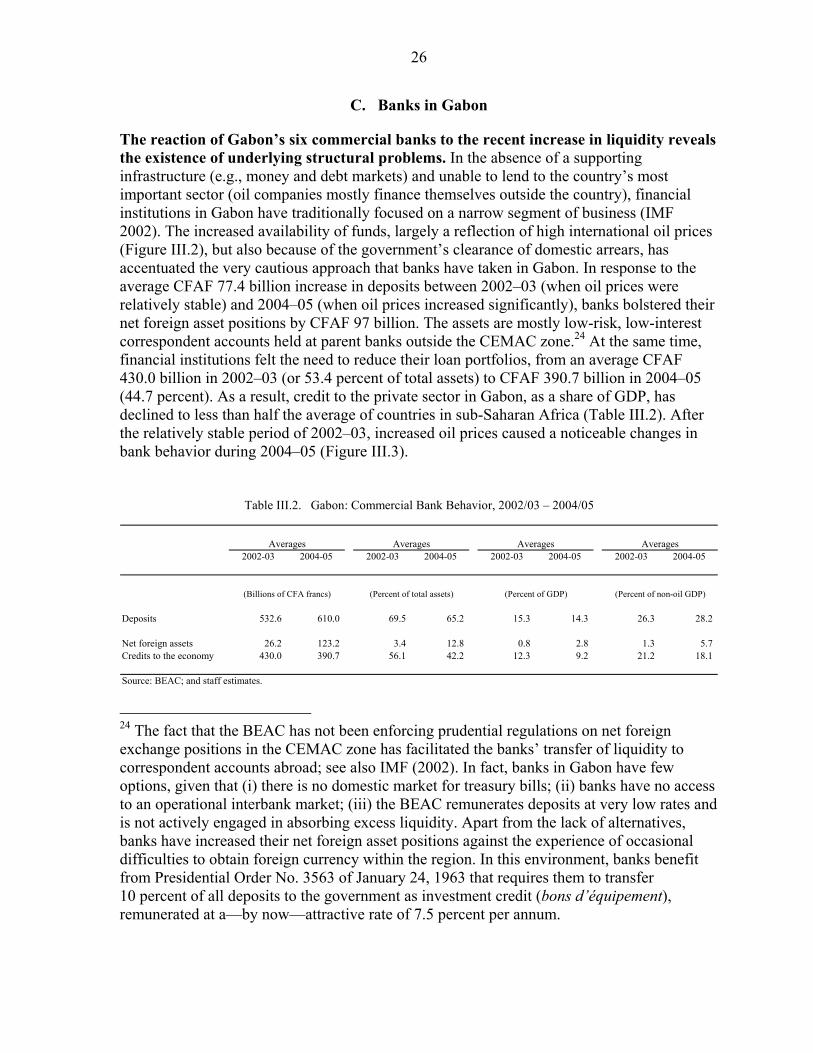
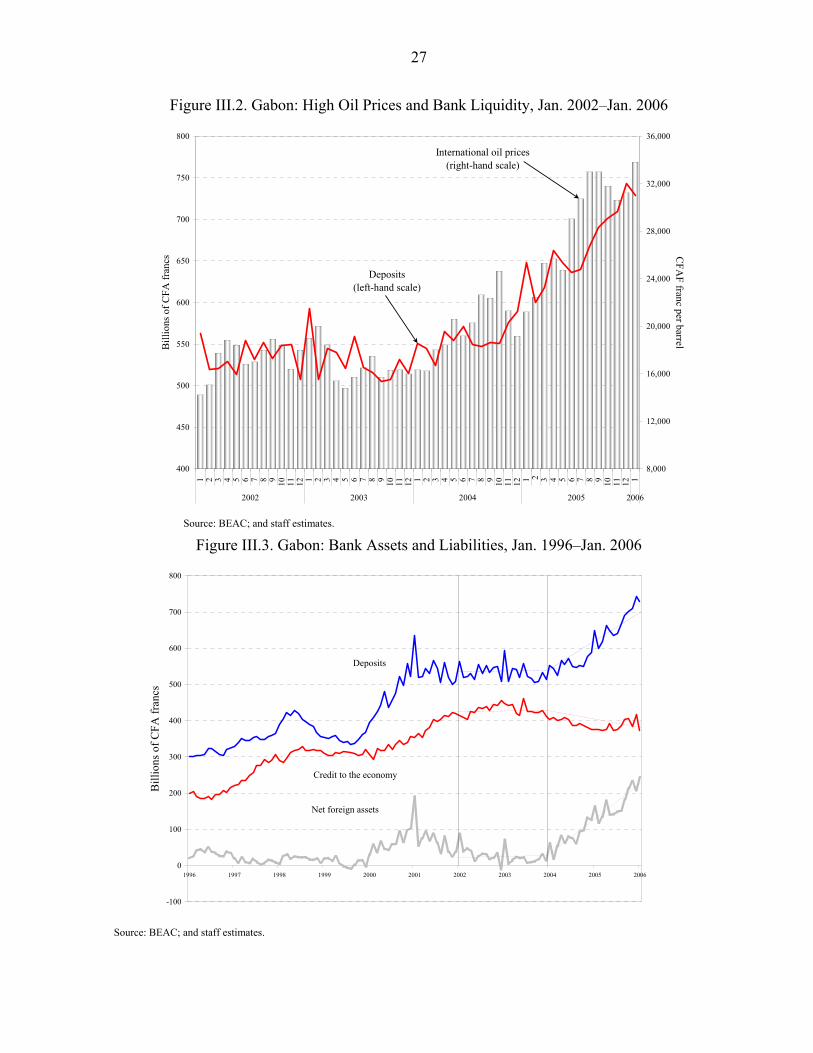
The reaction of Gabon’s six commercial banks to the recent increase in liquidity reveals the existence of underlying structural problems. In the absence of a supporting infrastructure (e.g., money and debt markets) and unable to lend to the country’s most important sector (oil companies mostly finance themselves outside the country), financial institutions in Gabon have traditionally focused on a narrow segment of business (IMF 2002). The increased availability of funds, largely a reflection of high international oil prices (Figure III.2), but also because of the government’s clearance of domestic arrears, has accentuated the very cautious approach that banks have taken in Gabon. In response to the average CFAF 77.4 billion increase in deposits between 2002–03 (when oil prices were relatively stable) and 2004–05 (when oil prices increased significantly), banks bolstered their net foreign asset positions by CFAF 97 billion. The assets are mostly low-risk, low-interest correspondent accounts held at parent banks outside the CEMAC zone.24 At the same time, financial institutions felt the need to reduce their loan portfolios, from an average CFAF 430.0 billion in 2002–03 (or 53.4 percent of total assets) to CFAF 390.7 billion in 2004–05 (44.7 percent). As a result, credit to the private sector in Gabon, as a share of GDP, has declined to less than half the average of countries in sub-Saharan Africa (Table III.2). After the relatively stable period of 2002–03, increased oil prices caused a noticeable changes in bank behavior during 2004–05 (Figure III.3).
2002-03 2004-05 2002-03 2004-05 2002-03 2004-05 2002-03 2004-05
Deposits 532.6 610.0 69.5 65.2 15.3 14.3 26.3 28.2
Net foreign assets 26.2 123.2 3.4 12.8 0.8 2.8 1.3 5.7Credits to the economy 430.0 390.7 56.1 42.2 12.3 9.2 21.2 18.1
Source: BEAC; and staff estimates.
Table III.2. Gabon: Commercial Bank Behavior, 2002/03 – 2004/05
(Billions of CFA francs) (Percent of total assets) (Percent of GDP) (Percent of non-oil GDP)
Averages Averages Averages Averages
24 The fact that the BEAC has not been enforcing prudential regulations on net foreign exchange positions in the CEMAC zone has facilitated the banks’ transfer of liquidity to correspondent accounts abroad; see also IMF (2002). In fact, banks in Gabon have few options, given that (i) there is no domestic market for treasury bills; (ii) banks have no access to an operational interbank market; (iii) the BEAC remunerates deposits at very low rates and is not actively engaged in absorbing excess liquidity. Apart from the lack of alternatives, banks have increased their net foreign asset positions against the experience of occasional difficulties to obtain foreign currency within the region. In this environment, banks benefit from Presidential Order No. 3563 of January 24, 1963 that requires them to transfer 10 percent of all deposits to the government as investment credit (bons d’équipement), remunerated at a—by now—attractive rate of 7.5 percent per annum.
27
Figure III.2. Gabon: High Oil Prices and Bank Liquidity, Jan. 2002–Jan. 2006
400
450
500
550
600
650
700
750
800
1 2 3 4 5 6 7 8 9 10
11
12 1 2 3 4 5 6 7 8 9 10
11
12 1 2 3 4 5 6 7 8 9 10
11
12 1 2 3 4 5 6 7 8 9 10
11
12 1
2002 2003 2004 2005 2006
Bill
ions
of C
FA fr
ancs
8,000
12,000
16,000
20,000
24,000
28,000
32,000
36,000C
FAF franc per barrel
Deposits(left-hand scale)
International oil prices (right-hand scale)
Source: BEAC; and staff estimates.
Figure III.3. Gabon: Bank Assets and Liabilities, Jan. 1996–Jan. 2006
-100
0
100
200
300
400
500
600
700
800
1996 1997 1998 1999 2000 2001 2002 2003 2004 2005 2006
Bill
ions
of C
FA fr
ancs
Deposits
Credit to the economy
Net foreign assets
Source: BEAC; and staff estimates.

28
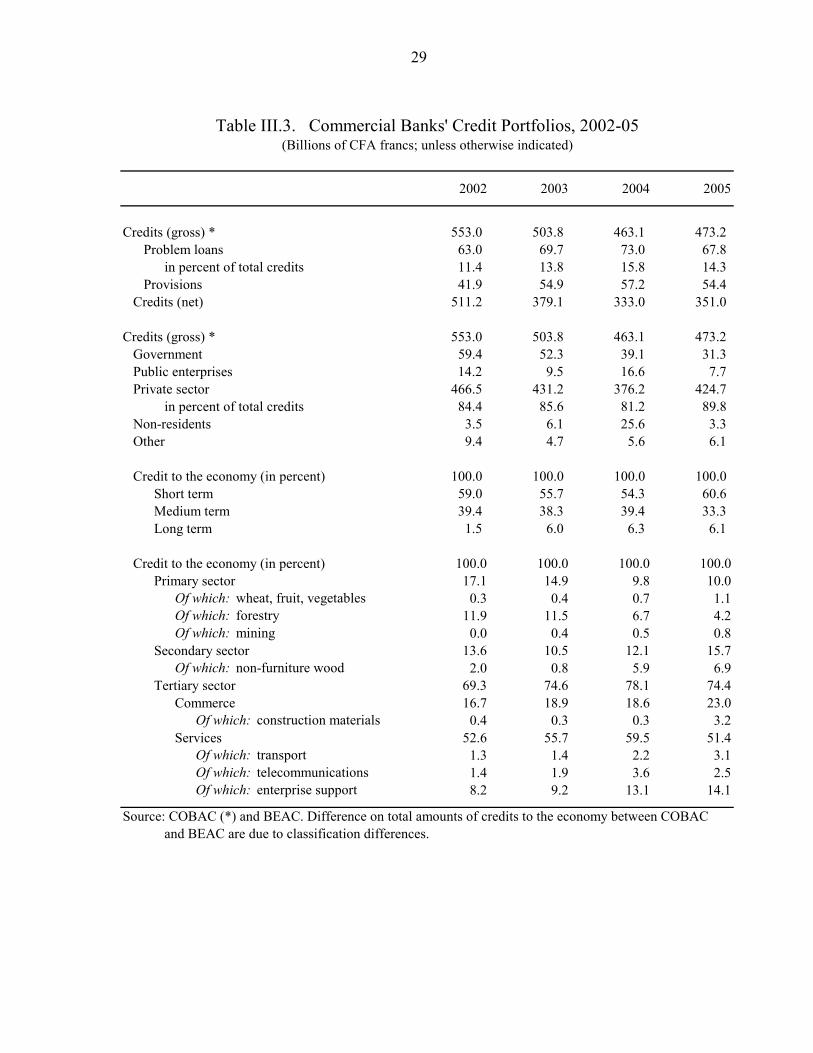
Similar to other CEMAC countries, banks in Gabon have trouble monitoring the quality of their loan portfolio. The regional supervisory agency, the Commission bancaire de l’Afrique centrale (COBAC 2006a), reports that 14.3 percent of credits outstanding at end-December 2005 are problem loans, as compared to 15.8 percent in 2004 and 13.8 percent in 2003 (Table III.3).25 These difficulties—paired with the banks’ preference to finance current-account operations of large enterprises, traders, and distribution companies rather than investment projects—result in the gradual trend increase of the relative share of short-term credits. In 2005, almost 61 percent of all outstanding credits were short term and only 6 percent long term.26 The corresponding figures for 2002–03 are 57 and 4 percent, respectively. More than one-half of all loans support the activities of enterprises in the tertiary sector, with the largest increases being in trade in construction materials and services in transport and enterprise support showing the largest increases. True investment activities were financed mainly in certain sectors of mining, agriculture and, particularly, the processing of wood for non-furniture commodities. In essentially all other sectors of the economy, most notably in forestry, banks provided substantially fewer credits in 2004–05 than in 2002–03 (Table III.3). After difficulties with non-performing loans in the high-risk forestry sector, commercial banks have decreased their loan exposure to this sector from more than CFAF 69 billion (11.9 percent of all outstanding credits) in 2002 to around CFAF 17 billion (4.2 percent) in 2005. This reduction of almost CFAF 52 billion in credits to the forestry sector—most prominently by the largest bank—explains 31 percent of the entire reduction in credit to the economy.
25 The corresponding figure for January 2006 was 15.1 percent (COBAC 2006b).
26 Unless banks can raise sufficient amounts of longer-term deposits, providing long-term loans will result in maturity mismatches and—possibly excessive—liquidity risk, especially in light of Gabon’s non-operational interbank market.
29
2002 2003 2004 2005
Credits (gross) * 553.0 503.8 463.1 473.2Problem loans 63.0 69.7 73.0 67.8
in percent of total credits 11.4 13.8 15.8 14.3Provisions 41.9 54.9 57.2 54.4
Credits (net) 511.2 379.1 333.0 351.0
Credits (gross) * 553.0 503.8 463.1 473.2Government 59.4 52.3 39.1 31.3Public enterprises 14.2 9.5 16.6 7.7Private sector 466.5 431.2 376.2 424.7
in percent of total credits 84.4 85.6 81.2 89.8Non-residents 3.5 6.1 25.6 3.3Other 9.4 4.7 5.6 6.1
Credit to the economy (in percent) 100.0 100.0 100.0 100.0Short term 59.0 55.7 54.3 60.6Medium term 39.4 38.3 39.4 33.3Long term 1.5 6.0 6.3 6.1
Credit to the economy (in percent) 100.0 100.0 100.0 100.0Primary sector 17.1 14.9 9.8 10.0
Of which: wheat, fruit, vegetables 0.3 0.4 0.7 1.1Of which: forestry 11.9 11.5 6.7 4.2Of which: mining 0.0 0.4 0.5 0.8
Secondary sector 13.6 10.5 12.1 15.7Of which: non-furniture wood 2.0 0.8 5.9 6.9
Tertiary sector 69.3 74.6 78.1 74.4Commerce 16.7 18.9 18.6 23.0
Of which: construction materials 0.4 0.3 0.3 3.2Services 52.6 55.7 59.5 51.4
Of which: transport 1.3 1.4 2.2 3.1Of which: telecommunications 1.4 1.9 3.6 2.5Of which: enterprise support 8.2 9.2 13.1 14.1
Source: COBAC (*) and BEAC. Difference on total amounts of credits to the economy between COBAC and BEAC are due to classification differences.
(Billions of CFA francs; unless otherwise indicated)Table III.3. Commercial Banks' Credit Portfolios, 2002-05
30
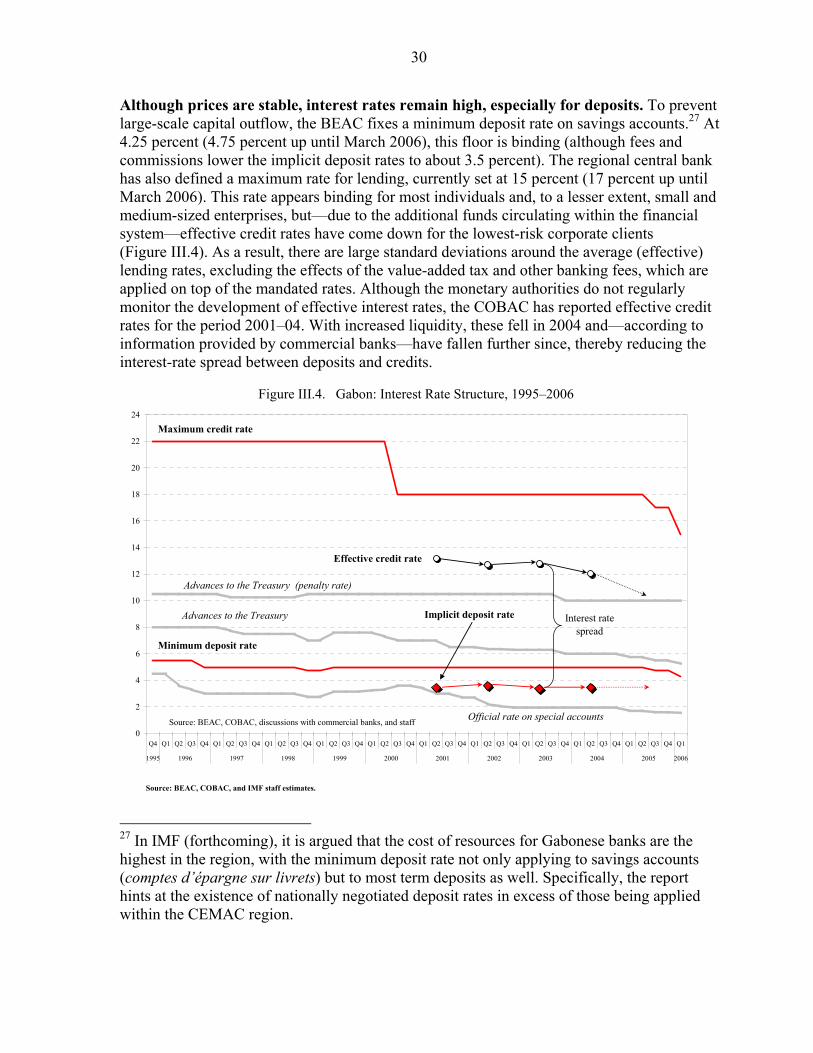
Although prices are stable, interest rates remain high, especially for deposits. To prevent large-scale capital outflow, the BEAC fixes a minimum deposit rate on savings accounts.27 At 4.25 percent (4.75 percent up until March 2006), this floor is binding (although fees and commissions lower the implicit deposit rates to about 3.5 percent). The regional central bank has also defined a maximum rate for lending, currently set at 15 percent (17 percent up until March 2006). This rate appears binding for most individuals and, to a lesser extent, small and medium-sized enterprises, but—due to the additional funds circulating within the financial system—effective credit rates have come down for the lowest-risk corporate clients (Figure III.4). As a result, there are large standard deviations around the average (effective) lending rates, excluding the effects of the value-added tax and other banking fees, which are applied on top of the mandated rates. Although the monetary authorities do not regularly monitor the development of effective interest rates, the COBAC has reported effective credit rates for the period 2001–04. With increased liquidity, these fell in 2004 and—according to information provided by commercial banks—have fallen further since, thereby reducing the interest-rate spread between deposits and credits.
Figure III.4. Gabon: Interest Rate Structure, 1995–2006
0
2
4
6
8
10
12
14
16
18
20
22
24
Q4 Q1 Q2 Q3 Q4 Q1 Q2 Q3 Q4 Q1 Q2 Q3 Q4 Q1 Q2 Q3 Q4 Q1 Q2 Q3 Q4 Q1 Q2 Q3 Q4 Q1 Q2 Q3 Q4 Q1 Q2 Q3 Q4 Q1 Q2 Q3 Q4 Q1 Q2 Q3 Q4 Q1
1995 1996 1997 1998 1999 2000 2001 2002 2003 2004 2005 2006
Advances to the Treasury
Advances to the Treasury (penalty rate)
Official rate on special accounts
Effective credit rate
Interest rate spread
Source: BEAC, COBAC, discussions with commercial banks, and staff
Minimum deposit rate
Maximum credit rate
Implicit deposit rate
27 In IMF (forthcoming), it is argued that the cost of resources for Gabonese banks are the highest in the region, with the minimum deposit rate not only applying to savings accounts (comptes d’épargne sur livrets) but to most term deposits as well. Specifically, the report hints at the existence of nationally negotiated deposit rates in excess of those being applied within the CEMAC region.
Source: BEAC, COBAC, and IMF staff estimates.
31
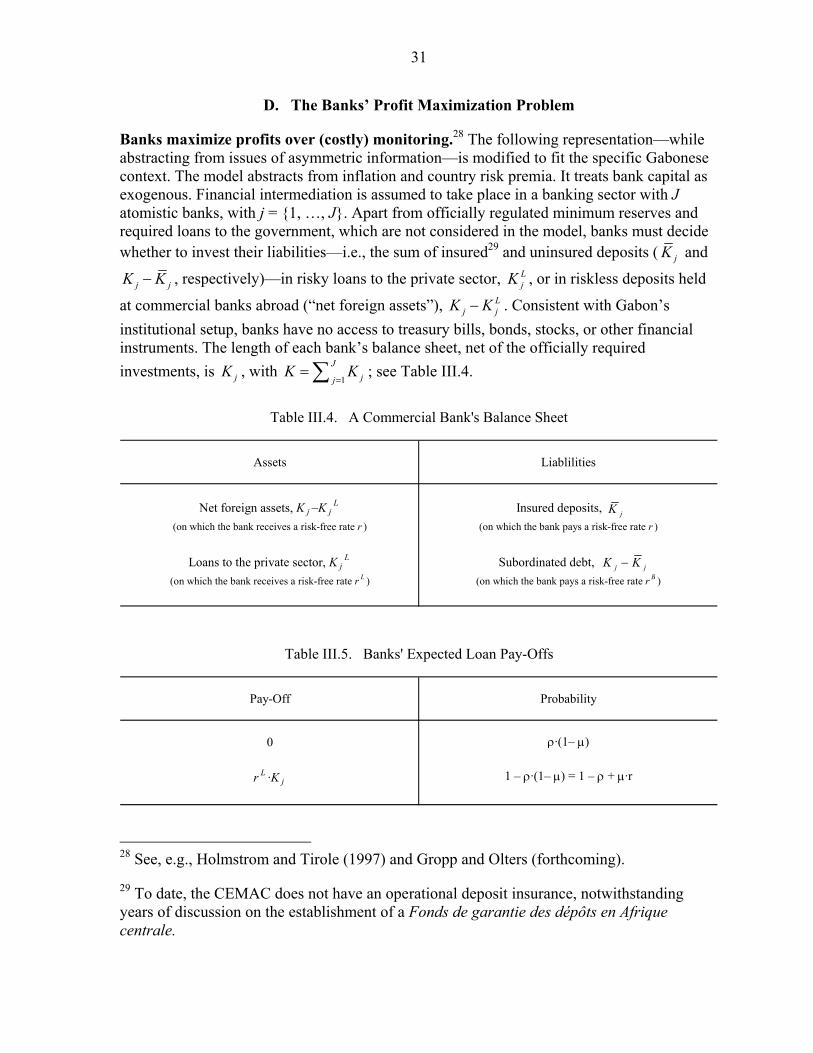
D. The Banks’ Profit Maximization Problem
Banks maximize profits over (costly) monitoring.28 The following representation—while abstracting from issues of asymmetric information—is modified to fit the specific Gabonese context. The model abstracts from inflation and country risk premia. It treats bank capital as exogenous. Financial intermediation is assumed to take place in a banking sector with J atomistic banks, with j = {1, …, J}. Apart from officially regulated minimum reserves and required loans to the government, which are not considered in the model, banks must decide whether to invest their liabilities—i.e., the sum of insured29 and uninsured deposits ( jK and
j jK K− , respectively)—in risky loans to the private sector, LjK , or in riskless deposits held
at commercial banks abroad (“net foreign assets”), Lj jK K− . Consistent with Gabon’s
institutional setup, banks have no access to treasury bills, bonds, stocks, or other financial
instruments. The length of each bank’s balance sheet, net of the officially required investments, is jK , with
1
Jjj
K K=
= ∑ ; see Table III.4.
Assets Liablilities
Net foreign assets, K j –K jL Insured deposits, K j
(on which the bank receives a risk-free rate r ) (on which the bank pays a risk-free rate r )
Loans to the private sector, K jL Subordinated debt, K j –K j
(on which the bank receives a risk-free rate r L ) (on which the bank pays a risk-free rate r B )
Table III.4. A Commercial Bank's Balance Sheet
jK
j jK K−
Pay-Off Probability
0 ρ·(1– µ)
r L ·K j 1 – ρ·(1– µ) = 1 – ρ + µ·r
Table III.5. Banks' Expected Loan Pay-Offs
28 See, e.g., Holmstrom and Tirole (1997) and Gropp and Olters (forthcoming).
29 To date, the CEMAC does not have an operational deposit insurance, notwithstanding years of discussion on the establishment of a Fonds de garantie des dépôts en Afrique centrale.
32
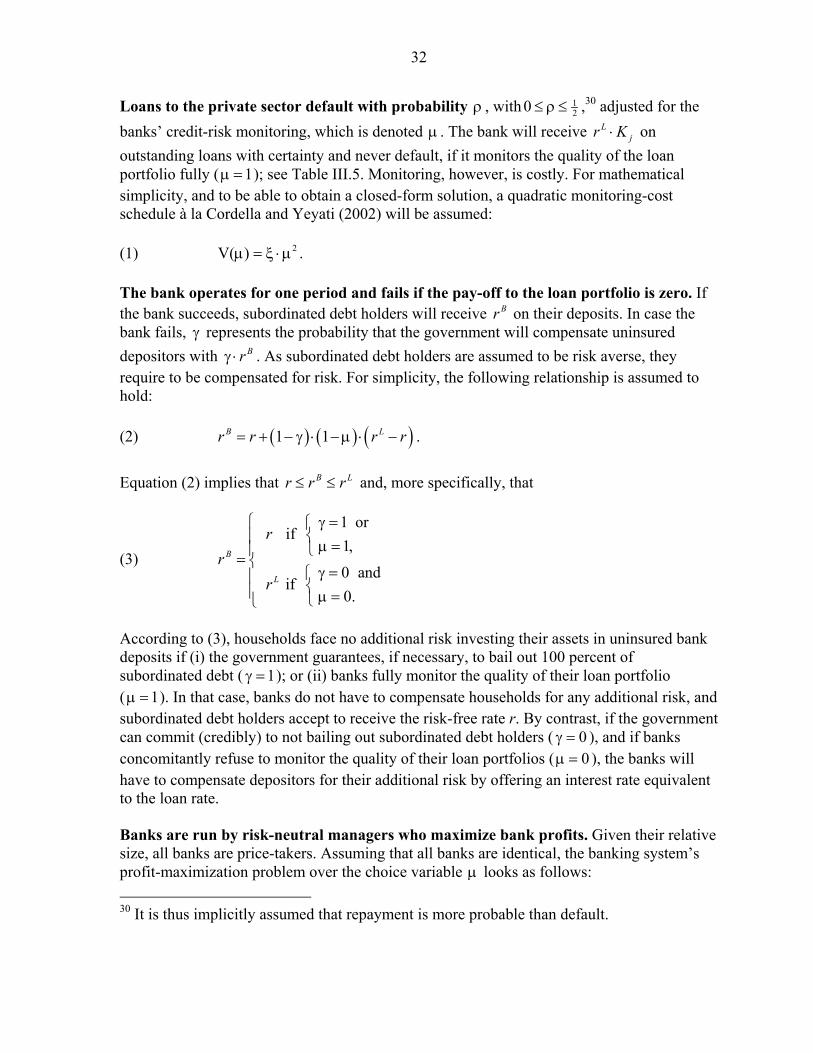
Loans to the private sector default with probability ρ , with 120 ≤ ρ ≤ ,30 adjusted for the
banks’ credit-risk monitoring, which is denoted µ . The bank will receive Ljr K⋅ on
outstanding loans with certainty and never default, if it monitors the quality of the loan portfolio fully ( 1µ = ); see Table III.5. Monitoring, however, is costly. For mathematical simplicity, and to be able to obtain a closed-form solution, a quadratic monitoring-cost schedule à la Cordella and Yeyati (2002) will be assumed: (1) 2V( )µ = ξ ⋅ µ . The bank operates for one period and fails if the pay-off to the loan portfolio is zero. If the bank succeeds, subordinated debt holders will receive Br on their deposits. In case the bank fails, γ represents the probability that the government will compensate uninsured depositors with Brγ ⋅ . As subordinated debt holders are assumed to be risk averse, they require to be compensated for risk. For simplicity, the following relationship is assumed to hold:
(2) ( ) ( ) ( )1 1B Lr r r r= + − γ ⋅ − µ ⋅ − . Equation (2) implies that B Lr r r≤ ≤ and, more specifically, that
(3)
1 or if
1,
0 and if
0.
B
L
rr
r
⎧ γ =⎧⎨⎪ µ =⎪ ⎩= ⎨
γ =⎧⎪⎨⎪ µ =⎩⎩
According to (3), households face no additional risk investing their assets in uninsured bank deposits if (i) the government guarantees, if necessary, to bail out 100 percent of subordinated debt ( 1γ = ); or (ii) banks fully monitor the quality of their loan portfolio ( 1µ = ). In that case, banks do not have to compensate households for any additional risk, and subordinated debt holders accept to receive the risk-free rate r. By contrast, if the government can commit (credibly) to not bailing out subordinated debt holders ( 0γ = ), and if banks concomitantly refuse to monitor the quality of their loan portfolios ( 0µ = ), the banks will have to compensate depositors for their additional risk by offering an interest rate equivalent to the loan rate. Banks are run by risk-neutral managers who maximize bank profits. Given their relative size, all banks are price-takers. Assuming that all banks are identical, the banking system’s profit-maximization problem over the choice variable µ looks as follows: 30 It is thus implicitly assumed that repayment is more probable than default.
33
(4) ( ) ( ) ( )( )
{ }max π 1 ρ ρ V( )L L L Br K r K K r K r K K K
µ= − + µ ⋅ ⋅ ⋅ + ⋅ − − ⋅ − ⋅ − − µ ⋅
( ) ( ) ( ) ( ) ( )( ) 21 ρ ρ 1 1L Lr r K K K K= − + µ ⋅ ⋅ − ⋅ − − γ ⋅ − µ ⋅ − − ξ ⋅µ ⋅ .
Equation (4) yields the following first-order condition:
(5) ( ) ( ) ( )( ) ( )( ): 2 1 1 2 1 0L LK r r K K K∂π− ⋅µ ⋅ξ ⋅ + − ⋅ − γ ⋅ − ⋅ − µ ⋅ρ ⋅ − + ρ⋅ ≡
∂µ.
The optimal level of banking sector monitoring, *µ , therefore equals
(6) ( ) ( ) ( )
( ) ( )*
1 1 212 1
LL
L
K K Kr rK KK Kr r
K
⎛ ⎞−− ⋅ − γ ⋅ − ⋅ρ ⋅ + ρ⋅⎜ ⎟
⎝ ⎠µ = ⋅−
ξ − − γ ⋅ρ⋅ − ⋅.
Capacity and institutional constraints are assumed to limit the bank’s ability to monitor the quality of its loan portfolio beyond a certain degree—i.e., 0 < µ ≤ µ , with 1µ < . Hence, if the profit-maximizing level of monitoring established in (6) exceeds the limit of the attainable degree of oversight—if *µ > µ —banks will respond by reducing their exposure to private-sector loans; see (6). Thus, for *µ > µ , optimal bank conduct is represented by
(7) ( ) ( )* 1 1 2 2 2 1L
L
K K KK K r r
− γ ⋅ − ⋅ρ + ⋅µ ⋅ρ ⎛ ⎞− ⋅µ ⋅ξ ⎛ ⎞= ⋅ − ⋅⎜ ⎟⎜ ⎟ρ ρ −⎝ ⎠⎝ ⎠.
Assuming that (i) the constraints on bank capability to monitor the quality of loan portfolios; (ii) monitoring costs; (iii) loan default probabilities; and (iv) implicit bail-out probabilities are time-invariant, equation (7) sees lending decisions as a function of the bank holdings of subordinated debt relative to the balance sheet and the interest-rate differential between deposit and credit rates:
(8) 0 11=
L
L
K K KK K r r
⎛ ⎞− ⎛ ⎞β ⋅ − β ⋅⎜ ⎟⎜ ⎟ −⎝ ⎠⎝ ⎠,
with ( ) ( )0 1
1 1 2 2 2, and − γ ⋅ − ⋅ρ + ⋅µ ⋅ρ ⋅µ ⋅ξ
β = β =ρ ρ
.
In a situation without operational deposit insurance, as is currently the case in Gabon, 0K = and ( ) 1K K K− = . Subsequently, equation (8) becomes
34
(9) 0 11=
L
L
KK r r
⎛ ⎞β − β ⋅⎜ ⎟−⎝ ⎠.
Equation (9) shows that the banks’ willingness to increase the share of credits relative to the exogenously given length of their balance sheets increases with a larger interest differential between lending and deposit rates (given the assumption of no inflation and an unchanged country risk premium). While the relation between credit to the economy as a share of total assets and the negative and inverse expression of the interest-rate spread (Figure III.5) appears to support this result, the lack of regular reporting on effective interest rates precludes a formal econometric assessment. Any structural reforms that would lower the cost of monitoring increase ratio of credit to the economy and bank capital, as
(10) *
0∂µ<
∂ξ (without monitoring constraints); see equation (6), or
(11) ( )*
0LK K∂
<∂ξ
(with monitoring constraints); see equation (7).
Equation (10) shows that lowering monitoring costs would induce banks to increase monitoring. In the presence of structural constraints limiting the amount of monitoring, the lowering of monitoring costs would increase credit to the economy as a share of total bank capital; see equation (11). These results combined would suggest a two-pronged approach to modernizing the banking sector in Gabon, viz., to (i) increase the interest-rate spread31 (i.e., to lower the administratively fixed deposit rate or eliminate such a floor entirely) and (ii) lower ξ by improving the institutional environment required to monitor more effectively the quality of credit applications, verify financial documentation, register collaterals and be able, if need be, to enforce corresponding contracts in a timely fashion.
31 Given that only the minimum deposit rate is binding in Gabon, this would imply a reduction in that rate. Against this background, the BEAC’s decision to lower this rate by half a percentage point on March 6, 2006 is very welcome.
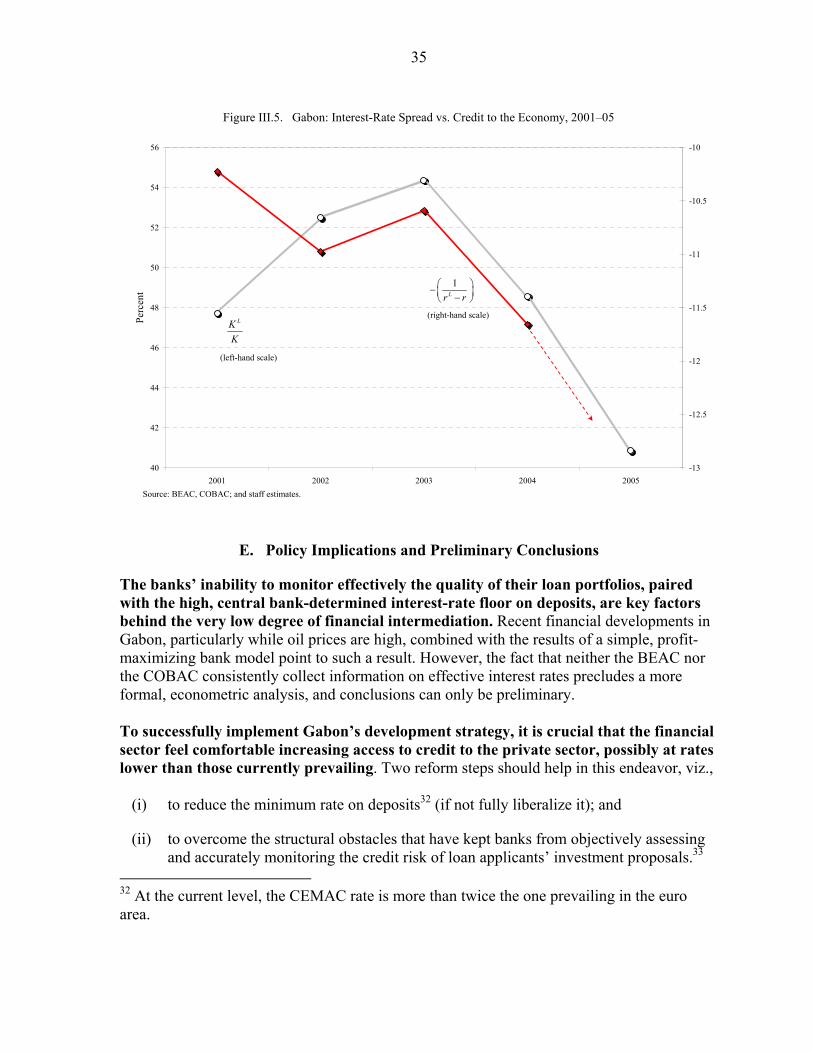
35
Figure III.5. Gabon: Interest-Rate Spread vs. Credit to the Economy, 2001–05
40
42
44
46
48
50
52
54
56
2001 2002 2003 2004 2005
Perc
ent
-13
-12.5
-12
-11.5
-11
-10.5
-10
Source: BEAC, COBAC; and staff estimates.
LKK
(left-hand scale)
1Lr r
⎛ ⎞− ⎜ ⎟−⎝ ⎠
(right-hand scale)
E. Policy Implications and Preliminary Conclusions
The banks’ inability to monitor effectively the quality of their loan portfolios, paired with the high, central bank-determined interest-rate floor on deposits, are key factors behind the very low degree of financial intermediation. Recent financial developments in Gabon, particularly while oil prices are high, combined with the results of a simple, profit-maximizing bank model point to such a result. However, the fact that neither the BEAC nor the COBAC consistently collect information on effective interest rates precludes a more formal, econometric analysis, and conclusions can only be preliminary. To successfully implement Gabon’s development strategy, it is crucial that the financial sector feel comfortable increasing access to credit to the private sector, possibly at rates lower than those currently prevailing. Two reform steps should help in this endeavor, viz., (i) to reduce the minimum rate on deposits32 (if not fully liberalize it); and
(ii) to overcome the structural obstacles that have kept banks from objectively assessing and accurately monitoring the credit risk of loan applicants’ investment proposals.33
32 At the current level, the CEMAC rate is more than twice the one prevailing in the euro area.

36
By increasing flexibility in the banking sector, lowering the interest-rate floor on deposits (or no longer applying it) should help to increase access to financial services. This would lower deposit rates, which would better align the costs of bank liabilities in Gabon with those of their international competitors. As minimum deposit or minimum income requirements for deposits would no longer be necessary, banks could broaden their customer base and increase the stability of their deposits. The resultant increase in the interest-rate spread between deposits and loans, which would—in all likelihood—permit a further decline in the effective lending rate, would create an incentive for banks to offer loans to new customers. These reforms need to be complemented by structural changes that would allow banks to assume more risk and extend credit to customers with whom they have not yet developed a “personal relationship of trust”. The reform agenda should therefore include measures to (i) strengthen the legal and regulatory environment for commercial matters; (ii) facilitate registration of collateral and accelerate foreclosure on collection; (iii) reinforce creditor rights; and (iv) improve corporate accounting practices.34 While many of these changes need to be addressed on the regional level, it would thus become easier to realize promising private-sector investments, and to do so at greater numbers—which would help Gabon to increase total factor productivity and its non-oil growth potential.
33 These recommendations contrast to an often observed reaction by policy-makers—inside and outside the region—to create state-owned “development” banks that are (politically) charged to support lending to domestic enterprises. However, the past performance of these types of institutions, in Gabon as well as in other countries, has shown that such measures do not only not substitute for the implementation of structural reforms to increase the proper functioning of the market but typically add to the difficulties in this sector.
34 These recommendations are in line with those presented in, e.g., IMF (2002), Christensen and Fischer (2005), Gulde-Wolf et al. (2006), and IMF (forthcoming).

37
References
Agénor, Pierre-Richard, and Peter Montiel, 1999, Development Macroeconomics, (Princeton: Princeton University Press, 2nd ed.).
Beck, Thorsten, Aslı Demirgüç-Kunt, and Ross Levine, 2004, “Finance, Inequality and
Poverty ”Cross-Country Evidence,” World Bank Policy Research Working Paper No. 3338 (Washington: World Bank).
Campos, Nauro, and Fabrizio Coricelli, 2002, “Growth in Transition: What We Know, What
We Don’t, and What We Should,” Journal of Economic Literature, Vol. 40 (September), pp. 793–836.
Christensen, Jakob, and Felix Fischer, 2005, “The Banking Sector in the Central African
Economic and Monetary Community (CEMAC) Region: Issues and Developmental Challenges,” in Central African Economic and Monetary Community: Selected Issues, IMF Country Report No. 05/390 (Washington: International Monetary Fund).
Claveranne, Benoît, 2005, La zone franc: Au-delà de la monnaie (Paris: Economica). Commission Bancaire de l’Afrique Central, 2006a (2006b), “Le système bancaire gabonais
au 31 décembre 2005 (31 janvier 2006),” mimeo. Cordella, Tito, and Eduardo Levy Yeyati, 2002, “Financial Opening, Deposit Insurance and
Risk in a Model of Banking Competition,” European Economic Review, Vol. 46, pp. 471–85.
Gabonese Republic, 2006, “Document de stratégie de croissance et de réduction de la
pauvreté” (Libreville: Ministry of Planning and Development). Goldsmith, Raymond, 1969, Financial Structure and Development (New Haven: Yale
University Press). Gropp, Reint, and Jan-Peter Olters, forthcoming, “The Political Economy of Bank Bail-
Outs,” unpublished mimeo. Gulde-Wolf, Anne-Marie, Catherine Pattillo, Jakob Christensen, Kevin Carey, and Smita
Wagh, 2006, “Financial Sectors: Issues, Challenges, and Reform Strategies,” in International Monetary Fund, Sub-Saharan Africa Regional Economic Outlook (Washington: International Monetary Fund), pp. 28–54.
Holden, Paul, and Vassili Prokopenko, 2001, “Financial Development and Poverty
Alleviation—Issues and Policy Implications for Developing and Transition Countries,” IMF Working Paper No. 01/160 (Washington: International Monetary Fund).
Holmstrom, Bengt, and Jean Tirole, 1997, “Financial Intermediation, Loanable Funds and the
Real Sector,” Quarterly Journal of Economics, Vol. 112, pp. 663–91.

38
International Monetary Fund (forthcoming), “Central African Economic and Monetary
Community: Financial System Stability Assessment” (Washington: International Monetary Fund).
International Monetary Fund (2002), “Gabon: Financial System Stability Assessment,
Including Reports on the Observance of Standards and Codes on the Following Topics: Monetary and Financial Policy Transparency, Banking Supervision, and Insurance Regulation,” IMF Country Report No. 02/98 (Washington: International Monetary Fund).
Jalilian, Hossein, and Colin Kirkpatrick, 2005, “Does Financial Development Contribute to
Poverty Reduction?” Journal of Development Studies, Vol. 41 (May), pp. 636–56. King, Robert G., and Ross Levine, 1993a, “Finance and Growth: Schumpeter Might Be
Right,” Quarterly Journal of Economics, Vol. 198 (August), pp. 717–37. —————, 1993b, “Finance, Entrepreneurship, and Growth: Theory and Evidence,”
Journal of Monetary Economics, Vol. 32 (December), pp. 513–42. Levine, Ross, 1997, “Financial Development and Economic Growth: Views and Agenda,”
Journal of Economic Literature, Vol. 35, No. 2, pp. 513–42. —————, Norman Loayza, and Thorsten Beck, 2000, “Financial Intermediation and
Growth: Causality and Causes,” Journal of Monetary Economics, Vol. 46 (August), pp. 31–77.
McKinnon, Ronald, 1973, Money and Capital in Economic Development (Washington:
Brookings Institution). Rioja, Felix, and Neven Valev, 2004, “Does One Size Fit All? A Reexamination of the
Finance and Growth Relationship,” Journal of Development Economics, Vol. 74, No. 4, pp. 429–47.
Sacerdoti, Emilio, 2005, “Access to Bank Credit in Sub-Saharan Africa: Key Issues and
Reform Strategies,” IMF Working Paper No. 05/166 (Washington: International Monetary Fund).
Saint-Paul, Gilles, 1992, “Technological Choice, Financial Markets, and Economic
Development,” European Economic Review, Vol. 36, pp. 763–81. Schumpeter, Joseph, 1934 (1959), The Theory of Economic Development: An Inquiry into
Profits, Capital, Credit, Interest, and the Business Cycle (Cambridge: Harvard University Press).
Shaw, Edward, 1973, Financial Deepening in Economic Development (New York: Oxford
University Press).

39
IV. FUEL PRICE SUBSIDIES IN GABON: FISCAL COST AND SOCIAL IMPACT35
A. Introduction
This paper looks at the impact of recent developments in international petroleum prices on fuel price subsidies in Gabon. While international fuel prices have more than doubled from 2003 to 2005, the domestic prices of petroleum products in Gabon remained frozen. The magnitude of these developments on price subsidies is quantified by comparing ex-refinery prices with estimated import parity prices (IPP). In addition, the social incidence of the subsidies is quantified using household survey data and a menu of policy options for reform is suggested. The first main finding is that fuel prices in Gabon benefit from substantial subsidies. The total fiscal cost of the implicit subsidies is likely to reach 3.2 percent and 4.5 percent of non-oil GDP in 2005 and 2006, respectively (1.6 percent and 2 percent of overall GDP). These subsidies are not reported explicitly in the fiscal accounts but are instead netted against oil revenue. The largest fiscal outlays are on the subsidization of diesel (used in large-scale industries and for ground and maritime transportation) and jet kerosene consumption. Secondly, the level of fuel price subsidization in Gabon is in the range observed in other developing and emerging market countries with fuel-price subsidies. Gabon’s estimated fuel price subsidy of 1.6 percent of overall GDP in 2005 is near the median of 2 percent of GDP observed in other countries for which data on subsidies were available. However, the almost four-fold increase in implicit subsidies in Gabon during 2003–05 is the largest out of the countries surveyed. Thirdly, it is mostly higher-income households that benefit from the fuel subsidies. The top 10 percent of individuals received about one-third of the total subsidy. Meanwhile, the bottom 30 percent of individuals received only 13 percent of the subsidies, highlighting that fuel price subsidies are a very costly way to protect the real incomes of the poor. The paper is structured as follows: Section B evaluates the magnitude of price subsidies at the ex-refinery level using estimated import parity prices, while Section C compares the degree of fuel price subsidization in Gabon with the size of subsidies in other developing and emerging market countries. Section D analyzes the social incidence of the subsidies, Section E discusses of policy options for mitigating the impact of reducing the subsidies, and Section F concludes.
35 Prepared by Moataz El-Said and Daniel Leigh (both FAD). This paper has and benefited from comments by Rina Bhattacharya, David Coady, Robert Gillingham, Sanjeev Gupta, Amine Mati, Roger Nord, David Newhouse, Joseph Ntamatungiro, Anton Op de Beke, Jan-Peter Olters, Rolando Ossowski, Fred Sexsmith, Mauricio Villafuerte, and participants at seminars organized by the Ministry of Finance of Gabon in Libreville on February 17, 2006 and by the Fiscal Affairs Department on May 9, 2006.

40
B. The Magnitude of Fuel Price Subsidies in Gabon
For the purposes of this paper, a subsidy is defined as the difference between the reduced price of a good with government support and the price of the good in the absence of such support. The implicit price subsidy for petroleum product i in time period t (Sit) can then be defined as the difference between the reference “free-market price” (Mit) and the actual price times the volume of consumption (Cit): (1) Sit = (Mit – Pit)Cit
At the core of the fuel price subsidies in Gabon are the ex-refinery prices of the seven petroleum products that have been frozen since 2002. 36 The sole supplier of these products to the domestic market is the majority-privately-owned refinery SOGARA,37 which purchases the crude oil required for its operations on the Gabonese market at an international market price. Due to the freeze on domestic ex-refinery fuel prices, in effect since 2002, the refinery sustains a loss when it sells the refined products on the Gabonese market. To quantify the loss, i.e., the value of the fuel price subsidy, a reference price (Mit) is computed every month by SOGARA using an import parity price (IPP) formula. The difference between the IPP and the frozen ex-refinery price multiplied by the quantity sold equals the monthly loss to the refinery for which it is compensated fully by the government. Payment is made in the form of crude oil delivered free of charge to SOGARA. SOGARA calculates the IPP using the items shown in Table IV.1. The IPP is equal to the f.o.b. Mediterranean price reported in Platt’s (row 1), to which are added various import costs (transportation and financial costs, rows 3-6) and customs duties (rows 16-19). An equalization (cross-subsidization) fee is applied to super and JetA1, to cover discounts applicable on other petroleum products (row 33). Importantly, the IPP also includes a fee, called the “competitiveness differential,” of CFAF 15,000 per metric ton (row 31) that is collected on account of SOGARA’s production inefficiency.38
36 Super gasoline, diesel, lighting kerosene, butane gas, jet kerosene, fuel oil, and asphalt.
37 SOGARA is owned by the Gabonese government (25 percent), Total (49,25 percent), Mobil, Shell, ChevronTexaco, Agip, (6.25 percent each), and others (7 percent). Because domestic demand exceeds SOGARA’s output, the refinery satisfies the domestic shortage by importing the products. 38 The “competitiveness differential” was originally intended to allow SOGARA to make a modest profit assuming it kept control of its costs. The authorities had intended for the competitiveness differential to gradually be reduced as SOGARA's throughput increased and as it reduced its administrative expenses. However, maintaining the competitiveness differential has been necessary due to the refinery’s production inefficiency.
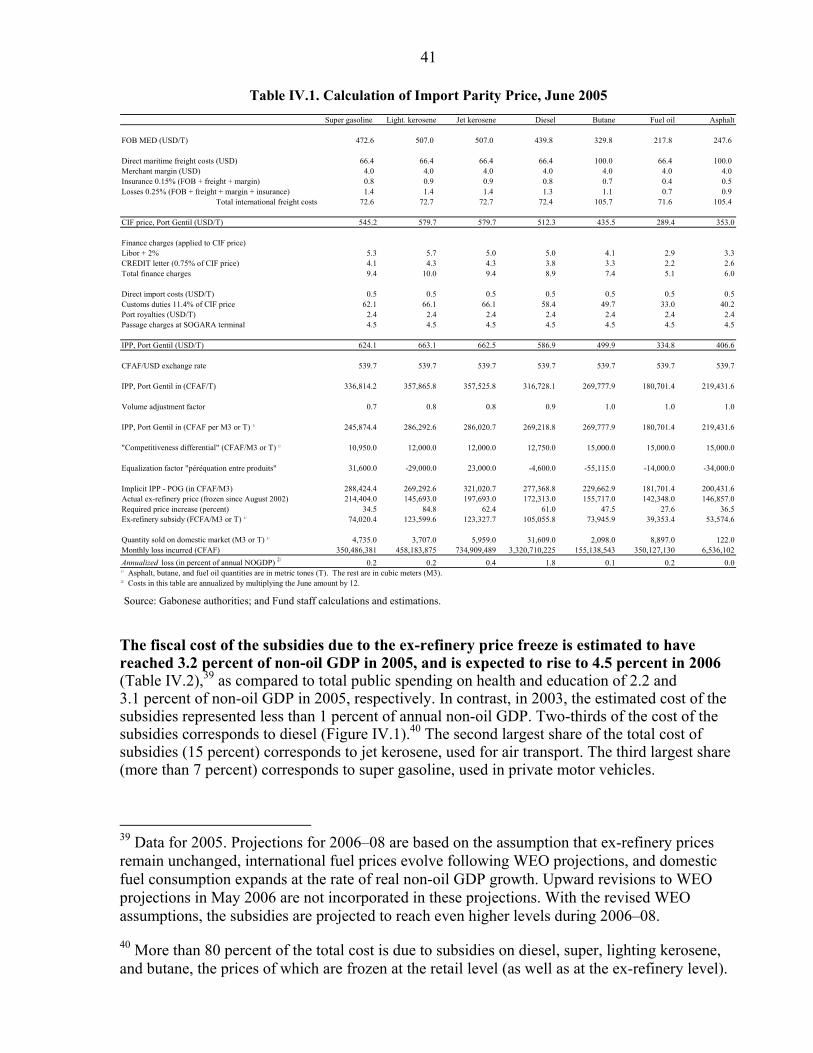
41
Super gasoline Light. kerosene Jet kerosene Diesel Butane Fuel oil Asphalt
FOB MED (USD/T) 472.6 507.0 507.0 439.8 329.8 217.8 247.6
Direct maritime freight costs (USD) 66.4 66.4 66.4 66.4 100.0 66.4 100.0 Merchant margin (USD) 4.0 4.0 4.0 4.0 4.0 4.0 4.0 Insurance 0.15% (FOB + freight + margin) 0.8 0.9 0.9 0.8 0.7 0.4 0.5 Losses 0.25% (FOB + freight + margin + insurance) 1.4 1.4 1.4 1.3 1.1 0.7 0.9
Total international freight costs 72.6 72.7 72.7 72.4 105.7 71.6 105.4
CIF price, Port Gentil (USD/T) 545.2 579.7 579.7 512.3 435.5 289.4 353.0
Finance charges (applied to CIF price)Libor + 2% 5.3 5.7 5.0 5.0 4.1 2.9 3.3CREDIT letter (0.75% of CIF price) 4.1 4.3 4.3 3.8 3.3 2.2 2.6Total finance charges 9.4 10.0 9.4 8.9 7.4 5.1 6.0
Direct import costs (USD/T) 0.5 0.5 0.5 0.5 0.5 0.5 0.5Customs duties 11.4% of CIF price 62.1 66.1 66.1 58.4 49.7 33.0 40.2Port royalties (USD/T) 2.4 2.4 2.4 2.4 2.4 2.4 2.4Passage charges at SOGARA terminal 4.5 4.5 4.5 4.5 4.5 4.5 4.5
IPP, Port Gentil (USD/T) 624.1 663.1 662.5 586.9 499.9 334.8 406.6
CFAF/USD exchange rate 539.7 539.7 539.7 539.7 539.7 539.7 539.7
IPP, Port Gentil in (CFAF/T) 336,814.2 357,865.8 357,525.8 316,728.1 269,777.9 180,701.4 219,431.6
Volume adjustment factor 0.7 0.8 0.8 0.9 1.0 1.0 1.0
IPP, Port Gentil in (CFAF per M3 or T) 1/ 245,874.4 286,292.6 286,020.7 269,218.8 269,777.9 180,701.4 219,431.6
"Competitiveness differential" (CFAF/M3 or T) 1/ 10,950.0 12,000.0 12,000.0 12,750.0 15,000.0 15,000.0 15,000.0
Equalization factor "péréquation entre produits" 31,600.0 -29,000.0 23,000.0 -4,600.0 -55,115.0 -14,000.0 -34,000.0
Implicit IPP - POG (in CFAF/M3) 288,424.4 269,292.6 321,020.7 277,368.8 229,662.9 181,701.4 200,431.6Actual ex-refinery price (frozen since August 2002) 214,404.0 145,693.0 197,693.0 172,313.0 155,717.0 142,348.0 146,857.0Required price increase (percent) 34.5 84.8 62.4 61.0 47.5 27.6 36.5Ex-refinery subsidy (FCFA/M3 or T) 1/ 74,020.4 123,599.6 123,327.7 105,055.8 73,945.9 39,353.4 53,574.6
Quantity sold on domestic market (M3 or T) 1/ 4,735.0 3,707.0 5,959.0 31,609.0 2,098.0 8,897.0 122.0Monthly loss incurred (CFAF) 350,486,381 458,183,875 734,909,489 3,320,710,225 155,138,543 350,127,130 6,536,102Annualized loss (in percent of annual NOGDP) 2/ 0.2 0.2 0.4 1.8 0.1 0.2 0.01/ Asphalt, butane, and fuel oil quantities are in metric tones (T). The rest are in cubic meters (M3).2/ Costs in this table are annualized by multiplying the June amount by 12.
Table IV.1. Calculation of Import Parity Price, June 2005
The fiscal cost of the subsidies due to the ex-refinery price freeze is estimated to have reached 3.2 percent of non-oil GDP in 2005, and is expected to rise to 4.5 percent in 2006 (Table IV.2),39 as compared to total public spending on health and education of 2.2 and 3.1 percent of non-oil GDP in 2005, respectively. In contrast, in 2003, the estimated cost of the subsidies represented less than 1 percent of annual non-oil GDP. Two-thirds of the cost of the subsidies corresponds to diesel (Figure IV.1).40 The second largest share of the total cost of subsidies (15 percent) corresponds to jet kerosene, used for air transport. The third largest share (more than 7 percent) corresponds to super gasoline, used in private motor vehicles.
39 Data for 2005. Projections for 2006–08 are based on the assumption that ex-refinery prices remain unchanged, international fuel prices evolve following WEO projections, and domestic fuel consumption expands at the rate of real non-oil GDP growth. Upward revisions to WEO projections in May 2006 are not incorporated in these projections. With the revised WEO assumptions, the subsidies are projected to reach even higher levels during 2006–08.
40 More than 80 percent of the total cost is due to subsidies on diesel, super, lighting kerosene, and butane, the prices of which are frozen at the retail level (as well as at the ex-refinery level).
Source: Gabonese authorities; and Fund staff calculations and estimations.

42
The cost of the subsidies is not reported explicitly in the fiscal accounts but is instead netted against oil revenue, i.e., the subsidies are implicit. This practice differs from the approach of other countries that enter the subsidization of fuel consumption explicitly under expenditure in the budget. In Yemen, for example, the cost of fuel subsidies is included in the budget and in the non-oil primary deficit that is used as a policy target variable.41 Fiscal transparency would be increased by making the subsidies—for which precise monthly data are available—explicit in the budget.
Figure IV.1. Gabon: Fiscal Cost of Fuel Price Subsidies, 2005 (Percent of total cost)
66
15
7
5
4
3
0
0 10 20 30 40 50 60 70
Diesel
Jet kerosene
Super gasoline
Lampant kerosene
Fuel oil
Butane gas
Asphalt
2005 2006 2007 2008
Total cost (billions of CFAF) 71.9 107.4 115.0 111.0(percent of GDP) 1.6 2.0 2.2 2.2(percent of non-oil GDP) 3.2 4.5 4.6 4.2
Memo itemsTotal public education expenditure (billions of CFAF) 2/ 70.0Total public health expenditure (billions of CFAF) 2/ 50.3Source: Gabonese authorities and IMF staff calculations and projections.
1/ Projections for 2006-8 are based on the assumption that ex-refinery prices remain unchanged, international fuel prices evolve following WEO projections, and domestic fuel consumption expands at the rate of real non-oil GDP growth.
2/ Total appropriations in the 2005 supplementary budget on wages and salaries, goods and services, transfers, and domestically-financed investment spending, in the education and health sectors, respectively.
Table IV.2. Annual Cost of Implicit Fuel Price Subsidies, 2005-2008
Projections 1/
The finding of large subsidies in Gabon raises the question as to how much retail fuel prices would have to increase if ex-refinery prices increased to IPP levels. Data from the authorities on the taxes, fees, and margins included in the structure of retail fuel prices facilitate the analysis. Table IV.3 reports the increase in ex-refinery prices of super gasoline, 41 See the IMF Yemen Country Report No. 05/111. The rationale for including subsidies in the non-oil primary balance is that they represent a controllable expenditure item that affects aggregate demand. If the world price of fuel changes, the government can choose how much of the price change to pass through to domestic prices.
Source: Gabonese authorities; and Fund staff calculations and estimations.
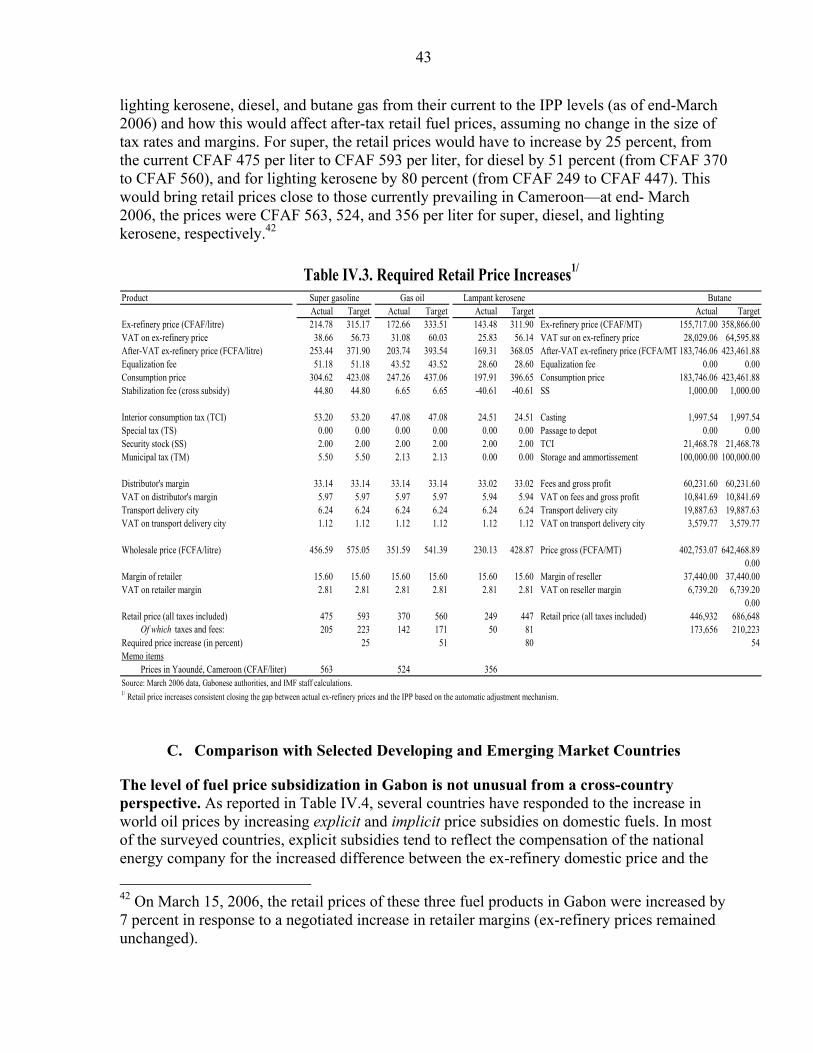
43
lighting kerosene, diesel, and butane gas from their current to the IPP levels (as of end-March 2006) and how this would affect after-tax retail fuel prices, assuming no change in the size of tax rates and margins. For super, the retail prices would have to increase by 25 percent, from the current CFAF 475 per liter to CFAF 593 per liter, for diesel by 51 percent (from CFAF 370 to CFAF 560), and for lighting kerosene by 80 percent (from CFAF 249 to CFAF 447). This would bring retail prices close to those currently prevailing in Cameroon—at end- March 2006, the prices were CFAF 563, 524, and 356 per liter for super, diesel, and lighting kerosene, respectively.42
ProductActual Target Actual Target Actual Target Actual Target
Ex-refinery price (CFAF/litre) 214.78 315.17 172.66 333.51 143.48 311.90 Ex-refinery price (CFAF/MT) 155,717.00 358,866.00VAT on ex-refinery price 38.66 56.73 31.08 60.03 25.83 56.14 VAT sur on ex-refinery price 28,029.06 64,595.88After-VAT ex-refinery price (FCFA/litre) 253.44 371.90 203.74 393.54 169.31 368.05 After-VAT ex-refinery price (FCFA/MT 183,746.06 423,461.88Equalization fee 51.18 51.18 43.52 43.52 28.60 28.60 Equalization fee 0.00 0.00Consumption price 304.62 423.08 247.26 437.06 197.91 396.65 Consumption price 183,746.06 423,461.88Stabilization fee (cross subsidy) 44.80 44.80 6.65 6.65 -40.61 -40.61 SS 1,000.00 1,000.00
Interior consumption tax (TCI) 53.20 53.20 47.08 47.08 24.51 24.51 Casting 1,997.54 1,997.54Special tax (TS) 0.00 0.00 0.00 0.00 0.00 0.00 Passage to depot 0.00 0.00Security stock (SS) 2.00 2.00 2.00 2.00 2.00 2.00 TCI 21,468.78 21,468.78Municipal tax (TM) 5.50 5.50 2.13 2.13 0.00 0.00 Storage and ammortissement 100,000.00 100,000.00
Distributor's margin 33.14 33.14 33.14 33.14 33.02 33.02 Fees and gross profit 60,231.60 60,231.60VAT on distributor's margin 5.97 5.97 5.97 5.97 5.94 5.94 VAT on fees and gross profit 10,841.69 10,841.69Transport delivery city 6.24 6.24 6.24 6.24 6.24 6.24 Transport delivery city 19,887.63 19,887.63VAT on transport delivery city 1.12 1.12 1.12 1.12 1.12 1.12 VAT on transport delivery city 3,579.77 3,579.77
Wholesale price (FCFA/litre) 456.59 575.05 351.59 541.39 230.13 428.87 Price gross (FCFA/MT) 402,753.07 642,468.890.00
Margin of retailer 15.60 15.60 15.60 15.60 15.60 15.60 Margin of reseller 37,440.00 37,440.00VAT on retailer margin 2.81 2.81 2.81 2.81 2.81 2.81 VAT on reseller margin 6,739.20 6,739.20
0.00Retail price (all taxes included) 475 593 370 560 249 447 Retail price (all taxes included) 446,932 686,648
Of which taxes and fees: 205 223 142 171 50 81 173,656 210,223Required price increase (in percent) 25 51 80 54Memo items
Prices in Yaoundé, Cameroon (CFAF/liter) 563 524 356Source: March 2006 data, Gabonese authorities, and IMF staff calculations.1/ Retail price increases consistent closing the gap between actual ex-refinery prices and the IPP based on the automatic adjustment mechanism.
ButaneSuper gasoline Lampant keroseneGas oil
Table IV.3. Required Retail Price Increases1/
C. Comparison with Selected Developing and Emerging Market Countries
The level of fuel price subsidization in Gabon is not unusual from a cross-country perspective. As reported in Table IV.4, several countries have responded to the increase in world oil prices by increasing explicit and implicit price subsidies on domestic fuels. In most of the surveyed countries, explicit subsidies tend to reflect the compensation of the national energy company for the increased difference between the ex-refinery domestic price and the 42 On March 15, 2006, the retail prices of these three fuel products in Gabon were increased by 7 percent in response to a negotiated increase in retailer margins (ex-refinery prices remained unchanged).
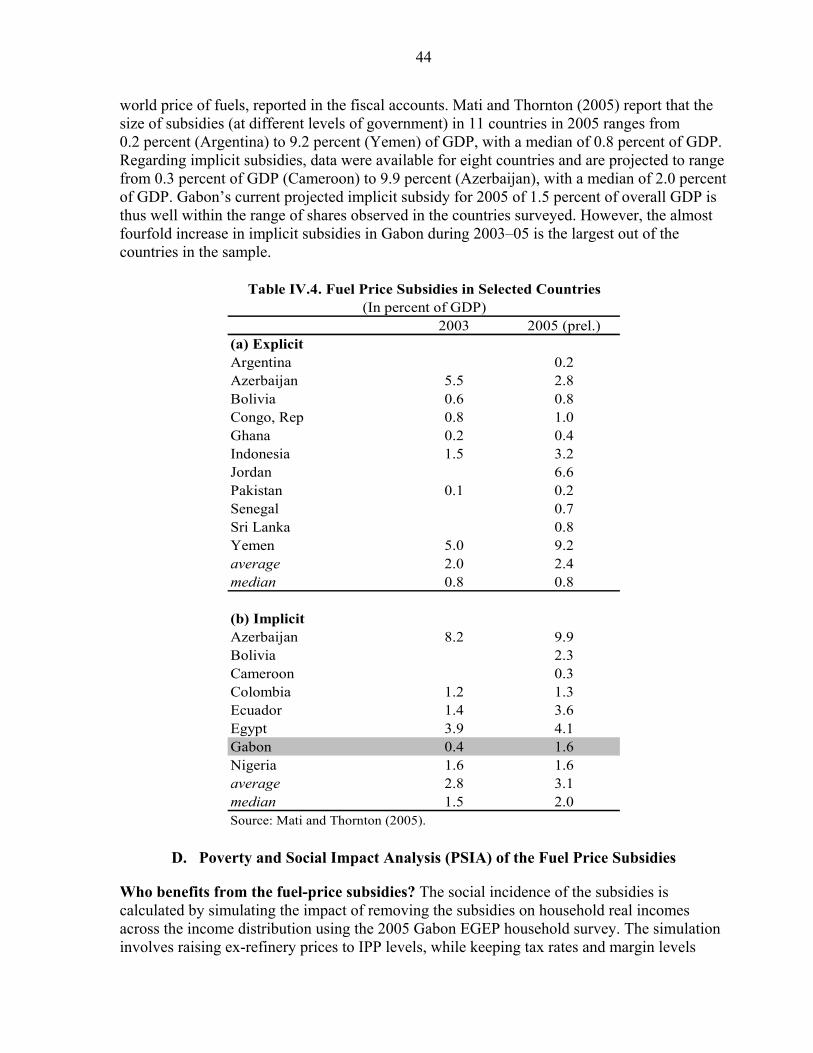
44
world price of fuels, reported in the fiscal accounts. Mati and Thornton (2005) report that the size of subsidies (at different levels of government) in 11 countries in 2005 ranges from 0.2 percent (Argentina) to 9.2 percent (Yemen) of GDP, with a median of 0.8 percent of GDP. Regarding implicit subsidies, data were available for eight countries and are projected to range from 0.3 percent of GDP (Cameroon) to 9.9 percent (Azerbaijan), with a median of 2.0 percent of GDP. Gabon’s current projected implicit subsidy for 2005 of 1.5 percent of overall GDP is thus well within the range of shares observed in the countries surveyed. However, the almost fourfold increase in implicit subsidies in Gabon during 2003–05 is the largest out of the countries in the sample.
2003 2005 (prel.)(a) ExplicitArgentina 0.2Azerbaijan 5.5 2.8Bolivia 0.6 0.8Congo, Rep 0.8 1.0Ghana 0.2 0.4Indonesia 1.5 3.2Jordan 6.6Pakistan 0.1 0.2Senegal 0.7Sri Lanka 0.8Yemen 5.0 9.2average 2.0 2.4median 0.8 0.8
(b) ImplicitAzerbaijan 8.2 9.9Bolivia 2.3Cameroon 0.3Colombia 1.2 1.3Ecuador 1.4 3.6Egypt 3.9 4.1Gabon 0.4 1.6Nigeria 1.6 1.6average 2.8 3.1median 1.5 2.0Source: Mati and Thornton (2005).
(In percent of GDP)Table IV.4. Fuel Price Subsidies in Selected Countries
D. Poverty and Social Impact Analysis (PSIA) of the Fuel Price Subsidies
Who benefits from the fuel-price subsidies? The social incidence of the subsidies is calculated by simulating the impact of removing the subsidies on household real incomes across the income distribution using the 2005 Gabon EGEP household survey. The simulation involves raising ex-refinery prices to IPP levels, while keeping tax rates and margin levels
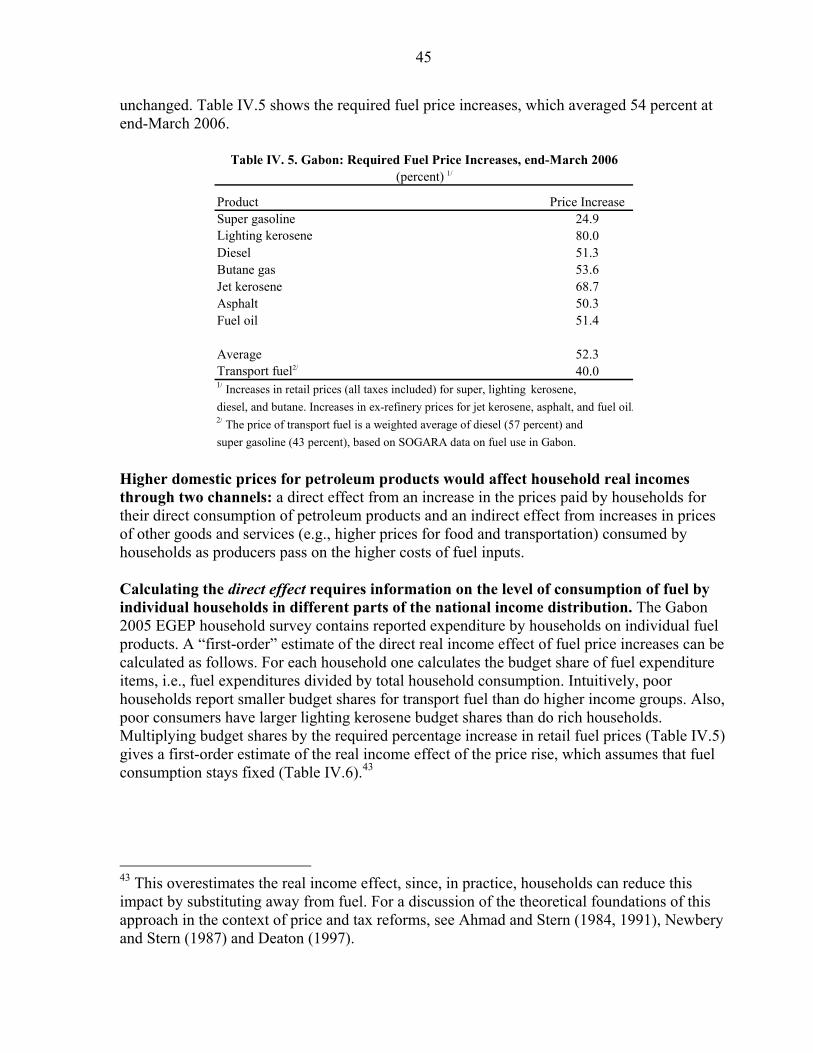
45
unchanged. Table IV.5 shows the required fuel price increases, which averaged 54 percent at end-March 2006.
Product Price IncreaseSuper gasoline 24.9Lighting kerosene 80.0Diesel 51.3Butane gas 53.6Jet kerosene 68.7Asphalt 50.3Fuel oil 51.4
Average 52.3Transport fuel2/ 40.01/ Increases in retail prices (all taxes included) for super, lighting kerosene, diesel, and butane. Increases in ex-refinery prices for jet kerosene, asphalt, and fuel oil.2/ The price of transport fuel is a weighted average of diesel (57 percent) andsuper gasoline (43 percent), based on SOGARA data on fuel use in Gabon.
(percent) 1/Table IV. 5. Gabon: Required Fuel Price Increases, end-March 2006
Higher domestic prices for petroleum products would affect household real incomes through two channels: a direct effect from an increase in the prices paid by households for their direct consumption of petroleum products and an indirect effect from increases in prices of other goods and services (e.g., higher prices for food and transportation) consumed by households as producers pass on the higher costs of fuel inputs. Calculating the direct effect requires information on the level of consumption of fuel by individual households in different parts of the national income distribution. The Gabon 2005 EGEP household survey contains reported expenditure by households on individual fuel products. A “first-order” estimate of the direct real income effect of fuel price increases can be calculated as follows. For each household one calculates the budget share of fuel expenditure items, i.e., fuel expenditures divided by total household consumption. Intuitively, poor households report smaller budget shares for transport fuel than do higher income groups. Also, poor consumers have larger lighting kerosene budget shares than do rich households. Multiplying budget shares by the required percentage increase in retail fuel prices (Table IV.5) gives a first-order estimate of the real income effect of the price rise, which assumes that fuel consumption stays fixed (Table IV.6).43
43 This overestimates the real income effect, since, in practice, households can reduce this impact by substituting away from fuel. For a discussion of the theoretical foundations of this approach in the context of price and tax reforms, see Ahmad and Stern (1984, 1991), Newbery and Stern (1987) and Deaton (1997).
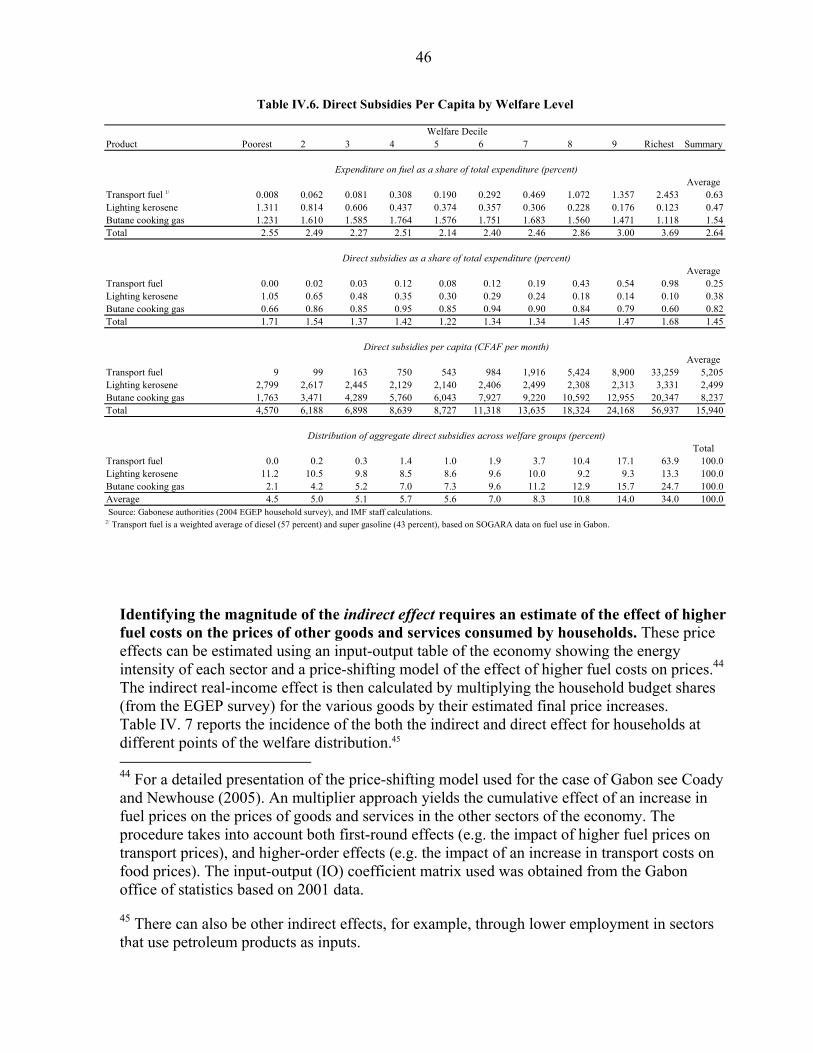
46
Product Poorest 2 3 4 5 6 7 8 9 Richest Summary
AverageTransport fuel 1/ 0.008 0.062 0.081 0.308 0.190 0.292 0.469 1.072 1.357 2.453 0.63Lighting kerosene 1.311 0.814 0.606 0.437 0.374 0.357 0.306 0.228 0.176 0.123 0.47Butane cooking gas 1.231 1.610 1.585 1.764 1.576 1.751 1.683 1.560 1.471 1.118 1.54Total 2.55 2.49 2.27 2.51 2.14 2.40 2.46 2.86 3.00 3.69 2.64
AverageTransport fuel 0.00 0.02 0.03 0.12 0.08 0.12 0.19 0.43 0.54 0.98 0.25Lighting kerosene 1.05 0.65 0.48 0.35 0.30 0.29 0.24 0.18 0.14 0.10 0.38Butane cooking gas 0.66 0.86 0.85 0.95 0.85 0.94 0.90 0.84 0.79 0.60 0.82Total 1.71 1.54 1.37 1.42 1.22 1.34 1.34 1.45 1.47 1.68 1.45
AverageTransport fuel 9 99 163 750 543 984 1,916 5,424 8,900 33,259 5,205Lighting kerosene 2,799 2,617 2,445 2,129 2,140 2,406 2,499 2,308 2,313 3,331 2,499Butane cooking gas 1,763 3,471 4,289 5,760 6,043 7,927 9,220 10,592 12,955 20,347 8,237Total 4,570 6,188 6,898 8,639 8,727 11,318 13,635 18,324 24,168 56,937 15,940
TotalTransport fuel 0.0 0.2 0.3 1.4 1.0 1.9 3.7 10.4 17.1 63.9 100.0Lighting kerosene 11.2 10.5 9.8 8.5 8.6 9.6 10.0 9.2 9.3 13.3 100.0Butane cooking gas 2.1 4.2 5.2 7.0 7.3 9.6 11.2 12.9 15.7 24.7 100.0Average 4.5 5.0 5.1 5.7 5.6 7.0 8.3 10.8 14.0 34.0 100.0 Source: Gabonese authorities (2004 EGEP household survey), and IMF staff calculations.2/ Transport fuel is a weighted average of diesel (57 percent) and super gasoline (43 percent), based on SOGARA data on fuel use in Gabon.
Table IV.6. Direct Subsidies Per Capita by Welfare Level
Welfare Decile
Distribution of aggregate direct subsidies across welfare groups (percent)
Direct subsidies per capita (CFAF per month)
Direct subsidies as a share of total expenditure (percent)
Expenditure on fuel as a share of total expenditure (percent)
Identifying the magnitude of the indirect effect requires an estimate of the effect of higher fuel costs on the prices of other goods and services consumed by households. These price effects can be estimated using an input-output table of the economy showing the energy intensity of each sector and a price-shifting model of the effect of higher fuel costs on prices.44 The indirect real-income effect is then calculated by multiplying the household budget shares (from the EGEP survey) for the various goods by their estimated final price increases. Table IV. 7 reports the incidence of the both the indirect and direct effect for households at different points of the welfare distribution.45 44 For a detailed presentation of the price-shifting model used for the case of Gabon see Coady and Newhouse (2005). An multiplier approach yields the cumulative effect of an increase in fuel prices on the prices of goods and services in the other sectors of the economy. The procedure takes into account both first-round effects (e.g. the impact of higher fuel prices on transport prices), and higher-order effects (e.g. the impact of an increase in transport costs on food prices). The input-output (IO) coefficient matrix used was obtained from the Gabon office of statistics based on 2001 data.
45 There can also be other indirect effects, for example, through lower employment in sectors that use petroleum products as inputs.
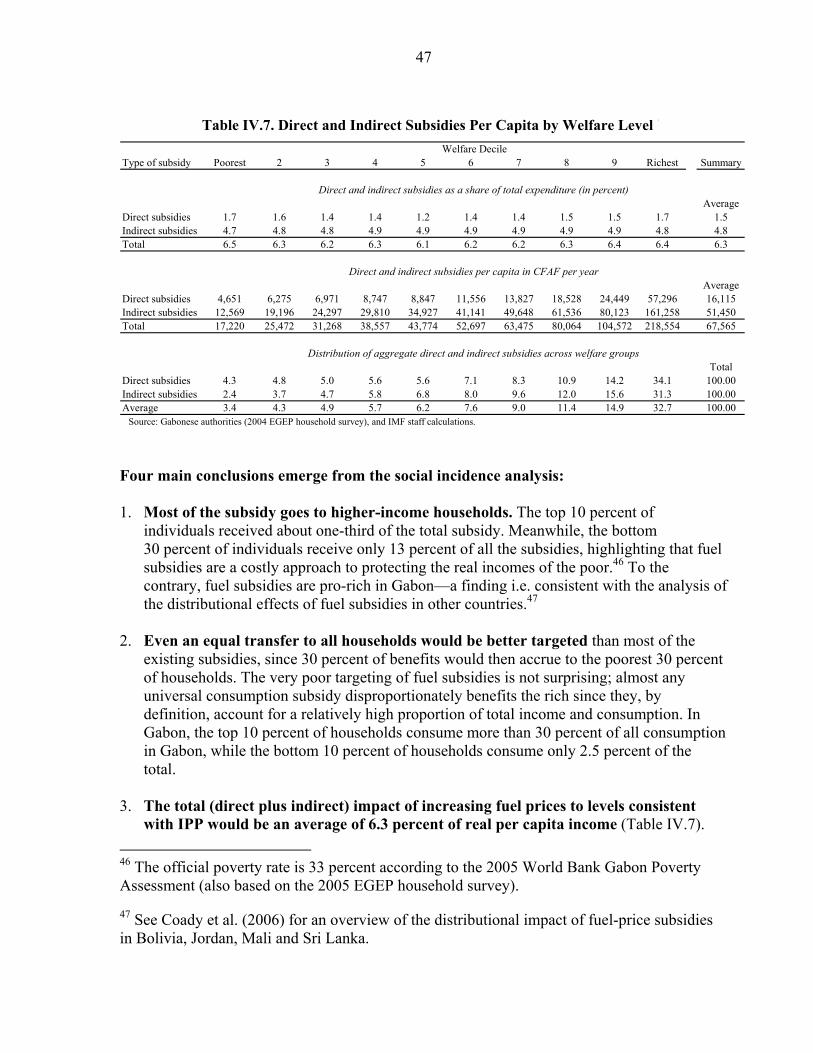
47
Type of subsidy Poorest 2 3 4 5 6 7 8 9 Richest Summary
AverageDirect subsidies 1.7 1.6 1.4 1.4 1.2 1.4 1.4 1.5 1.5 1.7 1.5Indirect subsidies 4.7 4.8 4.8 4.9 4.9 4.9 4.9 4.9 4.9 4.8 4.8Total 6.5 6.3 6.2 6.3 6.1 6.2 6.2 6.3 6.4 6.4 6.3
AverageDirect subsidies 4,651 6,275 6,971 8,747 8,847 11,556 13,827 18,528 24,449 57,296 16,115Indirect subsidies 12,569 19,196 24,297 29,810 34,927 41,141 49,648 61,536 80,123 161,258 51,450Total 17,220 25,472 31,268 38,557 43,774 52,697 63,475 80,064 104,572 218,554 67,565
TotalDirect subsidies 4.3 4.8 5.0 5.6 5.6 7.1 8.3 10.9 14.2 34.1 100.00Indirect subsidies 2.4 3.7 4.7 5.8 6.8 8.0 9.6 12.0 15.6 31.3 100.00Average 3.4 4.3 4.9 5.7 6.2 7.6 9.0 11.4 14.9 32.7 100.001/ Source: Gabonese authorities (2004 EGEP household survey), and IMF staff calculations.
Direct and indirect subsidies per capita in CFAF per year
Distribution of aggregate direct and indirect subsidies across welfare groups
Table IV.7. Direct and Indirect Subsidies Per Capita by Welfare Level 1/
Welfare Decile
Direct and indirect subsidies as a share of total expenditure (in percent)
Four main conclusions emerge from the social incidence analysis: 1. Most of the subsidy goes to higher-income households. The top 10 percent of
individuals received about one-third of the total subsidy. Meanwhile, the bottom 30 percent of individuals receive only 13 percent of all the subsidies, highlighting that fuel subsidies are a costly approach to protecting the real incomes of the poor.46 To the contrary, fuel subsidies are pro-rich in Gabon—a finding i.e. consistent with the analysis of the distributional effects of fuel subsidies in other countries.47
2. Even an equal transfer to all households would be better targeted than most of the
existing subsidies, since 30 percent of benefits would then accrue to the poorest 30 percent of households. The very poor targeting of fuel subsidies is not surprising; almost any universal consumption subsidy disproportionately benefits the rich since they, by definition, account for a relatively high proportion of total income and consumption. In Gabon, the top 10 percent of households consume more than 30 percent of all consumption in Gabon, while the bottom 10 percent of households consume only 2.5 percent of the total.
3. The total (direct plus indirect) impact of increasing fuel prices to levels consistent
with IPP would be an average of 6.3 percent of real per capita income (Table IV.7). 46 The official poverty rate is 33 percent according to the 2005 World Bank Gabon Poverty Assessment (also based on the 2005 EGEP household survey).
47 See Coady et al. (2006) for an overview of the distributional impact of fuel-price subsidies in Bolivia, Jordan, Mali and Sri Lanka.
48
This impact corresponds to an average retail price increase of 54 percent, and is consistent with the range observed in other countries (3–9 percent real income decline for average price increases ranging from 34–68 percent), as reported in Coady et al. (2006).
4. The indirect effect, at 4.8 percent of real income, is larger than the direct effect. This
finding reflects the fact that a substantial proportion of diesel and other fuel is used in the production and distribution of other goods and services.
E. Mitigating the Effect of Price Increases on the Poor
The escalating fiscal cost of the subsidies, and their pro-rich bias, suggests the need to reduce them. There is also a consensus in the literature that fuel subsidies are inappropriate on efficiency grounds, as they discourage producers from acquiring more energy-efficient technologies, so as to remain competitive in worlds markets.48 However, governments are often reluctant to allow fuel prices to increase due to the adverse effect that such price increases would have on the real incomes of poor households. Fortunately, as most fuel subsidies accrue to higher income households, it is often possible to eliminate the subsidies while using some of the budgetary savings to finance better targeted-programs to compensate the poor. This section suggests a number of short- and medium-term mitigating measures that could accompany an increase in fuel prices in Gabon, drawing on discussions with the Gabonese authorities, and on the experience of other countries, as discussed in Coady et al. (2006). Short-term measures • Electricity “social” tariff reductions. Given that electricity is an important source of
energy for poor households and its cost is closely correlated with fuel prices, reforming the level of electricity prices can mitigate the effect of higher average tariffs on poorer households with access to electricity.49 In Gabon, the privately-owned electricity provider, Société d’énergie et d’eau du Gabon (SEEG), already offers lower “social tariff” for electricity consumption below a certain “social limit.” The lifeline tariffs could be reduced, with the government compensating the SEEG for the resulting losses, or with higher tariffs for larger-scale users. 50
• Water “social” tariff reductions. Similarly, existing lifeline tariffs for water provision by the SEEG could be reduced. A rural electrification campaign could further
48 See Gupta et al. (2003), for example.
49 The SEEG 2004 Annual Report suggests that SEEG power plants use diesel fuel, gas (butane), and fuel oil (fuel lourd).
50The WB PA reports SEEG electricity coverage as follows: 60 percent of all households directly connected; 20 percent use neighbor’s line; 3 percent use their own electricity generator. In urban areas, 93 percent of households use electricity for lighting, but only 35 percent of households in rural areas.

49
enhance the effectiveness of such targeted lifeline tariffs. Providing utilities free of charge to selected households for a limited period of time was implemented recently in Gabon—during the electoral campaign of late 2005, the government paid for the free provision of water and electricity for one month only to all households with a September electricity bill of less than CFAF 50,000.51
• Geographic targeting. Concentrating extra social expenditures on households living in the poorest rural areas can result in a much higher proportion of the expenditures reaching poor households. For example, savings from reducing the fuel price subsidies could be used to provide more funding for health centers and dispensaries in rural areas.52 User charges for education and health services can be reduced or eliminated in the poorest rural and urban areas. Public works programs—such as rural road network maintenance—can be temporarily expanded. Such programs not only protect household real incomes but can contribute to expanding the social human capital of poor households. Developing the economy’s stock of human capital can, in turn, contribute to stimulating growth in the non-oil economy.
Medium-term measures • The budgetary savings can also be used to expand investment in public
infrastructure, based on the priorities in the recently completed PRSP. The PRSP carefully assesses the incidence of poverty in Gabon using the 2005 EGEP survey and identifies pro-poor health and education development projects. In line with the PRSP priorities, savings from reducing the subsidies could be used to fund rural electrification campaigns and the greater provision of public transport. Expenditure informed by the PRSP can be expected to benefit the middle classes as well as poor households, which can help generate political support for the energy pricing reforms. In addition, investments in the transport and energy sectors could contribute to improving energy efficiency and thus reducing the vulnerability to oil price shocks.
• To allow businesses to adjust to higher energy costs, and to allow time to implement better targeted programs consistent with the PRSP, eliminating the subsidies gradually would be appropriate. In export-oriented industries, firms may be unable to pass-through the higher energy cost. Phasing the subsidies out over three to four years could allow such firms, e.g., those in the forestry sector, to catch up with the fuel-efficiency levels of competitive firms in countries without fuel price
51 Note that this temporary measure during the electoral campaign appears to have had a strong pro-rich bias. Analysis using the EGEP survey indicates that, of the total amount spent by the government on free utilities, 22 percent reached households in the top 10 percent of the population. Half of the total amount reached the top 30 percent of households. Meanwhile, households at the bottom 30 percent of the income distribution received only 15 percent of the free utilities subsidies.
52 For a detailed review of experiences with different targeting mechanisms, see Coady et al. (2005).
50
subsidies.53. However, there is an obvious trade-off in terms of lower budgetary savings. In addition, one might maintain kerosene (used for lighting) and butane (cooking gas) subsidies for a year or two while reducing subsidies on diesel and super gasoline. This could give time to develop better targeted programs. However, price differentials between kerosene and diesel should not be maintained over the medium term as the products are substitutes.
F. Conclusion
This paper evaluates the fiscal cost and social impact of fuel price subsidies in Gabon. The results suggest that the total fiscal cost of the implicit subsidies is likely to reach 3.2 percent and 4.5 percent of non-oil GDP in 2005 and 2006, respectively. These subsidies are not reported explicitly in the fiscal accounts but are instead netted against oil revenue. In addition, the fuel subsidies are strongly biased towards higher-income households. The top ten percent of the income distribution benefit from one-third of the total subsidy, while the bottom 30 percent of the distribution benefits from only 13 percent of the subsidy. The reform of fuel price subsidies in Gabon may therefore be necessary to release resources for critical social services for the poor, and to facilitate pro-poor economic growth. At the same time, increases in prices of basic commodities such as lighting kerosene and butane cooking gas may be associated with real income losses for the poor. Therefore, these effects need to be mitigated or eliminated by phasing out the subsidies gradually, and reorienting expenditure towards targeted programs and growth-enhancing infrastructure spending. The current period of strong economic growth could offer a useful window to mobilize support for a reduction in the fuel-price subsidy. Increasing transparency by reporting the subsidies in the 2006 supplementary budget, educating the public about the size and impact of the subsidies, and depoliticizing petroleum prices by using a pre-announced formula-based adjustment path, would further help to muster support for reform.
53 See Coady et al. (2006) for a discussion of formulae that can be used to smooth the price adjustment.
51
References
Chu, Ke-young, Sanjeev Gupta, Benedict Clements, Daniel Hewitt, Sergio Lugaresi, Jerald Schiff, Ludger Schuknecht, and Gerd Schwartz, 1995, Unproductive Public Expenditures: A Pragmatic Approach to Policy Analysis, IMF Pamphlet Series, No. 48 (Washington: International Monetary Fund).
Coady, David, Moataz El-Said, Robert Gillingham, Roland Kpodar, Paolo Medas, and David
Newhouse, 2006, “The Fiscal and Social Costs of Fuel Subsidies: Evidence from Bolivia, Jordan, Mali and Sri Lanka,” PSIA Review Paper, Fiscal Affairs Department (Washington: International Monetary Fund).
Coady, David, Margaret Grosh, and John Hoddinott, 2004, “Targeting of Transfers in
Developing Countries: Review of Lessons and Experiences,” Regional and Sector Studies Series (Washington: IFPRI and World Bank).
Coady, David, and David Newhouse, 2005, “Evaluation of the Distributional Impacts of
Petroleum Price Reforms in Ghana,” unpublished manuscript, Poverty and Social Impact Analysis Group, Fiscal Affairs Department (Washington: International Monetary Fund).
Gupta, Sanjeev, Benedict Clements, Kevin Fletcher, and Gabriela Inchauste, 2003, “Issues in
Domestic Petroleum Pricing in Oil-Producing Countries,” in Fiscal Policy Formulation and Implementation in Oil-Producing Countries ed. by Jeffrey Davis, Rolando Ossowski, and Annalise Fedelino (Washington: International Monetary Fund), pp. 383–415.
Gupta, Sanjeev, Marijn Verhoeven, Robert Gillingham, Christian Schiller, Ali Mansoor, and
Juan Pablo Cordoba, 2000, Equity and Efficiency in the Reform of Price Subsidies (Washington: International Monetary Fund). .
International Monetary Fund, 2005, “Republic of Yemen: 2004 Article IV Consultation—
Staff Report, Public Information Notice on the Executive Board Discussion; and Statement by the Executive Director for the Republic of Yemen,” Country Report No. 05/111 (Washington: International Monetary Fund).
Thornton, John, and Amine Mati, 2005, “Developments in Domestic Fuel Prices, Taxes and
Subsidies in Selected Countries,” Note to Management (unpublished), Fiscal Affairs Department (Washington: International Monetary Fund).
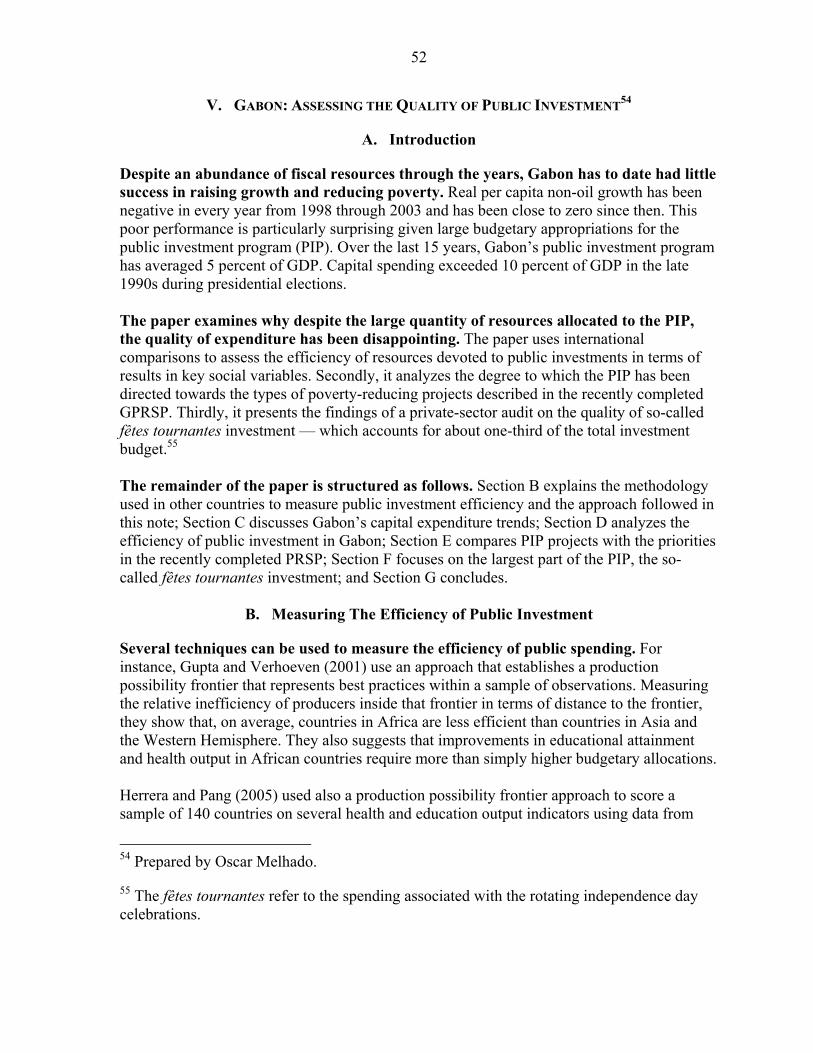
52
V. GABON: ASSESSING THE QUALITY OF PUBLIC INVESTMENT54
A. Introduction
Despite an abundance of fiscal resources through the years, Gabon has to date had little success in raising growth and reducing poverty. Real per capita non-oil growth has been negative in every year from 1998 through 2003 and has been close to zero since then. This poor performance is particularly surprising given large budgetary appropriations for the public investment program (PIP). Over the last 15 years, Gabon’s public investment program has averaged 5 percent of GDP. Capital spending exceeded 10 percent of GDP in the late 1990s during presidential elections. The paper examines why despite the large quantity of resources allocated to the PIP, the quality of expenditure has been disappointing. The paper uses international comparisons to assess the efficiency of resources devoted to public investments in terms of results in key social variables. Secondly, it analyzes the degree to which the PIP has been directed towards the types of poverty-reducing projects described in the recently completed GPRSP. Thirdly, it presents the findings of a private-sector audit on the quality of so-called fêtes tournantes investment — which accounts for about one-third of the total investment budget.55 The remainder of the paper is structured as follows. Section B explains the methodology used in other countries to measure public investment efficiency and the approach followed in this note; Section C discusses Gabon’s capital expenditure trends; Section D analyzes the efficiency of public investment in Gabon; Section E compares PIP projects with the priorities in the recently completed PRSP; Section F focuses on the largest part of the PIP, the so-called fêtes tournantes investment; and Section G concludes.
B. Measuring The Efficiency of Public Investment
Several techniques can be used to measure the efficiency of public spending. For instance, Gupta and Verhoeven (2001) use an approach that establishes a production possibility frontier that represents best practices within a sample of observations. Measuring the relative inefficiency of producers inside that frontier in terms of distance to the frontier, they show that, on average, countries in Africa are less efficient than countries in Asia and the Western Hemisphere. They also suggests that improvements in educational attainment and health output in African countries require more than simply higher budgetary allocations. Herrera and Pang (2005) used also a production possibility frontier approach to score a sample of 140 countries on several health and education output indicators using data from
54 Prepared by Oscar Melhado.
55 The fêtes tournantes refer to the spending associated with the rotating independence day celebrations.
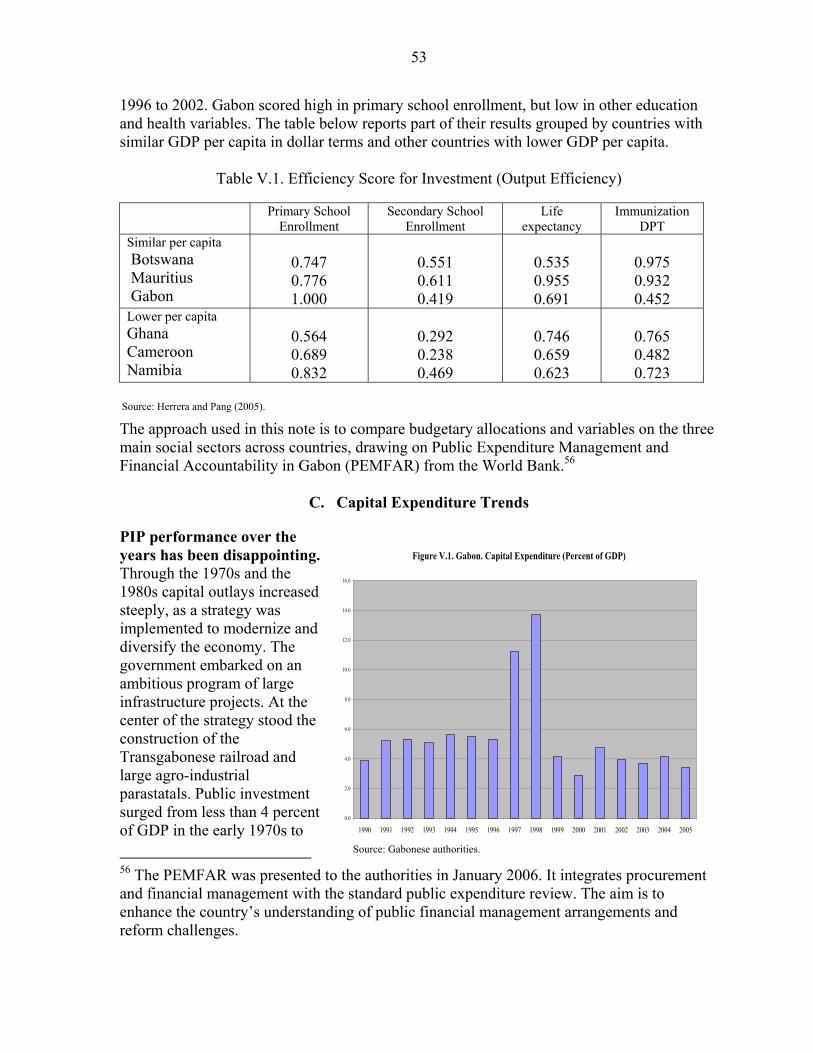
53
1996 to 2002. Gabon scored high in primary school enrollment, but low in other education and health variables. The table below reports part of their results grouped by countries with similar GDP per capita in dollar terms and other countries with lower GDP per capita.
Table V.1. Efficiency Score for Investment (Output Efficiency) Primary School
Enrollment Secondary School
Enrollment Life
expectancy Immunization
DPT Similar per capita Botswana Mauritius Gabon
0.747 0.776 1.000
0.551 0.611 0.419
0.535 0.955 0.691
0.975 0.932 0.452
Lower per capita Ghana Cameroon Namibia
0.564 0.689 0.832
0.292 0.238 0.469
0.746 0.659 0.623
0.765 0.482 0.723
The approach used in this note is to compare budgetary allocations and variables on the three main social sectors across countries, drawing on Public Expenditure Management and Financial Accountability in Gabon (PEMFAR) from the World Bank.56
C. Capital Expenditure Trends
PIP performance over the years has been disappointing. Through the 1970s and the 1980s capital outlays increased steeply, as a strategy was implemented to modernize and diversify the economy. The government embarked on an ambitious program of large infrastructure projects. At the center of the strategy stood the construction of the Transgabonese railroad and large agro-industrial parastatals. Public investment surged from less than 4 percent of GDP in the early 1970s to
56 The PEMFAR was presented to the authorities in January 2006. It integrates procurement and financial management with the standard public expenditure review. The aim is to enhance the country’s understanding of public financial management arrangements and reform challenges.
Figure V.1. Gabon. Capital Expenditure (Percent of GDP)
0.0
2.0
4.0
6.0
8.0
10.0
12.0
14.0
16.0
1990 1991 1992 1993 1994 1995 1996 1997 1998 1999 2000 2001 2002 2003 2004 2005
Source: Gabonese authorities.
Source: Herrera and Pang (2005).
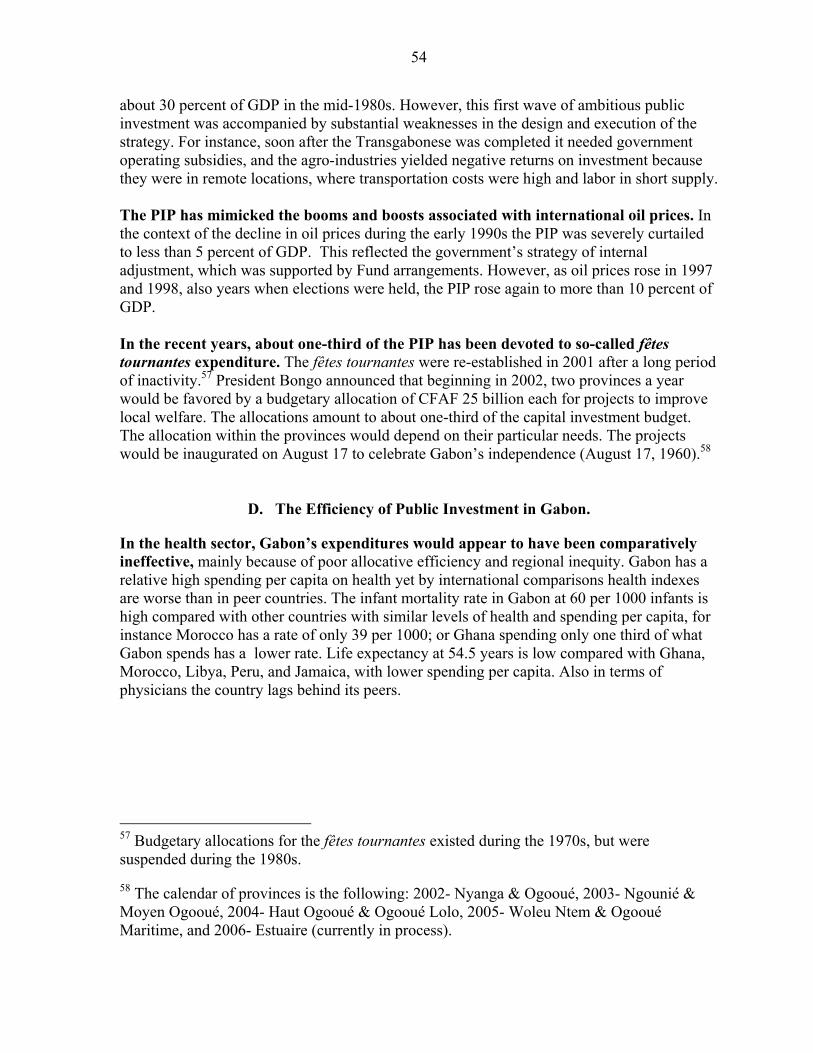
54
about 30 percent of GDP in the mid-1980s. However, this first wave of ambitious public investment was accompanied by substantial weaknesses in the design and execution of the strategy. For instance, soon after the Transgabonese was completed it needed government operating subsidies, and the agro-industries yielded negative returns on investment because they were in remote locations, where transportation costs were high and labor in short supply. The PIP has mimicked the booms and boosts associated with international oil prices. In the context of the decline in oil prices during the early 1990s the PIP was severely curtailed to less than 5 percent of GDP. This reflected the government’s strategy of internal adjustment, which was supported by Fund arrangements. However, as oil prices rose in 1997 and 1998, also years when elections were held, the PIP rose again to more than 10 percent of GDP. In the recent years, about one-third of the PIP has been devoted to so-called fêtes tournantes expenditure. The fêtes tournantes were re-established in 2001 after a long period of inactivity.57 President Bongo announced that beginning in 2002, two provinces a year would be favored by a budgetary allocation of CFAF 25 billion each for projects to improve local welfare. The allocations amount to about one-third of the capital investment budget. The allocation within the provinces would depend on their particular needs. The projects would be inaugurated on August 17 to celebrate Gabon’s independence (August 17, 1960).58
D. The Efficiency of Public Investment in Gabon.
In the health sector, Gabon’s expenditures would appear to have been comparatively ineffective, mainly because of poor allocative efficiency and regional inequity. Gabon has a relative high spending per capita on health yet by international comparisons health indexes are worse than in peer countries. The infant mortality rate in Gabon at 60 per 1000 infants is high compared with other countries with similar levels of health and spending per capita, for instance Morocco has a rate of only 39 per 1000; or Ghana spending only one third of what Gabon spends has a lower rate. Life expectancy at 54.5 years is low compared with Ghana, Morocco, Libya, Peru, and Jamaica, with lower spending per capita. Also in terms of physicians the country lags behind its peers.
57 Budgetary allocations for the fêtes tournantes existed during the 1970s, but were suspended during the 1980s.
58 The calendar of provinces is the following: 2002- Nyanga & Ogooué, 2003- Ngounié & Moyen Ogooué, 2004- Haut Ogooué & Ogooué Lolo, 2005- Woleu Ntem & Ogooué Maritime, and 2006- Estuaire (currently in process).
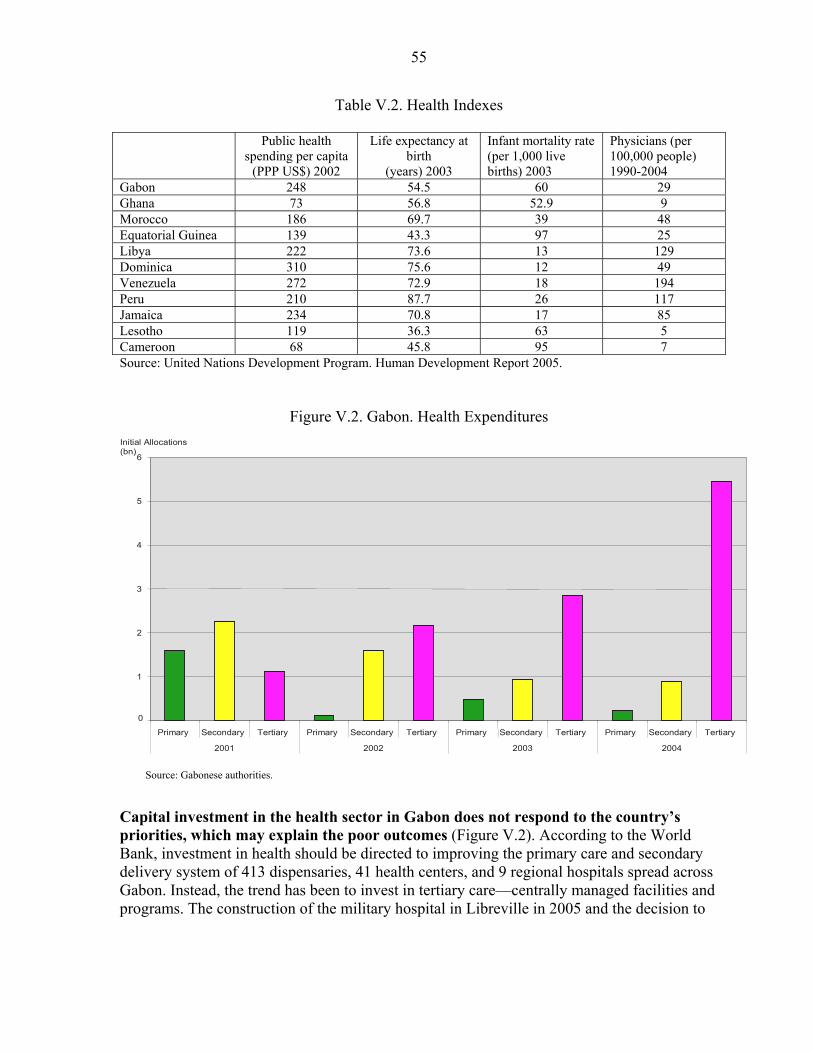
55
Table V.2. Health Indexes Public health
spending per capita (PPP US$) 2002
Life expectancy at birth
(years) 2003
Infant mortality rate (per 1,000 live births) 2003
Physicians (per 100,000 people) 1990-2004
Gabon 248 54.5 60 29 Ghana 73 56.8 52.9 9 Morocco 186 69.7 39 48 Equatorial Guinea 139 43.3 97 25 Libya 222 73.6 13 129 Dominica 310 75.6 12 49 Venezuela 272 72.9 18 194 Peru 210 87.7 26 117 Jamaica 234 70.8 17 85 Lesotho 119 36.3 63 5 Cameroon 68 45.8 95 7 Source: United Nations Development Program. Human Development Report 2005.
Figure V.2. Gabon. Health Expenditures
0
1
2
3
4
5
6
Primary Secondary Tertiary Primary Secondary Tertiary Primary Secondary Tertiary Primary Secondary Tertiary
2001 2002 2003 2004
Initial Allocations (bn)
Financial Year
Capital investment in the health sector in Gabon does not respond to the country’s priorities, which may explain the poor outcomes (Figure V.2). According to the World Bank, investment in health should be directed to improving the primary care and secondary delivery system of 413 dispensaries, 41 health centers, and 9 regional hospitals spread across Gabon. Instead, the trend has been to invest in tertiary care—centrally managed facilities and programs. The construction of the military hospital in Libreville in 2005 and the decision to
Source: Gabonese authorities.
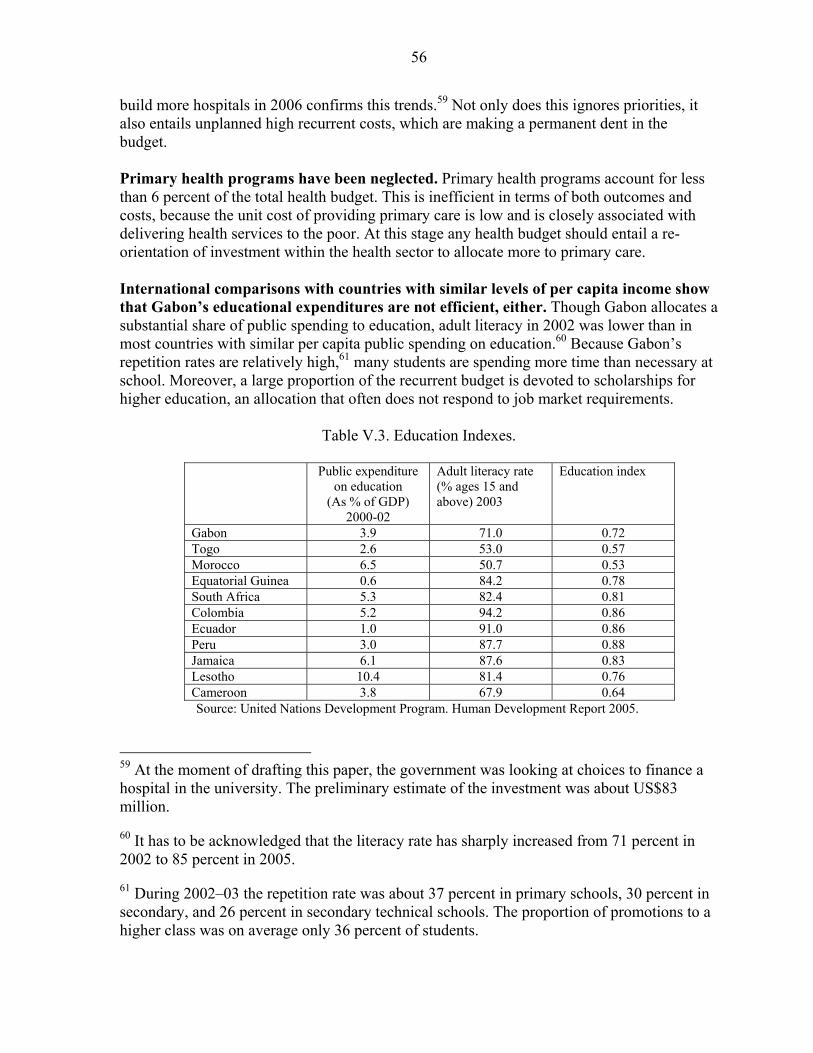
56
build more hospitals in 2006 confirms this trends.59 Not only does this ignores priorities, it also entails unplanned high recurrent costs, which are making a permanent dent in the budget. Primary health programs have been neglected. Primary health programs account for less than 6 percent of the total health budget. This is inefficient in terms of both outcomes and costs, because the unit cost of providing primary care is low and is closely associated with delivering health services to the poor. At this stage any health budget should entail a re-orientation of investment within the health sector to allocate more to primary care. International comparisons with countries with similar levels of per capita income show that Gabon’s educational expenditures are not efficient, either. Though Gabon allocates a substantial share of public spending to education, adult literacy in 2002 was lower than in most countries with similar per capita public spending on education.60 Because Gabon’s repetition rates are relatively high,61 many students are spending more time than necessary at school. Moreover, a large proportion of the recurrent budget is devoted to scholarships for higher education, an allocation that often does not respond to job market requirements.
Table V.3. Education Indexes.
Public expenditure on education
(As % of GDP) 2000-02
Adult literacy rate (% ages 15 and above) 2003
Education index
Gabon 3.9 71.0 0.72 Togo 2.6 53.0 0.57 Morocco 6.5 50.7 0.53 Equatorial Guinea 0.6 84.2 0.78 South Africa 5.3 82.4 0.81 Colombia 5.2 94.2 0.86 Ecuador 1.0 91.0 0.86 Peru 3.0 87.7 0.88 Jamaica 6.1 87.6 0.83 Lesotho 10.4 81.4 0.76 Cameroon 3.8 67.9 0.64
Source: United Nations Development Program. Human Development Report 2005. 59 At the moment of drafting this paper, the government was looking at choices to finance a hospital in the university. The preliminary estimate of the investment was about US$83 million.
60 It has to be acknowledged that the literacy rate has sharply increased from 71 percent in 2002 to 85 percent in 2005.
61 During 2002–03 the repetition rate was about 37 percent in primary schools, 30 percent in secondary, and 26 percent in secondary technical schools. The proportion of promotions to a higher class was on average only 36 percent of students.

57
As with health, the problems of educational performance in Gabon reflect the bias of education expenditures towards the secondary and tertiary levels. In 2002–04 about 70 percent of the investment budget went to secondary and tertiary education. While investment in tertiary education increased by 233 percent for the period, investment in primary education only increased by 29 percent. This is inefficient; it is cheaper to educate a child in primary school than in secondary or tertiary establishments. Moreover, much of the current spending in education is allocated to scholarships for secondary and higher education, and in particular foreign scholarships. For infrastructure, the budgeted allocations have not achieved the desired results. Investment in infrastructure is affected by at least three key problems: (i) poor project evaluation, which usually means unrealistic budgetary allocations; (ii) high construction costs—roads have cost more than twice as much as originally planned; and (iii) poor maintenance, which means that the road network continuously deteriorates. The road fund intended for maintenance has been used to finance large-scale construction and rehabilitation projects. The road sector has incurred large debts and some projects were discontinued after substantial spending.
E. Public Investment Versus PRSP Priorities
How efficient has the PIP been in achieving GPRSP objectives in health, education, and infrastructure? The primary objectives established in the GPRSP are as follows: (i) reduce unemployment, (ii) stop the decline of the rural economy, (iii) improve access to basic social services, (iv) revitalize social protection nets, (v) improve the livelihoods of the poor, (vi) promote gender integration, and (vii) improve governance. Assessing past spending in light of current GPRSP priorities is complicated by the lack of a functional classification of public expenditure. Currently, the budget is presented in administrative form, allocating by spending ministries rather than by function. The PEMFAR, however, offers a proxy for functional classification by categorizing administrative spending according to the major government functions. 62 Public spending in Gabon is not being effectively directed towards the government’s objectives emerging from the GPRSP process. Based on the PEMFAR, it could be concluded that there are no clear shift towards GPRSP priorities. Expenditures in education and the health sectors have remained relatively static. Notably, education declined from 23 percent to 21 percent of public expenditure, between 1999 and 2003. 62 This estimation includes current and capital spending and excludes debt payments and the fêtes tournantes, which could not be easily associated with particular functions.
58
F. The Quality of Fêtes Tournantes Public Investment
The quality of the fêtes tournantes investment is low. Maintenance is often poor, as recurrent costs have not been budgeted for and the social return of many of these projects appears to be zero or even negative. In addition, it distorts the PIP by using one-third of the resources on projects with no clear priorities and appropriate appraisal. The fêtes tournantes’ mechanism involves a national commission approving the project proposals of regional committees. These committees select projects in consultation with the communities; no separate project appraisal is done. Once the regional committee makes a proposal, a technical committee is in charge of allocating and monitoring the spending. A recent private-sector audit of the 2002–03 fêtes tournantes revealed the following problems:63 Poor project documentation. More than 50 percent of the projects have no documentation supporting financial transactions. For those that do, the auditor ranked the quality of documentation, setting 15 as the maximum grade. The mean over 202 operations evaluated was only 2.3. Only seven operations received a grade higher than 7. Weak programming. There are many unfinished projects or projects that have failed, leaving empty buildings. This reflects serious weaknesses in project planning. No appraisal evaluation is done. Variable project quality. While the sewage work appears to be done properly, the quality of buildings and houses is poor and many residential and commercial systems malfunction. Some buildings are unusable. Costs have been high. The audit found ample evidence of overcharging. Often prices charged are twice as much as current prices. The cost of a project in Gabon was higher than that of a comparable project in neighboring countries. Weak quality control. Lack of ex-ante and ex-post evaluation is compounded by absence of technicians in the technical commissions in charge of control.
G. Conclusions
The PIP needs a severe makeover. The current system is undermining Gabon’s goals of alleviating poverty and stimulating growth. An overhaul of the public investment system is needed to support the GPRSP strategy recently presented.
63 The audit, conducted by the firm 2AC, was presented in November 2005; however, it has not been published.
59
The quality of public investment has been low. It has been inefficient and it is inconsistent with the priorities emerging from the GPRSP. The poor results of the fêtes tournantes and the fact that it is managed outside the circuit of the investment budget further weaken PIP performance. In the context of the PRSP and the current oil windfalls, improving public expenditure management is critical to raising the quality of public spending. The authorities need to take a number of steps highlighted in the recently completed fiscal ROSC and the PEMFAR. These measures include: (i) introduce a full functional classification of expenditure to allow better tracking of expenditure, including against the priorities established in the PRSP; (ii) strengthen the investment budget preparation and execution process by heightening the role of the three-year public investment program; (iii) improve the coordination between the current and investment budgets and, over time, integrate them in a single consistent medium-term expenditure framework; (iv) strengthen further the role of the public tender office to reinforce ex-ante quality control; and (v) eliminate the Fêtes Tournantes. It is essential that for the 2007 budget the fêtes tournantes are folded into the PIP. All the resources should be available for the PIP and consistent with the PRSP priorities.
60
References
Groupe 2 AC, 2005. “Audit technique et financier des projets financés par le Fonds pour le 17 août (exercices 2002 et 2003),” (November), mimeo.
Gupta, Sanjeev, and Martij Verhoeven, 2001, “The Efficiency of Government Expenditure,
Experiences from Africa,” Journal of Policy Modeling, Vol. 23, pp. 433–67.
Santiago, Herrera, and Gaobo Pang, 2005, “Efficiency of Public Spending in Developing Countries: An Efficiency Frontier Approach,” World Bank Policy Research Working Paper No. 3645 (Washington: World Bank).
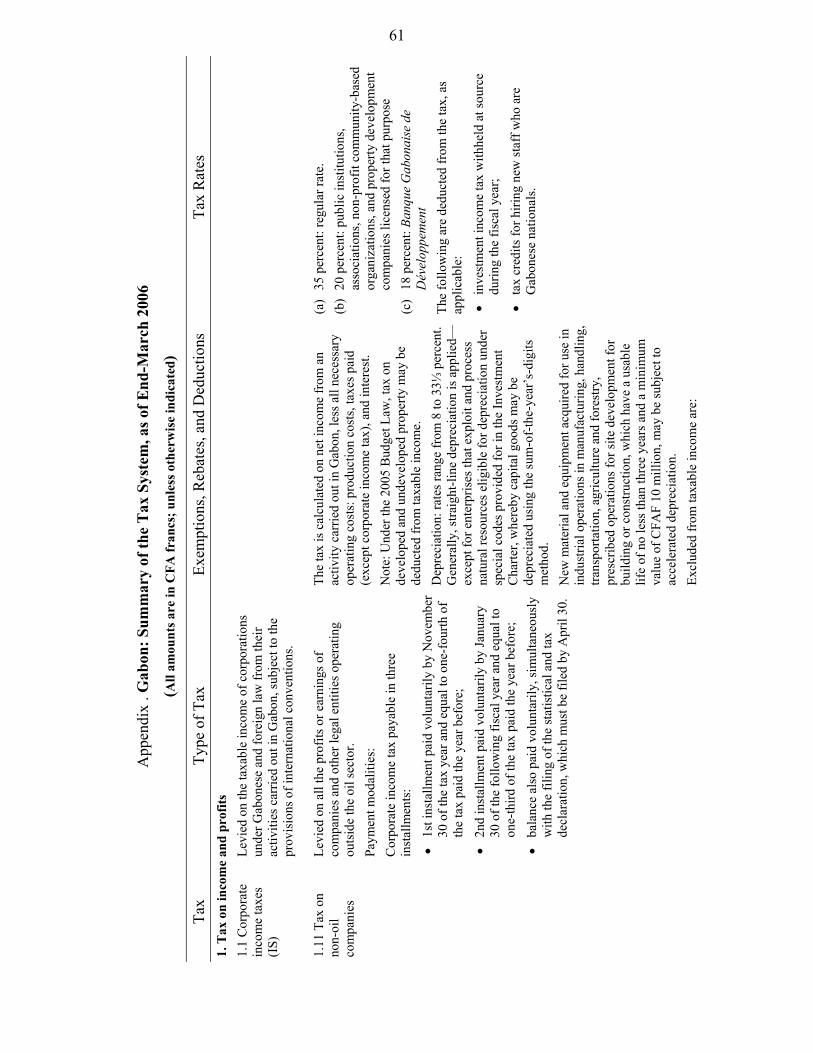
61
A
ppen
dix
. Gab
on: S
umm
ary
of th
e T
ax S
yste
m, a
s of E
nd-M
arch
200
6
(All
amou
nts a
re in
CFA
fran
cs; u
nles
s oth
erw
ise
indi
cate
d)
Tax
Type
of T
ax
Exem
ptio
ns, R
ebat
es, a
nd D
educ
tions
Ta
x R
ates
1.
Tax
on
inco
me
and
prof
its
1.1
Cor
pora
te
inco
me
taxe
s (I
S)
Levi
ed o
n th
e ta
xabl
e in
com
e of
cor
pora
tions
un
der G
abon
ese
and
fore
ign
law
from
thei
r ac
tiviti
es c
arrie
d ou
t in
Gab
on, s
ubje
ct to
the
prov
isio
ns o
f int
erna
tiona
l con
vent
ions
.
1.11
Tax
on
non-
oil
com
pani
es
Levi
ed o
n al
l the
pro
fits o
r ear
ning
s of
com
pani
es a
nd o
ther
lega
l ent
ities
ope
ratin
g ou
tsid
e th
e oi
l sec
tor.
Paym
ent m
odal
ities
: C
orpo
rate
inco
me
tax
paya
ble
in th
ree
inst
allm
ents
: •
1st i
nsta
llmen
t pai
d vo
lunt
arily
by
Nov
embe
r 30
of t
he ta
x ye
ar a
nd e
qual
to o
ne-f
ourth
of
the
tax
paid
the
year
bef
ore;
•
2nd
inst
allm
ent p
aid
volu
ntar
ily b
y Ja
nuar
y 30
of t
he fo
llow
ing
fisca
l yea
r and
equ
al to
on
e-th
ird o
f the
tax
paid
the
year
bef
ore;
•
bala
nce
also
pai
d vo
lunt
arily
, sim
ulta
neou
sly
with
the
filin
g of
the
stat
istic
al a
nd ta
x de
clar
atio
n, w
hich
mus
t be
filed
by
Apr
il 30
.
The
tax
is c
alcu
late
d on
net
inco
me
from
an
activ
ity c
arrie
d ou
t in
Gab
on, l
ess a
ll ne
cess
ary
oper
atin
g co
sts:
pro
duct
ion
cost
s, ta
xes p
aid
(exc
ept c
orpo
rate
inco
me
tax)
, and
inte
rest
. N
ote:
Und
er th
e 20
05 B
udge
t Law
, tax
on
deve
lope
d an
d un
deve
lope
d pr
oper
ty m
ay b
e de
duct
ed fr
om ta
xabl
e in
com
e.
D
epre
ciat
ion:
rate
s ran
ge fr
om 8
to 3
3⅓ p
erce
nt.
Gen
eral
ly, s
traig
ht-li
ne d
epre
ciat
ion
is a
pplie
d—ex
cept
for e
nter
pris
es th
at e
xplo
it an
d pr
oces
s na
tura
l res
ourc
es e
ligib
le fo
r dep
reci
atio
n un
der
spec
ial c
odes
pro
vide
d fo
r in
the
Inve
stm
ent
Cha
rter,
whe
reby
cap
ital g
oods
may
be
depr
ecia
ted
usin
g th
e su
m-o
f-th
e-ye
ar’s
-dig
its
met
hod.
N
ew m
ater
ial a
nd e
quip
men
t acq
uire
d fo
r use
in
indu
stria
l ope
ratio
ns in
man
ufac
turin
g, h
andl
ing,
tra
nspo
rtatio
n, a
gric
ultu
re a
nd fo
rest
ry,
pres
crib
ed o
pera
tions
for s
ite d
evel
opm
ent f
or
build
ing
or c
onst
ruct
ion,
whi
ch h
ave
a us
able
lif
e of
no
less
than
thre
e ye
ars a
nd a
min
imum
va
lue
of C
FAF
10 m
illio
n, m
ay b
e su
bjec
t to
acce
lera
ted
depr
ecia
tion.
Ex
clud
ed fr
om ta
xabl
e in
com
e ar
e:
(a)
35 p
erce
nt: r
egul
ar ra
te.
(b)
20 p
erce
nt: p
ublic
inst
itutio
ns,
asso
ciat
ions
, non
-pro
fit c
omm
unity
-bas
ed
orga
niza
tions
, and
pro
perty
dev
elop
men
t co
mpa
nies
lice
nsed
for t
hat p
urpo
se
(c)
18 p
erce
nt: B
anqu
e G
abon
aise
de
Dév
elop
pem
ent
The
follo
win
g ar
e de
duct
ed fr
om th
e ta
x, a
s ap
plic
able
: •
inve
stm
ent i
ncom
e ta
x w
ithhe
ld a
t sou
rce
durin
g th
e fis
cal y
ear;
• ta
x cr
edits
for h
iring
new
staf
f who
are
G
abon
ese
natio
nals
.
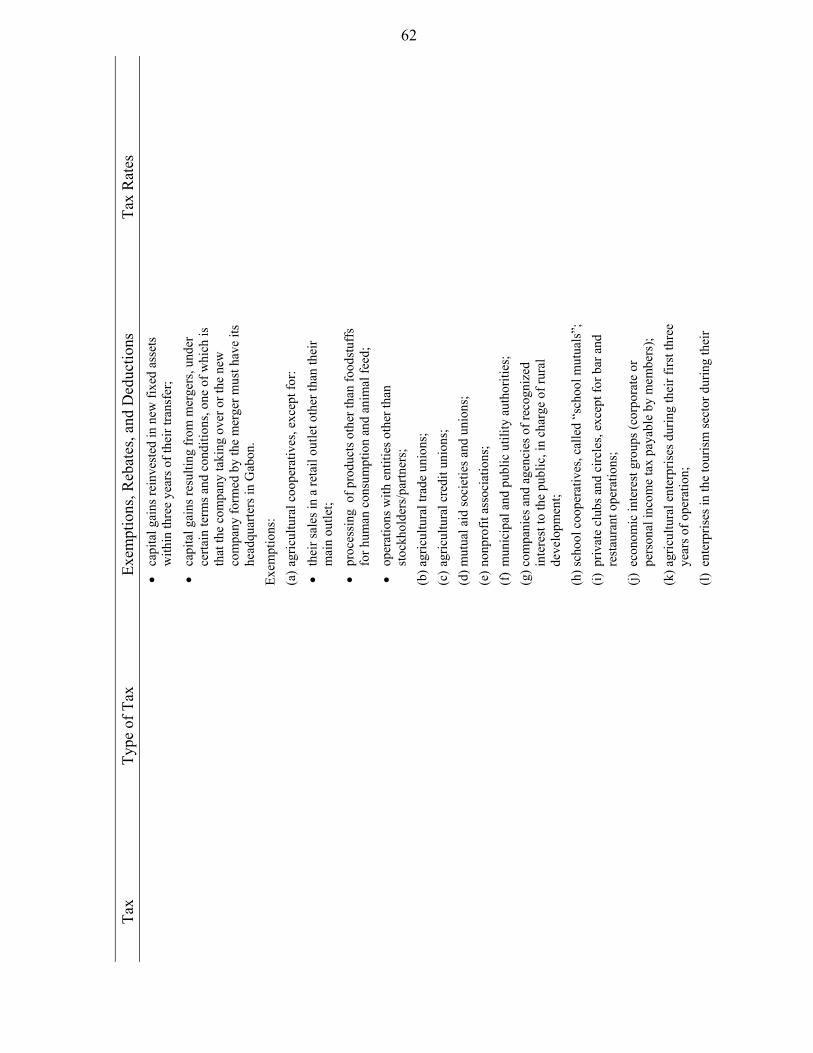
62
Tax
Type
of T
ax
Exem
ptio
ns, R
ebat
es, a
nd D
educ
tions
Ta
x R
ates
•
capi
tal g
ains
rein
vest
ed in
new
fixe
d as
sets
w
ithin
thre
e ye
ars o
f the
ir tra
nsfe
r; •
capi
tal g
ains
resu
lting
from
mer
gers
, und
er
certa
in te
rms a
nd c
ondi
tions
, one
of w
hich
is
that
the
com
pany
taki
ng o
ver o
r the
new
co
mpa
ny fo
rmed
by
the
mer
ger m
ust h
ave
its
head
quar
ters
in G
abon
. Ex
empt
ions
: (a
) agr
icul
tura
l coo
pera
tives
, exc
ept f
or:
• th
eir s
ales
in a
reta
il ou
tlet o
ther
than
thei
r m
ain
outle
t; •
proc
essi
ng o
f pro
duct
s oth
er th
an fo
odst
uffs
fo
r hum
an c
onsu
mpt
ion
and
anim
al fe
ed;
• op
erat
ions
with
ent
ities
oth
er th
an
stoc
khol
ders
/par
tner
s;
(b) a
gric
ultu
ral t
rade
uni
ons;
(c
) agr
icul
tura
l cre
dit u
nion
s;
(d) m
utua
l aid
soci
etie
s and
uni
ons;
(e
) non
prof
it as
soci
atio
ns;
(f)
mun
icip
al a
nd p
ublic
util
ity a
utho
ritie
s;
(g) c
ompa
nies
and
age
ncie
s of r
ecog
nize
d in
tere
st to
the
publ
ic, i
n ch
arge
of r
ural
de
velo
pmen
t; (h
) sch
ool c
oope
rativ
es, c
alle
d “s
choo
l mut
uals
”;(i)
priv
ate
club
s and
circ
les,
exce
pt fo
r bar
and
re
stau
rant
ope
ratio
ns;
(j) e
cono
mic
inte
rest
gro
ups (
corp
orat
e or
pe
rson
al in
com
e ta
x pa
yabl
e by
mem
bers
); (k
) agr
icul
tura
l ent
erpr
ises
dur
ing
thei
r firs
t thr
ee
year
s of o
pera
tion;
(l)
ent
erpr
ises
in th
e to
uris
m se
ctor
dur
ing
thei
r
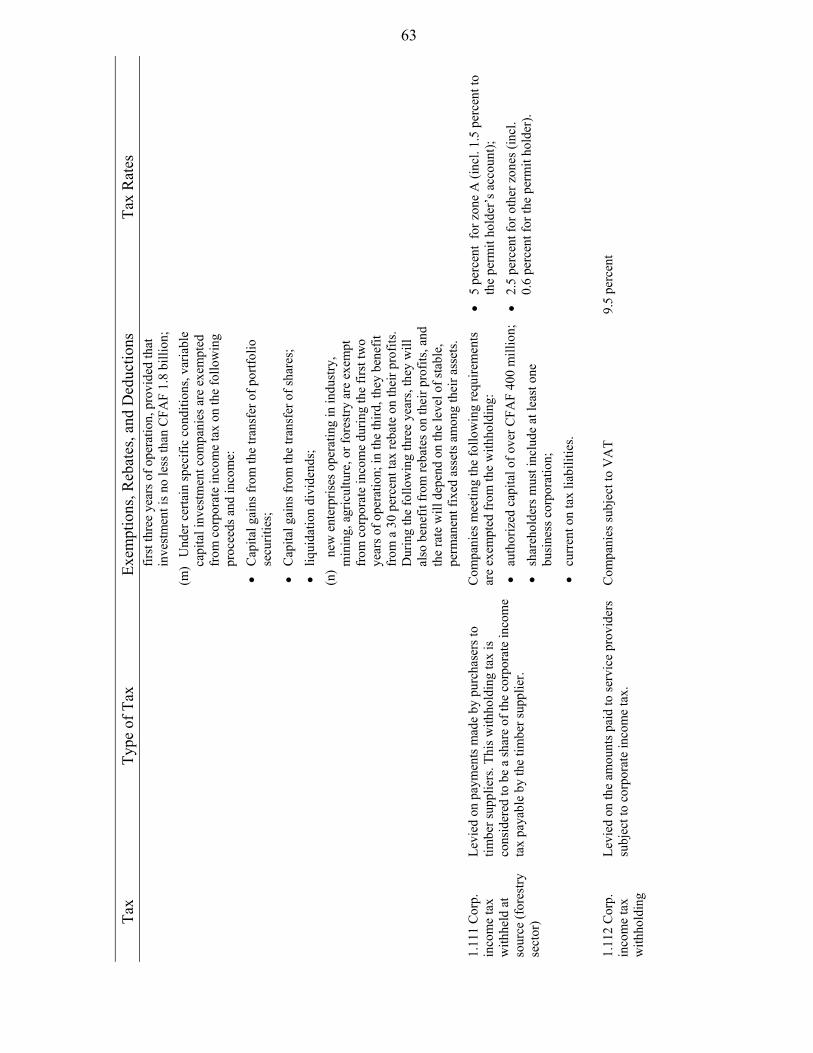
63
Tax
Type
of T
ax
Exem
ptio
ns, R
ebat
es, a
nd D
educ
tions
Ta
x R
ates
fir
st th
ree
year
s of o
pera
tion,
pro
vide
d th
at
inve
stm
ent i
s no
less
than
CFA
F 1.
8 bi
llion
; (m
) U
nder
cer
tain
spec
ific
cond
ition
s, va
riabl
e ca
pita
l inv
estm
ent c
ompa
nies
are
exe
mpt
ed
from
cor
pora
te in
com
e ta
x on
the
follo
win
g pr
ocee
ds a
nd in
com
e:
• C
apita
l gai
ns fr
om th
e tra
nsfe
r of p
ortfo
lio
secu
ritie
s;
• C
apita
l gai
ns fr
om th
e tra
nsfe
r of s
hare
s;
• liq
uida
tion
divi
dend
s;
(n)
new
ent
erpr
ises
ope
ratin
g in
indu
stry
, m
inin
g, a
gric
ultu
re, o
r for
estry
are
exe
mpt
fr
om c
orpo
rate
inco
me
durin
g th
e fir
st tw
o ye
ars o
f ope
ratio
n; in
the
third
, the
y be
nefit
fr
om a
30
perc
ent t
ax re
bate
on
thei
r pro
fits.
Dur
ing
the
follo
win
g th
ree
year
s, th
ey w
ill
also
ben
efit
from
reba
tes o
n th
eir p
rofit
s, an
d th
e ra
te w
ill d
epen
d on
the
leve
l of s
tabl
e,
perm
anen
t fix
ed a
sset
s am
ong
thei
r ass
ets.
1.11
1 C
orp.
in
com
e ta
x w
ithhe
ld a
t so
urce
(for
estry
se
ctor
)
Levi
ed o
n pa
ymen
ts m
ade
by p
urch
aser
s to
timbe
r sup
plie
rs. T
his w
ithho
ldin
g ta
x is
co
nsid
ered
to b
e a
shar
e of
the
corp
orat
e in
com
e ta
x pa
yabl
e by
the
timbe
r sup
plie
r.
Com
pani
es m
eetin
g th
e fo
llow
ing
requ
irem
ents
ar
e ex
empt
ed fr
om th
e w
ithho
ldin
g:
• au
thor
ized
cap
ital o
f ove
r CFA
F 40
0 m
illio
n;•
shar
ehol
ders
mus
t inc
lude
at l
east
one
bu
sine
ss c
orpo
ratio
n;
• cu
rren
t on
tax
liabi
litie
s.
• 5
perc
ent
for z
one
A (i
ncl.
1.5
perc
ent t
o th
e pe
rmit
hold
er’s
acc
ount
); •
2.5
perc
ent f
or o
ther
zon
es (i
ncl.
0.6
perc
ent f
or th
e pe
rmit
hold
er).
1.11
2 C
orp.
in
com
e ta
x w
ithho
ldin
g
Levi
ed o
n th
e am
ount
s pai
d to
serv
ice
prov
ider
s su
bjec
t to
corp
orat
e in
com
e ta
x.
Com
pani
es su
bjec
t to
VA
T
9.5
perc
ent

64
Tax
Type
of T
ax
Exem
ptio
ns, R
ebat
es, a
nd D
educ
tions
Ta
x R
ates
1.
113
Taxa
tion
of h
ead
offic
es
Hea
d of
fices
est
ablis
hed
as jo
int-s
tock
co
mpa
nies
or b
ranc
hes p
rovi
ding
exe
cutiv
e,
man
agem
ent,
or su
perv
isor
y se
rvic
es e
xclu
sive
ly
to c
ompa
nies
in th
e gr
oup
to w
hich
they
bel
ong
are
subj
ect t
o co
rpor
ate
inco
me
tax
unde
r spe
cial
te
rms:
the
corp
orat
e in
com
e ta
x ba
se is
ca
lcul
ated
at a
flat
rate
of 5
-12
perc
ent
dete
rmin
ed b
y th
e fin
ance
min
istry
and
app
lied
to o
pera
ting
cost
s.
Non
-nat
iona
ls w
orki
ng a
t hea
d of
fices
und
er
certa
in c
ondi
tions
ben
efit
from
a 5
0-pe
rcen
t re
bate
on
thei
r pre
-tax
inco
me,
in a
ccor
danc
e w
ith th
e te
rms o
f ord
inar
y la
w g
over
ning
pe
rson
al in
com
e ta
x
35 p
erce
nt
1.11
4 M
inim
um
flat t
ax o
n co
rpor
atio
ns
Levi
ed o
n al
l com
pani
es su
bjec
t to
corp
orat
e in
com
e ta
x w
hen
the
tax
char
geab
le to
them
is
low
er th
an th
e m
inim
um le
vy. I
n lo
ss y
ears
, the
m
inim
um le
vy is
ded
uctib
le in
third
s fro
m th
e co
rpor
ate
inco
me
tax
of su
bseq
uent
pro
fit y
ears
, ov
er a
per
iod
of th
ree
year
s.
The
follo
win
g ar
e ex
empt
from
the
min
imum
fla
t tax
: (a
) co
mpa
nies
ben
efiti
ng fr
om a
pre
fere
ntia
l tax
re
gim
e un
der a
hea
dqua
rters
agr
eem
ent o
r a
tax
regi
me
stab
ilize
d by
the
Inve
stm
ent
Cha
rter;
(b)
insu
ranc
e co
mpa
nies
ope
ratin
g in
a c
o-in
sura
nce
pool
in th
e se
a tra
nspo
rt an
d fir
e ha
zard
sect
ors,
with
a m
axim
um a
utho
rized
tu
rnov
er o
f CFA
F 3
mill
ion;
(c
) ne
w c
ompa
nies
in th
eir f
irst t
wo
year
s of
oper
atio
n;
(d)
priv
ate
and
publ
ic w
orks
com
pani
es w
ith
only
one
con
stru
ctio
n or
ass
embl
y pr
ojec
t in
Gab
on, i
f the
y ar
e pr
esen
t in
the
coun
try fo
r no
mor
e th
an th
ree
cons
ecut
ive
year
s;
(e)
com
pani
es o
pera
ting
in th
e ag
ricul
tura
l se
ctor
, exc
ludi
ng fo
rest
ry;
(f)
com
pani
es su
bjec
t to
the
min
ing
code
; (g
) en
terp
rises
in th
e to
uris
m se
ctor
dur
ing
thei
r fir
st 1
0 ye
ars o
f ope
ratio
n.
1.10
per
cent
(with
a m
inim
um o
f CFA
F 60
0,00
0) a
pplie
d to
the
over
all t
urno
ver f
or th
e pr
evio
us y
ear l
ess:
•
25 p
erce
nt fo
r pur
chas
e an
d re
sale
op
erat
ions
; •
10 p
erce
nt fo
r pro
duct
ion
oper
atio
ns;
• tru
ckin
g co
sts f
or lo
gger
s
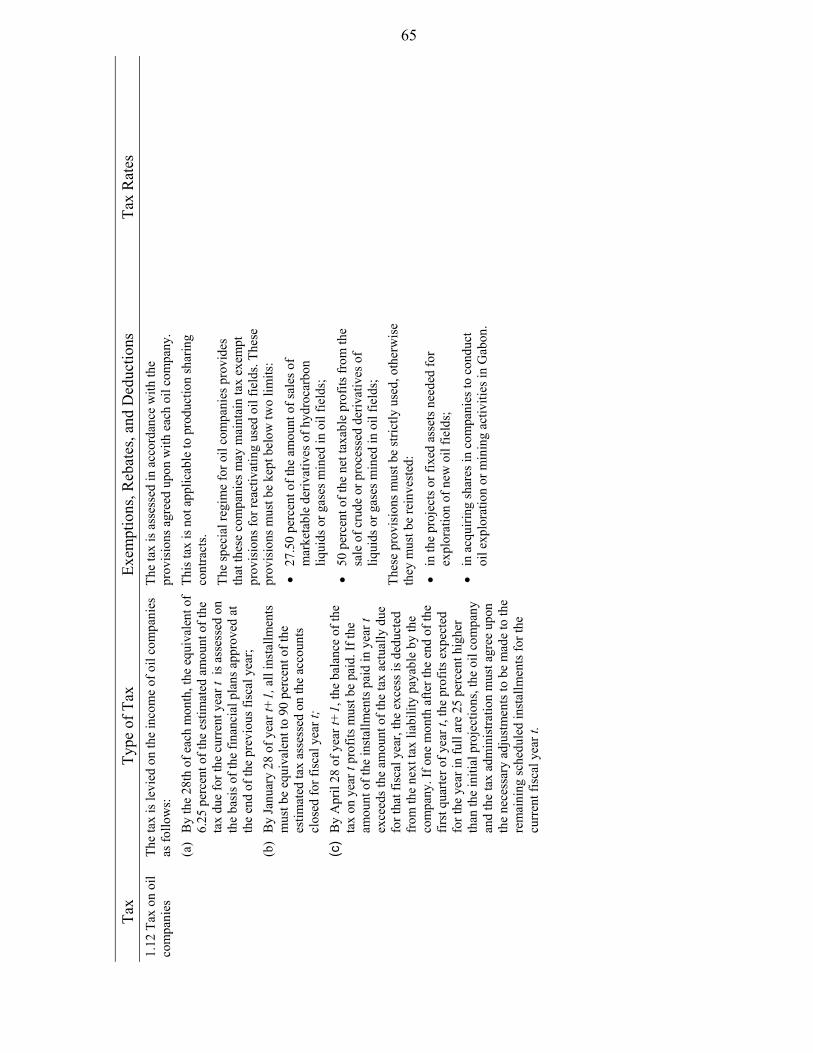
65
Tax
Type
of T
ax
Exem
ptio
ns, R
ebat
es, a
nd D
educ
tions
Ta
x R
ates
1.
12 T
ax o
n oi
l co
mpa
nies
Th
e ta
x is
levi
ed o
n th
e in
com
e of
oil
com
pani
es
as fo
llow
s:
(a)
By
the
28th
of e
ach
mon
th, t
he e
quiv
alen
t of
6.25
per
cent
of t
he e
stim
ated
am
ount
of t
he
tax
due
for t
he c
urre
nt y
ear t
is a
sses
sed
on
the
basi
s of t
he fi
nanc
ial p
lans
app
rove
d at
th
e en
d of
the
prev
ious
fisc
al y
ear;
(b)
By
Janu
ary
28 o
f yea
r t+
1, a
ll in
stal
lmen
ts
mus
t be
equi
vale
nt to
90
perc
ent o
f the
es
timat
ed ta
x as
sess
ed o
n th
e ac
coun
ts
clos
ed fo
r fis
cal y
ear t
; (c
) B
y A
pril
28 o
f yea
r t+
1, th
e ba
lanc
e of
the
tax
on y
ear t
pro
fits m
ust b
e pa
id. I
f the
am
ount
of t
he in
stal
lmen
ts p
aid
in y
ear t
ex
ceed
s the
am
ount
of t
he ta
x ac
tual
ly d
ue
for t
hat f
isca
l yea
r, th
e ex
cess
is d
educ
ted
from
the
next
tax
liabi
lity
paya
ble
by th
e co
mpa
ny. I
f one
mon
th a
fter t
he e
nd o
f the
fir
st q
uarte
r of y
ear t
, the
pro
fits e
xpec
ted
for t
he y
ear i
n fu
ll ar
e 25
per
cent
hig
her
than
the
initi
al p
roje
ctio
ns, t
he o
il co
mpa
ny
and
the
tax
adm
inis
tratio
n m
ust a
gree
upo
n th
e ne
cess
ary
adju
stm
ents
to b
e m
ade
to th
e re
mai
ning
sche
dule
d in
stal
lmen
ts fo
r the
cu
rren
t fis
cal y
ear t
.
The
tax
is a
sses
sed
in a
ccor
danc
e w
ith th
e pr
ovis
ions
agr
eed
upon
with
eac
h oi
l com
pany
. Th
is ta
x is
not
app
licab
le to
pro
duct
ion
shar
ing
cont
ract
s. Th
e sp
ecia
l reg
ime
for o
il co
mpa
nies
pro
vide
s th
at th
ese
com
pani
es m
ay m
aint
ain
tax
exem
pt
prov
isio
ns fo
r rea
ctiv
atin
g us
ed o
il fie
lds.
Thes
e pr
ovis
ions
mus
t be
kept
bel
ow tw
o lim
its:
• 27
.50
perc
ent o
f the
am
ount
of s
ales
of
mar
keta
ble
deriv
ativ
es o
f hyd
roca
rbon
liq
uids
or g
ases
min
ed in
oil
field
s;
• 50
per
cent
of t
he n
et ta
xabl
e pr
ofits
from
the
sale
of c
rude
or p
roce
ssed
der
ivat
ives
of
liqui
ds o
r gas
es m
ined
in o
il fie
lds;
Th
ese
prov
isio
ns m
ust b
e st
rictly
use
d, o
ther
wis
e th
ey m
ust b
e re
inve
sted
: •
in th
e pr
ojec
ts o
r fix
ed a
sset
s nee
ded
for
expl
orat
ion
of n
ew o
il fie
lds;
•
in a
cqui
ring
shar
es in
com
pani
es to
con
duct
oi
l exp
lora
tion
or m
inin
g ac
tiviti
es in
Gab
on.
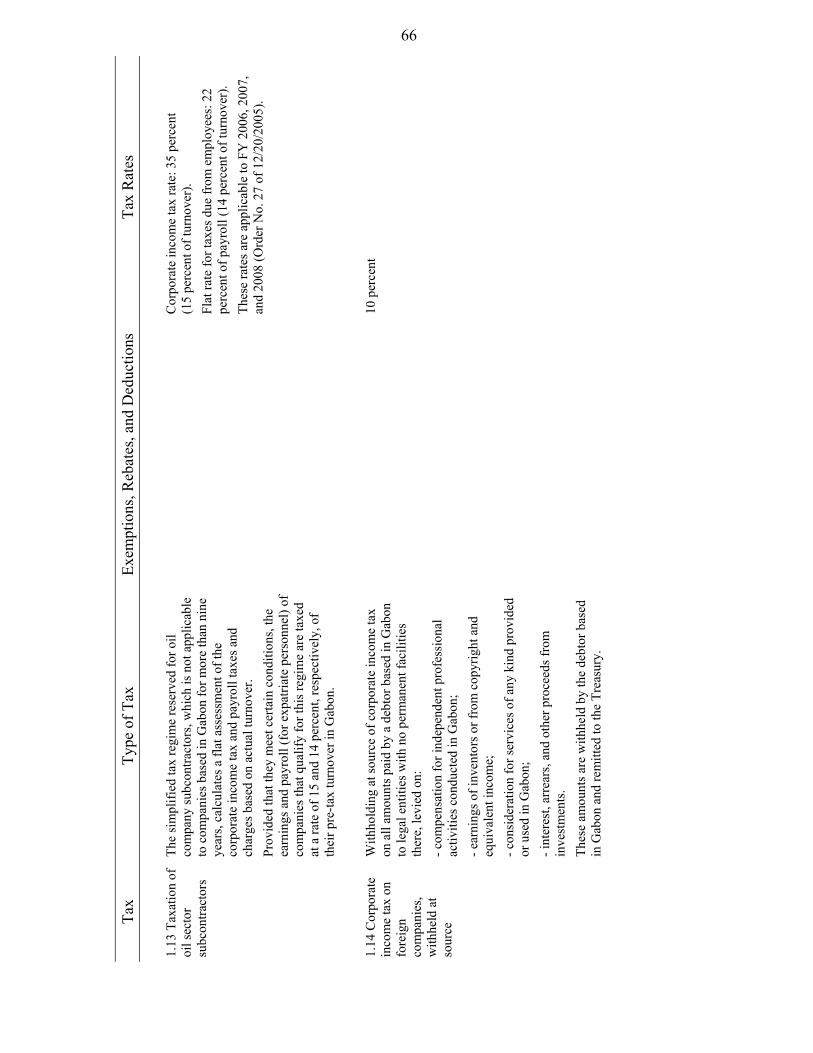
66
Tax
Type
of T
ax
Exem
ptio
ns, R
ebat
es, a
nd D
educ
tions
Ta
x R
ates
1.
13 T
axat
ion
of
oil s
ecto
r su
bcon
tract
ors
The
sim
plifi
ed ta
x re
gim
e re
serv
ed fo
r oil
com
pany
subc
ontra
ctor
s, w
hich
is n
ot a
pplic
able
to
com
pani
es b
ased
in G
abon
for m
ore
than
nin
e ye
ars,
calc
ulat
es a
flat
ass
essm
ent o
f the
co
rpor
ate
inco
me
tax
and
payr
oll t
axes
and
ch
arge
s bas
ed o
n ac
tual
turn
over
. Pr
ovid
ed th
at th
ey m
eet c
erta
in c
ondi
tions
, the
ea
rnin
gs a
nd p
ayro
ll (f
or e
xpat
riate
per
sonn
el) o
f co
mpa
nies
that
qua
lify
for t
his r
egim
e ar
e ta
xed
at a
rate
of 1
5 an
d 14
per
cent
, res
pect
ivel
y, o
f th
eir p
re-ta
x tu
rnov
er in
Gab
on.
C
orpo
rate
inco
me
tax
rate
: 35
perc
ent
(15
perc
ent o
f tur
nove
r).
Flat
rate
for t
axes
due
from
em
ploy
ees:
22
perc
ent o
f pay
roll
(14
perc
ent o
f tur
nove
r).
Thes
e ra
tes a
re a
pplic
able
to F
Y 2
006,
200
7,
and
2008
(Ord
er N
o. 2
7 of
12/
20/2
005)
.
1.14
Cor
pora
te
inco
me
tax
on
fore
ign
com
pani
es,
with
held
at
sour
ce
With
hold
ing
at so
urce
of c
orpo
rate
inco
me
tax
on a
ll am
ount
s pai
d by
a d
ebto
r bas
ed in
Gab
on
to le
gal e
ntiti
es w
ith n
o pe
rman
ent f
acili
ties
ther
e, le
vied
on:
- c
ompe
nsat
ion
for i
ndep
ende
nt p
rofe
ssio
nal
activ
ities
con
duct
ed in
Gab
on;
- ear
ning
s of i
nven
tors
or f
rom
cop
yrig
ht a
nd
equi
vale
nt in
com
e;
- con
side
ratio
n fo
r ser
vice
s of a
ny k
ind
prov
ided
or
use
d in
Gab
on;
- int
eres
t, ar
rear
s, an
d ot
her p
roce
eds f
rom
in
vest
men
ts.
Thes
e am
ount
s are
with
held
by
the
debt
or b
ased
in
Gab
on a
nd re
mitt
ed to
the
Trea
sury
.
10
per
cent
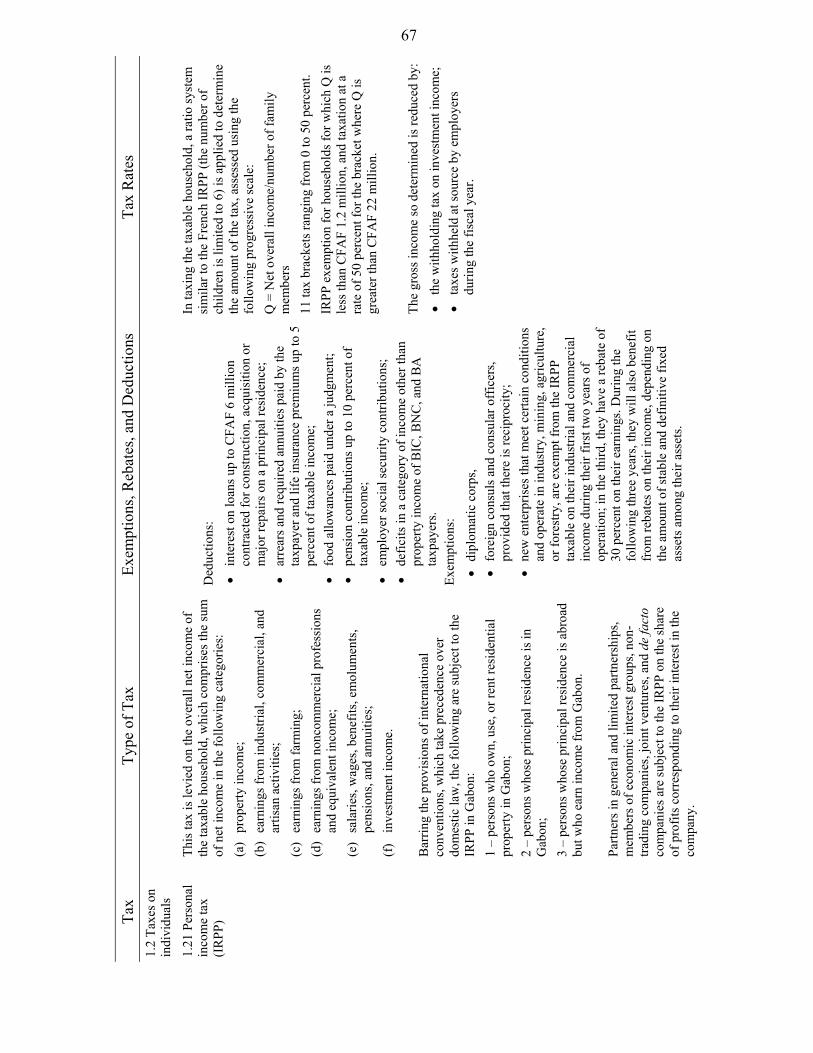
67
Tax
Type
of T
ax
Exem
ptio
ns, R
ebat
es, a
nd D
educ
tions
Ta
x R
ates
1.
2 Ta
xes o
n in
divi
dual
s
1.21
Per
sona
l in
com
e ta
x (I
RPP
)
This
tax
is le
vied
on
the
over
all n
et in
com
e of
th
e ta
xabl
e ho
useh
old,
whi
ch c
ompr
ises
the
sum
of
net
inco
me
in th
e fo
llow
ing
cate
gorie
s:
(a)
prop
erty
inco
me;
(b
) ea
rnin
gs fr
om in
dust
rial,
com
mer
cial
, and
ar
tisan
act
iviti
es;
(c)
earn
ings
from
farm
ing;
(d
) ea
rnin
gs fr
om n
onco
mm
erci
al p
rofe
ssio
ns
and
equi
vale
nt in
com
e;
(e)
sala
ries,
wag
es, b
enef
its, e
mol
umen
ts,
pens
ions
, and
ann
uitie
s;
(f)
inve
stm
ent i
ncom
e.
Bar
ring
the
prov
isio
ns o
f int
erna
tiona
l co
nven
tions
, whi
ch ta
ke p
rece
denc
e ov
er
dom
estic
law
, the
follo
win
g ar
e su
bjec
t to
the
IRPP
in G
abon
: 1
– pe
rson
s who
ow
n, u
se, o
r ren
t res
iden
tial
prop
erty
in G
abon
; 2
– pe
rson
s who
se p
rinci
pal r
esid
ence
is in
G
abon
; 3
– pe
rson
s who
se p
rinci
pal r
esid
ence
is a
broa
d bu
t who
ear
n in
com
e fr
om G
abon
. Pa
rtner
s in
gene
ral a
nd li
mite
d pa
rtner
ship
s, m
embe
rs o
f eco
nom
ic in
tere
st g
roup
s, no
n-tra
ding
com
pani
es, j
oint
ven
ture
s, an
d de
fact
o co
mpa
nies
are
subj
ect t
o th
e IR
PP o
n th
e sh
are
of p
rofit
s cor
resp
ondi
ng to
thei
r int
eres
t in
the
com
pany
.
Ded
uctio
ns:
• in
tere
st o
n lo
ans u
p to
CFA
F 6
mill
ion
cont
ract
ed fo
r con
stru
ctio
n, a
cqui
sitio
n or
m
ajor
repa
irs o
n a
prin
cipa
l res
iden
ce;
• ar
rear
s and
requ
ired
annu
ities
pai
d by
the
taxp
ayer
and
life
insu
ranc
e pr
emiu
ms u
p to
5
perc
ent o
f tax
able
inco
me;
•
food
allo
wan
ces p
aid
unde
r a ju
dgm
ent;
• pe
nsio
n co
ntrib
utio
ns u
p to
10
perc
ent o
f ta
xabl
e in
com
e;
• em
ploy
er so
cial
secu
rity
cont
ribut
ions
; •
defic
its in
a c
ateg
ory
of in
com
e ot
her t
han
prop
erty
inco
me
of B
IC, B
NC
, and
BA
ta
xpay
ers.
Exem
ptio
ns:
• di
plom
atic
cor
ps,
• fo
reig
n co
nsul
s and
con
sula
r off
icer
s, pr
ovid
ed th
at th
ere
is re
cipr
ocity
; •
new
ent
erpr
ises
that
mee
t cer
tain
con
ditio
ns
and
oper
ate
in in
dust
ry, m
inin
g, a
gric
ultu
re,
or fo
rest
ry, a
re e
xem
pt fr
om th
e IR
PP
taxa
ble
on th
eir i
ndus
trial
and
com
mer
cial
in
com
e du
ring
thei
r firs
t tw
o ye
ars o
f op
erat
ion;
in th
e th
ird, t
hey
have
a re
bate
of
30 p
erce
nt o
n th
eir e
arni
ngs.
Dur
ing
the
follo
win
g th
ree
year
s, th
ey w
ill a
lso
bene
fit
from
reba
tes o
n th
eir i
ncom
e, d
epen
ding
on
the
amou
nt o
f sta
ble
and
defin
itive
fixe
d as
sets
am
ong
thei
r ass
ets.
In ta
the
taxa
ble
hous
ehol
d, a
ratio
syst
em
sim
ilar t
o th
e Fr
ench
IRPP
(the
num
ber o
f ch
ildre
n is
lim
ited
to 6
) is a
pplie
d to
det
erm
ine
the
amou
nt o
f the
tax,
ass
esse
d us
ing
the
follo
win
g pr
ogre
ssiv
e sc
ale:
Q
= N
et o
vera
ll in
com
e/nu
mbe
r of f
amily
m
embe
rs
11 ta
x br
acke
ts ra
ngin
g fr
om 0
to 5
0 pe
rcen
t. IR
PP e
xem
ptio
n fo
r hou
seho
lds f
or w
hich
Q is
le
ss th
an C
FAF
1.2
mill
ion,
and
taxa
tion
at a
ra
te o
f 50
perc
ent f
or th
e br
acke
t whe
re Q
is
grea
ter t
han
CFA
F 22
mill
ion.
Th
e gr
oss i
ncom
e so
det
erm
ined
is re
duce
d by
: •
the
with
hold
ing
tax
on in
vest
men
t inc
ome;
•
taxe
s with
held
at s
ourc
e by
em
ploy
ers
durin
g th
e fis
cal y
ear.
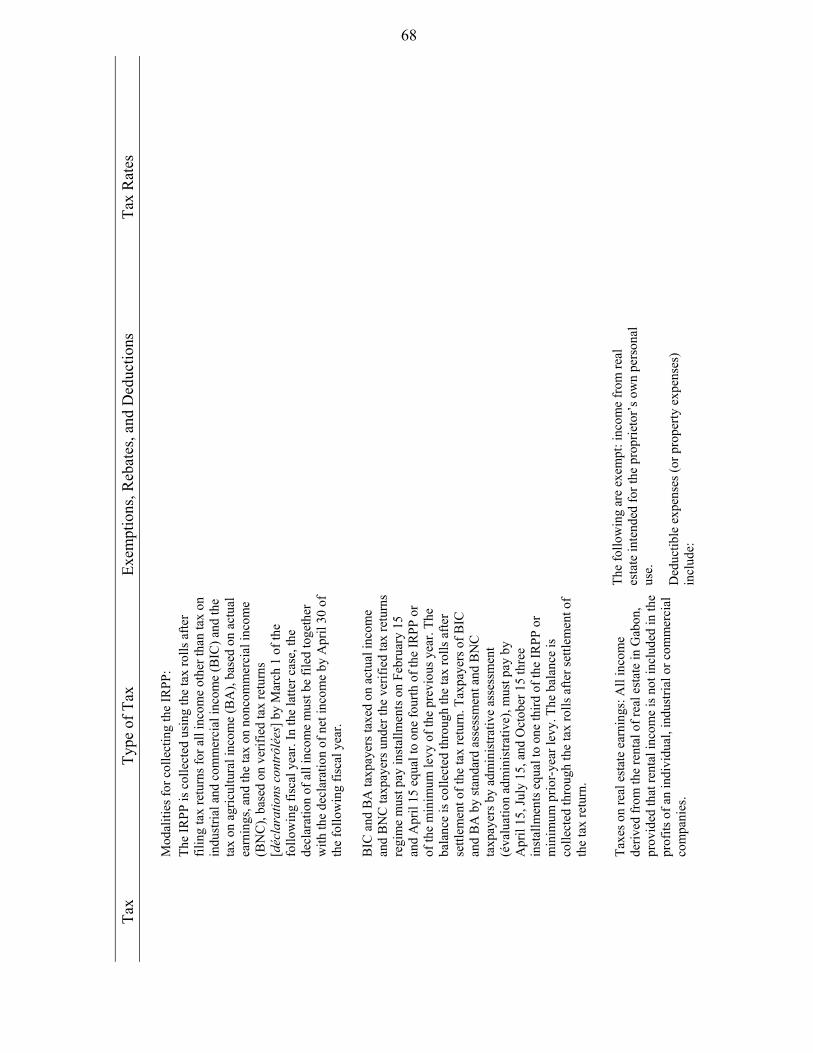
68
Tax
Type
of T
ax
Exem
ptio
ns, R
ebat
es, a
nd D
educ
tions
Ta
x R
ates
M
odal
ities
for c
olle
ctin
g th
e IR
PP:
The
IRPP
is c
olle
cted
usi
ng th
e ta
x ro
lls a
fter
filin
g ta
x re
turn
s for
all
inco
me
othe
r tha
n ta
x on
in
dust
rial a
nd c
omm
erci
al in
com
e (B
IC) a
nd th
e ta
x on
agr
icul
tura
l inc
ome
(BA
), ba
sed
on a
ctua
l ea
rnin
gs, a
nd th
e ta
x on
non
com
mer
cial
inco
me
(BN
C),
base
d on
ver
ified
tax
retu
rns
[déc
lara
tions
con
trôl
ées]
by
Mar
ch 1
of t
he
follo
win
g fis
cal y
ear.
In th
e la
tter c
ase,
the
decl
arat
ion
of a
ll in
com
e m
ust b
e fil
ed to
geth
er
with
the
decl
arat
ion
of n
et in
com
e by
Apr
il 30
of
the
follo
win
g fis
cal y
ear.
BIC
and
BA
taxp
ayer
s tax
ed o
n ac
tual
inco
me
and
BN
C ta
xpay
ers u
nder
the
verif
ied
tax
retu
rns
regi
me
mus
t pay
inst
allm
ents
on
Febr
uary
15
and
Apr
il 15
equ
al to
one
four
th o
f the
IRPP
or
of th
e m
inim
um le
vy o
f the
pre
viou
s yea
r. Th
e ba
lanc
e is
col
lect
ed th
roug
h th
e ta
x ro
lls a
fter
settl
emen
t of t
he ta
x re
turn
. Tax
paye
rs o
f BIC
an
d B
A b
y st
anda
rd a
sses
smen
t and
BN
C
taxp
ayer
s by
adm
inis
trativ
e as
sess
men
t (é
valu
atio
n ad
min
istra
tive)
, mus
t pay
by
Apr
il 15
, Jul
y 15
, and
Oct
ober
15
thre
e in
stal
lmen
ts e
qual
to o
ne th
ird o
f the
IRPP
or
min
imum
prio
r-ye
ar le
vy. T
he b
alan
ce is
co
llect
ed th
roug
h th
e ta
x ro
lls a
fter s
ettle
men
t of
the
tax
retu
rn.
Taxe
s on
real
est
ate
earn
ings
: All
inco
me
deriv
ed fr
om th
e re
ntal
of r
eal e
stat
e in
Gab
on,
prov
ided
that
rent
al in
com
e is
not
incl
uded
in th
e pr
ofits
of a
n in
divi
dual
, ind
ustri
al o
r com
mer
cial
co
mpa
nies
.
The
follo
win
g ar
e ex
empt
: inc
ome
from
real
es
tate
inte
nded
for t
he p
ropr
ieto
r’s o
wn
pers
onal
us
e.
Ded
uctib
le e
xpen
ses (
or p
rope
rty e
xpen
ses)
in
clud
e:

69
Tax
Type
of T
ax
Exem
ptio
ns, R
ebat
es, a
nd D
educ
tions
Ta
x R
ates
N
et re
al e
stat
e in
com
e =
Gro
ss e
arni
ngs -
ex
pens
es
- deb
t int
eres
t; - p
ropr
ieto
r ass
essm
ents
(tax
es o
n de
velo
ped
or
unde
velo
ped
prop
erty
, in
parti
cula
r);
- 30
perc
ent l
ump-
sum
ded
uctio
n fo
r han
dlin
g fe
es a
nd (t
axpa
yer m
ay e
lect
to it
emiz
e).
Prof
its fr
om fa
rmin
g co
mpr
ise
earn
ings
from
the
oper
atio
n of
rura
l pro
perti
es b
y fa
rmer
s, te
nant
fa
rmer
s, or
the
owne
rs th
emse
lves
in c
onne
ctio
n w
ith st
ockb
reed
ing,
pou
ltry
farm
ing,
fish
fa
rmin
g, a
nd o
yste
r far
min
g.
Two
taxa
tion
regi
mes
: - p
resu
mpt
ive
asse
ssm
ent;
- ite
miz
ed a
sses
smen
t (ta
xatio
n ba
sed
on a
ctua
l ea
rnin
gs).
Proc
eeds
from
the
farm
ing
of la
nd e
xclu
sive
ly
used
for f
ood
crop
s, w
here
the
culti
vate
d su
rfac
e ar
ea is
less
than
5 h
ecta
res,
is e
xem
pt.
The
law
mak
es it
pos
sibl
e to
opt
for t
he h
ighe
r-ra
te re
gim
e.
In th
e ev
ent t
hat t
he ta
xpay
er e
lect
s to
use
the
item
ized
bas
is, a
ccou
nt sh
all b
e ta
ken
of:
* sp
ouse
’s e
arni
ngs m
ust n
ot e
xcee
d C
FAF
1.8
mill
ion;
*
trave
l exp
ense
s for
leav
e ac
tual
ly ta
ken
up to
on
e fu
ll-fa
re ti
cket
per
yea
r; *
one
15 p
erce
nt re
bate
of e
arni
ngs.
Ea
rnin
gs fr
om n
onco
mm
erci
al p
rofe
ssio
ns
incl
ude
inco
me
equi
vale
nt to
non
com
mer
cial
ea
rnin
gs p
rinci
pally
from
the
liber
al p
rofe
ssio
ns,
but a
lso
from
pos
ition
s and
off
ices
hel
d, a
nd a
ny
othe
r inc
ome
not c
lass
ified
els
ewhe
re.
Two
tax
regi
mes
: •
the
adm
inis
trativ
e as
sess
men
t reg
ime
is
appl
icab
le to
taxp
ayer
s who
se in
com
e do
es
not e
xcee
d C
FAF
30 m
illio
n;
• th
e ve
rifie
d ta
x re
turn
s reg
ime
is a
pplic
able
to
taxp
ayer
s who
se in
com
e ex
ceed
s C
FAF
30 m
illio
n, a
nd to
all
publ
ic a
nd
min
istry
off
icia
ls o
n th
e in
com
e de
rived
from
th
eir p
ositi
ons o
r off
ices
.
The
law
mak
es it
pos
sibl
e to
opt
for t
he h
ighe
r-ra
te re
gim
e.
Taxa
tion
unde
r the
ver
ified
tax
retu
rns r
egim
e is
on
the
follo
win
g ba
sis:
•
spou
se’s
ear
ning
s mus
t not
exc
eed
CFA
F 1.
8 m
illio
n;
• tra
vel e
xpen
ses f
or le
ave
actu
ally
take
n up
to
one
full-
fare
tick
et p
er y
ear .

70
Tax
Type
of T
ax
Exem
ptio
ns, R
ebat
es, a
nd D
educ
tions
Ta
x R
ates
Sala
ries,
pens
ions
, and
ann
uitie
s inc
lude
sala
ries,
bene
fits,
emol
umen
ts, w
ages
, pen
sion
s, an
d an
nuiti
es e
arne
d fr
om e
ngag
ing
in a
n ac
tivity
in
Gab
on.
In-k
ind
bene
fits p
rovi
ded
to e
mpl
oyee
s are
ta
xabl
e on
the
basi
s of t
he fo
llow
ing
stan
dard
as
sess
men
t: •
hous
ing:
6 p
erce
nt, l
imite
d to
40
perc
ent o
f gr
oss m
onth
ly w
ages
, up
to a
cei
ling
of
CFA
F 25
0,00
0 pe
r mon
th;
• do
mes
tic st
aff:
5 pe
rcen
t; •
wat
er, p
ower
: 5 p
erce
nt;
• fo
od: 2
5 pe
rcen
t, w
ith a
max
imum
of C
FAF
120,
000
per p
erso
n pe
r mon
th.
All
empl
oyer
s in
Gab
on m
ust w
ithho
ld in
com
e ta
x at
sour
ce o
n th
e m
onth
ly w
ages
they
pay
, as
sess
ed o
n th
e ba
sis o
f a p
re-e
stab
lishe
d sc
ale
and
depo
site
d w
ith th
e Tr
easu
ry. T
his
with
hold
ing
at so
urce
is a
djus
ted
whe
n th
e in
com
e ta
x re
turn
is fi
led
by th
e w
age-
earn
er.
The
follo
win
g ar
e ex
empt
from
the
tax:
•
spec
ial a
llow
ance
s to
cove
r cos
ts sp
ecifi
c to
th
e jo
b or
pos
ition
, wag
es n
ot e
xcee
ding
C
FAF
600,
000
per m
onth
; •
fam
ily a
llow
ance
s;
• lu
mp
sum
supp
lem
ents
pai
d to
pub
lic
serv
ants
; •
stud
ent s
chol
arsh
ips;
•
vete
ran’
s pen
sion
s;
• pe
nsio
ns, b
enef
its, a
nnui
ties a
lloca
ted
to
vict
ims o
f lab
or- o
r war
-rel
ated
acc
iden
ts,
etc.
•
ince
ntiv
e bo
nuse
s and
oth
er b
enef
its
dist
ribut
ed a
t the
end
of t
he y
ear u
p to
CFA
F 4
mill
ion.
G
ross
ear
ned
inco
me
is su
bjec
t to
a 20
-per
cent
re
bate
lim
ited
to C
FAF
10 m
illio
n, fo
r pr
ofes
sion
al fe
es.
In
vest
men
t inc
ome
incl
udes
: •
retu
rns o
n sh
ares
, equ
ity, a
nd e
quiv
alen
t in
com
e;
• di
rect
ors’
fees
and
atte
ndan
ce fe
es, l
ump
sum
re
fund
s of c
osts
and
all
othe
r com
pens
atio
n pa
id to
the
sole
dire
ctor
or o
ther
mem
bers
of
corp
orat
e bo
ards
; •
inco
me
from
secu
ritie
s;
• in
com
e fr
om c
laim
s, de
posi
ts, s
ecur
ity, a
nd
curr
ent a
ccou
nts;
•
inte
rest
on
shor
t-ter
m b
orro
win
g (b
ons d
e ca
isse
).
- In
com
e an
d ga
ins f
rom
ent
erpr
ises
es
tabl
ishe
d as
mut
ual f
unds
and
cap
ital
gain
s fro
m th
e tra
nsfe
r of p
ortfo
lio
secu
ritie
s by
the
sam
e en
terp
rises
; -
inco
me
from
secu
ritie
s bel
ongi
ng to
Fr
ance
, Gab
on, a
nd c
omm
unes
;
5 pe
rcen
t: in
com
e fr
om se
curit
ies w
ith a
n or
igin
al m
atur
ity o
f les
s tha
n fiv
e ye
ars i
s su
bjec
t to
with
hold
ing
at so
urce
by
the
paye
r. Th
is w
ithho
ldin
g at
sour
ce fu
lly d
isch
arge
s all
othe
r tax
es.
15 p
erce
nt: L
evie
d at
sour
ce o
n in
tere
st o
n ba
nk sh
ort-t
erm
bor
row
ing.
Su
bjec
t to
the
prov
isio
ns o
f int
erna
tiona
l co
nven
tions
, inc
ome
from
cla
ims,
depo
sits
, and
se
curit
y, w
hose
ben
efic
iarie
s are
non
resi
dent
in
divi
dual
s or c
orpo
ratio
ns is
subj
ect t
o a
with
hold
ing
at so
urce
of 2
0 pe
rcen
t by
the
paye
r, re
mitt
ed to
the
Rev
enue
Aut
horit
y. T
his
with
hold
ing
at so
urce
fully
dis
char
ges a
ll IR
PP
paym
ents
.
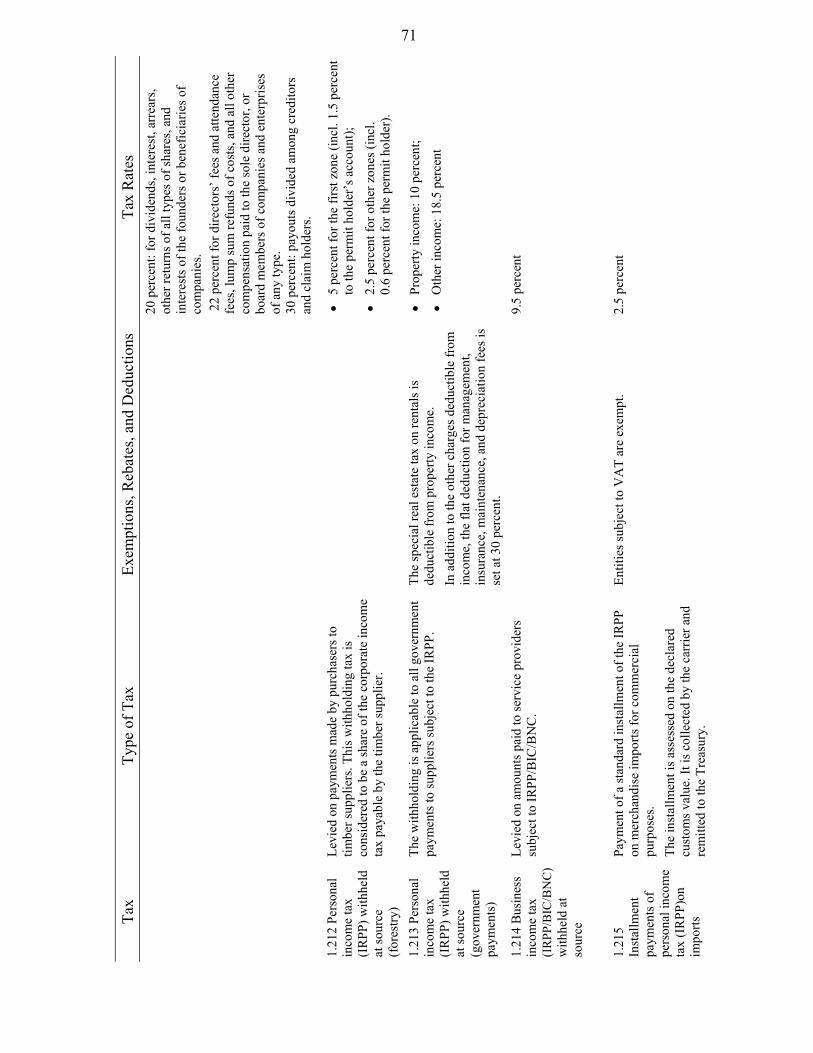
71
Tax
Type
of T
ax
Exem
ptio
ns, R
ebat
es, a
nd D
educ
tions
Ta
x R
ates
20
per
cent
: for
div
iden
ds, i
nter
est,
arre
ars,
othe
r ret
urns
of a
ll ty
pes o
f sha
res,
and
inte
rest
s of t
he fo
unde
rs o
r ben
efic
iarie
s of
com
pani
es.
22
perc
ent f
or d
irect
ors’
fees
and
atte
ndan
ce
fees
, lum
p su
m re
fund
s of c
osts
, and
all
othe
r co
mpe
nsat
ion
paid
to th
e so
le d
irect
or, o
r bo
ard
mem
bers
of c
ompa
nies
and
ent
erpr
ises
of
any
type
. 30
per
cent
: pay
outs
div
ided
am
ong
cred
itors
an
d cl
aim
hol
ders
.
1.21
2 Pe
rson
al
inco
me
tax
(I
RPP
) with
held
at
sour
ce
(for
estry
)
Levi
ed o
n pa
ymen
ts m
ade
by p
urch
aser
s to
timbe
r sup
plie
rs. T
his w
ithho
ldin
g ta
x is
co
nsid
ered
to b
e a
shar
e of
the
corp
orat
e in
com
e ta
x pa
yabl
e by
the
timbe
r sup
plie
r.
•
5 pe
rcen
t for
the
first
zon
e (in
cl. 1
.5 p
erce
nt
to th
e pe
rmit
hold
er’s
acc
ount
); •
2.5
perc
ent f
or o
ther
zon
es (i
ncl.
0.6
perc
ent f
or th
e pe
rmit
hold
er).
1.21
3 Pe
rson
al
inco
me
tax
(IR
PP) w
ithhe
ld
at so
urce
(g
over
nmen
t pa
ymen
ts)
The
with
hold
ing
is a
pplic
able
to a
ll go
vern
men
t pa
ymen
ts to
supp
liers
subj
ect t
o th
e IR
PP.
The
spec
ial r
eal e
stat
e ta
x on
rent
als i
s de
duct
ible
from
pro
perty
inco
me.
In
add
ition
to th
e ot
her c
harg
es d
educ
tible
from
in
com
e, th
e fla
t ded
uctio
n fo
r man
agem
ent,
insu
ranc
e, m
aint
enan
ce, a
nd d
epre
ciat
ion
fees
is
set a
t 30
perc
ent.
• Pr
oper
ty in
com
e: 1
0 pe
rcen
t; •
Oth
er in
com
e: 1
8.5
perc
ent
1.21
4 B
usin
ess
inco
me
tax
(IR
PP/B
IC/B
NC
) w
ithhe
ld a
t so
urce
Levi
ed o
n am
ount
s pai
d to
serv
ice
prov
ider
s su
bjec
t to
IRPP
/BIC
/BN
C.
9.
5 pe
rcen
t
1.21
5 In
stal
lmen
t pa
ymen
ts o
f pe
rson
al in
com
e ta
x (I
RPP
)on
impo
rts
Paym
ent o
f a st
anda
rd in
stal
lmen
t of t
he IR
PP
on m
erch
andi
se im
ports
for c
omm
erci
al
purp
oses
. Th
e in
stal
lmen
t is a
sses
sed
on th
e de
clar
ed
cust
oms v
alue
. It i
s col
lect
ed b
y th
e ca
rrie
r and
re
mitt
ed to
the
Trea
sury
.
Entit
ies s
ubje
ct to
VA
T ar
e ex
empt
. 2.
5 pe
rcen
t
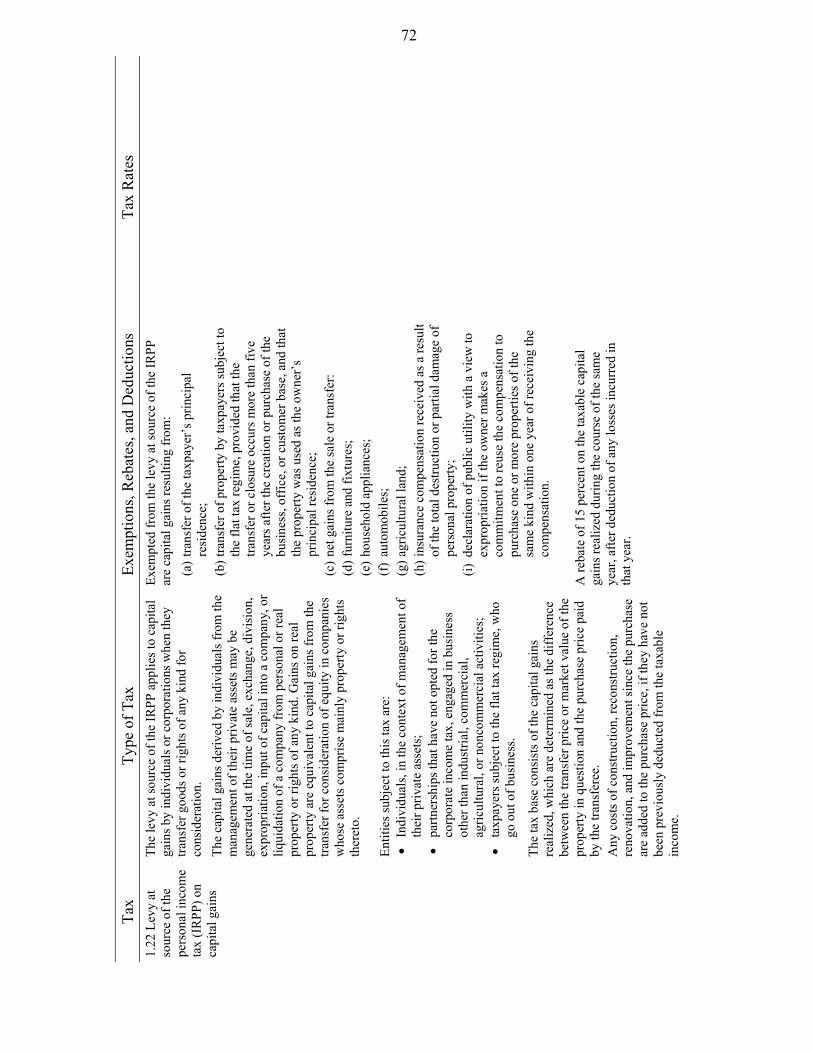
72
Tax
Type
of T
ax
Exem
ptio
ns, R
ebat
es, a
nd D
educ
tions
Ta
x R
ates
1.
22 L
evy
at
sour
ce o
f the
pe
rson
al in
com
e ta
x (I
RPP
) on
capi
tal g
ains
The
levy
at s
ourc
e of
the
IRPP
app
lies t
o ca
pita
l ga
ins b
y in
divi
dual
s or c
orpo
ratio
ns w
hen
they
tra
nsfe
r goo
ds o
r rig
hts o
f any
kin
d fo
r co
nsid
erat
ion.
Th
e ca
pita
l gai
ns d
eriv
ed b
y in
divi
dual
s fro
m th
e m
anag
emen
t of t
heir
priv
ate
asse
ts m
ay b
e
gene
rate
d at
the
time
of sa
le, e
xcha
nge,
div
isio
n,
expr
opria
tion,
inpu
t of c
apita
l int
o a
com
pany
, or
liqui
datio
n of
a c
ompa
ny fr
om p
erso
nal o
r rea
l pr
oper
ty o
r rig
hts o
f any
kin
d. G
ains
on
real
pr
oper
ty a
re e
quiv
alen
t to
capi
tal g
ains
from
the
trans
fer f
or c
onsi
dera
tion
of e
quity
in c
ompa
nies
w
hose
ass
ets c
ompr
ise
mai
nly
prop
erty
or r
ight
s th
eret
o.
Entit
ies s
ubje
ct to
this
tax
are:
•
Indi
vidu
als,
in th
e co
ntex
t of m
anag
emen
t of
thei
r priv
ate
asse
ts;
• pa
rtner
ship
s tha
t hav
e no
t opt
ed fo
r the
co
rpor
ate
inco
me
tax,
eng
aged
in b
usin
ess
othe
r tha
n in
dust
rial,
com
mer
cial
, ag
ricul
tura
l, or
non
com
mer
cial
act
iviti
es;
• ta
xpay
ers s
ubje
ct to
the
flat t
ax re
gim
e, w
ho
go o
ut o
f bus
ines
s.
The
tax
base
con
sist
s of t
he c
apita
l gai
ns
real
ized
, whi
ch a
re d
eter
min
ed a
s the
diff
eren
ce
betw
een
the
trans
fer p
rice
or m
arke
t val
ue o
f the
pr
oper
ty in
que
stio
n an
d th
e pu
rcha
se p
rice
paid
by
the
trans
fere
e.
Any
cos
ts o
f con
stru
ctio
n, re
cons
truct
ion,
re
nova
tion,
and
impr
ovem
ent s
ince
the
purc
hase
ar
e ad
ded
to th
e pu
rcha
se p
rice,
if th
ey h
ave
not
been
pre
viou
sly
dedu
cted
from
the
taxa
ble
inco
me.
Exem
pted
from
the
levy
at s
ourc
e of
the
IRPP
ar
e ca
pita
l gai
ns re
sulti
ng fr
om:
(a) t
rans
fer o
f the
taxp
ayer
’s p
rinci
pal
resi
denc
e;
(b) t
rans
fer o
f pro
perty
by
taxp
ayer
s sub
ject
to
the
flat t
ax re
gim
e, p
rovi
ded
that
the
trans
fer o
r clo
sure
occ
urs m
ore
than
five
ye
ars a
fter t
he c
reat
ion
or p
urch
ase
of th
e bu
sine
ss, o
ffic
e, o
r cus
tom
er b
ase,
and
that
th
e pr
oper
ty w
as u
sed
as th
e ow
ner’
s pr
inci
pal r
esid
ence
; (c
) net
gai
ns fr
om th
e sa
le o
r tra
nsfe
r: (d
) fur
nitu
re a
nd fi
xtur
es;
(e) h
ouse
hold
app
lianc
es;
(f)
auto
mob
iles;
(g
) agr
icul
tura
l lan
d;
(h) i
nsur
ance
com
pens
atio
n re
ceiv
ed a
s a re
sult
of th
e to
tal d
estru
ctio
n or
par
tial d
amag
e of
pe
rson
al p
rope
rty;
(i) d
ecla
ratio
n of
pub
lic u
tility
with
a v
iew
to
expr
opria
tion
if th
e ow
ner m
akes
a
com
mitm
ent t
o re
use
the
com
pens
atio
n to
pu
rcha
se o
ne o
r mor
e pr
oper
ties o
f the
sa
me
kind
with
in o
ne y
ear o
f rec
eivi
ng th
e co
mpe
nsat
ion.
A
reba
te o
f 15
perc
ent o
n th
e ta
xabl
e ca
pita
l ga
ins r
ealiz
ed d
urin
g th
e co
urse
of t
he sa
me
year
, afte
r ded
uctio
n of
any
loss
es in
curr
ed in
th
at y
ear.
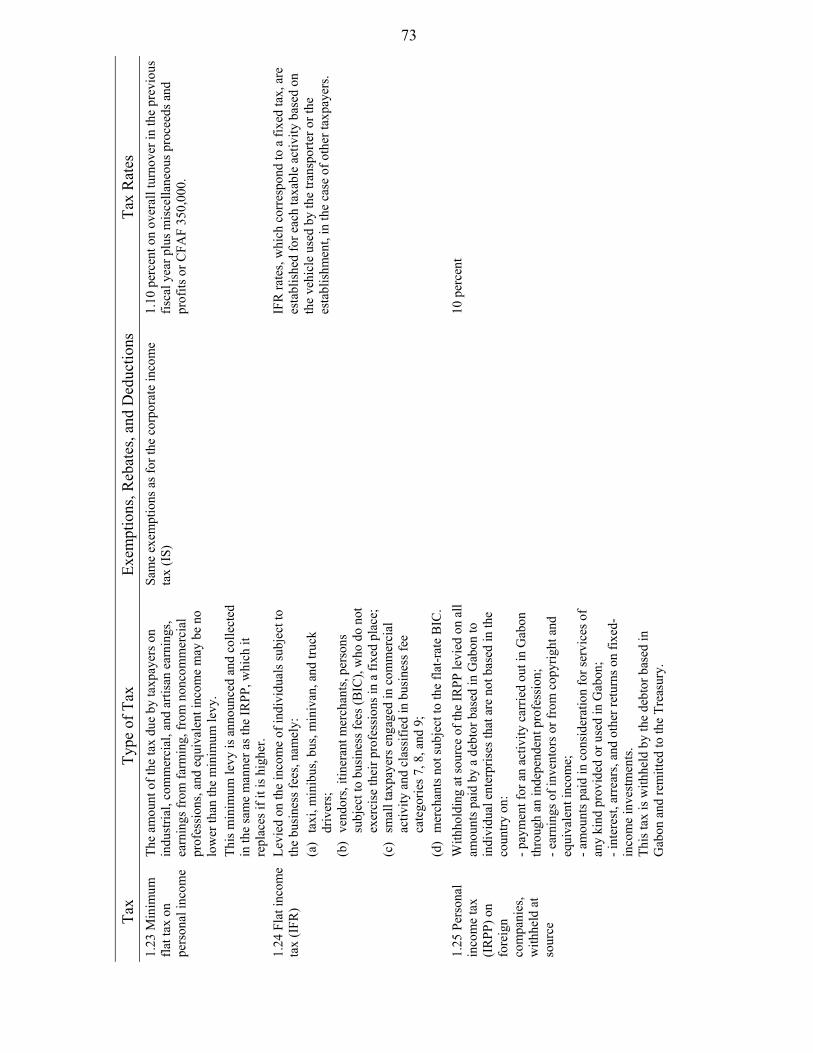
73
Tax
Type
of T
ax
Exem
ptio
ns, R
ebat
es, a
nd D
educ
tions
Ta
x R
ates
1.
23 M
inim
um
flat t
ax o
n pe
rson
al in
com
e
The
amou
nt o
f the
tax
due
by ta
xpay
ers o
n in
dust
rial,
com
mer
cial
, and
arti
san
earn
ings
, ea
rnin
gs fr
om fa
rmin
g, fr
om n
onco
mm
erci
al
prof
essi
ons,
and
equi
vale
nt in
com
e m
ay b
e no
lo
wer
than
the
min
imum
levy
. Th
is m
inim
um le
vy is
ann
ounc
ed a
nd c
olle
cted
in
the
sam
e m
anne
r as t
he IR
PP, w
hich
it
repl
aces
if it
is h
ighe
r.
Sam
e ex
empt
ions
as f
or th
e co
rpor
ate
inco
me
tax
(IS)
1.
10 p
erce
nt o
n ov
eral
l tur
nove
r in
the
prev
ious
fis
cal y
ear p
lus m
isce
llane
ous p
roce
eds a
nd
prof
its o
r CFA
F 35
0,00
0.
1.24
Fla
t inc
ome
tax
(IFR
) Le
vied
on
the
inco
me
of in
divi
dual
s sub
ject
to
the
busi
ness
fees
, nam
ely:
(a
) ta
xi, m
inib
us, b
us, m
iniv
an, a
nd tr
uck
driv
ers;
(b
) ve
ndor
s, iti
nera
nt m
erch
ants
, per
sons
su
bjec
t to
busi
ness
fees
(BIC
), w
ho d
o no
t ex
erci
se th
eir p
rofe
ssio
ns in
a fi
xed
plac
e;
(c)
smal
l tax
paye
rs e
ngag
ed in
com
mer
cial
ac
tivity
and
cla
ssifi
ed in
bus
ines
s fee
ca
tego
ries 7
, 8, a
nd 9
; (d
) m
erch
ants
not
subj
ect t
o th
e fla
t-rat
e B
IC.
IF
R ra
tes,
whi
ch c
orre
spon
d to
a fi
xed
tax,
are
es
tabl
ishe
d fo
r eac
h ta
xabl
e ac
tivity
bas
ed o
n th
e ve
hicl
e us
ed b
y th
e tra
nspo
rter o
r the
es
tabl
ishm
ent,
in th
e ca
se o
f oth
er ta
xpay
ers.
1.25
Per
sona
l in
com
e ta
x (I
RPP
) on
fore
ign
com
pani
es,
with
held
at
sour
ce
With
hold
ing
at so
urce
of t
he IR
PP le
vied
on
all
amou
nts p
aid
by a
deb
tor b
ased
in G
abon
to
indi
vidu
al e
nter
pris
es th
at a
re n
ot b
ased
in th
e co
untry
on:
- p
aym
ent f
or a
n ac
tivity
car
ried
out i
n G
abon
th
roug
h an
inde
pend
ent p
rofe
ssio
n;
- ear
ning
s of i
nven
tors
or f
rom
cop
yrig
ht a
nd
equi
vale
nt in
com
e;
- am
ount
s pai
d in
con
side
ratio
n fo
r ser
vice
s of
any
kind
pro
vide
d or
use
d in
Gab
on;
- int
eres
t, ar
rear
s, an
d ot
her r
etur
ns o
n fix
ed-
inco
me
inve
stm
ents
. Th
is ta
x is
with
held
by
the
debt
or b
ased
in
Gab
on a
nd re
mitt
ed to
the
Trea
sury
.
10
per
cent

74
Tax
Type
of T
ax
Exem
ptio
ns, R
ebat
es, a
nd D
educ
tions
Ta
x R
ates
2.
Tax
es o
n go
ods a
nd se
rvic
es
2.1
Val
ue-a
dded
ta
x Th
is ta
x is
ass
esse
d on
val
ue a
dded
. The
tax
is
levi
ed o
n al
l pro
duct
ion,
del
iver
y, im
port,
and
se
rvic
e pr
ovis
ion
activ
ities
con
duct
ed o
n a
regu
lar o
r occ
asio
nal b
asis
, ind
epen
dent
ly, f
or
cons
ider
atio
n.
Subj
ect t
o th
is ta
x ar
e al
l cor
pora
te o
r ind
ivid
ual
taxp
ayer
s with
a tu
rnov
er o
f: (a
) C
FAF
60 m
illio
n fo
r ser
vice
pro
visi
on;
(b)
CFA
F 80
mill
ion
for g
ener
al o
pera
tions
; (c
) Ta
xpay
ers e
ngag
ed in
fore
stry
act
iviti
es a
re
subj
ect t
o V
AT
if th
eir t
urno
ver e
xcee
ds
CFA
F 50
0 m
illio
n.
(d)
Als
o su
bjec
t to
VA
T w
hen
thei
r tur
nove
r ex
ceed
s CFA
F 40
mill
ion
are
the
follo
win
g ta
xpay
ers:
•
forw
ardi
ng a
gent
s;
• la
nd c
arrie
r ope
rato
rs;
• su
pplie
rs o
f aut
omob
ile sp
are
parts
and
ac
cess
orie
s;
• dr
ivin
g sc
hool
s;
• le
gal a
nd a
ccou
ntin
g pr
ofes
sion
s exe
rcis
ed
inde
pend
ently
: atto
rney
s, co
urt c
lerk
s, no
tarie
s, le
gal r
ecei
vers
, and
acc
ount
ing
firm
s;
• pr
oper
ty m
anag
ers;
•
prin
ters
and
repr
oduc
tion
agen
cies
; •
job
plac
emen
t firm
s;
• ph
otog
raph
ers;
•
dry
clea
ners
; •
hard
war
e le
asin
g fir
ms;
•
rest
aura
nt o
wne
rs.
The
follo
win
g ar
e no
t elig
ible
for d
educ
tions
: (a
) ex
pend
iture
on
hous
ing,
boa
rd a
nd lo
dgin
g,
rece
ptio
ns, e
nter
tain
men
t, an
d pa
ssen
ger
trans
port,
exc
ept f
or p
rofe
ssio
nals
in th
e ho
tel,
rest
aura
nt, e
nter
tain
men
t, an
d pa
ssen
ger t
rans
port
indu
strie
s;
(b)
impo
rts o
f goo
ds a
nd m
erch
andi
se re
-sh
ippe
d as
-is;
(c)
petro
leum
pro
duct
s, w
ith th
e ex
cept
ion
of
thos
e us
ed b
y fix
ed m
achi
nery
, suc
h as
fu
els,
or m
anuf
actu
ring
agen
ts in
indu
stria
l en
terp
rises
; (d
) go
ods t
rans
ferr
ed w
ithou
t con
side
ratio
n or
fo
r con
side
ratio
n fa
r bel
ow th
e no
rmal
pr
ice;
(e
) ex
pend
iture
on
vehi
cles
and
eng
ines
de
sign
ed o
r out
fitte
d fo
r pas
seng
er tr
ansp
ort
or fo
r mul
tiple
use
s, co
nstit
utin
g fix
ed
asse
ts, o
r on
thei
r ren
tal o
r spa
re p
arts
and
ac
cess
orie
s, ex
cept
: (f
) ve
hicl
es w
ith m
ore
than
8 se
ats u
sed
by
com
pani
es e
xclu
sive
ly fo
r tra
nspo
rting
thei
r pe
rson
nel;
(g)
the
fixed
ass
ets o
f car
rent
al c
ompa
nies
; (h
) th
e fix
ed a
sset
s of p
ublic
pas
seng
er
trans
port
com
pani
es.
The
rule
s on
inel
igib
ility
for d
educ
tion
are
appl
ied
on a
pro
rate
d ba
sis i
n th
e ca
se o
f mix
ed
activ
ities
. Ex
empt
ions
: (a
) lo
cal p
rodu
cts o
btai
ned
by c
rop
and
lives
tock
farm
ers,
fishe
rmen
, and
hun
ters
; (b
) th
e fo
llow
ing
oper
atio
ns if
subj
ect t
o sp
ecia
l ta
xatio
n:
(c)
sale
s of p
rodu
cts f
rom
min
ing
activ
ities
;
(a)
Gen
eral
rate
: 18
perc
ent,
appl
icab
le to
all
oper
atio
ns o
ther
than
thos
e su
bjec
t by
law
to
oth
er ra
tes;
(b
) R
educ
ed ra
te: 1
0 pe
rcen
t app
licab
le to
the
follo
win
g ite
ms:
•
min
eral
wat
er, c
hick
en, s
ugar
, bee
f and
po
ultry
mea
t, ta
ble
oil,
tom
ato
past
e, fr
uit
or v
eget
able
pre
serv
es, p
eanu
ts;
• de
terg
ents
; •
cem
ent,
conc
rete
rein
forc
ing
bars
, bui
ldin
g til
e, ti
le p
egs;
•
fishi
ng e
quip
men
t, ou
tboa
rd m
otor
s, ra
inco
ats;
•
axle
s and
spar
e au
tom
obile
par
ts
(c)
Zero
rate
: app
licab
le to
exp
orts
and
in
tern
atio
nal t
rans
port.
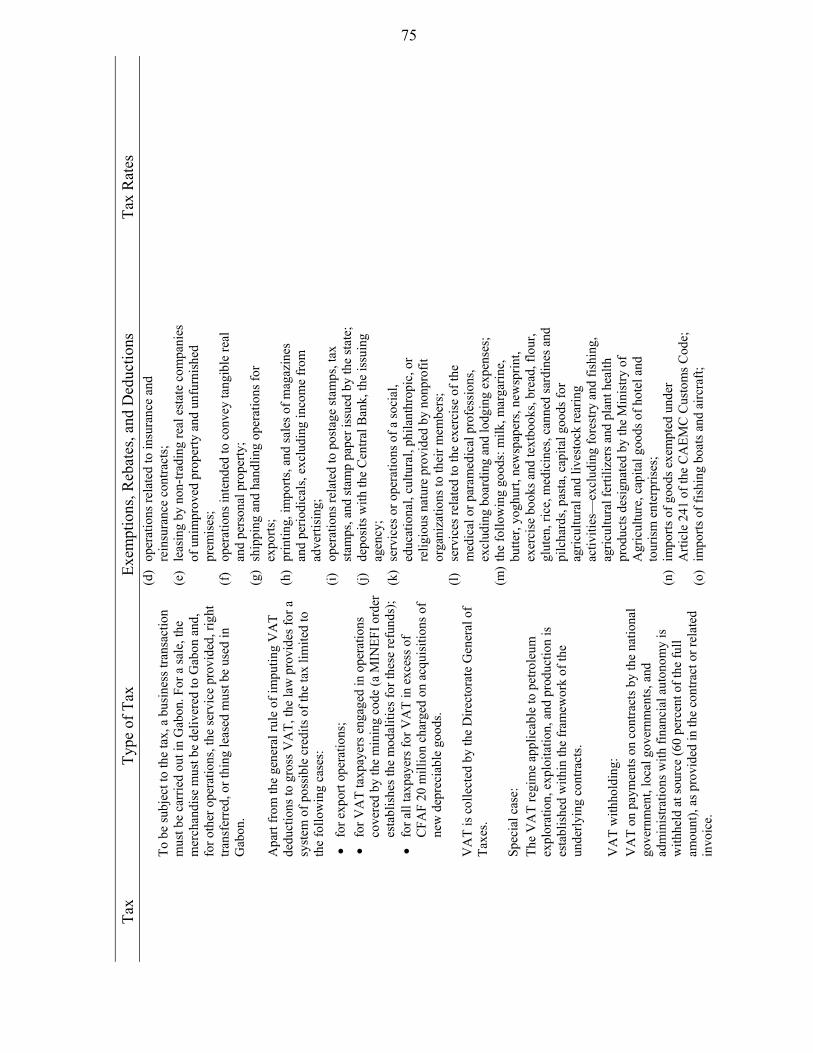
75
Tax
Type
of T
ax
Exem
ptio
ns, R
ebat
es, a
nd D
educ
tions
Ta
x R
ates
To
be
subj
ect t
o th
e ta
x, a
bus
ines
s tra
nsac
tion
mus
t be
carr
ied
out i
n G
abon
. For
a sa
le, t
he
mer
chan
dise
mus
t be
deliv
ered
to G
abon
and
, fo
r oth
er o
pera
tions
, the
serv
ice
prov
ided
, rig
ht
trans
ferr
ed, o
r thi
ng le
ased
mus
t be
used
in
Gab
on.
Apa
rt fr
om th
e ge
nera
l rul
e of
impu
ting
VA
T de
duct
ions
to g
ross
VA
T, th
e la
w p
rovi
des f
or a
sy
stem
of p
ossi
ble
cred
its o
f the
tax
limite
d to
th
e fo
llow
ing
case
s:
• fo
r exp
ort o
pera
tions
; •
for V
AT
taxp
ayer
s eng
aged
in o
pera
tions
co
vere
d by
the
min
ing
code
(a M
INEF
I ord
er
esta
blis
hes t
he m
odal
ities
for t
hese
refu
nds)
; •
for a
ll ta
xpay
ers f
or V
AT
in e
xces
s of
CFA
F 20
mill
ion
char
ged
on a
cqui
sitio
ns o
f ne
w d
epre
ciab
le g
oods
. V
AT
is c
olle
cted
by
the
Dire
ctor
ate
Gen
eral
of
Taxe
s. Sp
ecia
l cas
e:
The
VA
T re
gim
e ap
plic
able
to p
etro
leum
ex
plor
atio
n, e
xplo
itatio
n, a
nd p
rodu
ctio
n is
es
tabl
ishe
d w
ithin
the
fram
ewor
k of
the
unde
rlyin
g co
ntra
cts.
VA
T w
ithho
ldin
g:
VA
T on
pay
men
ts o
n co
ntra
cts b
y th
e na
tiona
l go
vern
men
t, lo
cal g
over
nmen
ts, a
nd
adm
inis
tratio
ns w
ith fi
nanc
ial a
uton
omy
is
with
held
at s
ourc
e (6
0 pe
rcen
t of t
he fu
ll am
ount
), as
pro
vide
d in
the
cont
ract
or r
elat
ed
invo
ice.
(d)
oper
atio
ns re
late
d to
insu
ranc
e an
d re
insu
ranc
e co
ntra
cts;
(e
) le
asin
g by
non
-trad
ing
real
est
ate
com
pani
es
of u
nim
prov
ed p
rope
rty a
nd u
nfur
nish
ed
prem
ises
; (f
) op
erat
ions
inte
nded
to c
onve
y ta
ngib
le re
al
and
pers
onal
pro
perty
; (g
) sh
ippi
ng a
nd h
andl
ing
oper
atio
ns fo
r ex
ports
; (h
) pr
intin
g, im
ports
, and
sale
s of m
agaz
ines
an
d pe
riodi
cals
, exc
ludi
ng in
com
e fr
om
adve
rtisi
ng;
(i)
oper
atio
ns re
late
d to
pos
tage
stam
ps, t
ax
stam
ps, a
nd st
amp
pape
r iss
ued
by th
e st
ate;
(j)
de
posi
ts w
ith th
e C
entra
l Ban
k, th
e is
suin
g ag
ency
; (k
) se
rvic
es o
r ope
ratio
ns o
f a so
cial
, ed
ucat
iona
l, cu
ltura
l, ph
ilant
hrop
ic, o
r re
ligio
us n
atur
e pr
ovid
ed b
y no
npro
fit
orga
niza
tions
to th
eir m
embe
rs;
(l)
serv
ices
rela
ted
to th
e ex
erci
se o
f the
m
edic
al o
r par
amed
ical
pro
fess
ions
, ex
clud
ing
boar
ding
and
lodg
ing
expe
nses
; (m
) th
e fo
llow
ing
good
s: m
ilk, m
arga
rine,
bu
tter,
yogh
urt,
new
spap
ers,
new
sprin
t, ex
erci
se b
ooks
and
text
book
s, br
ead,
flou
r, gl
uten
, ric
e, m
edic
ines
, can
ned
sard
ines
and
pi
lcha
rds,
past
a, c
apita
l goo
ds fo
r ag
ricul
tura
l and
live
stoc
k re
arin
g ac
tiviti
es—
excl
udin
g fo
rest
ry a
nd fi
shin
g,
agric
ultu
ral f
ertil
izer
s and
pla
nt h
ealth
pr
oduc
ts d
esig
nate
d by
the
Min
istry
of
Agr
icul
ture
, cap
ital g
oods
of h
otel
and
to
uris
m e
nter
pris
es;
(n)
impo
rts o
f goo
ds e
xem
pted
und
er
Arti
cle
241
of th
e C
AEM
C C
usto
ms C
ode;
(o
) im
ports
of f
ishi
ng b
oats
and
airc
raft;
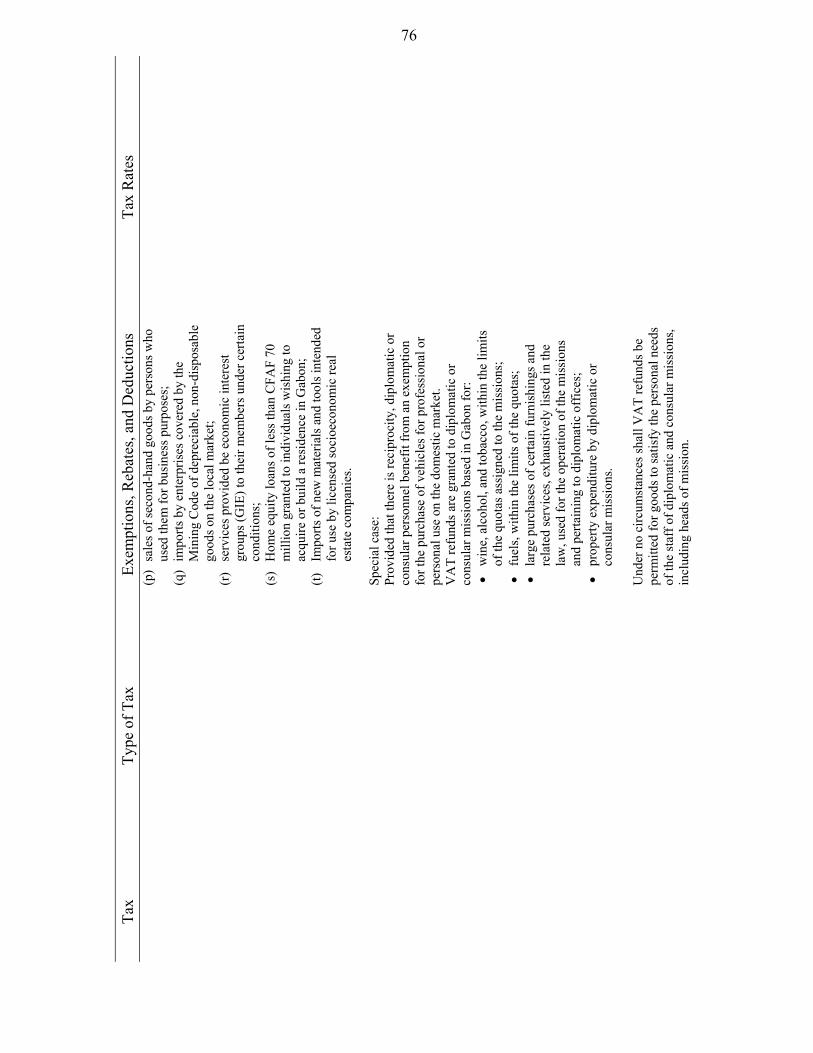
76
Tax
Type
of T
ax
Exem
ptio
ns, R
ebat
es, a
nd D
educ
tions
Ta
x R
ates
(p
) sa
les o
f sec
ond-
hand
goo
ds b
y pe
rson
s who
us
ed th
em fo
r bus
ines
s pur
pose
s;
(q)
impo
rts b
y en
terp
rises
cov
ered
by
the
Min
ing
Cod
e of
dep
reci
able
, non
-dis
posa
ble
good
s on
the
loca
l mar
ket;
(r)
serv
ices
pro
vide
d be
eco
nom
ic in
tere
st
grou
ps (G
IE) t
o th
eir m
embe
rs u
nder
cer
tain
co
nditi
ons;
(s
) H
ome
equi
ty lo
ans o
f les
s tha
n C
FAF
70
mill
ion
gran
ted
to in
divi
dual
s wis
hing
to
acqu
ire o
r bui
ld a
resi
denc
e in
Gab
on;
(t)
Impo
rts o
f new
mat
eria
ls a
nd to
ols i
nten
ded
for u
se b
y lic
ense
d so
cioe
cono
mic
real
es
tate
com
pani
es.
Spec
ial c
ase:
Pr
ovid
ed th
at th
ere
is re
cipr
ocity
, dip
lom
atic
or
cons
ular
per
sonn
el b
enef
it fr
om a
n ex
empt
ion
for t
he p
urch
ase
of v
ehic
les f
or p
rofe
ssio
nal o
r pe
rson
al u
se o
n th
e do
mes
tic m
arke
t. V
AT
refu
nds a
re g
rant
ed to
dip
lom
atic
or
cons
ular
mis
sion
s bas
ed in
Gab
on fo
r: •
win
e, a
lcoh
ol, a
nd to
bacc
o, w
ithin
the
limits
of
the
quot
as a
ssig
ned
to th
e m
issi
ons;
•
fuel
s, w
ithin
the
limits
of t
he q
uota
s;
• la
rge
purc
hase
s of c
erta
in fu
rnis
hing
s and
re
late
d se
rvic
es, e
xhau
stiv
ely
liste
d in
the
law
, use
d fo
r the
ope
ratio
n of
the
mis
sion
s an
d pe
rtain
ing
to d
iplo
mat
ic o
ffic
es;
• pr
oper
ty e
xpen
ditu
re b
y di
plom
atic
or
cons
ular
mis
sion
s. Und
er n
o ci
rcum
stan
ces s
hall
VA
T re
fund
s be
perm
itted
for g
oods
to sa
tisfy
the
pers
onal
nee
ds
of th
e st
aff o
f dip
lom
atic
and
con
sula
r mis
sion
s, in
clud
ing
head
s of m
issi
on.
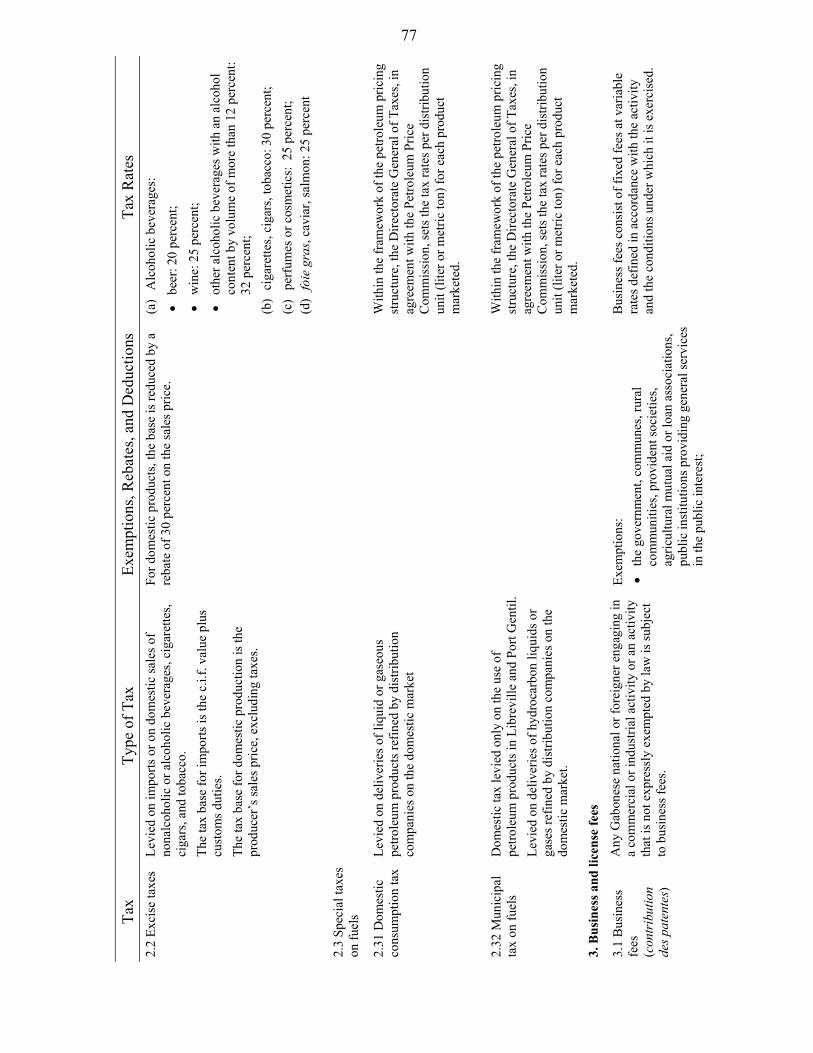
77
Tax
Type
of T
ax
Exem
ptio
ns, R
ebat
es, a
nd D
educ
tions
Ta
x R
ates
2.
2 Ex
cise
taxe
s Le
vied
on
impo
rts o
r on
dom
estic
sale
s of
nona
lcoh
olic
or a
lcoh
olic
bev
erag
es, c
igar
ette
s, ci
gars
, and
toba
cco.
Th
e ta
x ba
se fo
r im
ports
is th
e c.
i.f. v
alue
plu
s cu
stom
s dut
ies.
The
tax
base
for d
omes
tic p
rodu
ctio
n is
the
prod
ucer
’s sa
les p
rice,
exc
ludi
ng ta
xes.
For d
omes
tic p
rodu
cts,
the
base
is re
duce
d by
a
reba
te o
f 30
perc
ent o
n th
e sa
les p
rice.
(a
) A
lcoh
olic
bev
erag
es:
• be
er: 2
0 pe
rcen
t; •
win
e: 2
5 pe
rcen
t; •
othe
r alc
ohol
ic b
ever
ages
with
an
alco
hol
cont
ent b
y vo
lum
e of
mor
e th
an 1
2 pe
rcen
t: 32
per
cent
; (b
) ci
gare
ttes,
ciga
rs, t
obac
co: 3
0 pe
rcen
t; (c
) pe
rfum
es o
r cos
met
ics:
25
perc
ent;
(d)
foie
gra
s, ca
viar
, sal
mon
: 25
perc
ent
2.
3 Sp
ecia
l tax
es
on fu
els
2.31
Dom
estic
co
nsum
ptio
n ta
x Le
vied
on
deliv
erie
s of l
iqui
d or
gas
eous
pe
trole
um p
rodu
cts r
efin
ed b
y di
strib
utio
n co
mpa
nies
on
the
dom
estic
mar
ket
W
ithin
the
fram
ewor
k of
the
petro
leum
pric
ing
stru
ctur
e, th
e D
irect
orat
e G
ener
al o
f Tax
es, i
n ag
reem
ent w
ith th
e Pe
trole
um P
rice
Com
mis
sion
, set
s the
tax
rate
s per
dis
tribu
tion
unit
(lite
r or m
etric
ton)
for e
ach
prod
uct
mar
kete
d.
2.
32 M
unic
ipal
ta
x on
fuel
s D
omes
tic ta
x le
vied
onl
y on
the
use
of
petro
leum
pro
duct
s in
Libr
evill
e an
d Po
rt G
entil
. Le
vied
on
deliv
erie
s of h
ydro
carb
on li
quid
s or
gase
s ref
ined
by
dist
ribut
ion
com
pani
es o
n th
e do
mes
tic m
arke
t.
W
ithin
the
fram
ewor
k of
the
petro
leum
pric
ing
stru
ctur
e, th
e D
irect
orat
e G
ener
al o
f Tax
es, i
n ag
reem
ent w
ith th
e Pe
trole
um P
rice
Com
mis
sion
, set
s the
tax
rate
s per
dis
tribu
tion
unit
(lite
r or m
etric
ton)
for e
ach
prod
uct
mar
kete
d.
3. B
usin
ess a
nd li
cens
e fe
es
3.1
Bus
ines
s fe
es
(con
trib
utio
n de
s pat
ente
s)
Any
Gab
ones
e na
tiona
l or f
orei
gner
eng
agin
g in
a
com
mer
cial
or i
ndus
trial
act
ivity
or a
n ac
tivity
th
at is
not
exp
ress
ly e
xem
pted
by
law
is su
bjec
t to
bus
ines
s fee
s.
Exem
ptio
ns:
• th
e go
vern
men
t, co
mm
unes
, rur
al
com
mun
ities
, pro
vide
nt so
ciet
ies,
agric
ultu
ral m
utua
l aid
or l
oan
asso
ciat
ions
, pu
blic
inst
itutio
ns p
rovi
ding
gen
eral
serv
ices
in
the
publ
ic in
tere
st;
Bus
ines
s fee
s con
sist
of f
ixed
fees
at v
aria
ble
rate
s def
ined
in a
ccor
danc
e w
ith th
e ac
tivity
an
d th
e co
nditi
ons u
nder
whi
ch it
is e
xerc
ised
.

78
Tax
Type
of T
ax
Exem
ptio
ns, R
ebat
es, a
nd D
educ
tions
Ta
x R
ates
B
usin
ess f
ees a
re p
erso
nal.
Each
est
ablis
hmen
t of t
he b
usin
ess m
ust p
ay
busi
ness
fees
. How
ever
, if s
ever
al a
ctiv
ities
are
ca
rrie
d ou
t with
in th
e sa
me
esta
blis
hmen
t, th
e ta
xpay
er is
subj
ect o
nly
to th
e hi
ghes
t fix
ed ta
x.
Bus
ines
s fee
s for
the
full
year
from
eac
h ta
xpay
er e
xerc
isin
g a
taxa
ble
activ
ity a
re d
ue in
th
e fir
st q
uarte
r of t
he y
ear.
For n
ew a
ctiv
ities
, bus
ines
s fee
s are
due
onl
y fr
om th
e fir
st d
ay o
f the
qua
rter i
n w
hich
the
activ
ity st
arte
d.
For s
easo
nal a
ctiv
ities
, bus
ines
s fee
s are
not
pro
ra
ted.
A
n in
stal
lmen
t of t
he b
usin
ess f
ees e
qual
to 1
00
perc
ent o
f the
pre
viou
s yea
r’s f
ees m
ust b
e pa
id
by M
arch
31.
The
bal
ance
is a
sses
sed
thro
ugh
the
tax
rolls
afte
r the
tax
retu
rn fo
r the
yea
r is
filed
. B
usin
ess f
ees a
re le
vied
on
beha
lf of
loca
l go
vern
men
ts, c
omm
unes
, and
dep
artm
ents
.
• th
e of
ficia
ls a
nd e
mpl
oyee
s of t
hese
serv
ices
an
d es
tabl
ishm
ents
in th
e co
ntex
t of t
heir
func
tions
; •
mas
ter c
ontra
ctor
s of t
rade
ass
ocia
tions
, with
th
e sa
me
prov
iso;
•
pain
ters
, scu
lpto
rs, d
esig
ners
, eng
rave
rs,
cons
ider
ed a
rtist
s who
sell
only
the
prod
ucts
of
thei
r arti
stry
; •
licen
sed
teac
hers
of l
itera
ture
, sci
ence
, and
ar
t, m
ajor
indu
stria
lists
, hea
ds o
f ins
titut
ions
, bo
ardi
ng sc
hool
prin
cipa
ls;
• m
idw
ives
, nur
ses;
•
lyric
ists
and
dra
mat
ists
; •
crop
and
live
stoc
k fa
rmer
s onl
y w
ithin
the
fram
ewor
k of
thei
r agr
icul
tura
l act
ivity
re
late
d to
the
land
and
live
stoc
k th
ey u
se o
r re
ar th
emse
lves
, exc
ludi
ng a
ny m
arke
ting
of
prod
ucts
from
a th
ird p
arty
; •
owne
rs o
r far
mer
s of s
alt p
ans;
•
owne
rs o
r ten
ants
occ
asio
nally
subl
ettin
g a
furn
ishe
d pa
rt of
thei
r per
sona
l res
iden
ce;
• fis
herm
en o
r piro
gue-
men
; •
partn
ers o
f gen
eral
and
lim
ited
partn
ersh
ips
or p
ublic
lim
ited
com
pani
es;
• du
ly a
utho
rized
savi
ngs b
anks
, pro
vide
nt
fund
s, m
anag
ed fr
ee o
f cha
rge,
and
mut
ual
insu
ranc
e co
mpa
nies
; •
capt
ains
of c
omm
erci
al v
esse
ls o
pera
ting
on
beha
lf of
third
par
ties,
ship
s’ c
apta
ins;
•
cant
een
oper
ator
s atta
ched
to th
e ar
my,
whe
n th
ey d
o no
t sel
l alc
ohol
; •
publ
ic o
r priv
ate
esta
blis
hmen
ts th
at ta
ke in
po
or c
hild
ren
for v
ocat
iona
l tra
inin
g;
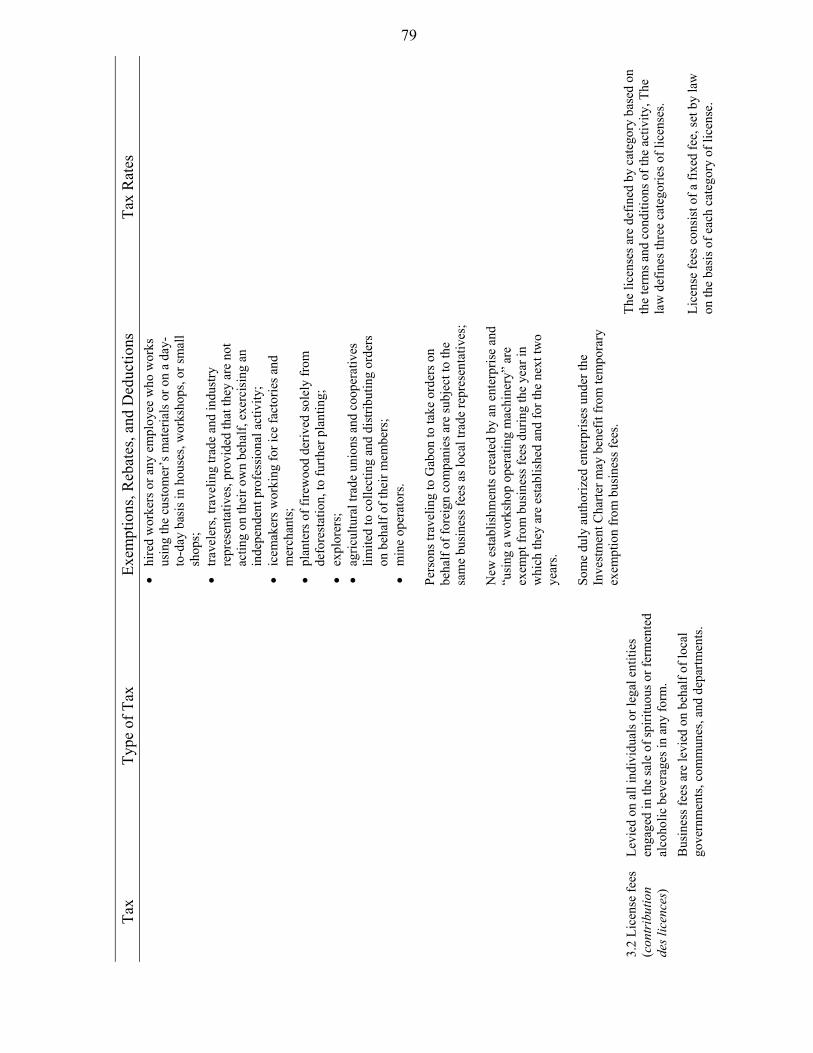
79
Tax
Type
of T
ax
Exem
ptio
ns, R
ebat
es, a
nd D
educ
tions
Ta
x R
ates
•
hire
d w
orke
rs o
r any
em
ploy
ee w
ho w
orks
us
ing
the
cust
omer
’s m
ater
ials
or o
n a
day-
to-d
ay b
asis
in h
ouse
s, w
orks
hops
, or s
mal
l sh
ops;
•
trave
lers
, tra
velin
g tra
de a
nd in
dust
ry
repr
esen
tativ
es, p
rovi
ded
that
they
are
not
ac
ting
on th
eir o
wn
beha
lf, e
xerc
isin
g an
in
depe
nden
t pro
fess
iona
l act
ivity
; •
icem
aker
s wor
king
for i
ce fa
ctor
ies a
nd
mer
chan
ts;
• pl
ante
rs o
f fire
woo
d de
rived
sole
ly fr
om
defo
rest
atio
n, to
furth
er p
lant
ing;
•
expl
orer
s;
• ag
ricul
tura
l tra
de u
nion
s and
coo
pera
tives
lim
ited
to c
olle
ctin
g an
d di
strib
utin
g or
ders
on
beh
alf o
f the
ir m
embe
rs;
• m
ine
oper
ator
s. Pe
rson
s tra
velin
g to
Gab
on to
take
ord
ers o
n be
half
of fo
reig
n co
mpa
nies
are
subj
ect t
o th
e sa
me
busi
ness
fees
as l
ocal
trad
e re
pres
enta
tives
; N
ew e
stab
lishm
ents
cre
ated
by
an e
nter
pris
e an
d “u
sing
a w
orks
hop
oper
atin
g m
achi
nery
” ar
e ex
empt
from
bus
ines
s fee
s dur
ing
the
year
in
whi
ch th
ey a
re e
stab
lishe
d an
d fo
r the
nex
t tw
o ye
ars.
Som
e du
ly a
utho
rized
ent
erpr
ises
und
er th
e In
vest
men
t Cha
rter m
ay b
enef
it fr
om te
mpo
rary
ex
empt
ion
from
bus
ines
s fee
s. 3.
2 Li
cens
e fe
es
(con
trib
utio
n de
s lic
ence
s)
Levi
ed o
n al
l ind
ivid
uals
or l
egal
ent
ities
en
gage
d in
the
sale
of s
pirit
uous
or f
erm
ente
d al
coho
lic b
ever
ages
in a
ny fo
rm.
Bus
ines
s fee
s are
levi
ed o
n be
half
of lo
cal
gove
rnm
ents
, com
mun
es, a
nd d
epar
tmen
ts.
Th
e lic
ense
s are
def
ined
by
cate
gory
bas
ed o
n th
e te
rms a
nd c
ondi
tions
of t
he a
ctiv
ity, T
he
law
def
ines
thre
e ca
tego
ries o
f lic
ense
s. Li
cens
e fe
es c
onsi
st o
f a fi
xed
fee,
set b
y la
w
on th
e ba
sis o
f eac
h ca
tego
ry o
f lic
ense
.
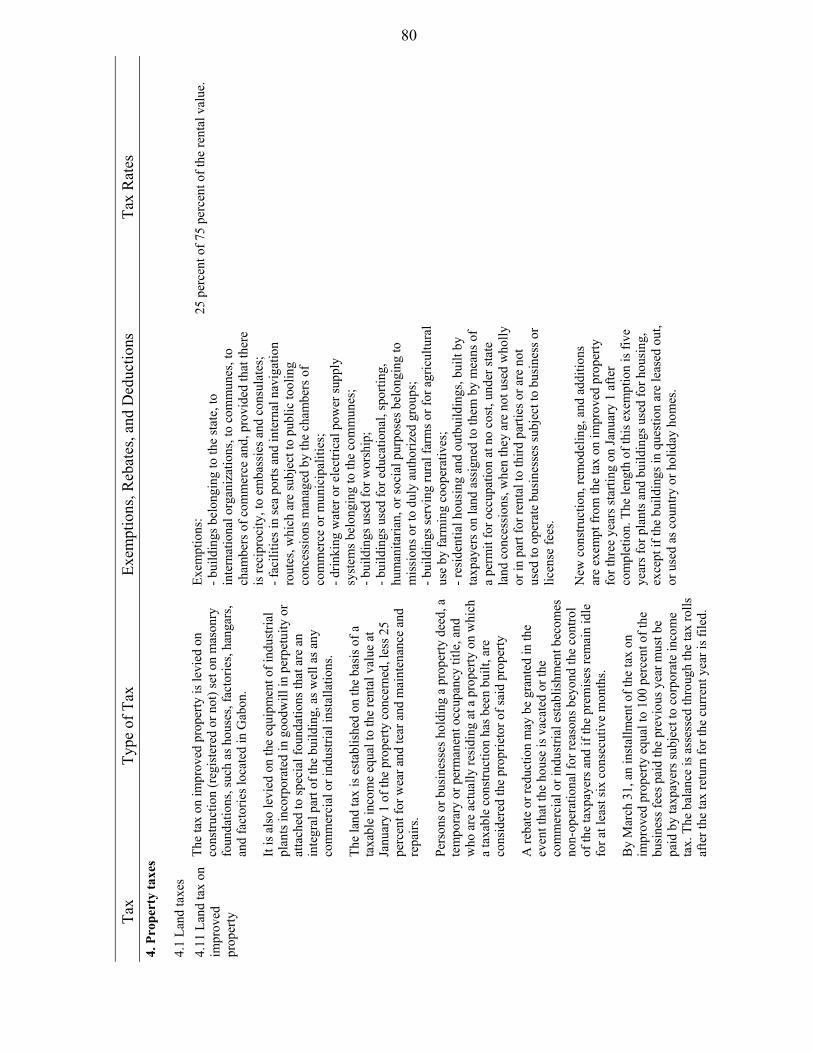
80
Tax
Type
of T
ax
Exem
ptio
ns, R
ebat
es, a
nd D
educ
tions
Ta
x R
ates
4.
Pro
pert
y ta
xes
4.1
Land
taxe
s
4.11
Lan
d ta
x on
im
prov
ed
prop
erty
The
tax
on im
prov
ed p
rope
rty is
levi
ed o
n co
nstru
ctio
n (r
egis
tere
d or
not
) set
on
mas
onry
fo
unda
tions
, suc
h as
hou
ses,
fact
orie
s, ha
ngar
s, an
d fa
ctor
ies l
ocat
ed in
Gab
on.
It is
als
o le
vied
on
the
equi
pmen
t of i
ndus
trial
pl
ants
inco
rpor
ated
in g
oodw
ill in
per
petu
ity o
r at
tach
ed to
spec
ial f
ound
atio
ns th
at a
re a
n in
tegr
al p
art o
f the
bui
ldin
g, a
s wel
l as a
ny
com
mer
cial
or i
ndus
trial
inst
alla
tions
. Th
e la
nd ta
x is
est
ablis
hed
on th
e ba
sis o
f a
taxa
ble
inco
me
equa
l to
the
rent
al v
alue
at
Janu
ary
1 of
the
prop
erty
con
cern
ed, l
ess 2
5 pe
rcen
t for
wea
r and
tear
and
mai
nten
ance
and
re
pairs
. Pe
rson
s or b
usin
esse
s hol
ding
a p
rope
rty d
eed,
a
tem
pora
ry o
r per
man
ent o
ccup
ancy
title
, and
w
ho a
re a
ctua
lly re
sidi
ng a
t a p
rope
rty o
n w
hich
a
taxa
ble
cons
truct
ion
has b
een
built
, are
co
nsid
ered
the
prop
rieto
r of s
aid
prop
erty
A
reba
te o
r red
uctio
n m
ay b
e gr
ante
d in
the
even
t tha
t the
hou
se is
vac
ated
or t
he
com
mer
cial
or i
ndus
trial
est
ablis
hmen
t bec
omes
no
n-op
erat
iona
l for
reas
ons b
eyon
d th
e co
ntro
l of
the
taxp
ayer
s and
if th
e pr
emis
es re
mai
n id
le
for a
t lea
st si
x co
nsec
utiv
e m
onth
s. B
y M
arch
31,
an
inst
allm
ent o
f the
tax
on
impr
oved
pro
perty
equ
al to
100
per
cent
of t
he
busi
ness
fees
pai
d th
e pr
evio
us y
ear m
ust b
e pa
id b
y ta
xpay
ers s
ubje
ct to
cor
pora
te in
com
e ta
x. T
he b
alan
ce is
ass
esse
d th
roug
h th
e ta
x ro
lls
afte
r the
tax
retu
rn fo
r the
cur
rent
yea
r is f
iled.
Exem
ptio
ns:
- bui
ldin
gs b
elon
ging
to th
e st
ate,
to
inte
rnat
iona
l org
aniz
atio
ns, t
o co
mm
unes
, to
cham
bers
of c
omm
erce
and
, pro
vide
d th
at th
ere
is re
cipr
ocity
, to
emba
ssie
s and
con
sula
tes;
- f
acili
ties i
n se
a po
rts a
nd in
tern
al n
avig
atio
n ro
utes
, whi
ch a
re su
bjec
t to
publ
ic to
olin
g co
nces
sion
s man
aged
by
the
cham
bers
of
com
mer
ce o
r mun
icip
aliti
es;
- drin
king
wat
er o
r ele
ctric
al p
ower
supp
ly
syst
ems b
elon
ging
to th
e co
mm
unes
; - b
uild
ings
use
d fo
r wor
ship
; - b
uild
ings
use
d fo
r edu
catio
nal,
spor
ting,
hu
man
itaria
n, o
r soc
ial p
urpo
ses b
elon
ging
to
mis
sion
s or t
o du
ly a
utho
rized
gro
ups;
- b
uild
ings
serv
ing
rura
l far
ms o
r for
agr
icul
tura
l us
e by
farm
ing
coop
erat
ives
; - r
esid
entia
l hou
sing
and
out
build
ings
, bui
lt by
ta
xpay
ers o
n la
nd a
ssig
ned
to th
em b
y m
eans
of
a pe
rmit
for o
ccup
atio
n at
no
cost
, und
er st
ate
land
con
cess
ions
, whe
n th
ey a
re n
ot u
sed
who
lly
or in
par
t for
rent
al to
third
par
ties o
r are
not
us
ed to
ope
rate
bus
ines
ses s
ubje
ct to
bus
ines
s or
licen
se fe
es.
New
con
stru
ctio
n, re
mod
elin
g, a
nd a
dditi
ons
are
exem
pt fr
om th
e ta
x on
impr
oved
pro
perty
fo
r thr
ee y
ears
star
ting
on Ja
nuar
y 1
afte
r co
mpl
etio
n. T
he le
ngth
of t
his e
xem
ptio
n is
five
ye
ars f
or p
lant
s and
bui
ldin
gs u
sed
for h
ousi
ng,
exce
pt if
the
build
ings
in q
uest
ion
are
leas
ed o
ut,
or u
sed
as c
ount
ry o
r hol
iday
hom
es.
25 p
erce
nt o
f 75
perc
ent o
f the
rent
al v
alue
.

81
Tax
Type
of T
ax
Exem
ptio
ns, R
ebat
es, a
nd D
educ
tions
Ta
x R
ates
4.
12 L
and
tax
unim
prov
ed
prop
erty
The
land
tax
on u
nim
prov
ed p
rope
rty is
ass
esse
d on
all
type
s of u
nim
prov
ed p
rope
rty, e
xcep
t pr
oper
ty u
nder
pro
visi
onal
con
cess
ions
. Pe
rson
s or b
usin
esse
s hol
ding
a p
rope
rty d
eed,
a
tem
pora
ry o
r per
man
ent o
ccup
ancy
title
, and
w
ho a
re o
ccup
ying
the
prop
erty
in th
eir o
wn
right
are
con
side
red
the
prop
rieto
r of s
aid
prop
erty
. Th
e ta
x is
ass
esse
d on
a b
ase
equi
vale
nt to
4/5
of
the
rent
al v
alue
, whi
ch it
self
is e
qual
to
10 p
erce
nt o
f the
mar
ket v
alue
of t
he
unim
prov
ed p
rope
rty.
The
land
tax
on u
nim
prov
ed p
rope
rty is
levi
ed
on ta
xpay
ers o
f the
cor
pora
te in
com
e ta
x an
d su
bjec
t to
paym
ent o
f an
inst
allm
ent b
y M
arch
31
equa
l to
100
perc
ent o
f the
bus
ines
s fe
es p
aid
the
year
bef
ore.
The
bal
ance
is
asse
ssed
thro
ugh
the
tax
rolls
afte
r the
tax
retu
rn
for t
he c
urre
nt y
ear i
s file
d.
Exem
ptio
ns:
(a)
stre
ets,
publ
ic p
lace
s, ro
ads,
and
river
s;
(b)
prop
erty
bel
ongi
ng to
the
stat
e, to
in
tern
atio
nal o
rgan
izat
ions
, to
com
mun
es, t
o ch
ambe
rs o
f com
mer
ce a
nd, p
rovi
ded
that
th
ere
is re
cipr
ocity
, to
emba
ssie
s and
co
nsul
ates
; (c
) th
e la
nd o
n w
hich
any
bui
ldin
gs si
t and
the
land
surr
ound
ing
thes
e ed
ifice
s;
(d)
land
use
d fo
r edu
catio
nal,
spor
ting,
hu
man
itaria
n, o
r soc
ial p
urpo
ses b
elon
ging
to
mis
sion
s or d
uly
auth
oriz
ed g
roup
s;
(e)
land
with
a su
rfac
e ar
ea o
f les
s tha
n 5
hect
ares
, with
in a
radi
us o
f 25
kilo
met
ers o
f ur
ban
deve
lopm
ents
, use
d ex
clus
ivel
y fo
r m
arke
t gar
deni
ng;
(f)
the
surf
ace
area
of q
uarr
ies a
nd m
ines
; (g
) la
nd g
rant
ed u
nder
per
mits
for n
o-co
st
occu
patio
n in
the
cont
ext o
f sta
te la
nd
conc
essi
ons.
Land
loca
ted
outs
ide
urba
n ce
nter
s and
rece
ntly
us
ed fo
r rea
ring
cattl
e or
cle
ared
and
sow
ed, i
s te
mpo
raril
y ex
empt
from
the
land
tax
on
unim
prov
ed p
rope
rty. D
epen
ding
on
the
use
of
this
land
, the
dur
atio
n of
the
exem
ptio
n ra
nges
fr
om th
ree
to fi
ve y
ears
.
25 p
erce
nt o
f 80
perc
ent o
f the
rent
al v
alue
, w
hich
is e
stim
ated
at 1
0 pe
rcen
t of t
he m
arke
t va
lue.
4.2
Land
tax
Levi
ed o
n bu
ildin
g la
nd, p
layg
roun
ds, a
nd
unus
ed la
nd.
Bui
ldin
g la
nd is
con
side
red
to b
e an
y la
nd
loca
ted
with
in th
e pe
rimet
er o
f urb
an c
ente
rs o
n w
hich
ther
e is
no
cons
truct
ion,
eve
n if
the
land
is
encl
osed
and
mai
ntai
ned.
Exem
pt fr
om la
nd ta
x ar
e:
• la
nd su
bjec
t to
prov
isio
nal g
rant
s;
• la
nd e
xem
pt fr
om th
e la
nd ta
x on
un
impr
oved
pro
perty
(CFP
NB
); •
land
for c
omm
erci
al a
nd in
dust
rial u
se, s
uch
• C
FAF
200
per m
² for
firs
t cla
ss u
rban
land
; •
CFA
F 40
per
m² f
or se
cond
cla
ss u
rban
la
nd;
• C
FAF
1000
per
hec
tare
for r
ural
land
.
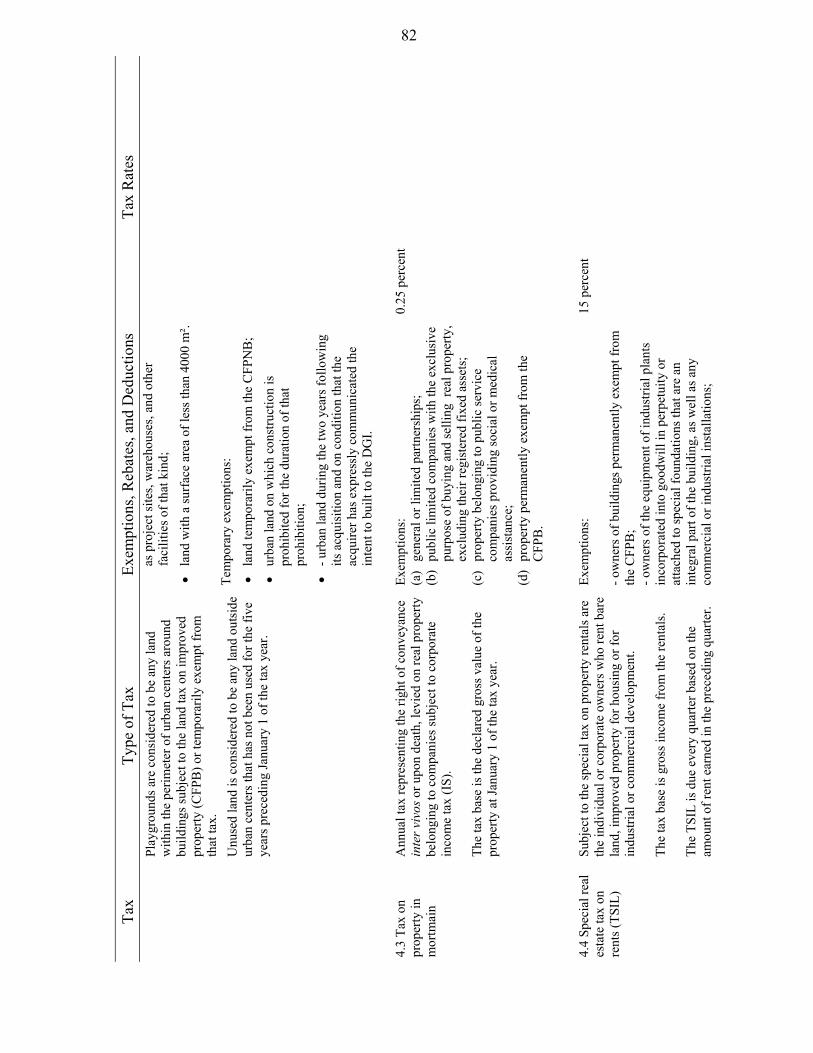
82
Tax
Type
of T
ax
Exem
ptio
ns, R
ebat
es, a
nd D
educ
tions
Ta
x R
ates
Pl
aygr
ound
s are
con
side
red
to b
e an
y la
nd
with
in th
e pe
rimet
er o
f urb
an c
ente
rs a
roun
d bu
ildin
gs su
bjec
t to
the
land
tax
on im
prov
ed
prop
erty
(CFP
B) o
r tem
pora
rily
exem
pt fr
om
that
tax.
U
nuse
d la
nd is
con
side
red
to b
e an
y la
nd o
utsi
de
urba
n ce
nter
s tha
t has
not
bee
n us
ed fo
r the
five
ye
ars p
rece
ding
Janu
ary
1 of
the
tax
year
.
as p
roje
ct si
tes,
war
ehou
ses,
and
othe
r fa
cilit
ies o
f tha
t kin
d;
• la
nd w
ith a
surf
ace
area
of l
ess t
han
4000
m².
Tem
pora
ry e
xem
ptio
ns:
• la
nd te
mpo
raril
y ex
empt
from
the
CFP
NB
; •
urba
n la
nd o
n w
hich
con
stru
ctio
n is
pr
ohib
ited
for t
he d
urat
ion
of th
at
proh
ibiti
on;
• - u
rban
land
dur
ing
the
two
year
s fol
low
ing
its a
cqui
sitio
n an
d on
con
ditio
n th
at th
e ac
quire
r has
exp
ress
ly c
omm
unic
ated
the
inte
nt to
bui
lt to
the
DG
I. 4.
3 Ta
x on
pr
oper
ty in
m
ortm
ain
Ann
ual t
ax re
pres
entin
g th
e rig
ht o
f con
veya
nce
inte
r viv
os o
r upo
n de
ath,
levi
ed o
n re
al p
rope
rty
belo
ngin
g to
com
pani
es su
bjec
t to
corp
orat
e in
com
e ta
x (I
S).
The
tax
base
is th
e de
clar
ed g
ross
val
ue o
f the
pr
oper
ty a
t Jan
uary
1 o
f the
tax
year
.
Exem
ptio
ns:
(a)
gene
ral o
r lim
ited
partn
ersh
ips;
(b
) pu
blic
lim
ited
com
pani
es w
ith th
e ex
clus
ive
purp
ose
of b
uyin
g an
d se
lling
rea
l pro
perty
, ex
clud
ing
thei
r reg
iste
red
fixed
ass
ets;
(c
) pr
oper
ty b
elon
ging
to p
ublic
serv
ice
com
pani
es p
rovi
ding
soci
al o
r med
ical
as
sist
ance
; (d
) pr
oper
ty p
erm
anen
tly e
xem
pt fr
om th
e C
FPB
.
0.25
per
cent
4.4
Spec
ial r
eal
esta
te ta
x on
re
nts (
TSIL
)
Subj
ect t
o th
e sp
ecia
l tax
on
prop
erty
rent
als a
re
the
indi
vidu
al o
r cor
pora
te o
wne
rs w
ho re
nt b
are
land
, im
prov
ed p
rope
rty fo
r hou
sing
or f
or
indu
stria
l or c
omm
erci
al d
evel
opm
ent.
The
tax
base
is g
ross
inco
me
from
the
rent
als.
The
TSIL
is d
ue e
very
qua
rter b
ased
on
the
amou
nt o
f ren
t ear
ned
in th
e pr
eced
ing
quar
ter.
Exem
ptio
ns:
- ow
ners
of b
uild
ings
per
man
ently
exe
mpt
from
th
e C
FPB
; - o
wne
rs o
f the
equ
ipm
ent o
f ind
ustri
al p
lant
s in
corp
orat
ed in
to g
oodw
ill in
per
petu
ity o
r at
tach
ed to
spec
ial f
ound
atio
ns th
at a
re a
n in
tegr
al p
art o
f the
bui
ldin
g, a
s wel
l as a
ny
com
mer
cial
or i
ndus
trial
inst
alla
tions
;
15 p
erce
nt

83
Tax
Type
of T
ax
Exem
ptio
ns, R
ebat
es, a
nd D
educ
tions
Ta
x R
ates
Fo
r ren
tals
to th
e st
ate,
the
TSIL
is w
ithhe
ld b
y th
e Tr
easu
ry w
hen
rent
s are
dep
osite
d to
the
owne
rs.
- VA
T ta
xpay
ers w
ho re
nt b
are
land
, im
prov
ed
prop
erty
for h
ousi
ng o
r for
indu
stria
l or
com
mer
cial
ent
erpr
ises
, if s
aid
prop
erty
is
incl
uded
in th
eir a
sset
s. Th
e TS
IL is
ded
ucte
d fr
om in
com
e su
bjec
t to
corp
orat
e or
per
sona
l inc
ome
tax.
5. R
ecor
ding
taxe
s
Ta
xes a
re fi
xed,
pro
gres
sive
, or p
ropo
rtion
al,
depe
ndin
g on
the
natu
re o
f the
act
s and
thei
r am
endm
ents
. Fi
xed
taxe
s app
ly to
“ac
ts re
cord
ing
no tr
ansf
er
of o
wne
rshi
p, u
sufr
uct o
r enj
oym
ent o
f per
sona
l or
real
pro
perty
, no
oblig
atio
n, n
o pe
cuni
ary
or
othe
r jud
gmen
t for
val
ue, n
o ac
quis
ition
s by
mar
riage
, no
acqu
isiti
ons o
f equ
ity, n
o sh
arin
g of
pe
rson
al o
r rea
l pro
perty
, and
, gen
eral
ly, a
ny
othe
r act
s, ev
en th
ose
exem
pt fr
om re
cord
ing,
w
hich
are
vol
unta
rily
subm
itted
to th
is
form
ality
.”
Prog
ress
ive
or p
ropo
rtion
al ta
xes a
re le
vied
“on
tra
nsfe
rs o
f the
enj
oym
ent o
f per
sona
l or r
eal
prop
erty
, int
er v
ivos
or u
pon
deat
h, o
blig
atio
ns,
pecu
niar
y or
oth
er ju
dgm
ents
for v
alue
, as w
ell
acts
repr
esen
ting
acqu
isiti
ons t
hrou
gh m
arria
ge,
acqu
isiti
ons o
f equ
ity, d
ivis
ion
of p
erso
nal a
nd
real
pro
perty
. The
taxe
s are
levi
ed o
n th
e va
lue.
”
Som
e ac
ts a
re re
cord
ed fr
ee o
f cha
rge:
•
leas
e co
ntra
cts a
nd tr
ansf
ers p
rofit
ing
the
Rep
ublic
of G
abon
, its
com
mun
es o
r pub
lic
esta
blis
hmen
ts;
• th
e ac
ts o
f cer
tain
inte
rnat
iona
l org
aniz
atio
ns
(ED
F, B
EAC
, etc
.);
• B
GD
and
S.N
I; •
any
judg
men
ts h
ande
d do
wn
in la
bor
acci
dent
or f
amily
allo
wan
ce c
ases
; •
leas
es a
nd tr
ansf
ers t
o pr
ivat
e in
divi
dual
s at
low
pric
es o
r ren
ts;
• ca
pita
l inv
este
d in
mut
ual f
unds
; •
trans
fers
of s
hare
s in
mut
ual f
unds
whe
n th
ese
are
held
by
indi
vidu
als r
esid
ent i
n G
abon
.
The
amou
nts o
f the
fixe
d ta
xes r
ange
from
C
FAF
5000
to C
FAF
5000
0, d
epen
ding
on
the
natu
re o
f the
act
s inv
olve
d.
Prog
ress
ive
taxe
s inc
reas
e by
tax
brac
ket a
nd
are
appl
ied
in a
ccor
danc
e w
ith a
scal
e es
tabl
ishe
d by
the
finan
ce m
inis
try.
Prop
ortio
nal t
axes
fall
with
in a
rang
e of
1-
6 pe
rcen
t.
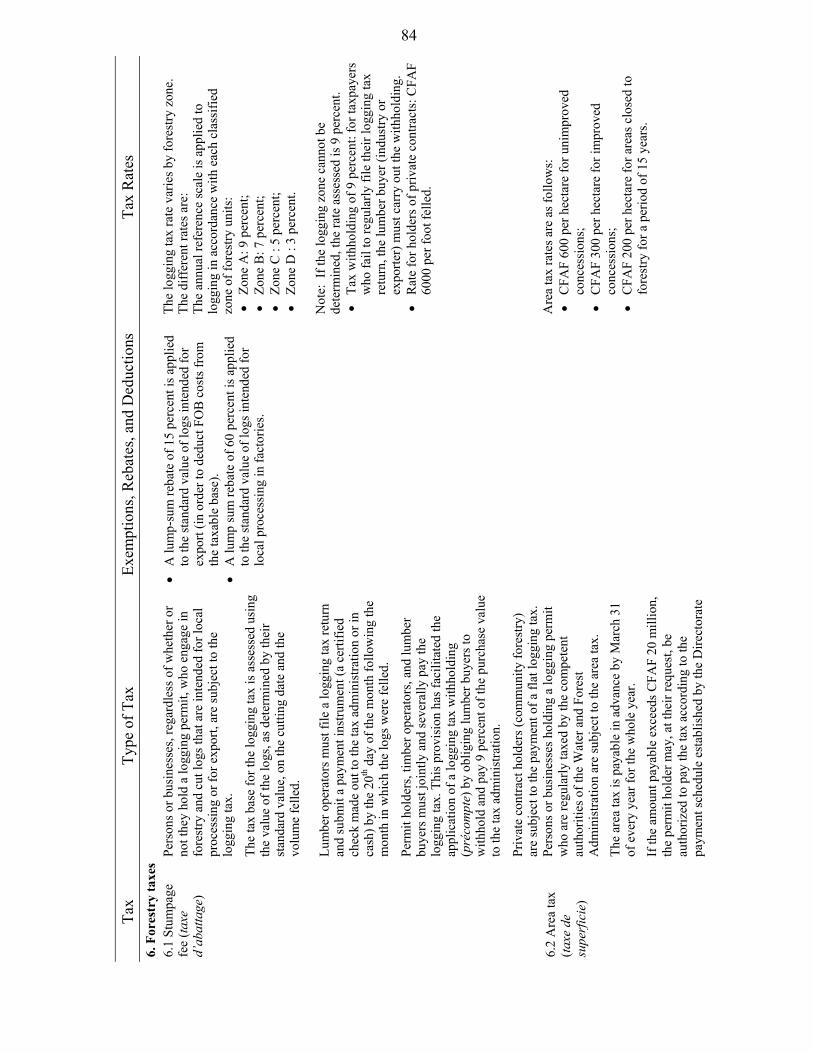
84
Tax
Type
of T
ax
Exem
ptio
ns, R
ebat
es, a
nd D
educ
tions
Ta
x R
ates
6.
For
estr
y ta
xes
6.1
Stum
page
fe
e (ta
xe
d’ab
atta
ge)
Pers
ons o
r bus
ines
ses,
rega
rdle
ss o
f whe
ther
or
not t
hey
hold
a lo
ggin
g pe
rmit,
who
eng
age
in
fore
stry
and
cut
logs
that
are
inte
nded
for l
ocal
pr
oces
sing
or f
or e
xpor
t, ar
e su
bjec
t to
the
logg
ing
tax.
Th
e ta
x ba
se fo
r the
logg
ing
tax
is a
sses
sed
usin
g th
e va
lue
of th
e lo
gs, a
s det
erm
ined
by
thei
r st
anda
rd v
alue
, on
the
cutti
ng d
ate
and
the
volu
me
felle
d.
Lum
ber o
pera
tors
mus
t file
a lo
ggin
g ta
x re
turn
an
d su
bmit
a pa
ymen
t ins
trum
ent (
a ce
rtifie
d ch
eck
mad
e ou
t to
the
tax
adm
inis
tratio
n or
in
cash
) by
the
20th
day
of t
he m
onth
follo
win
g th
e m
onth
in w
hich
the
logs
wer
e fe
lled.
Pe
rmit
hold
ers,
timbe
r ope
rato
rs, a
nd lu
mbe
r bu
yers
mus
t joi
ntly
and
seve
rally
pay
the
logg
ing
tax.
Thi
s pro
visi
on h
as fa
cilit
ated
the
appl
icat
ion
of a
logg
ing
tax
with
hold
ing
(pré
com
pte)
by
oblig
ing
lum
ber b
uyer
s to
with
hold
and
pay
9 p
erce
nt o
f the
pur
chas
e va
lue
to th
e ta
x ad
min
istra
tion.
Pr
ivat
e co
ntra
ct h
olde
rs (c
omm
unity
fore
stry
) ar
e su
bjec
t to
the
paym
ent o
f a fl
at lo
ggin
g ta
x.
• A
lum
p-su
m re
bate
of 1
5 pe
rcen
t is a
pplie
d to
the
stan
dard
val
ue o
f log
s int
ende
d fo
r ex
port
(in o
rder
to d
educ
t FO
B c
osts
from
th
e ta
xabl
e ba
se).
• A
lum
p su
m re
bate
of 6
0 pe
rcen
t is a
pplie
d to
the
stan
dard
val
ue o
f log
s int
ende
d fo
r lo
cal p
roce
ssin
g in
fact
orie
s.
The
logg
ing
tax
rate
var
ies b
y fo
rest
ry z
one.
Th
e di
ffer
ent r
ates
are
: Th
e an
nual
refe
renc
e sc
ale
is a
pplie
d to
lo
ggin
g in
acc
orda
nce
with
eac
h cl
assi
fied
zone
of f
ores
try u
nits
: •
Zone
A: 9
per
cent
; •
Zone
B: 7
per
cent
; •
Zone
C :
5 pe
rcen
t; •
Zone
D :
3 pe
rcen
t. N
ote:
If t
he lo
ggin
g zo
ne c
anno
t be
dete
rmin
ed, t
he ra
te a
sses
sed
is 9
per
cent
. •
Tax
with
hold
ing
of 9
per
cent
: for
taxp
ayer
s w
ho fa
il to
regu
larly
file
thei
r log
ging
tax
retu
rn, t
he lu
mbe
r buy
er (i
ndus
try o
r ex
porte
r) m
ust c
arry
out
the
with
hold
ing.
•
Rat
e fo
r hol
ders
of p
rivat
e co
ntra
cts:
CFA
F 60
00 p
er fo
ot fe
lled.
6.2
Are
a ta
x (ta
xe d
e su
perf
icie
)
Pers
ons o
r bus
ines
ses h
oldi
ng a
logg
ing
perm
it w
ho a
re re
gula
rly ta
xed
by th
e co
mpe
tent
au
thor
ities
of t
he W
ater
and
For
est
Adm
inis
tratio
n ar
e su
bjec
t to
the
area
tax.
Th
e ar
ea ta
x is
pay
able
in a
dvan
ce b
y M
arch
31
of e
very
yea
r for
the
who
le y
ear.
If th
e am
ount
pay
able
exc
eeds
CFA
F 20
mill
ion,
th
e pe
rmit
hold
er m
ay, a
t the
ir re
ques
t, be
au
thor
ized
to p
ay th
e ta
x ac
cord
ing
to th
e pa
ymen
t sch
edul
e es
tabl
ishe
d by
the
Dire
ctor
ate
A
rea
tax
rate
s are
as f
ollo
ws:
•
CFA
F 60
0 pe
r hec
tare
for u
nim
prov
ed
conc
essi
ons;
•
CFA
F 30
0 pe
r hec
tare
for i
mpr
oved
co
nces
sion
s;
• C
FAF
200
per h
ecta
re fo
r are
as c
lose
d to
fo
rest
ry fo
r a p
erio
d of
15
year
s.
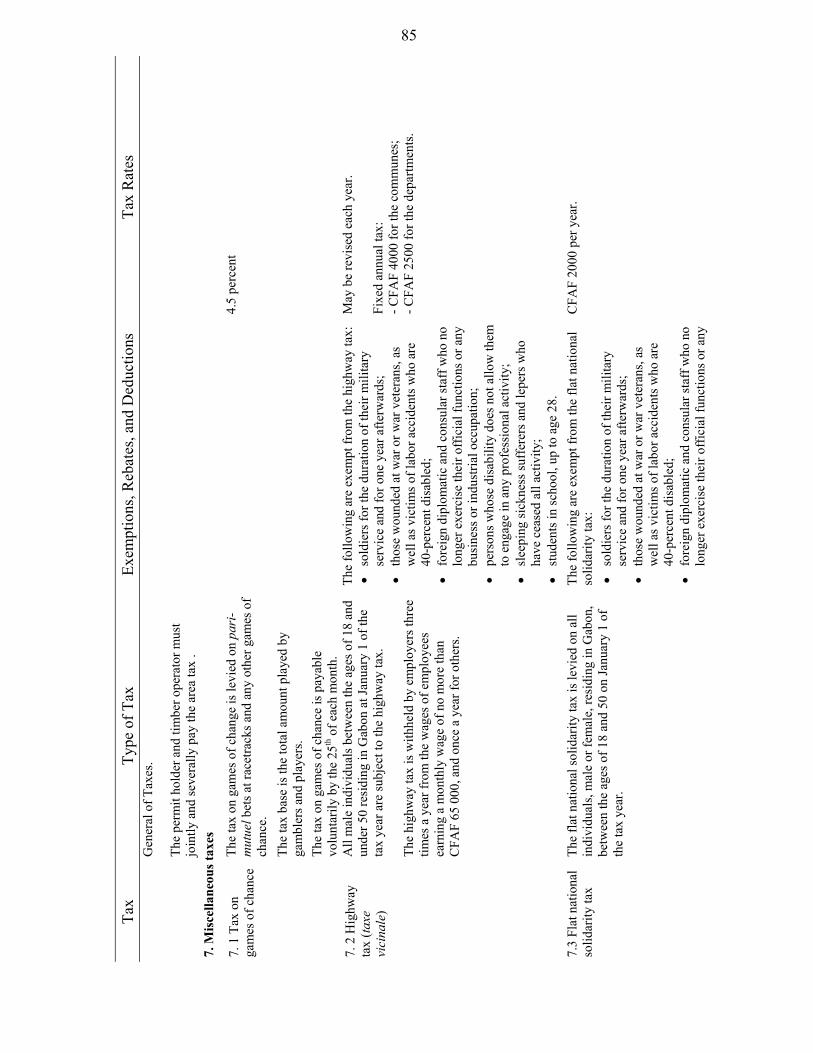
85
Tax
Type
of T
ax
Exem
ptio
ns, R
ebat
es, a
nd D
educ
tions
Ta
x R
ates
G
ener
al o
f Tax
es.
The
perm
it ho
lder
and
tim
ber o
pera
tor m
ust
join
tly a
nd se
vera
lly p
ay th
e ar
ea ta
x .
7. M
isce
llane
ous t
axes
7. 1
Tax
on
gam
es o
f cha
nce
The
tax
on g
ames
of c
hang
e is
levi
ed o
n pa
ri-
mut
uel b
ets a
t rac
etra
cks a
nd a
ny o
ther
gam
es o
f ch
ance
. Th
e ta
x ba
se is
the
tota
l am
ount
pla
yed
by
gam
bler
s and
pla
yers
. Th
e ta
x on
gam
es o
f cha
nce
is p
ayab
le
volu
ntar
ily b
y th
e 25
th o
f eac
h m
onth
.
4.
5 pe
rcen
t
7. 2
Hig
hway
ta
x (ta
xe
vici
nale
)
All
mal
e in
divi
dual
s bet
wee
n th
e ag
es o
f 18
and
unde
r 50
resi
ding
in G
abon
at J
anua
ry 1
of t
he
tax
year
are
subj
ect t
o th
e hi
ghw
ay ta
x.
The
high
way
tax
is w
ithhe
ld b
y em
ploy
ers t
hree
tim
es a
yea
r fro
m th
e w
ages
of e
mpl
oyee
s ea
rnin
g a
mon
thly
wag
e of
no
mor
e th
an
CFA
F 65
000
, and
onc
e a
year
for o
ther
s.
The
follo
win
g ar
e ex
empt
from
the
high
way
tax:
•
sold
iers
for t
he d
urat
ion
of th
eir m
ilita
ry
serv
ice
and
for o
ne y
ear a
fterw
ards
; •
thos
e w
ound
ed a
t war
or w
ar v
eter
ans,
as
wel
l as v
ictim
s of l
abor
acc
iden
ts w
ho a
re
40-p
erce
nt d
isab
led;
•
fore
ign
dipl
omat
ic a
nd c
onsu
lar s
taff
who
no
long
er e
xerc
ise
thei
r offi
cial
func
tions
or a
ny
busi
ness
or i
ndus
trial
occ
upat
ion;
•
pers
ons w
hose
dis
abili
ty d
oes n
ot a
llow
them
to
eng
age
in a
ny p
rofe
ssio
nal a
ctiv
ity;
• sl
eepi
ng si
ckne
ss su
ffer
ers a
nd le
pers
who
ha
ve c
ease
d al
l act
ivity
; •
stud
ents
in sc
hool
, up
to a
ge 2
8.
May
be
revi
sed
each
yea
r. Fi
xed
annu
al ta
x:
- CFA
F 40
00 fo
r the
com
mun
es;
- CFA
F 25
00 fo
r the
dep
artm
ents
.
7.3
Flat
nat
iona
l so
lidar
ity ta
x Th
e fla
t nat
iona
l sol
idar
ity ta
x is
levi
ed o
n al
l in
divi
dual
s, m
ale
or fe
mal
e, re
sidi
ng in
Gab
on,
betw
een
the
ages
of 1
8 an
d 50
on
Janu
ary
1 of
th
e ta
x ye
ar.
The
follo
win
g ar
e ex
empt
from
the
flat n
atio
nal
solid
arity
tax:
•
sold
iers
for t
he d
urat
ion
of th
eir m
ilita
ry
serv
ice
and
for o
ne y
ear a
fterw
ards
; •
thos
e w
ound
ed a
t war
or w
ar v
eter
ans,
as
wel
l as v
ictim
s of l
abor
acc
iden
ts w
ho a
re
40-p
erce
nt d
isab
led;
•
fore
ign
dipl
omat
ic a
nd c
onsu
lar s
taff
who
no
long
er e
xerc
ise
thei
r offi
cial
func
tions
or a
ny
CFA
F 20
00 p
er y
ear.
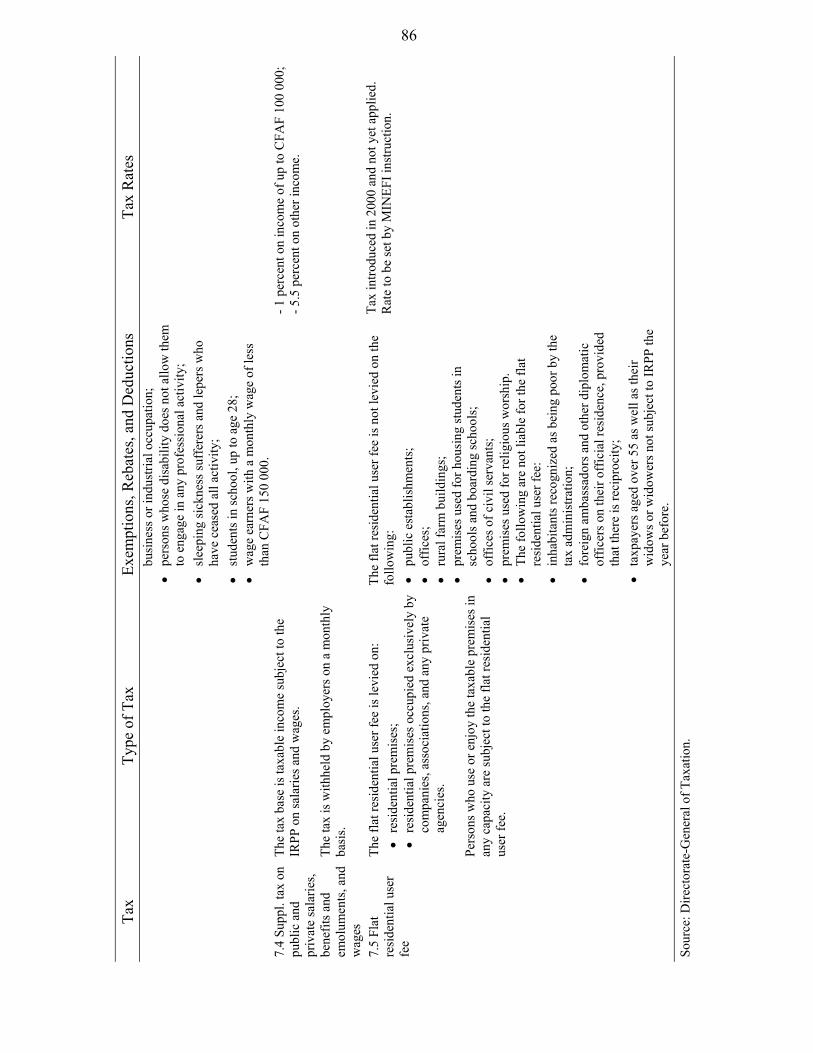
86
Tax
Type
of T
ax
Exem
ptio
ns, R
ebat
es, a
nd D
educ
tions
Ta
x R
ates
bu
sine
ss o
r ind
ustri
al o
ccup
atio
n;
• pe
rson
s who
se d
isab
ility
doe
s not
allo
w th
em
to e
ngag
e in
any
pro
fess
iona
l act
ivity
; •
slee
ping
sick
ness
suff
erer
s and
lepe
rs w
ho
have
cea
sed
all a
ctiv
ity;
• st
uden
ts in
scho
ol, u
p to
age
28;
•
wag
e ea
rner
s with
a m
onth
ly w
age
of le
ss
than
CFA
F 15
0 00
0.
7.4
Supp
l. ta
x on
pu
blic
and
pr
ivat
e sa
larie
s, be
nefit
s and
em
olum
ents
, and
w
ages
The
tax
base
is ta
xabl
e in
com
e su
bjec
t to
the
IRPP
on
sala
ries a
nd w
ages
. Th
e ta
x is
with
held
by
empl
oyer
s on
a m
onth
ly
basi
s.
- 1
per
cent
on
inco
me
of u
p to
CFA
F 10
0 00
0;
- 5.5
per
cent
on
othe
r inc
ome.
7.5
Flat
re
side
ntia
l use
r fe
e
The
flat r
esid
entia
l use
r fee
is le
vied
on:
•
resi
dent
ial p
rem
ises
; •
resi
dent
ial p
rem
ises
occ
upie
d ex
clus
ivel
y by
co
mpa
nies
, ass
ocia
tions
, and
any
priv
ate
agen
cies
. Pe
rson
s who
use
or e
njoy
the
taxa
ble
prem
ises
in
any
capa
city
are
subj
ect t
o th
e fla
t res
iden
tial
user
fee.
The
flat r
esid
entia
l use
r fee
is n
ot le
vied
on
the
follo
win
g:
• pu
blic
est
ablis
hmen
ts;
• of
fices
; •
rura
l far
m b
uild
ings
; •
prem
ises
use
d fo
r hou
sing
stud
ents
in
scho
ols a
nd b
oard
ing
scho
ols;
•
offic
es o
f civ
il se
rvan
ts;
• pr
emis
es u
sed
for r
elig
ious
wor
ship
. •
The
follo
win
g ar
e no
t lia
ble
for t
he fl
at
resi
dent
ial u
ser f
ee:
• in
habi
tant
s rec
ogni
zed
as b
eing
poo
r by
the
tax
adm
inis
tratio
n;
• fo
reig
n am
bass
ador
s and
oth
er d
iplo
mat
ic
offic
ers o
n th
eir o
ffic
ial r
esid
ence
, pro
vide
d th
at th
ere
is re
cipr
ocity
; •
taxp
ayer
s age
d ov
er 5
5 as
wel
l as t
heir
wid
ows o
r wid
ower
s not
subj
ect t
o IR
PP th
e ye
ar b
efor
e.
Tax
intro
duce
d in
200
0 an
d no
t yet
app
lied.
R
ate
to b
e se
t by
MIN
EFI i
nstru
ctio
n.
Sour
ce: D
irect
orat
e-G
ener
al o
f Tax
atio
n.