bosnia and herzegovina: selected issues · bosnia and herzegovina: selected issues . this selected...
TRANSCRIPT

© 2008 International Monetary Fund October 2008
IMF Country Report No. 08/326
Bosnia and Herzegovina: Selected Issues
This Selected Issues paper for Bosnia and Herzegovina was prepared by a staff team of the International Monetary Fund as background documentation for the periodic consultation with the member country. It is based on the information available at the time it was completed on August 28, 2008. The views expressed in this document are those of the staff team and do not necessarily reflect the views of the government of Bosnia and Herzegovina or the Executive Board of the IMF. The policy of publication of staff reports and other documents by the IMF allows for the deletion of market-sensitive information.
Copies of this report are available to the public from
International Monetary Fund ● Publication Services 700 19th Street, N.W. ● Washington, D.C. 20431
Telephone: (202) 623-7430 ● Telefax: (202) 623-7201 E-mail: [email protected] ● Internet: http://www.imf.org
Price: $18.00 a copy
International Monetary Fund
Washington, D.C.


INTERNATIONAL MONETARY FUND
BOSNIA AND HERZEGOVINA
Selected Issues
Prepared by Mali Chivakul, Milan Cuc, Irena Jankulov, and Graham Slack (all EUR)
Approved by the European Department
August 28, 2008
Content Page
I. Catching up or Falling Behind Other Transition Economies? .................................3 A. Introduction............................................................................................................4 B. Reasonable Level of National Income...................................................................4 C. Late Comer and the War Effect .............................................................................5 D. Catching-up or Falling Behind?.............................................................................5 E. Conclusions............................................................................................................6 II. Accelerating Inflation—Reason for Concern? ...........................................................7 A. Introduction............................................................................................................8 B. Background ............................................................................................................8 C. Decomposing the CPI ............................................................................................9 D. Core Inflation .......................................................................................................13 E. Conclusions..........................................................................................................16 III. Assessing Bosnia and Herzegovina’s External Stability and Competitiveness .....18 A. Introduction..........................................................................................................19 B. Assessing the Level of the Equilibrium Current Account Balance .....................20 C. Assessing the Level of the Real Exchange Rate..................................................24 D. Analysis of Export Performance..........................................................................28 E. External Balance Sheet Analysis .........................................................................34 F. Conclusions..........................................................................................................35 Tables 1. Underlying Current Account Balance Estimates, 2003-07...........................................21 2. CGER Macro Balance Coefficients and Equilibrium CA Balance Estimates ..............22 3. ALM (2007) Macro Balance Coefficients and Equilibrium CA Balance Estimates ....23 4. Adjusted Equilibrium CA Balance ...............................................................................24 5 CGER Equilibrium Real Exchange Rate Coefficients and Estimates ..........................27 6. Current Account Balance Gap and Estimated Real Exchange Rate Overvaluation .....27
2
7. Direction of Bosnian Merchandise Exports, 2003 and 2006 ........................................33 8. Constant Market Share Analysis of BiH’s Export Growth...........................................34 9. Share in Competitiveness Effect by Commodity Group...............................................34 Boxes 1. BiH’s Consumer Price Index ..........................................................................................9 2. Estimating BiH’s Potential Output ...............................................................................14 3. Estimating Core Inflation: the Trimmed Mean CPI .....................................................15 Figures 1. Bosnia & Herzegovina and CEE Peers: Inflation, 2003-08..........................................10 2. External Position...........................................................................................................36 Appendix 1. Constant Market Share Analysis (CMSA)....................................................................37 Appendix Table 1. Classification of Export Categories by Factor Intensity and Labor Skills.........................38
3
I. BOSNIA AND HERZEGOVINA: CATCHING UP OR FALLING BEHIND OTHER TRANSITION ECONOMIES?1
• How to boost the growth prospects? Accelerated structural reforms and macroeconomic stability remain key to achieving higher and sustained growth rates. Enterprise restructuring and privatization, alongside improving the business environment and reducing labor taxes, are critical to unlocking the potential for increased private investment and job growth. And meaningful structural fiscal reforms are needed to maintain BiH’s hard won macroeconomic stability—an important prerequisite to achieving high and sustained growth rates.
• What are the implications of the growth gap for the future? BiH risks falling behind, rather than catching-up with, other transition economies—and the rest of Europe—in terms of its economic development. This could delay the process of convergence to and integration with the European Union, including its ambitions to eventually adopt the euro.
• How does BiH’s growth dynamics compare? Using conventional convergence analysis, Bosnia and Herzegovina’s rate of economic growth appears to fall short of that achieved by other countries at a similar phase of development, although data uncertainties cloud the analysis.
• How does Bosnia and Herzegovina’s (BiH) level of national income compare with other economies at a similar stage of development? BiH enjoys a reasonably high level of national income. GDP per capita (adjusted for cross-country differences in purchasing power) is broadly similar to that of its immediate neighbors. And once remittance inflows are included, Bosnia and Herzegovina appears to have a level of per capita income well above the average for the Balkan region. Moreover, after an allowance is made for Bosnia and Herzegovina’s relatively late start to transition and the detrimental effects of the 1992-95 war, its income level appears to be in line with that of other transition economies at a similar phase of development.
Core Questions and Findings
1 Prepared by Graham Slack and Irena Jankulov.
4
A. Introduction
1. Bosnia and Herzegovina (BiH) has come a long way since it embarked upon transition in 1995. It has maintained respectable annual GDP growth rates of 5-6 percent since 2004, and experienced rapid export growth and strong inflows of foreign investment, underpinned by the currency board and significant donor assistance. Considering that this economic record has been achieved in the context of a difficult post-war setting, it appears all the more impressive.
2. When examining an economy’s performance it is useful to draw comparisons with other similar economies. This is especially so for a European emerging economy such as BiH that is aiming to catch-up, or converge, with its peers and is aspiring to join the EU and to adopt the Euro. With this in mind, this paper explores BiH’s economic record in a cross-country setting and asks whether the country is on or off the convergence path followed by other emerging European economies at a similar phase of transition.
B. A Reasonable Level of National Income
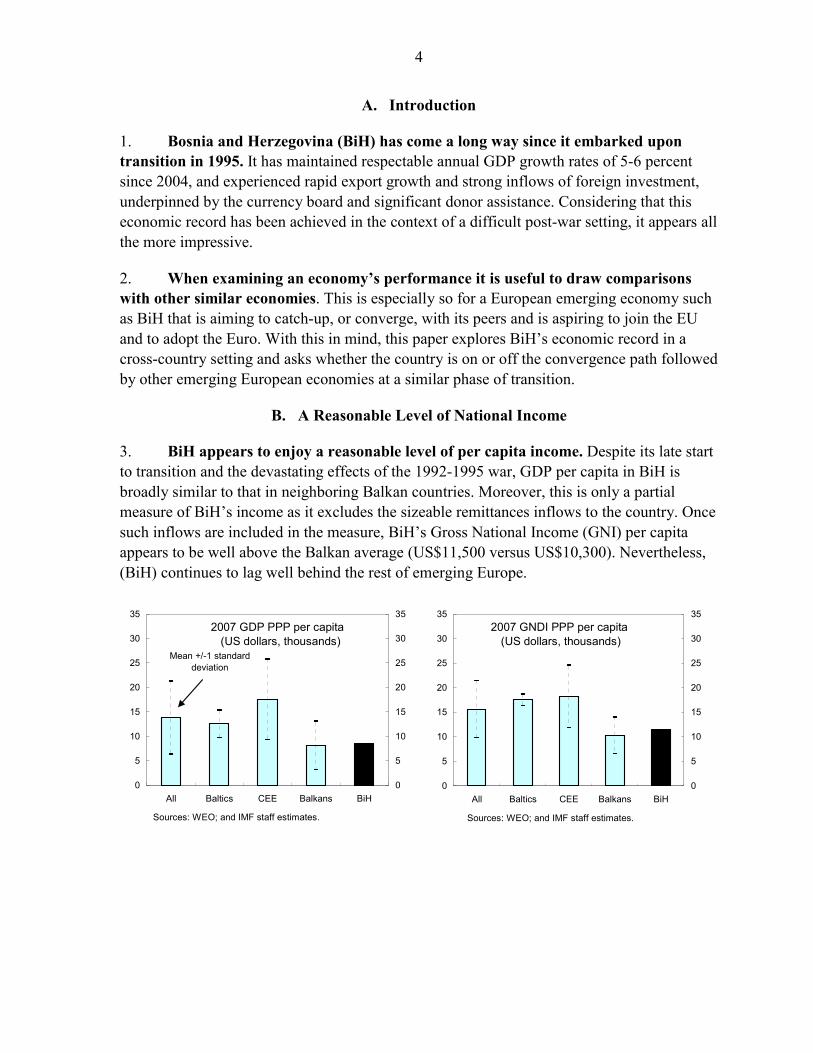
3. BiH appears to enjoy a reasonable level of per capita income. Despite its late start to transition and the devastating effects of the 1992-1995 war, GDP per capita in BiH is broadly similar to that in neighboring Balkan countries. Moreover, this is only a partial measure of BiH’s income as it excludes the sizeable remittances inflows to the country. Once such inflows are included in the measure, BiH’s Gross National Income (GNI) per capita appears to be well above the Balkan average (US$11,500 versus US$10,300). Nevertheless, (BiH) continues to lag well behind the rest of emerging Europe.
2007 GDP PPP per capita (US dollars, thousands)
0
5
10
15
20
25
30
35
All Baltics CEE Balkans BiH0
5
10
15
20
25
30
35
Sources: WEO; and IMF staff estimates.
Mean +/-1 standard deviation
2007 GNDI PPP per capita (US dollars, thousands)
0
5
10
15
20
25
30
35
All Baltics CEE Balkans BiH0
5
10
15
20
25
30
35
Sources: WEO; and IMF staff estimates.

5
C. Late Comer and the War Effect
4. Such a contemporaneous comparison of income levels across countries is perhaps unfair to BiH. This is for two reasons: (i) no allowance is made for BiH’s relatively late start to transition—most European emerging economies began their transition during 1990–92, whereas BiH did not start its transition to a market-based economy until 1995; and (ii) no allowance is made for the detrimental effect on BiH’s transition path of the 1992–1995 war—something that other emerging countries did not experience. One way to control for both this “latecomer” and “war effect” is to compare BiH’s 2007 income level with the one of other transition economies in 1999. Using a lag of eight years recognizes that BiH embarked upon its transition path five years later than most other emerging economies,2 and allows an additional three years to compensate for the fact that BiH experienced a war just before the start of its transition. Under this approach, GNI per capita in BiH appears to be broadly in line with that of other transition economies at a similar phase of transition.
GNP PPP per capita (US dollars, thousands)
0
3
6
9
12
15
BiH 2007 All Baltics CEE Balkans0
3
6
9
12
15
Sources: WEO; and IMF staff estimates.
D. Catching-up or Falling Behind?
5. Despite maintaining a reasonably good level of per capita income, BiH’s growth dynamicsto be somewhat less impressive. Controlling for differences in the level of income across countries, BiH’s rate of growth appears to fall short of that achieved by other countries at a similar phase of transition.
Growth Performance, 2000-07
0
4
8
12
16
20
24
28
32
0 2,000 4,000 6,000 8,000 10,000 12,000 14,
e
appear
re
3 The implications astark: despite its relatively high level of income, BiH risks falling behind, ratherthan catching-up with, other transition
2 The lag is proportionately shorter for those economies that embarked upon transition after 1990.
3 The same approach as described earlier was used to control for Bosnia and Herzegovina’s latecomer status and the war effect. Specifically, BiH’s economic performance between 2000−07 is compared with other countries’ economic performance eight years earlier (depending on when they embarked upon transition).
000 16,000
PPP GDP per capita, 2000
Aver
age
Gro
wth
of P
PP G
DP
pca
pita
Convergence path for emerging economies at a similar phase of transition
Sources: WEO; and IMF staff
BiH
BIH 2000 GDP including 30
percent upw ard dj t t

6
ean adopt the euro.
economies—and the rest of Europe—in terms of its economic development. This could, amongst other things, delay the process of convergence to and integration with the EuropUnion countries, including BiH’s ambitions to eventually
6. But data uncertainties cloud the picture. A possible explanation for BiH’s apparent growth deficit may lie in the mismeasurement of the country’s GDP: official measures of GDP do not fully capture activity in BiH’s burgeoning grey economy. It would take an upward adjustment of some 30 percent to GDP to bring BiH in line with the typical convergence path followed by other transition economies. This is not an unreasonable adjustment as it falls well within the range of the numerous estimates of BiH’s grey economy activity.4 5 However, an adjustment should also be made to the GDP of other transition economies to the extent that they too have economic activity that falls outside of the official measure of GDP. Such adjustments would move the convergence path outward and to the right, reopening the growth gap with BiH. Other possible explanations for the growth deficit might include the fact that BiH has not yet had access to large amounts of EU funding. But against this one must balance the unparalleled donor aid inflows that have benefited BiH.
E. Conclusions
7. BiH enjoys a good level of per capita income, but it appears to be experiencing a growth deficit. BiH’s rate of economic growth is unimpressive in comparison with the rates attained by other emerging economies at a similar phase of transition. A persistent growth deficit could, among other things, complicate BiH’s ambitions to converge to and get better integrated with the European Union countries, eventually achieving higher living standards. In addition, BiH’s current levels of income depend heavily on large remittance inflows, underscoring the vulnerability of the economy to a slowdown in these flows. Closing the growth deficit and catching up with other transition economies and the European Union will involve making strong progress on structural reforms (e.g., enterprise restructuring, privatization, and reforms in the fiscal area) and maintaining macroeconomic stability, thus creating an environment conducive to private sector investment, job creation, and growth.
4 See Chapter V, IMF Country Report No. 05/198
5 This approach assumes that inclusion of the grey economy does not significantly affect the measured rate of growth of the economy. The fact that narrow money growth and velocity of circulation have remained broadly stable with respect to BiH’s measured GDP suggests that the grey economy has not grown at a significantly different pace to the official economy.
7
II. ACCELERATING INFLATION—REASON FOR CONCERN?6
Questions and Findings
• What is driving inflation in Bosnia and Herzegovina? Global energy and food price shocks contributed disproportionately to the pickup in inflation in Bosnia and Herzegovina (BiH): about three quarters of the 8.2 percent rise in the CPI in 12 months to May 2008 can be attributed to energy and food prices; and only one quarter of that increase to other factors.
• How far is BiH’s price level from the one of the EU? Annual data suggests that convergence toward the EU average price level may explain some of the price increases, particularly for food. In 2006, BiH’s individual consumption price level (relative to the EU level) rose 1.6 percentage points (3.7 percentage points for food).
• Are there underlying inflation pressures? A rise in core inflation (excluding food and energy)—from near zero a year ago to 3.2 percent in May 2008 is of concern to policymakers. It signals that domestic demand may be growing too fast (in excess of the economy’s potential) creating a risk that the relative price adjustments driven by energy and food price shocks could lead to permanently higher inflation. Other signs of intensifying domestic demand pressures include an acceleration in wage growth and a widening trade deficit. An alternative measure of core inflation (trimmed mean CPI), also suggests that underlying inflation may be running even higher—around 5 percent.
• What are the key policy implications? The task of restraining domestic demand under the currency board falls mainly to fiscal policy and wage policy in the public sector. Fund policy advice is for the general government to avoid loosening the fiscal stance and to adopt a disciplined public wage policy—one that sends a signal of restraint to the private sector and which seeks to avoid wage competition among levels of government. Attempts to suppress inflation by cutting VAT rates for selected products would be neither effective nor desirable: the extent to which such cuts would be passed on to the final prices is uncertain; and rising prices for food and energy signal these products’ relative scarcity, providing incentives for their increased production and more efficient use.
6 Prepared by Milan Cuc.
8
A. Introduction
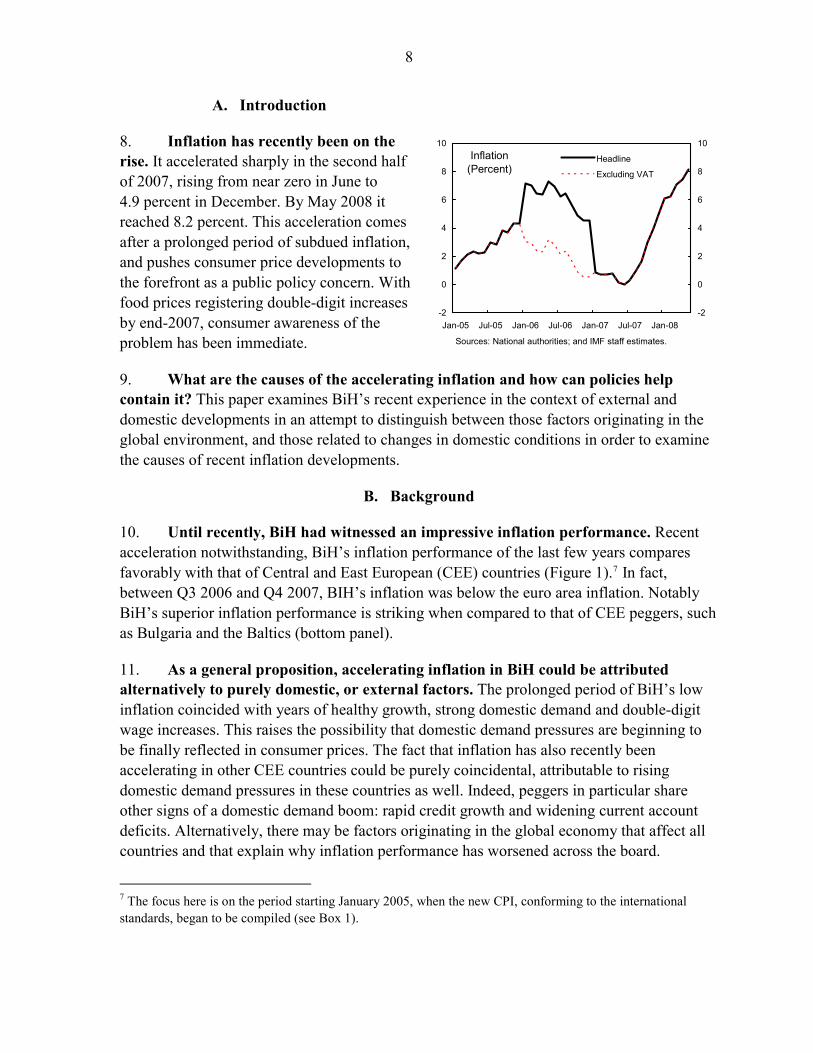
8. Inflation has recently been on the rise. It accelerated sharply in the second half of 2007, rising from near zero in June to 4.9 percent in December. By May 2008 it reached 8.2 percent. This acceleration comes after a prolonged period of subdued inflation, and pushes consumer price developments to the forefront as a public policy concern. With food prices registering double-digit increases by end-2007, consumer awareness of the problem has been immediate.
Inflation(Percent)
-2
0
2
4
6
8
10
Jan-05 Jul-05 Jan-06 Jul-06 Jan-07 Jul-07 Jan-08-2
0
2
4
6
8
10
Headline
Excluding VAT
Sources: National authorities; and IMF staff estimates.
9. What are the causes of the accelerating inflation and how can policies help contain it? This paper examines BiH’s recent experience in the context of external and domestic developments in an attempt to distinguish between those factors originating in the global environment, and those related to changes in domestic conditions in order to examine the causes of recent inflation developments.
B. Background
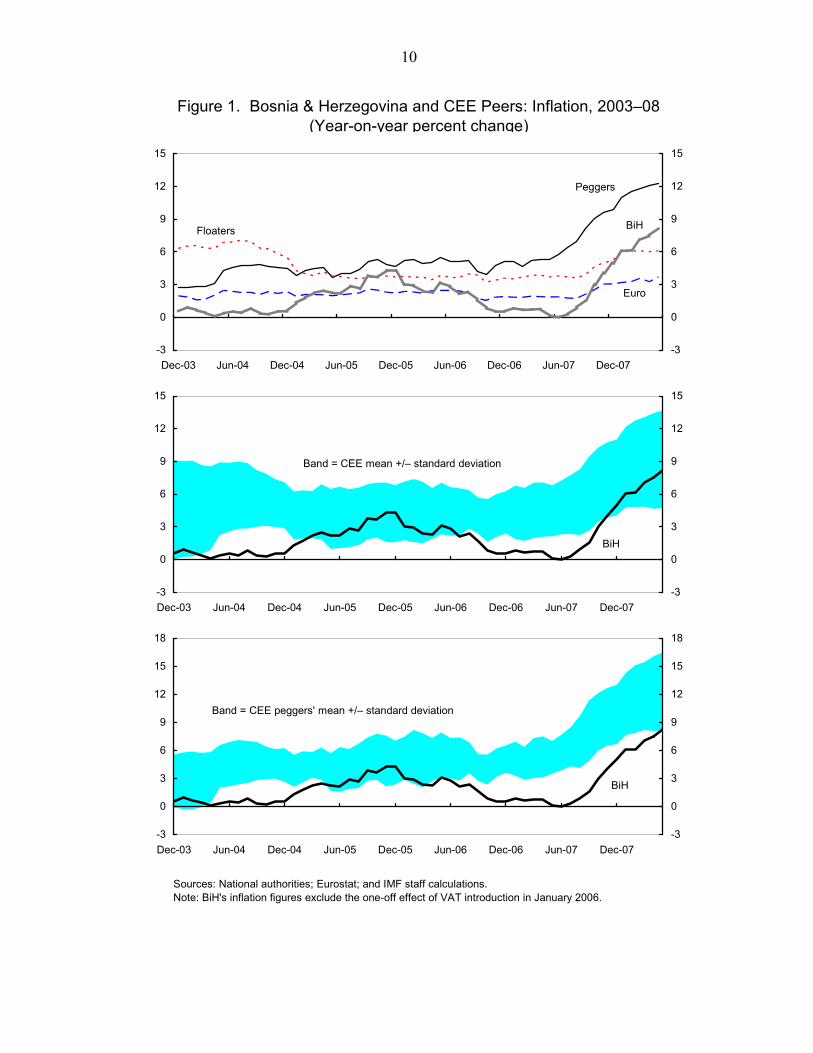
10. Until recently, BiH had witnessed an impressive inflation performance. Recent acceleration notwithstanding, BiH’s inflation performance of the last few years compares favorably with that of Central and East European (CEE) countries (Figure 1).7 In fact, between Q3 2006 and Q4 2007, BIH’s inflation was below the euro area inflation. Notably BiH’s superior inflation performance is striking when compared to that of CEE peggers, such as Bulgaria and the Baltics (bottom panel).
11. As a general proposition, accelerating inflation in BiH could be attributed alternatively to purely domestic, or external factors. The prolonged period of BiH’s low inflation coincided with years of healthy growth, strong domestic demand and double-digit wage increases. This raises the possibility that domestic demand pressures are beginning to be finally reflected in consumer prices. The fact that inflation has also recently been accelerating in other CEE countries could be purely coincidental, attributable to rising domestic demand pressures in these countries as well. Indeed, peggers in particular share other signs of a domestic demand boom: rapid credit growth and widening current account deficits. Alternatively, there may be factors originating in the global economy that affect all countries and that explain why inflation performance has worsened across the board.
7 The focus here is on the period starting January 2005, when the new CPI, conforming to the international standards, began to be compiled (see Box 1).
9
Box 1. BiH’s Consumer Price Index The development of the CPI was initiated with international assistance (ISTAT) in 2004. The data are now available on a monthly basis, for the period starting January 2005. Until then, there was no countrywide index of consumer prices. The entities’ statistical offices had been producing the retail price index (RPI) and the cost-of-living index (COLI), both of which were established in the late 1980s. The indices are based on the methodology inherited from the former Yugoslavia, which predates the current international standards. One of their major drawbacks is that their weights are derived from household expenditure surveys in 1986 and 1987, respectively. In contrast, the CPI conforms to the methodological standards recommended by the EU. Its weights have been derived from the 2004 Household Budget Survey, which had a full geographical and household coverage.
C. Decomposing the CPI
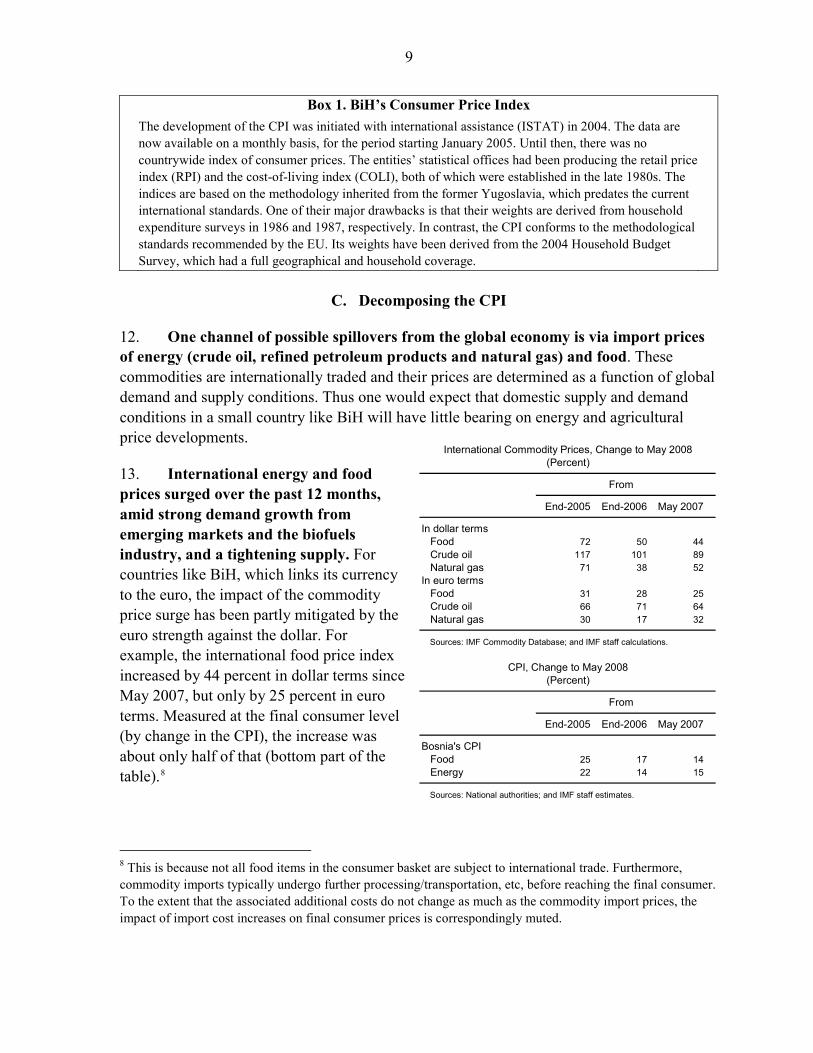
12. One channel of possible spillovers from the global economy is via import prices of energy (crude oil, refined petroleum products and natural gas) and food. These commodities are internationally traded and their prices are determined as a function of global demand and supply conditions. Thus one would expect that domestic supply and demand conditions in a small country like BiH will have little bearing on energy and agricultural price developments.
International Commodity Prices, Change to May 2008(Percent)
From
End-2005 End-2006 May 2007
In dollar termsFood 72 50 44Crude oil 117 101 89Natural gas 71 38 52
In euro termsFood 31 28 25Crude oil 66 71 64Natural gas 30 17 32
Sources: IMF Commodity Database; and IMF staff calculations.
CPI, Change to May 2008(Percent)
From
End-2005 End-2006 May 2007
Bosnia's CPIFood 25 17 14Energy 22 14 15
Sources: National authorities; and IMF staff estimates.
13. International energy and food prices surged over the past 12 months, amid strong demand growth from emerging markets and the biofuels industry, and a tightening supply. For countries like BiH, which links its currency to the euro, the impact of the commodity price surge has been partly mitigated by the euro strength against the dollar. For example, the international food price index increased by 44 percent in dollar terms since May 2007, but only by 25 percent in euro terms. Measured at the final consumer level (by change in the CPI), the increase was about only half of that (bottom part of the table).8
8 This is because not all food items in the consumer basket are subject to international trade. Furthermore, commodity imports typically undergo further processing/transportation, etc, before reaching the final consumer. To the extent that the associated additional costs do not change as much as the commodity import prices, the impact of import cost increases on final consumer prices is correspondingly muted.
10
Figure 1. Bosnia & Herzegovina and CEE Peers: Inflation, 2003–08(Year-on-year percent change)
Sources: National authorities; Eurostat; and IMF staff calculations. Note: BiH's inflation figures exclude the one-off effect of VAT introduction in January 2006.
-3
0
3
6
9
12
15
Dec-03 Jun-04 Dec-04 Jun-05 Dec-05 Jun-06 Dec-06 Jun-07 Dec-07-3
0
3
6
9
12
15
Peggers
Floaters
Euro
BiH
-3
0
3
6
9
12
15
Dec-03 Jun-04 Dec-04 Jun-05 Dec-05 Jun-06 Dec-06 Jun-07 Dec-07-3
0
3
6
9
12
15
Band = CEE mean +/– standard deviation
BiH
-3
0
3
6
9
12
15
18
Dec-03 Jun-04 Dec-04 Jun-05 Dec-05 Jun-06 Dec-06 Jun-07 Dec-07-3
0
3
6
9
12
15
18
Band = CEE peggers' mean +/– standard deviation
BiH
11
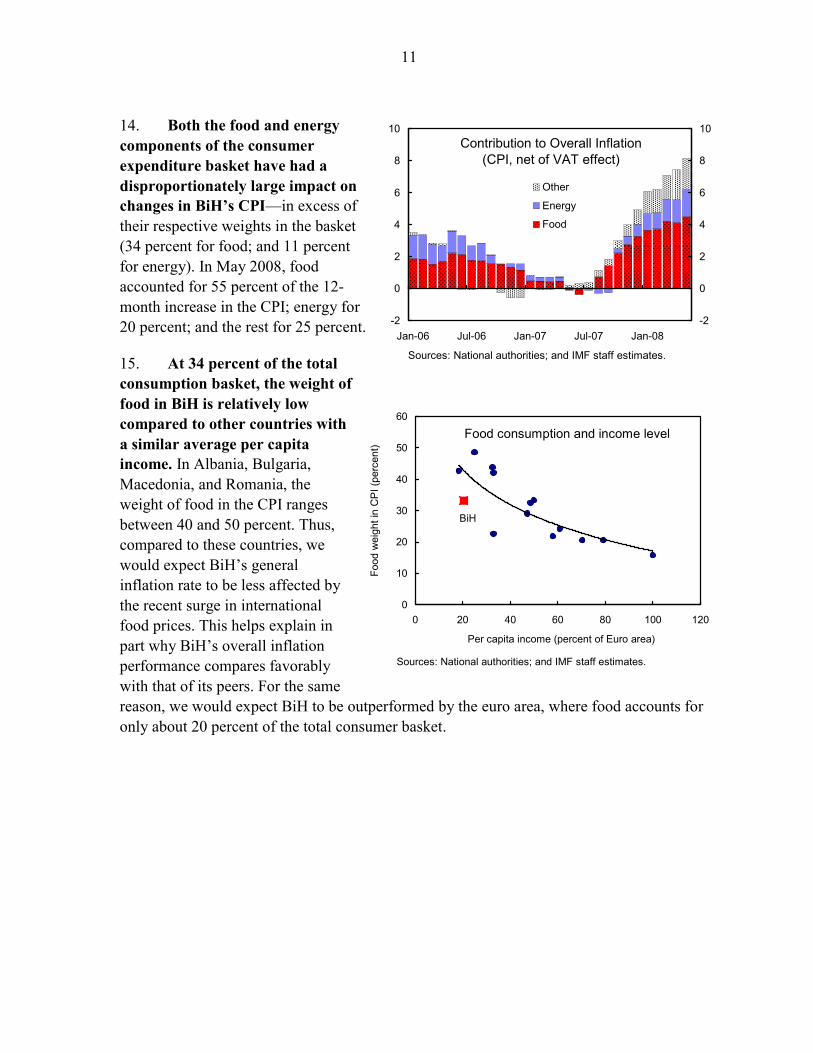
14. Both the food and energy components of the consumer expenditure basket have had a disproportionately large impact on changes in BiH’s CPI—in excess of their respective weights in the basket (34 percent for food; and 11 percent for energy). In May 2008, food accounted for 55 percent of the 12-month increase in the CPI; energy for 20 percent; and the rest for 25 percent.
15. At 34 percent of the total consumption basket, the weight of food in BiH is relatively low compared to other countries with a similar average per capita income. In Albania, Bulgaria, Macedonia, and Romania, the weight of food in the CPI ranges between 40 and 50 percent. Thus, compared to these countries, we would expect BiH’s general inflation rate to be less affected by the recent surge in international food prices. This helps explain in part why BiH’s overall inflation performance compares favorably with that of its peers. For the same reason, we would expect BiH to be outperformed by the euro area, where food accounts for only about 20 percent of the total consumer basket.
Contribution to Overall Inflation(CPI, net of VAT effect)
-2
0
2
4
6
8
10
Jan-06 Jul-06 Jan-07 Jul-07 Jan-08-2
0
2
4
6
8
10
Other
Energy
Food
Sources: National authorities; and IMF staff estimates.
Food consumption and income level
0
10
20
30
40
50
60
0 20 40 60 80 100 120
Per capita income (percent of Euro area)
Food
wei
ght i
n C
PI (
perc
ent)
BiH
Sources: National authorities; and IMF staff estimates.
12
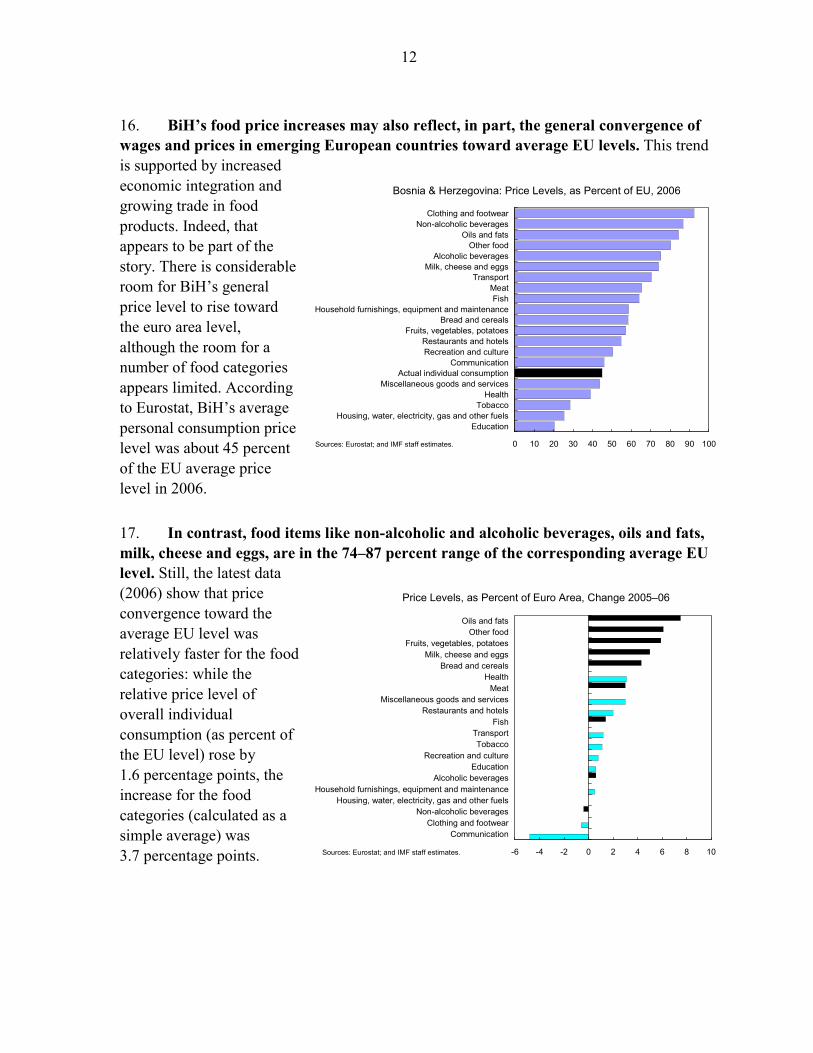
16. BiH’s food price increases may also reflect, in part, the general convergence of wages and prices in emerging European countries toward average EU levels. This trend is supported by increased economic integration and growing trade in food products. Indeed, that appears to be part of the story. There is considerable room for BiH’s general price level to rise toward the euro area level, although the room for a number of food categories appears limited. According to Eurostat, BiH’s average personal consumption price level was about 45 percent of the EU average price level in 2006.
Bosnia & Herzegovina: Price Levels, as Percent of EU, 2006
0 10 20 30 40 50 60 70 80 90 100
EducationHousing, water, electricity, gas and other fuels
TobaccoHealth
Miscellaneous goods and servicesActual individual consumption
CommunicationRecreation and cultureRestaurants and hotels
Fruits, vegetables, potatoesBread and cereals
Household furnishings, equipment and maintenanceFish
MeatTransport
Milk, cheese and eggsAlcoholic beverages
Other foodOils and fats
Non-alcoholic beveragesClothing and footwear
Sources: Eurostat; and IMF staff estimates.
17. In contrast, food items like non-alcoholic and alcoholic beverages, oils and fats, milk, cheese and eggs, are in the 74–87 percent range of the corresponding average EU level. Still, the latest data (2006) show that price convergence toward the average EU level was relatively faster for the food categories: while the relative price level of overall individual consumption (as percent of the EU level) rose by 1.6 percentage points, the increase for the food categories (calculated as a simple average) was 3.7 percentage points.
Price Levels, as Percent of Euro Area, Change 2005–06
-6 -4 -2 0 2 4 6 8 1
CommunicationClothing and footwear
Non-alcoholic beveragesHousing, water, electricity, gas and other fuels
Household furnishings, equipment and maintenanceAlcoholic beverages
EducationRecreation and culture
TobaccoTransport
FishRestaurants and hotels
Miscellaneous goods and servicesMeat
HealthBread and cereals
Milk, cheese and eggsFruits, vegetables, potatoes
Other foodOils and fats
Sources: Eurostat; and IMF staff estimates. 0
13
D. Core Inflation
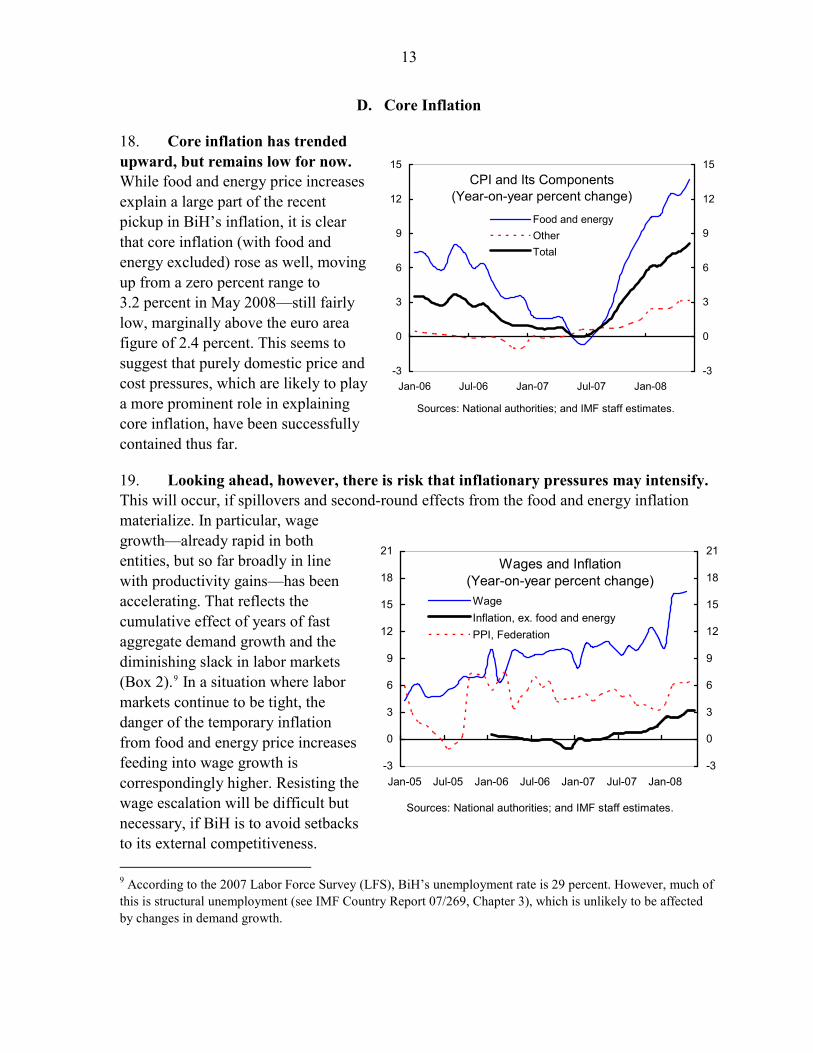
18. Core inflation has trended upward, but remains low for now. While food and energy price increases explain a large part of the recent pickup in BiH’s inflation, it is clear that core inflation (with food and energy excluded) rose as well, moving up from a zero percent range to 3.2 percent in May 2008—still fairly low, marginally above the euro area figure of 2.4 percent. This seems to suggest that purely domestic price and cost pressures, which are likely to play a more prominent role in explaining core inflation, have been successfully contained thus far.
CPI and Its Components
(Year-on-year percent change)
-3
0
3
6
9
12
15
Jan-06 Jul-06 Jan-07 Jul-07 Jan-08-3
0
3
6
9
12
15
Food and energyOtherTotal
Sources: National authorities; and IMF staff estimates.
19. Looking ahead, however, there is risk that inflationary pressures may intensify. This will occur, if spillovers and second-round effects from the food and energy inflation materialize. In particular, wage growth—already rapid in both entities, but so far broadly in line with productivity gains—has been accelerating. That reflects the cumulative effect of years of fast aggregate demand growth and the diminishing slack in labor markets (Box 2).9 In a situation where labor markets continue to be tight, the danger of the temporary inflation from food and energy price increases feeding into wage growth is correspondingly higher. Resisting the wage escalation will be difficult but necessary, if BiH is to avoid setbacks to its external competitiveness.
Wages and Inflation
(Year-on-year percent change)
-3
0
3
6
9
12
15
18
21
Jan-05 Jul-05 Jan-06 Jul-06 Jan-07 Jul-07 Jan-08-3
0
3
6
9
12
15
18
21
WageInflation, ex. food and energyPPI, Federation
Sources: National authorities; and IMF staff estimates.
9 According to the 2007 Labor Force Survey (LFS), BiH’s unemployment rate is 29 percent. However, much of this is structural unemployment (see IMF Country Report 07/269, Chapter 3), which is unlikely to be affected by changes in demand growth.
14
20. Wage pressures in the economy may be further compounded by the recent upward wage adjustments in the public sector. The public wage reforms by the state and the RS governments led to sharp upward adjustments in the public wages. Given the still-large role of the public sector in BiH’s economy, these increases may have repercussions for private sector wage settlements. Wage indexation mechanisms that tie public sector wages to changes in the economy-wide wage developments may accelerate wage escalation through a feedback loop.
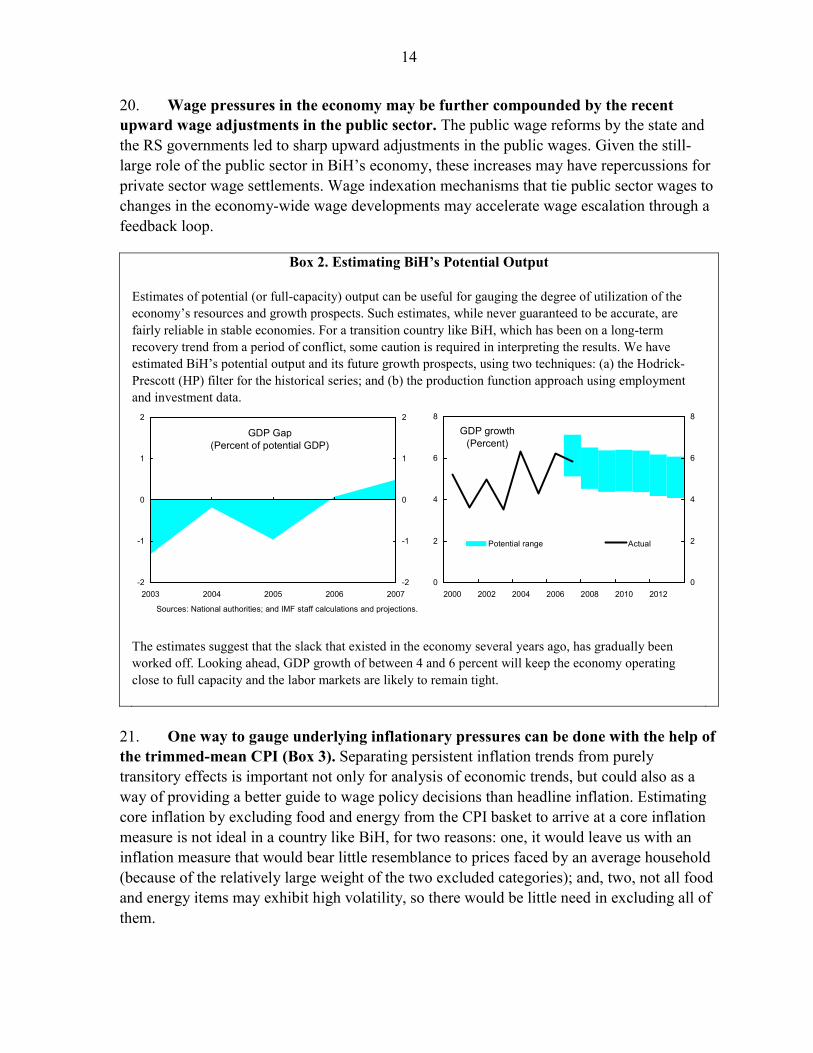
Box 2. Estimating BiH’s Potential Output Estimates of potential (or full-capacity) output can be useful for gauging the degree of utilization of the economy’s resources and growth prospects. Such estimates, while never guaranteed to be accurate, are fairly reliable in stable economies. For a transition country like BiH, which has been on a long-term recovery trend from a period of conflict, some caution is required in interpreting the results. We have estimated BiH’s potential output and its future growth prospects, using two techniques: (a) the Hodrick-Prescott (HP) filter for the historical series; and (b) the production function approach using employment and investment data.
GDP Gap(Percent of potential GDP)
-2
-1
0
1
2
2003 2004 2005 2006 2007-2
-1
0
1
2
Sources: National authorities; and IMF staff calculations and projections.
GDP growth(Percent)
0
2
4
6
8
2000 2002 2004 2006 2008 2010 20120
2
4
6
8
Potential range Actual
The estimates suggest that the slack that existed in the economy several years ago, has gradually been worked off. Looking ahead, GDP growth of between 4 and 6 percent will keep the economy operating close to full capacity and the labor markets are likely to remain tight.
21. One way to gauge underlying inflationary pressures can be done with the help of the trimmed-mean CPI (Box 3). Separating persistent inflation trends from purely transitory effects is important not only for analysis of economic trends, but could also as a way of providing a better guide to wage policy decisions than headline inflation. Estimating core inflation by excluding food and energy from the CPI basket to arrive at a core inflation measure is not ideal in a country like BiH, for two reasons: one, it would leave us with an inflation measure that would bear little resemblance to prices faced by an average household (because of the relatively large weight of the two excluded categories); and, two, not all food and energy items may exhibit high volatility, so there would be little need in excluding all of them.

15
Box 3. Estimating Core Inflation: the Trimmed Mean CPI
Tying wage increases to headline inflation carries a risk for overall macroeconomic stability in times when shocks to the consumer price level come from a limited number of volatile items. That is because the wage adjustment may feed off of price increases that are purely transitory. And, in that way, the wage adjustment can cause the underlying inflation rate to ratchet up over time via a wage-price feedback. Linking wages to a measure of underlying inflation would be expected to produce a more stable outcome. One way to estimate underlying inflation would be by excluding energy and food price changes. Yet, ignoring food and energy prices completely would not be ideal, for two reasons: one, food and energy account almost for half of the consumer expenditure basket in BiH—excluding energy and food out would leave us with an inflation measure that would bear little resemblance to prices faced by an average household; and, two, not all food and energy items may exhibit high volatility, so there would be little need in excluding all of them. The challenge in arriving at underlying inflation is to determine what part of monthly inflation is lasting as opposed to fleeting. We can define core inflation as the inflation that represents the underlying trend, once transitory swings have been smoothed out. An approach that is often used to estimate the underlying inflation rate is the trimmed mean (see, for example, Dolmas (2005)). It is calculated for a given month by taking the price changes for each of the individual components of the CPI. These are sorted in descending order, and a certain fraction of the most extreme observations in both tails of the distribution are thrown out, or “trimmed”. The trimmed mean inflation rate is then calculated as a weighted average of the remaining components. Alternative estimations of trimmed mean inflation give a fairly narrow range of values for core inflation (see figure). For the period January 2005–May 2008, the trimmed inflation shows no bias compared to the actual monthly CPI increases. At the same time, it gives a smoother profile than the headline inflation. It is also clear that the measure of core inflation that excludes food and energy deviates significantly from the inflation faced by a typical household over this period.
Sources: National authorities; and IMF staff calculations.
-2
0
2
4
6
8
10
Jan-06 Jul-06 Jan-07 Jul-07 Jan-08-2
0
2
4
6
8
10
Range of asymmetric trimmed means
ActualExcluding food and energy
Alternative Measures of Inflation(Percent)
16
E. Conclusions
22. Fast-rising inflation is a new phenomenon in BiH. For many years now, the country has done well in terms of its inflation performance relative to other Europe’s emerging economies. However, the recent global food and energy price shocks have quickly pushed up the overall price level, and pose the risk of becoming entrenched if they trigger sharp upward wage adjustments. This danger is underscored by the signs that BiH’s growth has been running close to its potential and that domestic demand pressures have intensified.
23. Fiscal and public sector wage policy plays a primary role in controlling inflation in BiH. Given the currency board arrangement, fiscal restraint remains the key policy tool for managing the risks of overheating. Another channel through which government can exert some influence over wage developments in the economy is public wage policy. While the recent public wage reforms by the State and the RS governments may result in a one-time step increase as a result of the public wage realignment, it is critical that the system for adjusting wages in the future exerts moderating influence on wage settlements in the rest of the economy. Coordination in public wage policy would be useful to head off wage competition among levels of government that could otherwise lead to wage escalation.
24. Differentiated VAT rates for food and energy are not helpful as a policy response to higher prices of food and energy. Governments often come under political pressure to attenuate the adverse income impact of rising food and energy prices on households. However, attempts to suppress inflation by cutting VAT rates for selected products are neither effective nor desirable: the extent to which such cuts would be passed on to the final prices is uncertain; and rising prices for food and energy signal these products’ relative scarcity, providing incentives for their increased production and more efficient use. Furthermore, differentiated VAT rates complicate tax administration, raising the cost to the taxpayer and the government.
17
References
Cuc, M., 2007, “Unemployment and Labor Market,” in Bosnia and Herzegovina—Selected Issues, IMF Country Report No. 07/269 (Washington: International Monetary Fund). Dolmas, J., 2005, “Trimmed Mean PCE Inflation," Working Paper 0506, Research Department, Federal Reserve Bank of Dallas. Roger, S., 2000, “Relative Prices, Inflation and Core Inflation,” IMF Working Paper 00/58 (Washington: International Monetary Fund). Silver, M., 2006, “Core Inflation Measures and Statistical Issues in Choosing Among Them,” IMF Working Paper 06/97 (Washington: International Monetary Fund).

18
III. ASSESSING BOSNIA AND HERZEGOVINA’S EXTERNAL STABILITY AND
COMPETITIVENESS10
Core Questions and Findings
• How do different methodologies assess the level of Bosnia and Herzegovina
(BiH)’s equilibrium current account balance and the level of the real effective exchange rate? The estimates of equilibrium current account deficit—taking into account capital transfers—range from 7½ to 13½ percent of GDP. Based on staff’s baseline macroeconomic scenario over 2008-13, the underlying current account deficit—at around 12-14 percent of GDP—hovers at the upper end of the equilibrium range. A number of assessment methodologies suggest that there is no strong evidence of a significantly overvalued real exchange rate that could result in future external instability although uncertainty surrounding the estimates is large. Recent movement of the real effective exchange rate and robust export performance suggest that external competitiveness is currently broadly adequate.
• How have exports evolved? Export growth has been strong, and both real export growth and market share gain over 2003-07 are above the average regional performance. Constant market share analysis suggests that most of the export growth can be attributed to competitiveness effect. However, exports continue to have a narrow base, and, over the years, have become more concentrated in resource-intensive products that are exposed to large swings in global prices.
• Does the external balance sheet suggest near-term risks? At about 50 percent of GDP, external debt is not low. However, with less than 10 percent of the external debt at short-term maturities, and these more than fully covered by international reserves, repayment risks are low.
• What is the competitiveness outlook and what are the main risks to external stability? The projected terms-of-trade shock in the next 2-3 years and the widening current account deficit in 2008 imply larger financing needs, which could expose BiH to a shift in investor sentiment. Stabilizing the external account and preserving external competitiveness will require tighter fiscal and public-sector wage policies, while addressing financial sector vulnerabilities. Moreover, enterprise reform and privatization are imminent to maintain external competitiveness, and boost productivity gains and export momentum.
10 Prepared by Mali Chivakul.

19
A. Introduction
25. BiH’s external position has improved markedly in recent years. Among the Eastern European countries with double-digit current account deficits, BiH is the only country that has seen its current account (CA) position improve over the last five years: it narrowed from an average of 18 percent of GDP during 2002-05 to 8.4 percent of GDP in 2006. On account of a domestic demand boom, the deficit widened to 13 percent of GDP in 2007. The better overall external position can be attributed mainly to the improvement in the goods and services balance which moved from a deficit of 46 percent of GDP in 2003 to 33 percent of GDP in 2007. The financing of the CA deficits has been tilted towards long-term sources including FDI and long-term commercial bank borrowing. International reserves reached €3.4 billion or 5.4 months of imports at end-2007.
Sources: Central Bank of Bosnia & Herzegovina; and IMF, World Economic Outlook .
Current Account Deficit Developments (Percent of GDP)
0
5
10
15
20
25
2003 2004 2005 2006 20070
5
10
15
20
25
BIH BGNROM HRVSRB Average Baltics
Bosnia: Current Account Balance, Main Components and Financing (Percent of GDP)
-80
-60
-40
-20
0
20
40
2003 2004 2005 2006 2007-80
-60
-40
-20
0
20
40
Current account balanceGoods and services balanceCurrent Transfers, net
Direct InvestmentNet capital flows
26. During the same period, the real effective exchange rate (REER) has been stable, and export growth has been strong. The CPI-based REER depreciated slightly during 2000-02 and has been quite stable since. At the same time, ULC-based REER has not moved much from its level in 2000. Moreover, exports benefited from favorable price competitiveness as well as strong world demand, resulting in a large gain of market share in the world market, before plateauing in 2007.
Real Effective Exchange Rate(Index, 2000=100)
80
90
100
110
120
130
2000 2001 2002 2003 2004 2005 2006 2007 200880
90
100
110
120
130
CPI-based
ULC-based
Bosnia's Market Share(Index, 2000=100)
50
100
150
200
250
2000 2001 2002 2003 2004 2005 2006 200750
100
150
200
250
World
EU-15
Sources: BiH Statistics Agency; UN Comtrade; and IMF staff calculations.

20
27. This paper examines BiH’s current account developments, external competitiveness, and risks to external stability. The recent widening of the current account deficit and the tapering-off of the gain in export market share have raised concerns about BiH’s external competitiveness and external stability risks. This paper, therefore, explores the following questions:
• How do different methodologies assess the level of BiH’s equilibrium current account balance and equilibrium real exchange rate?
• What have been the driving forces behind BiH’s export growth?
• Does the external balance sheet suggest near-term risks?
B. Assessing the Level of the Equilibrium Current Account Balance
Underlying current account balance
28. By stripping off temporary factors, the underlying balance gives a more accurate picture of the underlying trend. Specifically, the underlying current account balance is the balance adjusted for temporary factors, the business cycle and lagged effects of real exchange rate movements. We follow the methodology in Isard and Faruqee (1998) in computing the underlying balance. The estimates are corrected for BiH’s business cycle11, the Euroarea’s business cycle, real exchange rate movements and one important temporary factor—the introduction of VAT at the beginning of 2006. Using the 2007 figure, the underlying balance is 11.5 percent of GDP (Table 1).
29. The underlying CA balance can also be estimated in a forward-looking calculation. This methodology uses the medium-term projection and removes any change in policy, given that the forward-looking projection assumes no output gap and no change in the real exchange rate. According to this methodology, the underlying CA deficit is 13.7 percent of GDP—as projected for 2013. Given that we expect the fiscal policy stance will remain more or less the same in 2013 compared to the 2008 position, the adjustment for expected policy change is not necessary. However, given that BiH faces a large terms of trade shock in 2008, the projected CA deficit implicitly assumes some change in the real exchange rate. Therefore, the forward-looking estimate is not the same as the estimate based on the 2007 outturn. Although the underlying balance is between 12-14 percent of GDP, in the calculation of the next section, we use the upper-bound figure of 13.5 percent of GDP.
11 BiH’s business cycle is computed using an HP filter (lambda = 1600) on annual GDP data from 1998 to 2007.

21
Table 1. Underlying Current Account Balance Estimates, 2003-07 (In percent of GDP)
2003 2004 2005 2006 2007
Official current account deficit 19.4 16.3 18.0 8.4 13.0
Impact of VAT introduction -2.7 -2.7 -4.8 1.8 0.0Impact on imports 2/ 0.0 0.0 -2.1 1.8 0.0Impact on exports 3/ -2.7 -2.7 -2.7 0.0 0.0
Bosnian business cycle -1.4 -0.2 -1.1 0.1 0.8Trade partners' business cycle 4/ -0.4 -0.4 -0.6 -0.2 0.1Real exchange rate movements 5/ -0.9 -0.7 0.1 0.0 -0.8
Underlying current account deficit 16.9 12.8 13.8 9.8 11.5
Sources: CBBH and staff estimates.1/ Based on projected values.2/ VAT was introduced in January 2006. As a result, there was a temporary jump in imports in 2005, and a temporary drop in 2006.3/ Underreporting of exports became evident in 2006 with the introduction of the VAT. The underreported amount in 2006 is estimated at 2.7 percent of GDP. Assuming that the underreported exports are constant in percent of GDP, exports before 2006 are corrected by 2.7 percent of GDP. 4/ Due to limited data, we only consider Euro area's business cycle.5/ The RER series is corrected for inflation spike in 2006 due to VAT introduction.
Macroeconomic balance approach 30. The macroeconomic balance approach asks how far the underlying CA balance is from a benchmark level. It first estimates an equilibrium relationship between the current account balance and a set of fundamentals. The equilibrium CA balance (the benchmark level or CA norm) for a country is then computed from the relationship as a function of fundamentals. We first estimate BiH’s CA norm using the IMF Consultative Group on Exchange Rate Issues (CGER) methodology. The standard CGER methodology (Lee and others, 2008) is based on a pooled OLS regression using the data from 54 industrialized and emerging markets between 1973 and 200412. The independent variables—chosen based on economic theory and past empirical literature—include fiscal balance, demographics, lagged current account, oil balance, relative income and economic growth, and dummies for economic crises and financial center. Stronger fiscal balance raises national saving and thereby improving CA balance. Demographic variables include old-age dependency ratio and population growth to capture the economic effect of inactive dependent population. The lagged current account is included to reflect the persistence in the series. Oil balance allows the effect of oil prices on the CA balance, while relative income and economic growth capture the stage of development and the economy’s need for investment and borrowing. Finally, dummies for crises and financial center are included to reflect the sharp CA adjustments following past crises and the substantial CA surpluses observed in the financial centers, respectively.
12 See Lee and others (2008) and IMF (2006) for more details on the empirical estimations and variable construction.
22
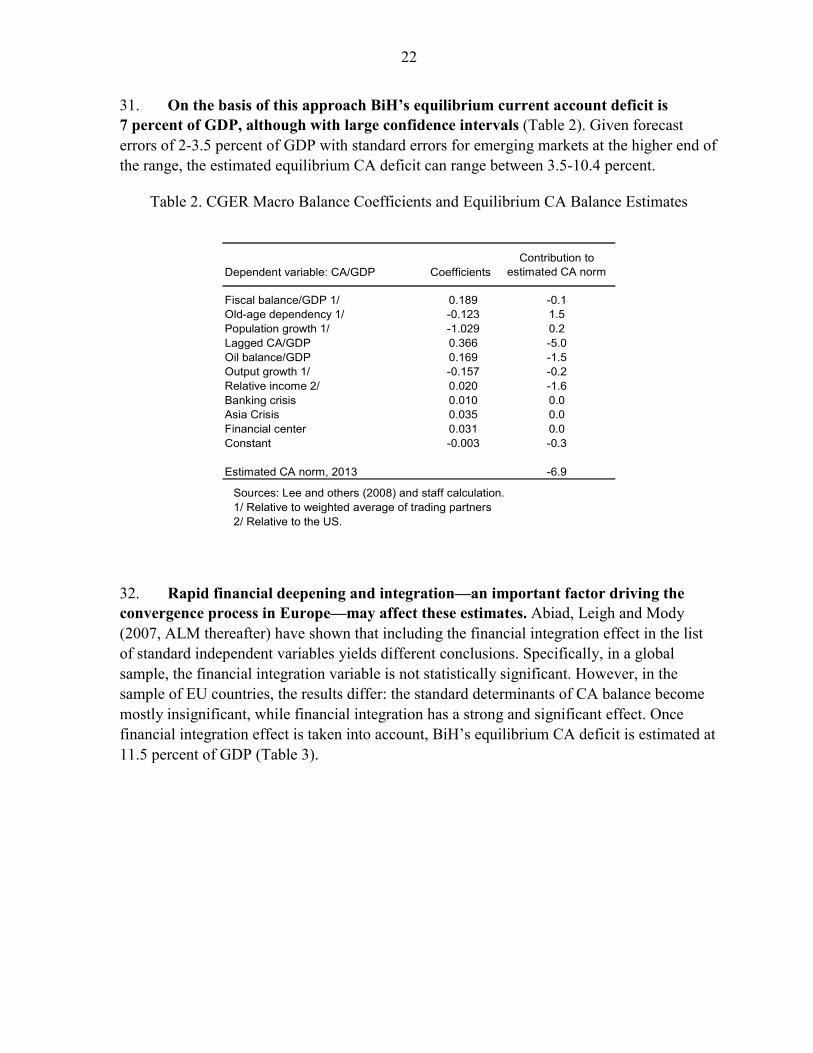
31. On the basis of this approach BiH’s equilibrium current account deficit is 7 percent of GDP, although with large confidence intervals (Table 2). Given forecast errors of 2-3.5 percent of GDP with standard errors for emerging markets at the higher end of the range, the estimated equilibrium CA deficit can range between 3.5-10.4 percent.
Table 2. CGER Macro Balance Coefficients and Equilibrium CA Balance Estimates
Dependent variable: CA/GDP CoefficientsContribution to
estimated CA norm
Fiscal balance/GDP 1/ 0.189 -0.1Old-age dependency 1/ -0.123 1.5Population growth 1/ -1.029 0.2Lagged CA/GDP 0.366 -5.0Oil balance/GDP 0.169 -1.5Output growth 1/ -0.157 -0.2Relative income 2/ 0.020 -1.6Banking crisis 0.010 0.0Asia Crisis 0.035 0.0Financial center 0.031 0.0Constant -0.003 -0.3
Estimated CA norm, 2013 -6.9
Sources: Lee and others (2008) and staff calculation.1/ Relative to weighted average of trading partners2/ Relative to the US.
32. Rapid financial deepening and integration—an important factor driving the convergence process in Europe—may affect these estimates. Abiad, Leigh and Mody (2007, ALM thereafter) have shown that including the financial integration effect in the list of standard independent variables yields different conclusions. Specifically, in a global sample, the financial integration variable is not statistically significant. However, in the sample of EU countries, the results differ: the standard determinants of CA balance become mostly insignificant, while financial integration has a strong and significant effect. Once financial integration effect is taken into account, BiH’s equilibrium CA deficit is estimated at 11.5 percent of GDP (Table 3).

23
Table 3. ALM (2007) Macro Balance Coefficients and Equilibrium CA Balance Estimates
Dependent variable: CA/GDP CoefficientsContribution to
estimated CA norm
Log GDP per capita 1/ -0.008 -7.0GDP per capita growth 1/ 0.004 0.0Fiscal balance/GDP -0.119 0.1Lagged NFA/GDP -0.028 2.8Old-age dependency ratio -0.292 -7.0Young dependency ratio -0.018 -0.4Trade/GDP -0.014 -1.5Financial integration effect 2/ -7.3
Financial integration/GDP -0.430Log GDP per capita* Financial integration/GDP 0.045
Year dummy -0.049 -4.9Constant 0.137 13.7
Estimated CA norm -11.5
Sources: Abiad, Leigh and Mody (2007) and staff calculation.1/ Real PPP GDP per capita2/ Financial integration is defined as the sum of foreign assets and foreign liabilities.
External sustainability approach 33. The external sustainability approach determines the real exchange rate equilibrium level that would be consistent with stabilizing the net foreign asset position at a given “benchmark” value. First, the CA balance that would stabilize the net foreign asset position is calculated, based on certain assumptions on growth, and rates of return on the foreign assets and liabilities. The difference between the equilibrium CA balance and the medium-term projection—the CA gap—is then used to compute the RER adjustment required to close the CA gap. According to Jahjah (2007), the CA balance required to stabilize the NFA is around 5.5-5.7 percent of GDP, depending on the level of stabilized NFA and the assumed adjustment paths.
Summary
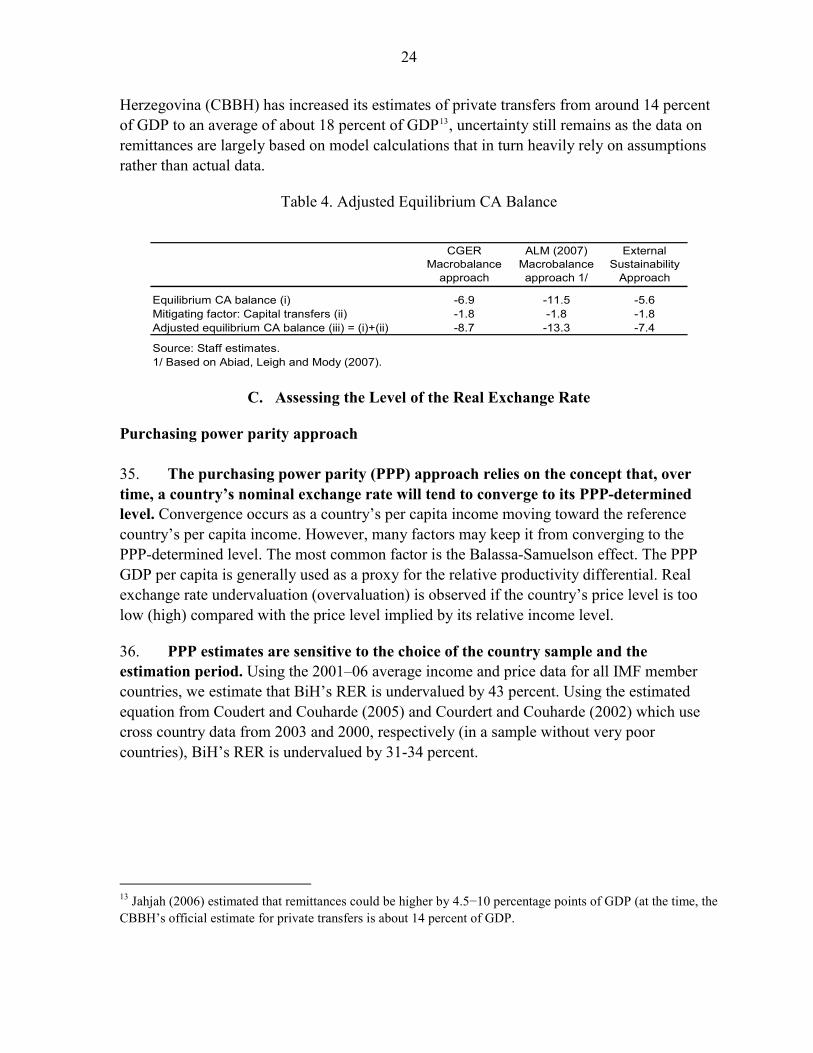
34. The range of estimates of BiH’s equilibrium CA deficit is wide and subject to large uncertainties and mitigating factors. The above approaches imply an equilibrium CA deficit of 6-12 percent of GDP. However, large uncertainty surrounds these estimates as the estimates have large margins of error. Moreover, capital transfers (1.8 percent of GDP projected in the medium term) are not taken into account. BiH has already signed a Stabilization and Association Agreement (SAA) with the EU, and is expected to benefit from significant capital grants, which would be of a permanent nature. Including those transfers would lead to an equilibrium CA deficit of between 7.5 and 13.5 percent of GDP (Table 4). In addition, the current account data have wide margins of error because the large size of workers’ remittances and the individual (resident) assets abroad make it difficult to estimate correctly the size of the current account. Although the Central Bank of Bosnia and
24
Herzegovina (CBBH) has increased its estimates of private transfers from around 14 percent of GDP to an average of about 18 percent of GDP13, uncertainty still remains as the data on remittances are largely based on model calculations that in turn heavily rely on assumptions rather than actual data.
Table 4. Adjusted Equilibrium CA Balance
CGER Macrobalance
approach
ALM (2007) Macrobalance approach 1/
External Sustainability
Approach
Equilibrium CA balance (i) -6.9 -11.5 -5.6Mitigating factor: Capital transfers (ii) -1.8 -1.8 -1.8Adjusted equilibrium CA balance (iii) = (i)+(ii) -8.7 -13.3 -7.4
Source: Staff estimates.1/ Based on Abiad, Leigh and Mody (2007).
C. Assessing the Level of the Real Exchange Rate
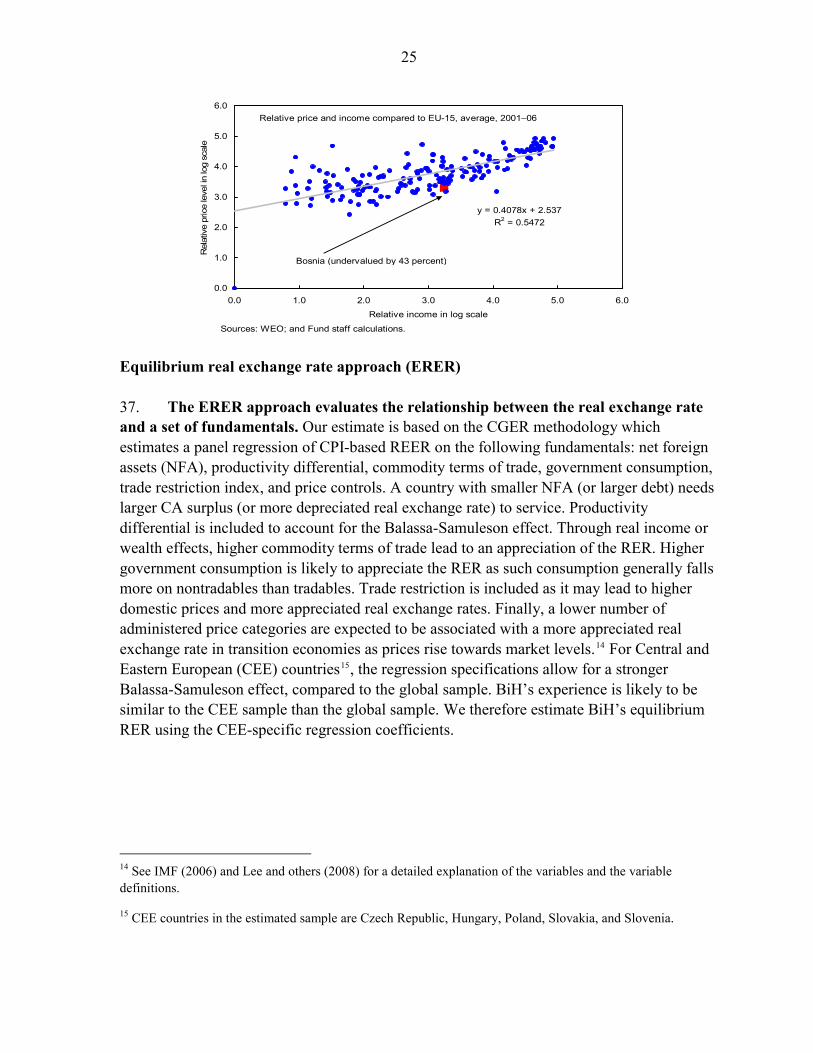
Purchasing power parity approach 35. The purchasing power parity (PPP) approach relies on the concept that, over time, a country’s nominal exchange rate will tend to converge to its PPP-determined level. Convergence occurs as a country’s per capita income moving toward the reference country’s per capita income. However, many factors may keep it from converging to the PPP-determined level. The most common factor is the Balassa-Samuelson effect. The PPP GDP per capita is generally used as a proxy for the relative productivity differential. Real exchange rate undervaluation (overvaluation) is observed if the country’s price level is too low (high) compared with the price level implied by its relative income level.
36. PPP estimates are sensitive to the choice of the country sample and the estimation period. Using the 2001–06 average income and price data for all IMF member countries, we estimate that BiH’s RER is undervalued by 43 percent. Using the estimated equation from Coudert and Couharde (2005) and Courdert and Couharde (2002) which use cross country data from 2003 and 2000, respectively (in a sample without very poor countries), BiH’s RER is undervalued by 31-34 percent.
13 Jahjah (2006) estimated that remittances could be higher by 4.5−10 percentage points of GDP (at the time, the CBBH’s official estimate for private transfers is about 14 percent of GDP.
25
Relative price and income compared to EU-15, average, 2001–06
y = 0.4078x + 2.537R2 = 0.5472
0.0
1.0
2.0
3.0
4.0
5.0
6.0
0.0 1.0 2.0 3.0 4.0 5.0 6.0
Relative income in log scale
Rel
ativ
e pr
ice
leve
l in
log
scal
e
Bosnia (undervalued by 43 percent)
Sources: WEO; and Fund staff calculations. Equilibrium real exchange rate approach (ERER) 37. The ERER approach evaluates the relationship between the real exchange rate and a set of fundamentals. Our estimate is based on the CGER methodology which estimates a panel regression of CPI-based REER on the following fundamentals: net foreign assets (NFA), productivity differential, commodity terms of trade, government consumption, trade restriction index, and price controls. A country with smaller NFA (or larger debt) needs larger CA surplus (or more depreciated real exchange rate) to service. Productivity differential is included to account for the Balassa-Samuleson effect. Through real income or wealth effects, higher commodity terms of trade lead to an appreciation of the RER. Higher government consumption is likely to appreciate the RER as such consumption generally falls more on nontradables than tradables. Trade restriction is included as it may lead to higher domestic prices and more appreciated real exchange rates. Finally, a lower number of administered price categories are expected to be associated with a more appreciated real exchange rate in transition economies as prices rise towards market levels.14 For Central and Eastern European (CEE) countries15, the regression specifications allow for a stronger Balassa-Samuleson effect, compared to the global sample. BiH’s experience is likely to be similar to the CEE sample than the global sample. We therefore estimate BiH’s equilibrium RER using the CEE-specific regression coefficients.
14 See IMF (2006) and Lee and others (2008) for a detailed explanation of the variables and the variable definitions.
15 CEE countries in the estimated sample are Czech Republic, Hungary, Poland, Slovakia, and Slovenia.

26
38. Regression results point to a prediction of a more appreciated RER than the actual RER from 2004 to 2007.16 The main contribution to a more appreciated real exchange rate prediction is the rapid growth of productivity in the tradable sector. Relative to nontradables, average labor productivity growth17 of BiH tradables over 2004-06 is much higher than that of the main trading partners.
Average productivity growth
Tradables NontradablesTradables/
Nontradables
Bosnia & Herzegovina 13.4 3.4 9.6
Main Trading partnersEuro Area 3.4 0.4 2.9Croatia 1/ 5.2 1.8 3.4Slovenia 7.1 2.7 4.3
Sources: BiH Statistics Agency; Eurostat; and IMF staff estimations.1/ Croatia's data is only available for 2003-04.
2004-2006Actual and Predicted Real Exchange Rate (Index, 2000=100)
Predicted REER
Actual REER
80
90
100
110
120
130
2004 2005 2006 2007
39. Medium-term estimates for the REER suggest an undervaluation of about 17 percent (Table 5). In line with CGER practice, we use the latest WEO projections (April 2008) for 2013 for the terms of trade and the most recent actual value (2006) for the productivity differential, trade restrictions and the number of administered price categories. The estimated value is 17.2 percent higher than the actual REER index in 2007. However, there are two caveats with the estimation. First, it is sensitive to the productivity differential between tradables and nontradables in the medium term. If the productivity differential relative to trading partners were to be reduced to half of the most recent actual value, the estimated undervaluation would be essentially eliminated. Second, the forecast error is quite large at about 12 percent.
16 Due to BiH’s limited data on productivity (only going back to 2003), we are not able to estimate the RER before 2004.
17 Defined by gross value-added per employee. Data for Bosnia & Herzegovina are from the Statistics Agency. Data for the Euro Area, Croatia and Slovenia are from Eurostat. Croatia’s data are only up to 2004.

27
Table 5. CGER Equilibrium Real Exchange Rate Coefficients and Estimates
Dependent variable: CPI-based rea exchange rate (in log scale) Estimated valueGlobal CEE-specific
NFA (as share of country's trade) 0.04 0.04 -0.04Productivity differential 1/ 0.15 1.42 0.31Commodity terms of trade (log of index) 0.46 0.39 1.75Government consumption (as share of GDP) 1/ 2.64 0.00 0.00Trade restriction index 0.13 0.14 0.00Price controls (Number of administered price categories, EBRD) -0.04 -0.02 -0.08Fixed effect 2/ 1.93 2.77 2.77
Estimated REER (in log scale), 2013 4.71Estimated REER (Index, 2000=100) 111.22007 REER index (Index, 2000=100) 94.9
Estimated undervaluation (in percent) 17.2
Sources: IMF (2006) and subsequent refinements using CEE-specific coefficients.Note: Fixed effect regression for 48 industrialized and emerging market countries for the global sample.CEE are Czech Republic, Hungary, Poland, Slovakia, and Slovenia. 1/ Relative to a trade-weighted average of top 4 trade partner countries.2/ Calculated such that the average prediction error (i.e. the average misalignment) for 1997-2004 is zero.
Coefficients
Real exchange rate assessment based on the current account gap
40. This method assumes that real exchange rate movements are the only factor in closing the CA gap. To calculate the required movements, the elasticities of imports and exports to the real exchange rate (0.92 and -0.71, respectively) are drawn from a cross country study (Isard and Faruqee, 1998). The estimates from the adjusted CA gap (from the previous section) show an overvaluation ranging from 1 to 29 percent (Table 6).
Table 6. Current Account Balance Gap and Estimated Real Exchange Rate Overvaluation (in percent of GDP, unless otherwise specified)
CGER Macrobalance
approach
ALM (2007) Macrobalance approach 1/
External Sustainability
Approach
Equilibrium CA balance (i) -6.9 -11.5 -5.6Mitigating factor: Capital transfers (ii) -1.8 -1.8 -1.8Adjusted equilibrium CA balance (iii) = (i)+(ii) -8.7 -13.3 -7.4
Underlying CA balance (iv) -13.5 -13.5 -13.5CA gap (iii)-(iv) 4.8 0.2 6.1
Implied over(+)/under(-) valuation 23.1 1.0 29.3
Source: Staff estimates.1/ Based on Abiad, Leigh and Mody (2007).

28
Overall assessment of the level of the real exchange rate
41. Estimates of BiH’s real exchange rate over- and undervaluation, and current account gaps vary widely and are subject to large uncertainties. The estimates range from 17 percent undervaluation to 29 percent overvaluation. Significant uncertainty surrounds these estimates due to the large forecast errors of regression-based estimates, the assumption regarding BiH’s business cycle, and the assumed import and export elasticities to real exchange rate movements.
D. Analysis of Export Performance
Export performance and structure 42. Export growth has been robust in recent years. The value of exports of goods rose from about 18 percent of GDP in 2003 to 29 percent of GDP in 2007. Export growth registered an average of 26 percent between 2004 and 200618, and slowed down to 15 percent in 2007. BiH’s export growth over the recent period has been better than the regional average. Real export growth from 2003 to 2007 registered 69 percent; this is higher than the average export growth of the new member states (NMS) at 61 percent and much higher than the average export growth of the non-NMS Southeastern European (SEE) countries (excluding BiH).
Growth of Export Value (in KM) and Its Contribution (Percent)
0
10
20
30
40
50
60
2004 2005 2006 20070
10
20
30
40
50
60
VAT related impactNon-metal export Metal export
Sources: CBBH; and IMF staff estimates.
43. BiH’s recent experience with an export boom is similar to the one of the new member states starting in the mid 1990s. As BiH started its transition path only in the late 1990s, it is still going through a catch-up phase. Studying the dynamic of export structure in eight new member states, Fabrizio, Igan and Mody (2007) conclude that between 1994 and
18 The VAT impact on exports in 2006 which is about 14 percent is taken out from the growth calculation.

29
2004, these countries went through a catch-up phase during which they put into good use their human capital in moving up the technology and quality ladder. These factors have allowed them to maintain the dynamism of their exports despite exchange rate appreciations.
Real Export Growth, 2003-07 (Percent)
0
20
40
60
80
100
EST
LTA
LTU
CZE
HU
N
POL
SVK
SVN
BGN
RO
M
ALB
BIH
HR
V
MKD
SRB
Ave
NM
S
Ave
Baltic
s
Ave
CEE
-5
Ave
SEE,
non
-NM
S
Sources: WEO; and IMF staff calculations.
44. BiH has also gained a significant share in world exports in the last few years. From 2003 to 2007, BiH’s market share in world exports rose by 42 percent, which exceeds the regional average of around 30 percent. It is however important to keep in mind that the large gain in market share may reflect BiH’s position as a newer entrant into the world market compared to the NMS. Newer entrants have a significant catch-up possibility and a country’s share saturates at some point.
Change in World Market Share, 2003-07 (Percent)
-10
0
10
20
30
40
50
60
EST
LTA
LTU
CZE
HU
N
POL
SVK
SVN
BGN
RO
M
ALB
BIH
HR
V
MKD
SRB
Ave
NM
S
Ave
Baltic
s
Ave
CEE
-5
Ave
SEE,
non
-NM
S
Sources: Direction of Trade Statistics; and IMF staff calculations.
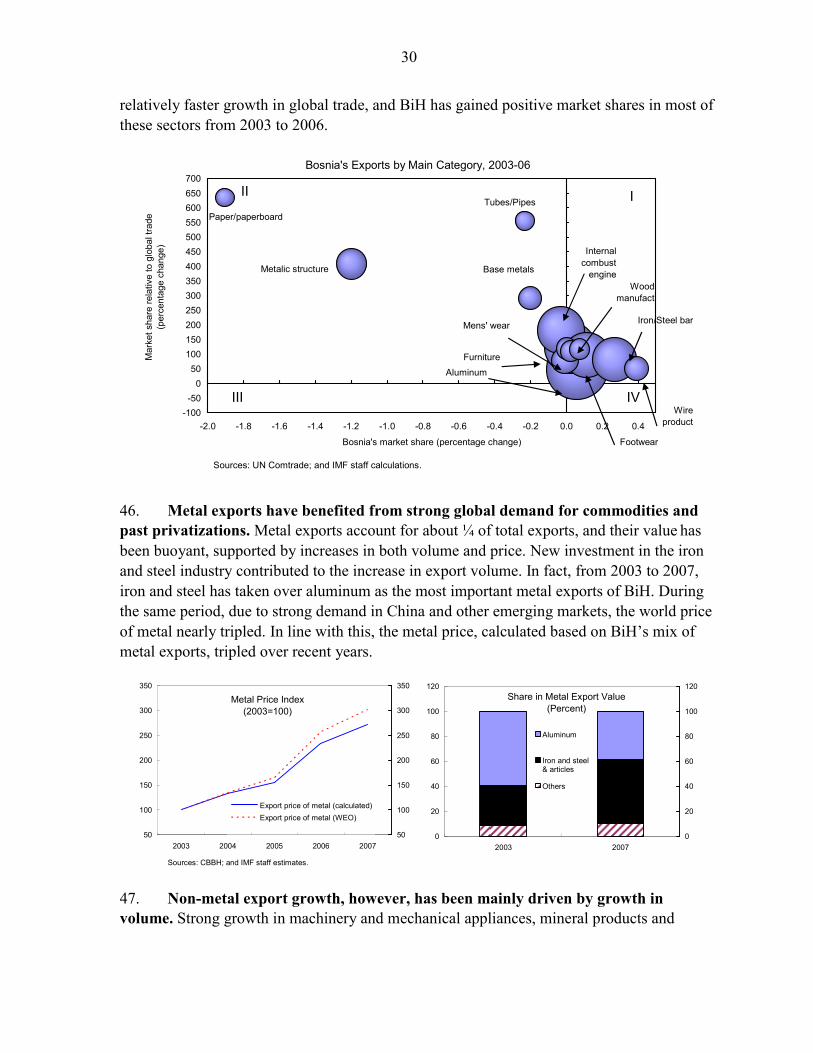
45. The gains in market share have been broad-based across sectors, especially in those with relatively faster growth in global trade. Market share gains are largest in iron-steel and wire products. All of BiH’s 15 top manufacturing products are in the sectors with
30
relatively faster growth in global trade, and BiH has gained positive market shares in most of these sectors from 2003 to 2006.
Sources: UN Comtrade; and IMF staff calculations.
Bosnia's Exports by Main Category, 2003-06
-100-50
050
100150200250300350400450500550600650700
-2.0 -1.8 -1.6 -1.4 -1.2 -1.0 -0.8 -0.6 -0.4 -0.2 0.0 0.2 0.4
Bosnia's market share (percentage change)
Mar
ket s
hare
rela
tive
to g
loba
l tra
de
(per
cent
age
chan
ge)
III
III IV
Paper/paperboard
Metalic structure
Tubes/Pipes
Base metals
Furniture
Aluminum
Iron/Steel bar
Internal combust
engine
Footwear
Wire product
Mens' wear
Wood manufact
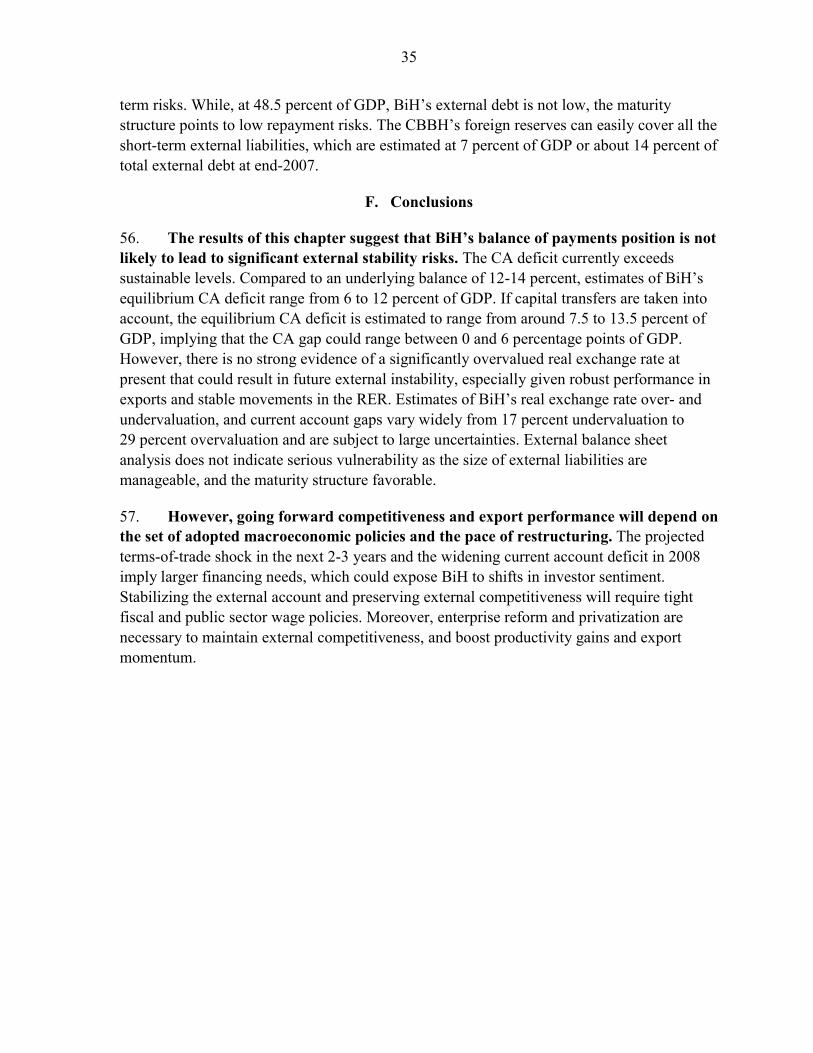
46. Metal exports have benefited from strong global demand for commodities and past privatizations. Metal exports account for about ¼ of total exports, and their value has been buoyant, supported by increases in both volume and price. New investment in the iron and steel industry contributed to the increase in export volume. In fact, from 2003 to 2007, iron and steel has taken over aluminum as the most important metal exports of BiH. During the same period, due to strong demand in China and other emerging markets, the world price of metal nearly tripled. In line with this, the metal price, calculated based on BiH’s mix of metal exports, tripled over recent years.
Metal Price Index (2003=100)
50
100
150
200
250
300
350
2003 2004 2005 2006 200750
100
150
200
250
300
350
Export price of metal (calculated)Export price of metal (WEO)
Share in Metal Export Value (Percent)
0
20
40
60
80
100
120
2003 20070
20
40
60
80
100
120
Aluminum
Iron and steel& articles
Others
Sources: CBBH; and IMF staff estimates.
47. Non-metal export growth, however, has been mainly driven by growth in volume. Strong growth in machinery and mechanical appliances, mineral products and

31
chemical products contributed to non-metal export growth. The mineral products are mostly electricity exports as demand for electricity in the region grew over the years.
Contribution to Metal Export Growth (Percent)
0
10
20
30
40
50
60
2004 2005 2006 20070
10
20
30
40
50
60
Price Volume
Contribution to Non-Metal Export Growth (Percent)
0
10
20
30
40
50
60
2004 2005 2006 20070
10
20
30
40
50
60
Price Volume
Sources: CBBH; and IMF staff calculations.
48. In terms of export structure, BiH’s exports have shifted away from light manufacturing towards metal products and machinery. The share of machinery and mechanical appliances exports improved from 8.2 to 12.9 percent. On the resource-intensive side, the share of metal exports has increased from 22.4 percent to 27.7 percent of total exports. Meanwhile, the share of light manufacturing goods—which include textile, footwear and miscellaneous furniture—shrank, and the share of wood and wood products fell sharply.
Composition of Exports, 2003 (In Percent)
Chemical products, 2.7 Others, 19.3
Textile and footwear, 12.1
Machinery and mechanical
appliances, 8.2
Miscellaneous furniture, 9.0
Wood and wood products, 16.8
Mineral product, including
eletricity, 9.5
Base metal and articles thereof,
22.4
Composition of Exports, 2007 (In Percent)
Base metal and articles thereof,
27.7
Mineral product, including
eletricity, 11.1
Wood and wood products, 8.9
Miscellaneous furniture, 7.7
Machinery and mechanical
appliances, 12.9
Textile and footwear, 10.6
Others, 15.7Chemical
products, 5.5
Source: CBBH.
49. There is further evidence that the composition of BiH exports shifted towards resource-intensive exports. The classification of manufacturing industries by factor inputs19 shows that the share of resource-intensive products increased from 48 percent in 2003 to 19 Based on the classification by Landesmann and Stehrer (2003). Low-tech and labor intensive products include food, textiles, animal and vegetable oils, clothes, footwear, and leather products. Resource-intensive products include wood products, chemicals, metals and nonmetallic mineral products. Medium- to high-tech products include machinery and transport equipment and electrical and optical equipment. For more details, see Appendix Table 1.

32
56 percent in 2006. At the same time, the share of medium- to high-tech exports fell from 31 percent to 25 percent, while the share of low-tech labor-intensive exports also fell slightly from 21 to 19 percent over the same period. This shift makes BiH more vulnerable to swings in commodity price at the global level.
50. The structure of exports based on labor-skill requirements20 has also shifted towards low-skill products as resource-intensive products generally require low skill. The share of low-skill exports rose from about half of merchandise exports in 2003 to about 56 percent in 2006, at the expense of medium-skill exports. The share of high-skill exports remain small around 4 percent, and fell slightly over the period.
Exports by Labor Skills (In percent of total exports)
0%
20%
40%
60%
80%
100%
2003 2006
High-skill Medium-skill Low-skill
Exports by Technology Levels (In percent of total exports)
0%
20%
40%
60%
80%
100%
2003 2006Medium to high tech Resource intensiveLow-tech labor intensive
Sources: UN Comtrade and staff calculations.
51. This shift away from medium- and high-tech products towards resource-intensive products is unlike the experience of most NMS. The shift away from low-medium towards high tech products during the transition period among the NMS is well documented. For example, Fabrizio, Igan and Mody (2007) show that exports in CEE-8 have moved up the technology and quality ladder over the 1994-2004 period, with medium- to high-tech products accounting between about 25 percent (Latvia) to almost 80 percent (Hungary) by 2004. Regarding export markets, BiH’s main export destination has also shifted from the advanced European markets towards emerging European markets (Table 7). This shift represents a shift towards more dynamic and growing markets. Due to its historical and cultural ties, Croatia, Slovenia and Serbia have always been important export markets for BiH. Over the recent periods, the share of this group of “neighbors” has increased from 40 to about 44 percent with most gain in Slovenia and Serbia. The share of other emerging European markets also rose from 3 percent to 10 percent at the expense of the share of Germany and other advanced European countries.
20Based on the classification by Peneder (1999). See Appendix Table 1 for more details.

33
Table 7. Direction of Bosnian Merchandise Exports, 2003 and 2006
2003 2006
Neighbors 39.9 44.1Croatia 20.3 18.7Slovenia 10.6 12.2Serbia 9.0 13.2
Advanced European countries 53.1 40.9Germany 18.7 12.9Italy 14.1 13.8Other advance European countries 20.4 14.1
Other emerging European countries 3.4 10.2
The rest of the world 2.8 1.3Source: UN Comtrade.
Constant market share analysis
52. To assess export competitiveness more thoroughly, a constant market share analysis (CMSA) is conducted. CMSA provides a structure to analyze BiH’s export growth and assess to what extent growth was due to competitiveness gains or driven by demand in particular markets or for particular commodities (see Appendix for methodology). Due to limited data (no detailed export data for BiH before 2003), the CMSA was conducted using the UN Comtrade data between 2003 and 2006.21
53. The CMSA shows that BiH’s export growth over 2003-06 can be mainly explained by the competitiveness effect (Table 8). World trade development accounts for about 20 percent, while the residual—the competitiveness effect—contributes to about 72 percent of the increase in exports over the period. The contribution of the market distribution effect of about 6 percent reflects the increase in exports in growing markets such as Serbia, Slovenia and other emerging European countries.
21 There are 9 commodity groups based on product disaggregation at the SITC 1-digit level and market disaggregation into 11 regions based on the importance as Bosnia & Herzegovina’s export destination (Croatia, Serbia, Slovenia, Germany, Italy, Austria, Hungary, USA, other advanced European countries, other emerging European countries, the rest of the world).

34
Table 8. Constant Market Share Analysis of BiH’s Export Growth
2003-2006 1/
Change in exportsIn USD billions 2.4Growth rate (in percent) 233.6
In percent of total increase in exportsGlobal growth effect 21.6Commodity composition effect 0.4Market distribution effect 6.4Competitiveness 71.6
Sources: UN Comtrade and staff calculation.1/ Based on commodity composition of exports in 2003
54. The competitiveness effect reflects changes in quality and composition of Bosnian exports as well as the effects of favorable export prices. Manufactured goods account for 33 percent of the residual from the CMSA (Table 9). About 80 percent of the overall growth of manufactured goods is from metal products, whose world price rose over the period.
Table 9. Share in Competitiveness Effect by Commodity Group (In percent of total competitiveness effect)
No. Commodity group 2003-2006
0 Food and live animals 4.81 Beverages and tobacco 0.32 Crude Materials, inedible, except fuels 18.83 Fuels, lubricants, including electricity 4.64 Animal, vegetable oil, fat, wax 0.85 Chemicals 5.16 Manufactured goods 32.77 Machines, transport equipments 12.68 Miscellaneous manufactured articles 20.39 Goods not classified 0.0
Sources: UN Comtrade and staff calculation.
E. External Balance Sheet Analysis
55. BiH’s net international investment and external balance sheet are relatively benign. The net position worsened from -44 percent of GDP to -51 percent of GDP at end-2007, mainly reflecting the increase in FDI inflows as external debt has remained stable (Figure 1). The composition of external debt has shifted towards more commercial banks’ borrowing and less public sector borrowing. External assets have increased by more than 10 percentage points of GDP, reflecting stronger international reserve position and commercial banks’ foreign assets. Also, BiH’s external balance sheet does not suggest near-
35
term risks. While, at 48.5 percent of GDP, BiH’s external debt is not low, the maturity structure points to low repayment risks. The CBBH’s foreign reserves can easily cover all the short-term external liabilities, which are estimated at 7 percent of GDP or about 14 percent of total external debt at end-2007.
F. Conclusions
56. The results of this chapter suggest that BiH’s balance of payments position is not likely to lead to significant external stability risks. The CA deficit currently exceeds sustainable levels. Compared to an underlying balance of 12-14 percent, estimates of BiH’s equilibrium CA deficit range from 6 to 12 percent of GDP. If capital transfers are taken into account, the equilibrium CA deficit is estimated to range from around 7.5 to 13.5 percent of GDP, implying that the CA gap could range between 0 and 6 percentage points of GDP. However, there is no strong evidence of a significantly overvalued real exchange rate at present that could result in future external instability, especially given robust performance in exports and stable movements in the RER. Estimates of BiH’s real exchange rate over- and undervaluation, and current account gaps vary widely from 17 percent undervaluation to 29 percent overvaluation and are subject to large uncertainties. External balance sheet analysis does not indicate serious vulnerability as the size of external liabilities are manageable, and the maturity structure favorable.
57. However, going forward competitiveness and export performance will depend on the set of adopted macroeconomic policies and the pace of restructuring. The projected terms-of-trade shock in the next 2-3 years and the widening current account deficit in 2008 imply larger financing needs, which could expose BiH to shifts in investor sentiment. Stabilizing the external account and preserving external competitiveness will require tight fiscal and public sector wage policies. Moreover, enterprise reform and privatization are necessary to maintain external competitiveness, and boost productivity gains and export momentum.

36
Figure 2. Bosnia and Herzegovina: External Position
Sources: CBBH, IMF, BIS and Fund staff estimates.
Net IIP (In percent of GDP)
HUN HRV
LVA EST
BGN BIH
LTU POL ROM
CZE SVN
-120 -100 -80 -60 -40 -20 0
20Financial Account by Component (In percent of GDP)
152006/07 2003
10
5
02006 2003 2004 2005 2007
Net other investment, other -5Net other investment, commercial banks Net FDI
-10
External Debt by Type of B rrower o(In percent of GDP)
-20 -10
0 10 20 30 40 50 60 70 70
External Debt by Original Maturity (In percent of GDP) 60
50
40
30
20
10
02003 2004 20 5 2006 0 2006 2007 20072003 2004 2005
Commercial bank -10Public sectorOther Short-term Long-term
-20
Gross and Net External Debt (In percent of GDP)
-20 -10
0 10 20 30 40 50 60 70
2003 2004 2005 2006 2007
External Assets by Type (In percent of GDP)
-20
-10
0
10
20
30
40
50
60
70
2003 2004 2005 2006 2007Commercial banks Gross external debt Official reservesNet external debt Others
Bosnia & Herzegovina's net IIP is not high by regional standards.
FDI has been the largest source contributing to the change in the IIP.
External debt has been stable... ...with little on the short-term side.
Net external debt has declined as external assets have increased.
The sizable increase in external assets in 2007 was due to RS Telekom privatization.
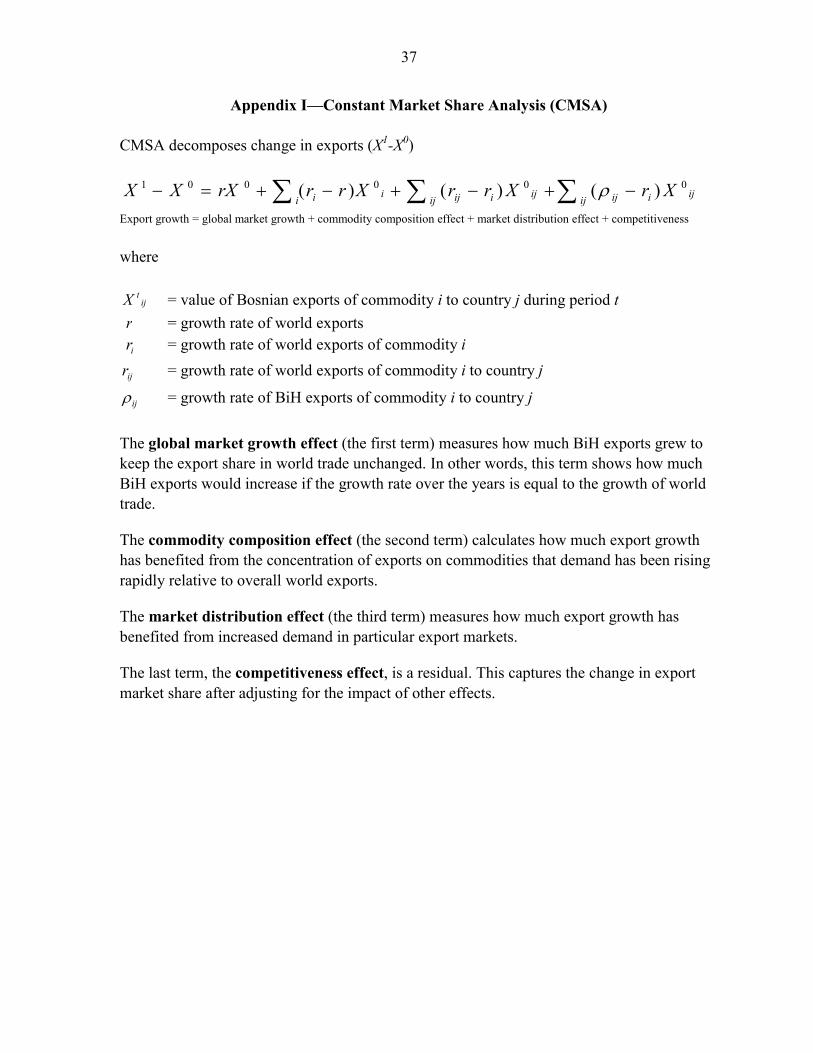
37
Appendix I—Constant Market Share Analysis (CMSA) CMSA decomposes change in exports (X1-X0)
∑∑∑ −+−+−+=−ij ijiijij ijiijii i XrXrrXrrrXXX 000001 )()()( ρ
Export growth = global market growth + commodity composition effect + market distribution effect + competitiveness where
ijtX = value of Bosnian exports of commodity i to country j during period t
r = growth rate of world exports = growth rate of world exports of commodity i ir
ijr = growth rate of world exports of commodity i to country j
ijρ = growth rate of BiH exports of commodity i to country j The global market growth effect (the first term) measures how much BiH exports grew to keep the export share in world trade unchanged. In other words, this term shows how much BiH exports would increase if the growth rate over the years is equal to the growth of world trade.
The commodity composition effect (the second term) calculates how much export growth has benefited from the concentration of exports on commodities that demand has been rising rapidly relative to overall world exports.
The market distribution effect (the third term) measures how much export growth has benefited from increased demand in particular export markets.
The last term, the competitiveness effect, is a residual. This captures the change in export market share after adjusting for the impact of other effects.

38
Appendix Table 1. Classification of Export Categories by Factor Intensity and Labor Skills
2-digit Category Category description Taxonomy: Factor Intensity Taxonomy: Labor Skill (SITC revision 3)
00 Live animals except fish Low-tech, labor intensive Low-skill 01 Meat and preparations Low-tech, labor intensive Low-skill 02 Dairy products and eggs Low-tech, labor intensive Low-skill 03 Fish/shellfish/etc. Low-tech, labor intensive Low-skill 04 Cereals and cereal preparations Low-tech, labor intensive Low-skill 05 Vegetables and fruit Low-tech, labor intensive Low-skill 06 Sugar, sugar preparations and honey Low-tech, labor intensive Low-skill 07 Coffee, tea, cocoa, spices Low-tech, labor intensive Low-skill 08 Animal feeding Low-tech, labor intensive Low-skill 09 Misc. food products Low-tech, labor intensive Low-skill 11 Beverages Low-tech, labor intensive Low-skill 12 Tobacco/manufactures Low-tech, labor intensive Low-skill 21 Hides, skins and fur skins Low-tech, labor intensive Low-skill 22 Oil-seeds and oil fruits Low-tech, labor intensive Low-skill 23 Crude rubber Resource intensive Medium-skill white collar 24 Cork and wood Resource intensive Medium-skill blue collar 25 Pulp and waste paper Resource intensive Medium-skill white collar 26 Textile fibers Low-tech, labor intensive Low-skill 27 Crude fertilizers/mineral Resource intensive Medium-skill white collar 28 Metal ores and metal scrap Resource intensive Low-skill 29 Crude animal and vegetable Low-tech, labor intensive Low-skill 32 Coal, coke and briquettes Resource intensive Low-skill 33 Petroleum and products Excluded Excluded 34 Gas natural and manufactured Excluded Excluded 35 Electric current Resource intensive Medium-skill blue collar 42 Fixed vegetable fats and oil Low-tech, labor intensive Low-skill 43 Animal or vegetable fats Low-tech, labor intensive Low-skill 51 Organic chemicals Resource intensive Medium-skill white collar 52 Inorganic chemicals Resource intensive Medium-skill white collar 53 Dyeing, tanning and color materials Resource intensive Medium-skill white collar 54 Pharmaceutical products Medium-to high tech High-skill 55 Perfume, cosmetic, and cleansar Medium-to high tech Medium-skill white collar 56 Fertilizers Resource intensive Medium-skill white collar 57 Plastics in primary forms Resource intensive Medium-skill white collar 58 Plastics in non-primary forms Resource intensive Low-skill 59 Chemical materials and products Resource intensive Medium-skill white collar 61 Leather manufactures Low-tech, labor intensive Low-skill 62 Rubber manufactures Resource intensive Low-skill 63 Cork and wood manufactures Resource intensive Medium-skill blue collar 64 Paper, paperboard, articles Resource intensive Medium-skill white collar 65 Textile yarn, fabrics, art. Low-tech, labor intensive Low-skill 66 Non-metallic mineral manuf. Resource intensive Low-skill 67 Iron and steel Resource intensive Low-skill 68 Non-ferrous metals Resource intensive Low-skill 69 Metal manufactures nes Resource intensive Low-skill 71 Power generating equipment Medium-to high tech Medium-skill white collar 72 Industry special machine Medium-to high tech High-skill 73 Metalworking machinery Medium-to high tech High-skill 74 General industrial machinery Medium-to high tech High-skill 75 Office machines Medium-to high tech High-skill 76 Telecommunications/sound equipment Medium-to high tech Medium-skill white collar 77 Electrical equipment Medium-to high tech Medium-skill white collar 78 Road vehicles Medium-to high tech Medium-skill blue collar 79 Other transport equipment Medium-to high tech Medium-skill blue collar 81 Prefabricated buildings Medium-to high tech Low-skill 82 Furniture and parts Medium-to high tech Medium-skill blue collar 83 Travel goods, handbags Low-tech, labor intensive Low-skill 84 Apparel/clothing/access Low-tech, labor intensive Low-skill 85 Footwear Low-tech, labor intensive Low-skill 87 Professional/scientific instrument Medium-to high tech Medium-skill white collar 88 Photographic equipment, clocks Medium-to high tech Medium-skill white collar 89 Miscellaneous manuf. Medium-to high tech Medium-skill blue collar 96 Coin nongold non current Resource intensive Low-skill 97 Gold non-monetary ex ore Resource intensive Low-skill
Sources: Peneder (1999) and Landesmann and Stehrer (2003).
39
References
Abiad, A., D. Leigh and A. Mody, 2007, “International Finance and Income Convergence: Europe is Different,” IMF Working Paper 07/64 (Washington: International Monetary Fund). Coudert V. and C. Couharde, 2005, “Real Equilibrium Exchange Rate in China,” CEPII Working Paper 05-01. Coudert V. and C. Couharde, 2002, “Exchange Rate Regimes and Sustainable Parities for CEECs in the Run-up to EMU Membership," Working Papers 2002-15, CEPII Working Paper 02-15. Fabrizio, S., D. Igan and A. Mody, 2007, “The Dynamics of Product Quality and International Competitiveness,” IMF Working Paper 07/97 (Washington: International Monetary Fund). International Monetary Fund, 2006, “Methodology for CGER Exchange Rate Assessments,” http://www.imf.org/external/np/pp/eng/2006/110806.pdf Jahjah, S., 2007, “External Balance Sheet and the Current Account Adjustment Required to Stabilize Net Foreign Liabilities,” in Bosnia and Herzegovina—Selected Issues, IMF Country Report No. 07/269 (Washington: International Monetary Fund). Jahjah, S., 2006, “Alternative Current Account Estimates,” in Bosnia and Herzegovina—Selected Issues, IMF Country Report No. 06/368 (Washington: International Monetary Fund). Landesmann, M. and R. Stehrer, 2003, “Structural Patterns of East-West European Integration: Strong and Weak Gerschenkron Effects”, in wiiw Structural Report 2003 on Central and Eastern Europe, Volume 1, The Vienna Institute for International Economic Studies. Lee, J., G. Milesi-Ferretti, J. Ostry, A. Prati, and L. Ricci, 2008,“Exchange Rate Assessments: CGER Methodologies,” IMF Occasional Paper No. 261 (Washington: International Monetary Fund). Peneder, M., 1999, “Intangible Investment and Human Resources,” Journal of Evolutionary Economics, Vol. 12, No. 1-2, pp. 107-34.