fy18 annual for personal use only report · 2014 winner: australia data centre service provider of...
TRANSCRIPT

NEXTDC Limited Appendix 4E Preliminary Final Report
Results for announcement to the market For the year ended 30 June 2018 (Previous corresponding period: to 30 June 2017)
Summary of Financial Information
Note 2018 $’000
2017 $’000
Change $’000
Change %
Revenue from ordinary activities 161,529 123,550 37,979 31%
Profit/(loss) from ordinary activities after income tax for the period attributable to members
1 6,639 22,999 (16,360) NMF1
Profit/(loss) after income tax attributable to members
1 6,639 22,999 (16,360) NMF
1. Profit after income tax for 30 June 2017 included an income tax benefit of $10.2 million which was primarily due to the recognition of accumulated tax losses as deferred tax assets.
Dividends No dividend has been proposed or declared in respect of the year ended 30 June 2018.
Net tangible assets 2018 2017
Basic net tangible asset backing per ordinary share $2.57 $1.75
Refer to the attached audited Financial Report for additional disclosures.
1 NMF = Not meaningful
For
per
sona
l use
onl
y

1 July 2017 to 30 June 2018
NEXTDC Limited
ABN 35 143 582 521
FY18
ANNUAL
REPORT
For
per
sona
l use
onl
y

Queensland iAwards
2016 Winner: AXONVX – Industrial and Primary Industries category
2016 Winner: AXONVX – Infrastructure nd Platforms Innovation of the Year
National iAwards
2014 Winner: ONEDC® – Merit Award in the Tools category
Financial Review Fast 100
2017 #71 fastest-growing Australian company over the past three years
2017 #5 highest revenue of Fast 100 companies
2014 #3 fastest-growing Australian company over the past three years
ARN ICT Industry Awards
2017 Highly Commended: Jeff Van Zetten, Head of Engineering and Design – Technical Excellence
2015 Winner: AXONVX – Best Telecommunications Initiative of the Year
2014 Winner: Telecommunications Vendor of the Year
2015 Winner: Service Provider of the Year
2014 Winner: Service Provider of the Year
2013 Winner: Sustainability
2013 Winner: Service Provider of the Year
Brill Awards, Asia-Pacific
2015 Winner: Efficient IT in the Product Solutions category
Frost & Sullivan
2017 Winner: Data Centre Services Growth Excellence
2016 Winner: Data Centre Services Growth Excellence Leadership Award
2014 Winner: Australia Data Centre Service Provider of the Year Award
DatacenterDynamics Awards, Asia-Pacific
2014 Winner: S1 Sydney – Innovation in the Mega-Data Centre
Deloitte – Technology
2014 #1 Deloitte Technology Fast 50 Australia
2014 #6 Deloitte Technology Fast 500 APAC
Master Builders Association Excellence in Construction Awards
2018 Winner: B2 – Brisbane – Best commercial building $5 - $50M
2016 Winner: S1 Sydney – Communications Buildings
Lord Mayor’s Business Awards
2017 Winner: B2 data centre – Port of Brisbane Award for Investment in Brisbane category
Datacloud Asia
2017 Excellence in Data Centre IT Architecture and Design
Systems and certifications
Uptime Institute
Industry awards
Australian Government
Data Centre Facilities Supplies Panel Multi Use List for the provision of Data Centre-as-a-Service (DcaaS)
ISO 27001:2013
Information Security Management System (ISMS) certification
ISO 14001:2015
Environmental Management System certification (C1, M1, S1)
ISO 9001:2015
Quality Management System certification
NABERS 4.5 star rating for energy efficiency
M1 MelbourneS1 Sydney
For
per
sona
l use
onl
y

C O N T E N T S
2Letter from the Chairman and CEO
97Corporate Directory
95Shareholder Information
89Independent Auditor’s Report to the Members
88Directors’ Declaration
43Financial Report
42Corporate Governance Statement
20Remuneration Report
Directors’ Report
41Auditor’s Independence Declaration
10
5About NEXTDC
1 JULY 2017 TO 30 JUNE 2018 | NEXTDC LIMITED ABN 35 143 582 521
NEXTDC Limited and controlled entities | FY18 Annual Report 1
For
per
sona
l use
onl
y

Letter from the Chairman and CEO
Douglas Flynn Chairman
Craig Scroggie CEO
1. EBITDA is a non-statutory financial metric representing earnings beforeinterest, tax, depreciation and amortisation. Non-statutory financial metrics have not been audited
2. Underlying EBITDA excludes distribution income of $3.2 million fromNEXTDC’s 29.2% investment in Asia Pacific Data Centre Group as well as$1.8 million of costs related to the current Asia Pacific Data Centre Group wind up process
3. FY17 statutory NPAT includes $10.2m of income tax benefit stemming from the recognition of unused historical tax losses (FY18: nil)
We welcome our shareholders to this year’s Annual Report, which marks the end of the financial year to 30 June 2018 (“FY18”) and another period of significant growth and strategic achievements.
Last year we wrote about how NEXTDC continued to expand the capacity of its existing facilities, the development of our second Sydney data centre (S2) as well as the B2 Brisbane and M2 Melbourne data centres nearing the point of opening in record time through NEXTDC’s continuous development methodology, and deep experience with construction and infrastructure supply partners.
In FY18 we opened both the B2 and M2 data centres - designed, built and certified to the industry’s highest standards and delivered in record time, as well as approach the completion and opening of S2. Additionally, with the announcement of three new sites: S3 Sydney, M3 Melbourne and P2 Perth, we continue to grow the pipeline of world-class, hyperscale next-generation data centres in Australian capital cities. NEXTDC intends to commence the construction of P2 during FY19, with practical completion scheduled for 1H FY20.
Key operational and financial metrics
In FY18 NEXTDC achieved significant year-on-year growth across key operational and financial metrics:
▪ Revenue increased 31% to $161.5 million
▪ Contracted utilisation increased 8.7MW to 40.2MW
▪ Underlying EBITDA1,2 increased 28% to $62.6 million
▪ Statutory net profit of $6.6 million, compared to a net profit of$23 million3 in FY17
▪ $285 million of capital expenditure was incurred
▪ Cash and term deposits of $418 million at 30 June 2018
NEXTDC was also active on the funding front during FY18, closing:
▪ an institutional equity placement of $297 million, including $150million placed with our new shareholder UniSuper, in April 2018
▪ a retail Share Purchase Plan that raised a further $80 million inMay 2018
▪ securing an upsizing of the Company’s undrawn senior secureddebt facility from $100 million to $300 million with a syndicateof six lenders led by the National Australia Bank in August 2017.
Subsequent to 30 June 2018, NEXTDC also successfully closed a $300 million unsecured Notes IV offer, bringing NEXTDC’s pro-forma FY18 cash and term deposit balance to $718 million. We recognise the importance of creating value for our shareholders and we therefore continue to adopt a disciplined approach to capital raising and allocation.
NEXTDC Limited and controlled entities | FY18 Annual Report 2
For
per
sona
l use
onl
y

Increasing importance of the data centre
The next few years will see organisations experimenting with new applications and systems to drive value from new technologies in Blockchain, Internet of Things, mobile 5G and Artificial Intelligence. Often these will use NEXTDC’s Data Centre-as-a-Service offering to gain access to many of the popular vendor clouds, such as Microsoft Azure, Amazon Web Services, Oracle Cloud, IBM Cloud or Google Cloud through our direct connection platform including our AXON elastic cloud on ramps. Cutting edge developers are thus provided with a fertile environment in which to incubate the next generation of information technology (IT).
The next decade will see global cloud infrastructure continue its extraordinary growth, continuing to fuel and accelerate ground breaking advancements in Artificial Intelligence, the Internet of Things and Blockchain technology. Start-up businesses are ready to build enterprises on a scale that was previously unimaginable only a few years ago, and the introduction of mobile 5G services in 2020 will once again change the ways businesses and individuals access and share information.
We are living in the most exciting time in human history. The exponential convergent consequences of these technologies will herald a new age of accelerated advancements in many industries. This is what is referred to as the 4th Industrial Revolution - the cyber physical age. NEXTDC is proud to be the leading data centre infrastructure platform supporting Australian businesses to take advantage of these extraordinary opportunities.
Setting new standards for Australia, Asia and Worldwide
We are building the infrastructure platform for the digital economy and have established ourselves as the key partner to support global cloud computing providers, enterprises and governments of the future. Over the past 12 months, we have received a significant number of industry awards, accolades and certifications that recognise our innovation and leadership in the industry. Importantly, NEXTDC’s B2 and M2 data centres were the first in Australia to receive Uptime Institute (UTI) Tier IV Certification of Constructed Facility (TCCF), to position the company as the only builder and operator of UTI TCCF co-location data centres in Australia and Asia.
The UTI certification confirms that our data centres are the first in the world to achieve UTI TCCF with an isolated-parallel uninterruptible power supply system, an innovation breakthrough in data centres globally and setting the standard for the world’s best practice. NEXTDC was consequently also awarded UTI Global Brill Award for excellence in design, the data centre industry’s premier design and engineering awards, granted to projects, ideas and products that improve the industry’s ability to sustainably deliver IT services to customers and partners.
Largest planned growth
NEXTDC recently announced plans to acquire three new sites in Australia for additional data centres in Sydney, Melbourne and Perth: S3 80MW, M3 80MW and P2 20MW – these new facilities in Sydney and Melbourne will be the largest ever built in Australia. That takes NEXTDC’s total future capacity to over 300MW.
Leadership in energy efficiency and sustainability
NEXTDC has a strong focus on energy efficiency and sustainability. Our facility infrastructure has been engineered to deliver extremely high energy efficiency, lowering the carbon footprint for our customers. Over the past 12 months, NEXTDC achieved a National Australian Built Environment Rating System (NABERS) 4.5 star rating for energy efficiency in M1 and S1 and ISO 14001 certification for Environmental Management at M1, S1 and C1. Our second generation of data centres, including B2, M2 and S2, are designed to achieve a level of efficiency not previously attained in the industry, NABERS 5 star rating for energy efficiency, as well as the ISO 14001 certification.
NEXTDC owns and operates its own solar array on the roof of its M1 data centre and has also been a Principal Partner to the Melbourne Renewable Energy Project since its inception in 2014. In FY18, financial close on this project was achieved, enabling the construction of the 80MW Crowlands Wind Farm in Victoria. This is another first for a data centre operator in the Asia Pacific region.
Continuing our focus on leadership through industry innovation, at the time of writing, NEXTDC is undergoing an audit of its corporate carbon emissions under the Australian National Carbon Offset Standard (NCOS). We have set ourselves an ambitious goal of being the first operator in the region to achieve carbon neutrality by offsetting emissions associated with our corporate activities and become certified under the Australian Government’s Carbon Neutral Initiative. Our aim is to offer our customers the opportunity to similarly offset their emissions in our data centres in the near future – yet another first for a data centre operator in the Asia Pacific region.
Humans and hardware in harmony
Customer First is a core value for our passionate team. At NEXTDC we are obsessed with delivering the industry’s best customer experience. Over the past 12 months, we focused on implementing innovative customer experience strategies to extend our lead in the industry and deliver extraordinary customer interactions. We take pride in the fact our facilities and the people that work there provide a passionate, friendly, comfortable and productive environment for customers, every time they visit.
At NEXTDC, we pay as careful attention to the needs of our customers, as we do to their infrastructure and their data centre service needs. We understand the needs of data centre users and we are dedicated to providing unrivalled reliability, security and connectivity in an environment that is friendly to both humans and hardware. Our facilities at M2, B2 and P1 have already received significant industry awards showcasing our success in delivering the
best customer experience in the industry.
NEXTDC Limited and controlled entities | FY18 Annual Report 3
For
per
sona
l use
onl
y

Doug Flynn Craig Scroggie
Chairman CEO
Giving back to our local communities
NEXTDC aims to be the leader in everything it chooses to do. With our corporate philanthropy project, we launched extensive initiatives to improve the communities in which we live and work through four core charities and giving programs. By launching the ‘Live to Give’ initiative, our teams and the company will be able to support local communities amongst each of our data centre facility locations. Companies can do more than just make money, they can give back to the community and use their success to improve our society. It’s a great honour to be able to commit to supporting our charity partners and make a meaningful positive impact on our society.
NEXTDC’s ‘Live to Give’ program comprises:
▪ partnership with The Smith Family, donating $50,000 and promoting staff volunteering and mentoring programs
▪ partnership with Pledge 1%, enabling staff to devote 1% of theirtime to give back
▪ launching a workplace giving program with $1:$1 donation matchingfor Cancer Council, beyondblue and UN Women
▪ providing all staff with additional paid Volunteer Days, allowingteams and individuals to spend additional time with their preferredcharity or giving back to their local community.
Building the platform for the digital economy
It’s only just begnning. The next few years will witness some of the most significant technology advances in our history, with individuals, businesses and Governments adopting technology built on technology, an exponential rate of change, paving a dynamically advanced future. NEXTDC will play a critical role as the platform for the digital economy - powering, securing and connecting the world’s most valuableresource – data.
On behalf of NEXTDC, we thank you for your ongoing support as we continue our exciting growth trajectory, and look forward to meeting with those of you who are able to attend our upcoming Annual General Meeting (AGM).
NEXTDC Limited and controlled entities | FY18 Annual Report 4
For
per
sona
l use
onl
y

ABOUT
NEXTDC
Value proposition, business strategy, environment and social reporting.
For
per
sona
l use
onl
y

NEXTDC value proposition and business strategyAbout NEXTDC
NEXTDC is an ASX200-listed technology company enabling business transformation though innovative data centre outsourcing solutions, connectivity services and infrastructure management software.
As Australia’s leading independent data centre operator with a nationwide network of Tier III and Tier IV facilities, we provide enterprise-class colocation services to local and international organisations. With a focus on sustainability and renewable energy, we are leading the industry with award-winning engineering solutions for energy efficiency and NABERS 4.5 star certification.
NEXTDC is extending its leadership in data centre services through our innovative DCIM-as-a-Service software platform, ONEDC®, which enables customers to centrally manage infrastructure colocated with NEXTDC; and our award-winning Ethernet connectivity platform, AXON – delivering rapid, secure connections to cloud services on-demand.
Our Cloud Centre marketplace hosts the country’s largest independent ecosystem of carriers, cloud and IT service providers, enabling our customers to source and connect with over 470 suppliers, partners and customers and build integrated hybrid cloud deployments.
NEXTDC’s carrier and vendor neutrality is the foundation of the
Company’s channel-first sales model – delivering flexibility and scale to partners and end-customers with best of breed data centre services.
Uniquely for Australia, NEXTDC’s nationwide data centre footprint allows customers and partners to access nationally standardised services and benefit from unified management to ensure the quality, consistency and reliability of IT services and ensure the sovereignty of their data.
NEXTDC is a technology pioneer, connecting Australia to the world’s leading networks and cloud platforms and integrating the next generation of IT services, to enable NEXTDC’s customers to take advantage of the extraordinary opportunities of the digitally interconnected world.
Vision and Purpose
NEXTDC’s vision is to help enterprises harness the digital age, improving our society through the advancement of technology.
NEXTDC’s purpose is to be the leading customer-centric data centre services company, delivering solutions that power, secure and connect enterprise.
NEXTDC’s business featuresCarrier and vendor neutralityNEXTDC and its subsidiaries maintain true neutrality in the marketplace due to a channel-first sales strategy. By not offering telecommunications or IT managed services and competing with the channel, more organisations are encouraged to join the nationwide Cloud Centre community and leverage the diverse onsite connectivity options to develop ‘best fit’ integrated solutions for their customers.
Simplified national data centre serviceA key competitive advantage for NEXTDC is the Company’s nationwide data centre footprint across five of Australia’s capital cities: Sydney, Melbourne, Brisbane, Canberra and Perth. This allows organisations to gain a single, nationwide data centre partner under the one contract, with consistent pricing, SLAs and customer service processes across all cities, reducing their administrative burden, and allowing them to easily expand and manage their data centre service.
World-class facilities and expertiseNEXTDC’s expert in-house engineering team adds significant value with both their operational cadence and customer engagement on all non-standard design requirements. The same engineers who design and build the facilities also work with large enterprise customers
to create solutions tailored for their specific needs. NEXTDC offers market-leading levels of reliability and availability (100 percent no-break power guaranteed) – critical to businesses using cloud services – and extremely high energy efficiency that lowers their carbon footprint.
Risk reductionGovernment agencies and private enterprise need to address concerns as to whether their use of off-shore data storage meets strict Australian Privacy Act and/or other government-initiated
recommendations and requirements for the protection of sensitive information. This has led many organisations to increase control over access to their data by having it hosted in the same legal jurisdiction as their base of operations. As an Australian-owned company operating solely on Australian soil, NEXTDC can ensure the ‘data sovereignty’ of hosted information and infrastructure – which is protected by strict security systems and protocols featuring a multi-layered security access system.
Additionally, if NEXTDC does not follow best practice standards, there is a possibility its processes may become inefficient and ineffective, impacting negatively on customer service and resulting in breaches of legislation. To address this risk, NEXTDC has implemented a suite of ISO certifications to assure customers of the resilience and integrity of its systems and processes.
NEXTDC Limited and controlled entities | FY18 Annual Report 6
For
per
sona
l use
onl
y

Hubs for connectivityNEXTDC’s Cloud Centre community is the largest independent network of IT service providers, carriers and cloud providers in Australia. The benefit of colocating with a neutral provider like NEXTDC is the ability to connect to all suppliers and business partners in the one place, reducing costs and minimising latency. Complementing the direct physical connections offered within NEXTDC facilities, AXON enables customers to activate high-speed private connections to any number of carriers and cloud platforms on-demand, and access simplified inter-captial connectivity services.
Centralised data centre asset managementThe ONEDC® cloud platform for DCIM-as-a-Service allows customers to centrally manage their data centre assets providing a consolidated view of their infrastructure in NEXTDC data centres through a single pane of glass.
Expanded sales pipeline through channel partnersChannel partners range between large international, domestic and regional channel partners, which are focussed on enterprise and government customers, and small to mid-sized local channel partners that are focussed on the SME market. Through NEXTDC’s channel partners, which include Optus and Telstra, the Company effectively has an extended national sales team of over 4,000 promoting NEXTDC services.
Customer experienceOur focus on customer experience makes NEXTDC stand out in the industry, spanning all facets of our business from the support we give to customers during the on-boarding process, to the responsiveness of our customer service teams and touches.
Channel-first sales strategyNEXTDC’s data centre partner program is the largest and most active in Australia, centred on our channel go-to-market model that enables flexible solutions for end users, and features an extensive support program with a tiered system of pricing, access to tailor-made marketing material, partner events and shared publicity.
We have so far partnered with more than 470 vendors, telecommunications providers and providers of infrastructure, platform and cloud services, and we drive business through this community wherever possible, leveraging their large sales teams and customer base to reach a broader cross-section of the end-user market.
Our partners use NEXTDC data centres to house their own servers and IT infrastructure, and enable their customers to connect directly to them within the facility. We have particularly strong relationships with our Premier Partners, which re-sell NEXTDC services to their customers, along with their own cloud and/or managed services, offering a comprehensive, end-to-end solution.
NEXTDC’s channel partner ecosystem includes:
▪ Global cloud providers such as Google Cloud, AWS Direct Connect, Microsoft ExpressRoute, IBM Cloud and Oracle Cloud.
▪ Large IT services providers: both local and regional, such as: Wipro, Tech Mahindra, NEC, Dimension Data, Fujitsu, NTT and Data#3.
▪ Telecommunications providers: NEXTDC has more than 60 domestic and international partners including Optus, Telstra, AAPT, Vocus, TPG, PCCW, Superloop and CenturyLink.
▪ Specialist and mid-size IT managed service providers and cloud providers such as Blue Central, Harbour IT, Cloud Plus, TD Logicalis, Somerville Group, Connectivity IT, HighQ, Ping Co, Sundata, SureBridge IT, Brennan IT and ZettaNet.
▪ IT consultants such as Deloitte, Eventra and Data Centre Technologies.
NEXTDC Limited and controlled entities | FY18 Annual Report 7
For
per
sona
l use
onl
y

Products and servicesNEXTDC focuses on providing scalable, on-demand services to support outsourced data centre infrastructure and cloud connectivity for enterprises of all sizes, while delivering cost efficiency and agility.
Data Centre-as-a-Service (DCaaS)
Hyper-scale colocation – secure, high-density data centre space with redundant power supply and support services in enterprise-class facilities. Customers host their own infrastructure or storage, using the facility as an extension of their own property. Spaces range from a quarter rack to multiple racks to large areas of floor space that customers can design to their own requirements.
Connectivity-as-a-Service (CaaS)
We offer both physical and virtual connection options. Cross Connects are physical fibre connections within a data centre facility, while AXON offers virtual connections to clouds, carriers and suppliers in any data centre on the AXON network.
Data Centre Infrastructure Management-as-a-Service (DCIMaaS)
The ONEDC®cloud platform enables centralised management of data centre assets in NEXTDC facilities; delivering real-time intelligence to decision-makers, for a monthly subscription per rack.
Professional Services
NEXTDC provides data centre professional services for the entire project life cycle, including technical advisory, migration planning, project management, deliveries, building, and operational infrastructure support.
Thriving in the age of digital disruptionThe advancement of technology is delivering a myriad of new capabilities for organisations, as traditional business models are being bypassed in favour of more flexible, interconnected ecosystems of complementary services.
This shift is as much of a challenge for CIOs as it is an enabler to future-proof their business. By releasing their organisation from a linear value-chain, where they work with established partners and add incremental value, to being part of a more agile, heterogenous network, they gain a true competitive edge and the opportunity to expand exponentially.
Public and private clouds, infrastructure as-a-service, and the apps driving the sharing economy, can now be rapidly provisioned and operated with minimal effort by the end-user. Access to powerful new business tools and the ‘network effect’ that comes from a platform of interconnected users, is shaping not only the next generation of products and services organisations are able to deliver, but the unique experience they offer their customers.
Gartner recently identified five key pillars for businesses to reinvent their business operations and build a successful digital foundation: information systems, customer experience, analytics and intelligence, the Internet of Things (IoT) and ecosystems. When these elements are working in sync they have a powerful effect on productivity.
For example, IDC predicts that by 2020, for every dollar Salesforce makes in Australia, the company’s ecosystem of customers and partners will generate more than four dollars by building applications and services on top of the Salesforce platform.
Gartner defines a digital ecosystem as an interdependent group of actors (enterprises, people, things) sharing standardised digital platforms to achieve a mutually beneficial purpose.
Any business can tap into a digital ecosystem, but if it is to succeed, it needs the ability to acquire, store, access and transmit huge volumes of data, and integrate a range of services and networks, while maximising security and performance.
Modern businesses need IT infrastructure that can scale and adopt new elements rapidly, and a more agile and complex communications network than what many are presently using. Today, data centre colocation has become a critical resource for building partnerships by enabling dynamic collaboration through flexible interconnections, in a single, secure location.
Adopting an ecosystem strategy requires a new way of doing business. IT leaders will need to actively form partnerships or alliances with vendors and service providers to really understand and evaluate how the technology can be used.
By using specialised services from the ecosystem to support different capabilities – for example, mobile, search engine, CRM, or online payments – CIOs can scale their operations to fulfil spikes in demand, and draw on outsourced expertise as new, disruptive IT is introduced.
Ultimately, this all contributes to the massive growth and overall value the data centre delivers customers. With this growth comes an unparalleled opportunity for CIOs to navigate the landscape of services and drive a new IT strategy that will support their organisation through oncoming waves of digital disruption.
NEXTDC Limited and controlled entities | FY18 Annual Report 8
For
per
sona
l use
onl
y

Sustainability
As a recognisable and trusted brand, being a sustainable organisation is very important to NEXTDC as we consider the long term environmental and social impacts of our organisation.
For NEXTDC, sustainability is about ensuring that our business is managed to account for social, environmental and economic risks and opportunities. In the short and medium term, being sustainable also comes with financial benefits and value creation opportunities for shareholders. Implementing environmental initiatives improves our operating costs and social sustainability practices improve staff morale and supplier relationships, which has a flow on effect of improving productivity.
For additional information, please see the document Environment and Sustainability Report available from www.nextdc.com.
NEXTDC applies a materiality assessment that categorises and prioritises the most relevant sustainability issues concerning the organisation and its stakeholders. This Environment and
Sustainability Report is an opportunity to communicate and disclose to our shareholders how environmental and social considerations are addressed and monitored by the company.
Impact of market growth demonstrated by NEXTDC
30 June 2018 30 June 2017 30 June 2016 30 June 2015 30 June 2014
ECONOMIC INDICATORS
Customers1 972 772 647 478 302
Cross Connects2 8,671 6,342 4,575 2,893 1,488
CAPACITY AND UTILISATION
Operating facilities3 7 5 5 5 5
Installed capacity4 46.4MW 36.0MW 34.7MW 24.4MW 19.7MW
Contracted customer utilisation5 40.2MW 31.5MW 26.1MW 21.7MW 11.9MW
% of installed capacity 87% 88% 75% 89% 59%
Billing customer utilisation6 34.3MW 29.5MW 23.2MW 14.0MW 10.6MW
% of installed capacity 74% 82% 67% 57% 54%
1. Customers: the number of counterparties (including partners) which have executed a Master Services Agreement with NEXTDC.2. Cross Connects: the number of both physical and elastic cross connections.3. Operating Facilities: The number of facilities which were operational at the reporting date.4. Installed Capacity: Includes the total power capability of the data centre space fitted out across all operating facilities.5. Contracted Customer Utilisation: Total of all sold capacity in MW including customers with deferred contract commencement dates.6. Billing Customer Utilisation: Total of all sold capacity in MW where the service has commenced.
NEXTDC Limited and controlled entities | FY18 Annual Report 9
For
per
sona
l use
onl
y

Directors’ Report The directors present their report on the consolidated entity (referred to hereafter as ‘NEXTDC’, the ‘Company’ or ‘the Group’) consisting of NEXTDC Limited and the entities it controlled at the end of, or during, the year ended 30 June 2018.
Directors The following persons were directors of the Company during the year:
Douglas Flynn Craig Scroggie Stuart Davis Gregory J Clark AC Sharon Warburton
Principal activities During the year, the principal continuing activities of the Group consisted of the development and operation of independent data centres in Australia.
Operating and financial review During the year, the Company has:
Opened its second Brisbane site, B2, and secondMelbourne site, M2, which are the first Asia Pacificcolocation data centres to receive Tier IV Certificationof Constructed Facility from the Uptime Institute
Successfully raised $377.4 million of additional equityfunding, consisting of a $297 million institutionalplacement in April 2018, and a share purchase plan of$80.4 million in May 2018
Contracted 8.7MW of new capacity Acquired a 29.2% stake in Asia Pacific Data Centre
Group (ASX: AJD) Expanded its target network footprint from 126MW to
over 300MW with the announcement of three new intended data centres - S3 Sydney (80MW), M3 Melbourne (80MW) and P2 Perth (20MW)
Implemented a quote to cash system which is an end-to-end solution including nurturing, opportunitymanagement, configuration, pricing quoting,provisioning and billing on a single platform
Key financial highlights include:
Total revenue of $161.5 million vs guidance range of$152-158 million (FY17: $123.6 million)
Underlying EBITDA 1, 2 of $62.6 million vs guidancerange of $58-62 million (FY17: $49.0 million)
Incurred capital expenditure of $285 million vsunderlying guidance range of $307-327 million 3
(FY17: $159 million)- FY18 capital expenditure incurred includes
spend on the acquisition of land for S3 Statutory net profit after tax of $6.6 million4 (FY17:
$23.0 million) Operating cash flow of $33.4 million (FY17: $44.9
million) Cash and term deposits of $418 million at 30 June
2018
Financial performance and position NEXTDC achieved a number of milestones and enjoyed a period of strong growth in the 12 months to 30 June 2018.
During the year, the Group experienced significant growth in number of customers, customer orders and data centre revenue. Data centre services revenue for the year increased from $117.6 million to $152.6 million. The increase in revenue was largely driven by increased utilisation of data centre services across the business. As at 30 June 2018, NEXTDC was billing for approximately 34.3MW (2017: 29.5MW) of capacity.
1 EBITDA is a non-statutory financial metric representing earnings before interest, tax, depreciation and amortisation. Non-statutory financial metrics have been extracted from the audited accounts 2 Underlying EBITDA excludes distribution income of $3.2 million from NEXTDC’s 29.2% investment in Asia Pacific Data Centre Group as well as $1.8 million of costs related to the current Asia Pacific Data Centre Group wind up process
3 Underlying guidance range reflects capital expenditure on existing facilities between $220-240 million plus an expected $87 million associated with the settlement of the site for S3, which occurred in the period to 30 June 2018
4 FY17 statutory NPAT includes $10.2m of income tax benefit stemming from the recognition of unused historical tax losses (FY18: nil)
NEXTDC Limited and controlled entities | FY18 Annual Report 10
For
per
sona
l use
onl
y

A summary of consolidated revenues and segment EBITDA for the year is set out below:
Segment revenues Segment EBITDA 30 June 2018
$’000 30 June 2017
$’000 30 June 2018
$’000 30 June 2017
$’000
Vic 64,317 51,315 44,384 37,190
NSW 56,184 41,004 35,189 25,978
Qld 16,892 14,697 11,331 10,740
WA 11,481 8,306 5,210 2,483
ACT 2,786 1,700 (2,628) (2,645)
Other 900 558 (557) (430)
Total segment revenue/result 152,560 117,580 92,929 73,316
Net profit after tax was $6.6 million (2017: $23.0 million1). Non-statutory underlying earnings before interest, tax, depreciation and amortisation (EBITDA) improved from $49.0 million in FY17 to $62.6 million in FY18.
Reconciliation of statutory profit to EBITDA and underlying EBITDA is as follows:
30 June 2018 $’000
30 June 2017 $’000
Change %
Net profit after tax 6,639 22,999 (71%)
Add: finance costs 25,803 18,777 37%
Less: interest income (5,778) (5,970) (3%)
Add: income tax expense/(benefit) 4,252 (10,172) n/m
Add: depreciation and amortisation 33,038 23,339 42%
EBITDA 63,954 48,973 31%
Less: distribution income (3,191) - -
Add: APDC legal costs 1,812 - -
Underlying EBITDA 62,575 48,973 28%
Funding In August 2017, NEXTDC upsized its senior secured debt facility from $100 million to $300 million. As at the date of this report, the facility remains undrawn.
In April 2018, NEXTDC raised $297 million through the issue of an additional 21,581,399 and 21,489,972 shares to a range of institutional investors at issue prices of $6.81 and $6.98 respectively. In May 2018, NEXTDC raised a further $80.4 million through the issue of an additional 11,801,714 shares pursuant to a share purchase plan for eligible shareholders at an issue price of $6.81.
Cash, cash equivalents and term deposits at 30 June 2018 totalled $418.0 million (2017: $368.3 million).
1 FY17 statutory NPAT includes $10.2m of income tax benefit stemming from the recognition of unused historical tax losses (FY18: nil)
Sales performance NEXTDC has continued to focus its sales strategy on partnering with providers of infrastructure, platform and packaged services. Flexibility offered by being carrier and vendor neutral allows customers a choice of carriers and systems integrators, leading to an increase in the number of unique customers to 972 at 30 June 2018.
During FY18 NEXTDC increased its contracted utilisation by 28% from 31.5MW at the end of FY17 to 40.2MW at the end of FY18.
Contracted utilisation at the M1 Melbourne facility was maintained at 93% of the total power capacity (15.0MW) during the period from 1 July 2017 to 30 June 2018. The M2 facility was opened in November 2017, with 0.7MW of the total power capacity contracted at 30 June 2018.
Directors' Report
NEXTDC Limited and controlled entities | FY18 Annual Report 11
For
per
sona
l use
onl
y

B1 Brisbane is a mature facility and has broadly maintained its contracted utilisation at 92% (2.1MW) as at 30 June 2018. The B2 facility was opened in September 2017, with 0.3MW of the total power capacity contracted at 30 June 2018.
S1 Sydney’s contracted utilisation increased from 84% to 95% of the total power capacity (16.0MW), during the year from 1 July 2017 to 30 June 2018. During the year development began on S2 Sydney, with the construction of this facility currently on track for completion and customer access in 1H19.
P1 Perth’s contracted utilisation, based on total target power capacity of 6.0MW, has increased from 25% (1.5MW) to 36% (2.2MW) at 30 June 2018. 4.1MW capacity has been built out of a total target capacity of 6.0MW at 30 June 2018.
C1 contracted utilisation was maintained at 8% (0.4MW) of target power capacity (4.8MW).
NEXTDC is deriving revenue from numerous product sources including white space, rack ready services, project fees and add-on services. During FY18 cross connectivity between customer racks generated approximately 6.5% of total recurring revenue.
The Group continues to develop its go-to-market strategy through its channel partnerships with major telecommunications and IT service providers, allowing the Company to actively increase the breadth and depth of its selling capability without adding to its sales operating cost base.
Continuous innovation As a rapidly growing organisation providing IT infrastructure essential to Australia’s digital economy, it’s vital for NEXTDC to seek the continuous innovation of its systems, products and services.
All data centres have achieved and continue to be certified to ISO 27001 Information Security Management System, and ISO 9001 Quality Management System. These certifications confirm that NEXTDC has an integrated management system that provides a systematic approach to risk management, protection of company information and continuous improvement.
In FY18, the B2 Brisbane and M2 Melbourne data centres were both awarded Tier IV Certification of Constructed Facility (TCCF) certification from the Uptime Institute (UTI) – the industry’s leading independent advisory organisation– which recognises the exceptional fault tolerance of thesefacilities. Tier IV is the UTI’s highest certification, and B2and M2 are the first Australian data centres, and the firstAsia Pacific colocation data centres, to achieve it.
The S2 Sydney data centre, which is currently under construction and is due to open in the first half of FY19, has also been designed to achieve Tier IV TCCF.
NEXTDC has continued to develop its internal systems and processes in FY18 with the ongoing implementation of online platforms to automate and integrate the management of the entire customer journey through the ‘lifecycle’ of their data centre service with NEXTDC.
Customer demand has seen NEXTDC develop innovative ways to increase data centre capacity beyond the original designs, with higher power densities and additional data halls. Even though our facilities’ power consumption is increasing as they become more populated, their overall energy efficiency improves over time through economies of scale, and increased utilisation of existing infrastructure.
The process of testing and tuning NEXTDC’s data centres to optimise energy efficiency and stability has seen a marked improvement in the facilities’ power usage effectiveness. The average PUE throughout the year across all NEXTDC data centres is now 1.34, well below our target of 1.40.
NEXTDC has a strong focus on energy efficiency and sustainability. Our facility infrastructure has been engineered to deliver extremely high energy efficiency, lowering the carbon footprint for our customers. Over the past 12 months, NEXTDC achieved a National Australian Built Environment Rating System (NABERS) 4.5 star rating for energy efficiency in M1 and S1 and ISO 14001 certification for Environmental Management at M1, S1 and C1. Our second generation of data centres, including B2, M2 and S2, are designed to achieve a level of efficiency not previously attained in the industry, NABERS 5 star rating for energy efficiency, as well as the ISO 14001 certification.
NEXTDC owns and operates its own solar array on the roof of its M1 data centre and has also been a Principal Partner to the Melbourne Renewable Energy Project since its inception in 2014. In FY18, financial close on this project was achieved, enabling the construction of the 80MW Crowlands Wind Farm in Victoria. This is another first for a data centre operator in the Asia Pacific region.
Business strategies and prospects for future financial years The Group has built a strong and growing pipeline of sales opportunities across each of its operating markets. Based on a number of positive trends such as cloud and mobile computing, growth in internet traffic and data sovereignty matters, the Group expects that demand for carrier and vendor neutral outsourced data centre services will continue to grow for the foreseeable future.
The Company has a number of strategies to benefit from this growth including but not limited to:
Expanding its presence in data centre markets whereits existing facilities are close to being fully utilised;
Continuing to sell uncontracted space and power inexisting facilities;
Opportunities for growth beyond the existing datacentre footprint; and
Launch of new products.Based on the factors listed above, the Group expects itsrevenue to grow in the foreseeable future.
Directors' Report
NEXTDC Limited and controlled entities | FY18 Annual Report 12
For
per
sona
l use
onl
y

Business risks NEXTDC is committed to having a sound risk management framework and recognises it is not only an important component of good corporate governance, but is also fundamental in achieving strategic and operational objectives and meeting legislative, industry and client obligations. NEXTDC has implemented a risk management framework consistent with the international risk standard ISO 31000 which ensures a systematic approach is used to identify and assess risks, and determine treatment plans to manage, transfer and avoid risks.
The Environment and Sustainability Report (located at www.nextdc.com) provides details on how NEXTDC addresses matters of environmental and social sustainability.
NEXTDC has identified the following business risks which may have an effect on NEXTDC’s prospects for future financial years:
Customer Demand: Development of new and existing data centres is capital intensive and sometimes undertaken without pre-sales commitment from customers, and there is a risk that there is not enough customer demand to achieve a sufficient return on investment. NEXTDC’s business model to become the largest independent, carrier neutral channel ecosystem in the Asia-Pacific region aims to combat this risk as we present to the market a solution which provides more options to connect than our competitors. NEXTDC’s next-generation of data centres will be built to allow a more scalable fit-out in accordance with demand growth which will result in a lower initial capital outlay. We are also aiming to increase sales by providing complementary products and services.
Development: NEXTDC is involved in the development of data centres, including the new sites for S2, S3, M3 and P2. Generally, development projects have a number of risks including (i) the risk that suitable sites or required planning consents and regulatory approvals, including approvals from the local water authority and the local power distribution grid operator, are not obtained or, if obtained, are received later than expected, or are adverse to NEXTDC’s interests, or are not properly adhered to; (ii) the escalation of development costs (including the costs of construction and fit out and any associated delays) beyond those originally expected; (iii) unforeseeable project delays beyond the control of NEXTDC; and (iv) non-performance/breach of contract by a contractor or sub-contractor. Increases in supply or falls in demand could influence the acquisition of sites, the timing and value of sales and carrying value of projects.
Funding: NEXTDC’s business is capital intensive in nature and continued growth relies on the acquisition and development of new and existing data centres, along with investment in new technologies. Failure to obtain sufficient capital on favourable terms may hinder NEXTDC’s ability to expand and pursue growth opportunities, which may reduce competitiveness and have an adverse effect on financial performance. To address this risk, NEXTDC has sought to obtain
funding from various sources in order to not become over-reliant on any one form of funding, and is also developing cloud enabling products and services that are not as capital intensive to complement its Data Centre-as-a-Service (DCaaS) offering.
Meeting Customer Requirements: Some of our customers and channel partners are large, well established businesses. Not delivering the appropriate solution within the required timeframe to meet their requirements could significantly impact our brand reputation as well as the ability to win further opportunities. To minimise this risk, NEXTDC engages its in-house engineering and project management teams to ensure the customer is provided with the optimal solution, and that it is delivered on time and within budget.
Cyber Risk: According to various recent industry cyber risk reports, cyber incidents and their financial impacts are increasing significantly year on year and cyber criminals are targeting small and large businesses alike. To mitigate these risks, NEXTDC has implemented an information security management system based on ISO 27001 as well as undertaken ongoing penetration and vulnerability tests.
Physical Security Breach: NEXTDC customers rely on our physical security to prevent unauthorised access to the space where their equipment resides. A physical security breach to a customer’s space could result in irreversible reputational damage, impact on future opportunities and the ability to retain existing customers. Therefore, the Company’s facilities are protected by multi-layered security systems and protocols designed to limit access to areas within the data centres only to those with the appropriate authorisation.
Privacy & Data Security: NEXTDC collects a minimal amount of Personally Identifiable Information (PII), limited to activities such as account and contract management, marketing and to permit entry into its facilities. NEXTDC does not store, interact with or manage any data stored on its customers’ equipment. Customers are responsible for managing their own IT equipment and data security. All PII is securely managed in accordance with our Privacy Policy, a document based on the Australian Privacy Act 1998 and information security practices based on ISO 27001 controls.
Unable to Provide Service: A catastrophic failure or equipment malfunction at a NEXTDC data centre could result in the Company not being able to provide power and cooling to support our customers’ equipment, thus breaching our service level agreements and incurring contractual liabilities. To address this risk, all of NEXTDC’s data centres are designed and built with sufficient redundancy in place (including redundant paths for power and cooling) to enable components to go off-line to be maintained without affecting our customers’ IT equipment.
Technology Advances: NEXTDC operates in a competitive sector, and failure to keep up to date with the latest technology could result in reputational damage and a downturn in customer demand. To mitigate this risk, the Company promotes mutual
Directors' Report
NEXTDC Limited and controlled entities | FY18 Annual Report 13
For
per
sona
l use
onl
y

research and development projects and strategic alliances with its suppliers, regularly attends industry conferences and is a member of the Uptime Institute, an independent thought leader and certification body in IT and data centres.
Health and Safety: Data centres are workplaces whereemployees and contractors may be subject to varioushealth and safety risks, such as, but not limited to,exposure to high voltage, construction zones, manualhandling and working at heights which could result indeath or permanent disability. To address these risks,access to areas where these types of safety risks existis restricted to allow only those workers who haveappropriate licences and training. Permits to work,including Safe Work Method Statements and proof ofinsurance are required prior to any workscommencing.
Energy Usage and Emissions: Due to the nature of ourbusiness, as our customer loads increase year onyear, so too will our energy usage and emissions,which may result in NEXTDC being perceived to behaving a negative impact on the environment. Tocounter this risk, NEXTDC has invested significantly inimproving energy efficiencies, implementing initiativessuch as solar power and rainwater collection to reducethe overall impact on the environment. The Companyalso benchmarks its Power Usage Effectivenessagainst peers to achieve industry best practice.
Fraud, Bribery and Corruption: Fraud, bribery or anyother unethical behaviour could significantly impact oncustomer’s and shareholder’s trust and confidence inNEXTDC. In order to reduce these risks, NEXTDC hasstringent sales and purchasing processes andprocedures. The Statement of Delegated Authority hasbeen approved by NEXTDC’s Board and authoritylimits are automated in NEXTDC’s purchasing systemto prevent staff exceeding their approval limits. AllNEXTDC staff and directors undergo Code of Conducttraining and pursuant to the Company’s Whistle-blowerPolicy, employees are encouraged to come forwardand report if they see any unethical behaviour.
Training and Development: Operating and maintainingdata centres requires highly trained employees andlack of sufficient training and development could resultin safety and environmental incidents, poor efficienciesand low morale. All data centre workers hold theappropriate licences and receive on the job training. Inaddition, NEXTDC’s in-house Engineering teamprovides support and knowledge on how to run theequipment at optimal performance.
Significant changes in the state of affairs Other than what has already been mentioned in this report, there have been no further significant changes in the state of affairs of the Group during FY18.
Matters subsequent to the end of the financial period In July 2018, the Group issued a further $300 million in unsecured notes (“Notes IV”), comprising of a floating rate
tranche of $200 million priced at 3.75% over 3-month BBSW and a fixed rate tranche of $100 million at 6.0%. Notes IV is complementary to the $300 million fixed rate Notes III issued by the Company in May 2017, albeit a different maturity date of June 2022, compared to June 2021 for Notes III.
Likely developments and expected results of operations Likely developments in the operations of the Group that were not finalised at the date of this report include the continued fitout of data centre capacity in existing facilities and the pursuit of further growth opportunities.
Dividends Dividends were neither paid nor declared during the year.
Environmental regulation The Group is subject to significant environmental regulation in respect of its data centre operating activities as set out below.
Greenhouse gas and energy data reporting requirements NEXTDC monitors its carbon emissions for reporting and is registered under the National Greenhouse and Energy Reporting Act (“NGER”). Continuing our focus on leadership through industry innovation, at the time of writing, NEXTDC is undergoing an audit of its corporate carbon emissions under the Australian National Carbon Offset Standard (NCOS). We have set ourselves an ambitious goal of being the first operator in the region to achieve carbon neutrality by offsetting emissions associated with our corporate activities and become certified under the Australian Government’s Carbon Neutral Initiative. Our aim is to offer our customers the opportunity to similarly offset their emissions in our data centres in the near future – yet another first for a data centre operator in the Asia Pacific region.
Insurance of officers During the period, NEXTDC Limited paid a premium of $402,500 (2017: $143,000) to insure the directors and officers of the Group.
The liabilities insured are legal costs that may be incurred in defending civil or criminal proceedings that may be brought against the officers in their capacity as officers of entities in the Group, and any other payments arising from liabilities incurred by the officers in connection with such proceedings. This does not include such liabilities that arise from conduct involving a wilful breach of duty by the officers or the improper use by the officers of their position or of information to gain advantage for themselves or someone else or to cause detriment to the Group. The Directors & Officers Liability insurance also covers security claims against the company itself. It is not possible to apportion the premium between amounts relating to the insurance against legal costs to defend the officers and those relating to other liabilities.
Directors' Report
NEXTDC Limited and controlled entities | FY18 Annual Report 14
For
per
sona
l use
onl
y

Proceedings on behalf of the company No person has applied to the Court under section 237 of the Corporations Act 2001 for leave to bring proceedings on behalf of the Group, or to intervene in any proceedings to which the Group is a party, for the purpose of taking responsibility on behalf of the Group for all or part of those proceedings.
No proceedings have been brought or intervened in on behalf of the Group with leave of the Court under section 237 of the Corporations Act 2001.
Rounding of amounts The Company is of a kind referred to in ASIC Corporations (Rounding in Financial/Directors' Reports) Instrument 2016/191, relating to the ‘rounding off’ of amounts in the financial statements. Amounts in the financial statements have been rounded off in accordance with that Class Order to the nearest thousand dollars, or in certain cases, to the nearest dollar.
Directors' Report
NEXTDC Limited and controlled entities | FY18 Annual Report 15
For
per
sona
l use
onl
y

Information on Directors DOUGLAS FLYNN
Chairman Non-Executive Director (since September 2013)
EXPERIENCE AND EXPERTISE Douglas (Doug) was appointed to the Board in September 2013 as an Independent Non-Executive Director and subsequently was appointed as Chairman in April 2014.
Doug has over 30 years of international experience in the media and information and communication technology industries, including holding various senior management and board positions.
Doug is a current director of APN Outdoor and is Chairman of Konekt Limited.
Previously, Doug was Chief Executive of newspaper publisher, Davies Brothers Limited, which was acquired by News Corporation in 1989. In 1995, he was appointed the Managing Director of News International Plc.
After leaving News International in 1998, Doug joined Aegis Group Plc and was appointed as CEO in 1999, where he was instrumental in doubling the size of the company and established a global market research business Synovate and internet services business Isobar.
From 2005 to 2008, Doug served as the Chief Executive of facilities management provider Rentokil Initial Plc. Doug returned to Australia in 2008 and from April 2008 to April 2012, was a consultant to and a director of Hong Kong listed Qin Jia Yuan Media Services Ltd, a private television company operating in China. From 2009 to 2014 he was a director of Seven West Media.
Doug graduated in Chemical Engineering from the University of Newcastle, New South Wales and received a MBA with distinction from the University of Melbourne.
OTHER CURRENT DIRECTORSHIPS Doug also holds the following positions: APN Outdoor (November 2014 – present) Konekt Limited (June 2012 – present)
FORMER DIRECTORSHIPS Seven West Media Limited iSentia Group Limited
SPECIAL RESPONSIBILITIES Chairman of the Board Member of the Audit and Risk Management Committee Member of the Remuneration and Nomination Committee
INTERESTS IN SHARES AND OPTIONS Doug holds 152,531 fully paid ordinary shares in NEXTDC Limited.
CRAIG SCROGGIE
Chief Executive Officer (since June 2012) Managing Director (since November 2010)
EXPERIENCE AND EXPERTISE Craig Scroggie is the Chief Executive Officer and Managing Director of NEXTDC, responsible for driving the business to become one of the world’s fastest growing technology companies. Craig is well recognised for his superior leadership experience within the IT and telecommunications industries across the globe.
Under Craig’s leadership, NEXTDC has grown from a start-up tech company operating only a single data centre (B1 Brisbane) to now being recognised as Australia’s leading Data Centre-as-a-Service company and Australia’s fastest growing technology company, boasting a national footprint of eight data centres across Australia, with an additional three facilities currently in design. The company’s annual data centre services revenues have grown from $1.2 million (FY12) to exceeding $150 million (FY18). In that time, the Company has earned a plethora of awards in the technology, business and engineering industries. In 2017, NEXTDC’s B2 Brisbane and M2 Melbourne data centres were both awarded Tier IV Certification of Constructed Facility (TCCF) from the Uptime Institute, the first data centres in Australia and the first colocation data centres in the Asia-Pacific region to achieve such recognition.
Prior to his appointment as Chief Executive Officer, Craig served as a Non-Executive Director of NEXTDC for 18 months and as Chairman of the Audit and Risk Management Committee. Craig has previously held senior leadership positions with Symantec, Veritas Software, Computer Associates, EMC Corporation and Fujitsu. Craig is a Graduate and Fellow of the Australian Institute of Company Directors, a Fellow of the Australian Institute of Management and a Fellow of the Australian Sales & Marketing Institute. Craig is a Graduate of the University of Southern Queensland and holds an Advanced Certificate in Information Technology, a Graduate Certificate in Management, a Postgraduate Diploma in Management, and a Master of Business Administration.
OTHER CURRENT DIRECTORSHIPS Craig currently holds the position of Adjunct Professor in the Faculty of Business, Economics & Law at La Trobe University where he currently serves on the Business School Advisory Board. Craig was formerly the Chairman of the La Trobe University Graduate School of Management Board.
INTERESTS IN SHARES AND OPTIONS Craig holds 1,552,065 fully paid ordinary shares, 806,243 performance rights, and 41,503 deferred share rights.
Directors' Report
NEXTDC Limited and controlled entities | FY18 Annual Report 16
For
per
sona
l use
onl
y

STUART DAVIS
Non-Executive Director (since September 2013)
EXPERIENCE AND EXPERTISE Stuart was an international banker with over 30 years with the HSBC Group including roles in Hong Kong, New York, Taiwan, India and Australia. Most recently he was CEO India for the Hongkong and Shanghai Banking Corporation Limited (2009-2012), CEO and Executive Director for HSBC Bank Australia Limited (2002-2009) and CEO HSBC Taiwan (1999-2002). He was a member of the Australian Bankers Association from 2002 to 2009 and Deputy Chairman from 2006 to 2009.
Stuart holds a LLB from Adelaide University and is a Graduate of the Australian Institute of Company Directors.
OTHER CURRENT DIRECTORSHIPS PayPal Australia Limited (July 2016 – present) Bank of South Pacific Limited (September 2017 –
present)
FORMER DIRECTORSHIPS
Stuart previously held directorships with subsidiaries of HSBC Group until 2012, Built Holdings Pty Ltd. and Moboom Limited.
SPECIAL RESPONSIBILITIES Chairman of the Audit and Risk Management Committee Member of the Remuneration and Nomination Committee
INTERESTS IN SHARES AND OPTIONS Stuart holds 34,314 fully paid ordinary shares in NEXTDC Limited.
GREGORY J CLARK AC
Non-Executive Director (since April 2014)
EXPERIENCE AND EXPERTISE Dr Gregory J Clark AC is a world-renowned technologist, businessman and scientist, with extensive corporate and Board experience in Australia, the USA and Europe.
Dr Clark was previously on the Board of the ANZ Banking Group where he chaired the Board’s Technology Committee and was a member of the Risk, Governance and Human Resources Committees.
Dr Clark brings to the Board international business experience and a distinguished career in micro-electronics, computing and communications. He was previously Principal of Clark Capital Partners, a US based firm that has advised internationally on technology and the technology market place.
During his career, Dr Clark also held senior executive roles at IBM, News Corporation and Loral Space and Communications. At IBM he was a senior scientist in their Research Division in NY. At News Corporation he was President of Technology and on the Executive Committee with responsibility for all technical aspects of digital media creation and delivery. Dr Clark was responsible for News Corporation’s transformation of its media assets from an analogue platform into a digital platform for both program creation and delivery. In addition he was responsible for all technology companies within News Corporation.
He was Chief Operating Officer at Loral Space and Communications, the world’s largest commercial satellite manufacturer and one of the largest operators, with responsibility for all development, manufacturing, marketing and sales.
While at News Corporation and Loral Space and Communications, Dr Clark was Chairman and/or on the Board of a number of wholly owned subsidiaries including Globalstar, SatMex, Skynet, SpaceSystemLoral, Kesmai, Etak and others.
OTHER CURRENT DIRECTORSHIPS Dr Clark is currently Chairman of the Australian National University Advisory Board for the Research School of Science and Engineering. He is also currently on the Board of the Sydney University Physics Foundation and Questacon, the National Science and Technology Centre.
FORMER DIRECTORSHIPS Dr Clark served as a director on the Board of the ANZ Banking Group which he stepped down from in November 2013 after nine years of service.
SPECIAL RESPONSIBILITIES Chairman of the Remuneration and Nomination Committee Member of the Audit and Risk Management Committee
INTERESTS IN SHARES AND OPTIONS Gregory holds 62,202 fully paid ordinary shares in NEXTDC Limited.
Directors' Report
NEXTDC Limited and controlled entities | FY18 Annual Report 17
For
per
sona
l use
onl
y

SHARON WARBURTON
Non-Executive Director (since April 2017)
EXPERIENCE AND EXPERTISE Sharon was appointed as an Independent Non-Executive Director in April 2017.
Sharon is currently the Co-Deputy Chairman of Fortescue Metals Group Limited and a Non-Executive Director of Gold Road Resources Limited and Barminco Holdings Pty Limited. Sharon is also a part-time member of the Federal Government’s Takeovers Panel.
Sharon has previously held positions as Executive Director of Strategy and Finance with Brookfield Multiplex, Chief Planning and Strategy Office of United Arab Emirates based ALDAR Properties PJSC, and senior executive roles with Multiplex, Citigroup, and Rio Tinto.
Sharon is a Fellow of Chartered Accountants Australia and New Zealand. Sharon is a Graduate of the Australian Institute of Company Directors, a Fellow of the Australian Institute of Building and a member of Chief Executive Women.
Sharon is a Director of the Perth Children’s Hospital Foundation and the Patron of their Emerging Leaders in Philanthropy programme. She is a member of the WA Rhodes Scholar Scholarship Selection Committee.
Sharon is Curtin University alumni and the Patron for the Curtin Women in MBA scholarship programme.
Sharon holds a Bachelor of Business – Accounting and Business Law from Curtin University.
OTHER CURRENT DIRECTORSHIPS Fortescue Metals Group Limited (November 2013 –
present) Gold Road Resources Limited (April 2016 – present)
FORMER DIRECTORSHIPS Wellard Limited (until August 2016)
SPECIAL RESPONSIBILITIES Member of the Audit and Risk Management Committee Member of the Remuneration and Nomination Committee
INTERESTS IN SHARES AND OPTIONS Sharon holds 32,202 fully paid ordinary shares in NEXTDC Limited.
MICHAEL HELMER
Company Secretary (since February 2015)
Michael is also the General Counsel of NEXTDC Limited.
Michael has over 20 years’ experience in the legal sector and, until joining the Company, was serving as Director of Legal Services (Asia Pacific) for global software maker Symantec, where he and his team were responsible for advising on compliance, licensing, litigation, privacy and cybersecurity issues throughout the region as well as supporting the regional leadership, sales and engineering teams. Previously Michael was based in London at specialist technology and IP firm Field Fisher Waterhouse. Michael has held senior legal roles in Barclays, Coles Myer and was General Counsel at European on-line shopping site shopsmart.com as well as at Australian anti-malware maker PC Tools. Michael has practised extensively in the areas of technology, data security, privacy, corporate commercial, licensing and FMCG.
He has obtained a Bachelor of Laws, Bachelor of Science (Monash) and is admitted as a legal practitioner in Australia and in England and Wales. Michael is a member of the Australian Corporate Lawyers Association (ACLA) and has served as their Victorian President as well as a member of its National Board (2012 to November 2014). Michael is also an Australian member of the Association of Corporate Counsel, the Governance Institute of Australia and holds a Certificate in Governance Practice.
Directors' Report
NEXTDC Limited and controlled entities | FY18 Annual Report 18
For
per
sona
l use
onl
y

Meetings of directors The number of meetings of the Company's Board of Directors and of each board committee held during the period, and the number of meetings attended by each director are as follows:
Meetings of committees
Full meetings of directors Audit and Risk
Management Committee Remuneration and
Nomination Committee
A B A B A B
Douglas Flynn 25 25 3 3 2 2
Craig Scroggie 23 25 N/A N/A N/A N/A
Stuart Davis 25 25 3 3 2 2
Gregory J Clark AC 25 25 3 3 2 2
Sharon Warburton 25 25 3 3 2 2 A = Number of meetings attended B = Number of meetings held during the time the director held office or was a member of the committee during the period N/A = Not applicable. Not a member of the relevant committee
Directors' Report
NEXTDC Limited and controlled entities | FY18 Annual Report 19
For
per
sona
l use
onl
y

Remuneration Report – Audited This report sets out the remuneration arrangements for NEXTDC’s Directors and other Key Management Personnel (KMP) for the year ended 30 June 2018 (FY18). It is prepared in accordance with section 300A of the Corporations Act 2001 (Corporations Act), and has been audited as required by section 308(3C) of the Corporations Act.
This report is divided into the following sections:
NEXTDC Limited and controlled entities | FY18 Annual Report 20
Page
1. Message from the Chair of the Remuneration and Nomination Committee 21
2. Who is covered by this Report? 22
3. Overview of Remuneration Governance Framework 22
3.1. Senior Executive Remuneration (SER) Policy 22
3.2. Senior Executive Remuneration Benchmarks 24
3.3. Senior Executive Remuneration Mix 24
3.4. Senior Executive Remuneration and Performance 25
3.5. Variable Remuneration – Short Term Incentive Plan (STIP) 26
3.6. Variable Remuneration – Long Term Incentive Plan (LTIP) 27
3.7. Non-Executive Director Remuneration Policy 28
4. Employment Terms for Directors and Senior Executives 29
5. STI and LTI Performance outcomes for FY18 30
5.1. STI Vesting Outcomes 30
5.2. LTI Vesting Outcomes 31
6. Statutory Remuneration 31
6.1. Senior Executive Remuneration 31
6.2. Non-Executive Director Remuneration 33
6.3. Changes in Securities Held Due to Remuneration 34
6.4. Director and Senior Executive Shareholdings 38
6.5. Remuneration Received (Non-statutory) 39
For
per
sona
l use
onl
y

1. MESSAGE FROM THE CHAIR OF THE REMUNERATION AND NOMINATION COMMITTEE
NEXTDC’s Remuneration Report details how both Company and individual performance are linked to executive remuneration outcomes for the 2018 financial year. It details our remuneration policy for FY18 and how it was designed to create alignment between executive remuneration and shareholder outcomes for the reporting period.
In FY18, NEXTDC achieved a number of key performance milestones:
Company achievements such as these underpin the incentive payments made to Senior Executives for the FY18 performance period.
In formulating the remuneration strategy for NEXTDC, the Remuneration and Nomination Committee considers the Company’s business plans, cash position, competitive environment and feedback from shareholders. The overall objective of the remuneration strategy is to properly incentivise executives to capitalise upon the compelling opportunities in the data centre industry and the need for robust growth to compete against private and foreign-owned corporations that are also seeking to rapidly satisfy increasing demand. With growth tied to shareholder value, the Board recognises that significant elements of executive remuneration need to be contingent on the ability to expand NEXTDC’s national footprint. This includes being the first to market by securing valuable sites, integrating new infrastructure, and offering a consistent, high-value service to national and international customers.
After two years in which the Remuneration and Nomination Committee had accepted the request by the Senior Executives to forego a pay increase, to ensure key operational staff members could be appropriately remunerated and retained, a salary review was undertaken effective 1 January 2018. Modest increases to fixed remuneration for Senior Executives carried regard for Australian and international salaries for similar roles and any changes to the scope and breadth of executive responsibilities.
We look forward to further engagement with our shareholders and welcome your continued feedback on our remuneration policies and practices.
Dr Gregory J Clark AC
Chairman – Remuneration and Nomination Committee
Data centre services revenue ($M)
$152.6M▲ $35.0M (30%)
Underlying EBITDA ($M)
$62.6M▲ $13.6M (28%)
Operating cashflow ($M)
$33.4M▼ $11.5M (26%)
Equity raised ($M)
$377.4MSenior syndicated debt facility
$300.0M3-year term
Contracted utilisation (MW)
40.2MW▲ 8.7MW (28%)
Successful opening of B2 Brisbane and M2 Melbourne
Secured sites for 3rd
data centre in Sydney (S3) and 2nd
in Perth (P2)
Remuneration Report - Audited
NEXTDC Limited and controlled entities | FY18 Annual Report 21
For
per
sona
l use
onl
y

2. THE PERSONS COVERED BY THIS REPORT
Key Management Personnel (“KMP”) include Non-Executive Directors and Senior Executives. The term “Senior Executives” refers to the CEO and those executives with authority and responsibility for planning, directing and controlling the activities of the Company and the Group, directly or indirectly.
TABLE 1: KEY MANAGEMENT PERSONNEL
NON-EXECUTIVE DIRECTORS
Name Position
Douglas Flynn Non-Executive Chairman since 30 April 2014 Member of the Audit and Risk Management Committee Member of the Remuneration and Nomination Committee
Stuart Davis Non-Executive Director Chair of the Audit and Risk Management Committee Member of the Remuneration and Nomination Committee
Gregory J Clark AC Non-Executive Director Chair of Remuneration and Nomination Committee Member of the Audit and Risk Management Committee
Sharon Warburton Non-Executive Director Member of the Audit and Risk Management Committee Member of the Remuneration and Nomination Committee
SENIOR EXECUTIVES
Name Position
Craig Scroggie Chief Executive Officer, Managing Director
Simon Cooper Chief Operating Officer
Oskar Tomaszewski Chief Financial Officer
Adam Scully Chief Sales Officer
David Dzienciol Chief Customer Officer & Executive Vice President of Technology
3. OVERVIEW OF REMUNERATION GOVERNANCE FRAMEWORK
Consistent with NEXTDC’s mission to be the leading customer-centric data centre services company, delivering solutions that power, secure and connect enterprise, the remuneration policy is designed to incentivise and reward Senior Executives for achieving the Company’s overarching objectives of building market-leading sales performance; hosting the country’s largest independent ecosystem of carriers, cloud and IT service providers; and enabling customers to source and connect with suppliers and partners under an integrated hybrid cloud system.
The remuneration framework applicable to the 2018 financial year is outlined and summarised below:
3.1 Senior Executive Remuneration (SER) Policy The Senior Executive Remuneration Policy applies to those who are defined as:
The Chief Executive Officer – accountable to the Board for the Company’s performance and long-term planning; Heads of business units, or those with key functional roles, or essential expertise, that report directly to the Chief Executive
Officer; Other executive roles classified as KMP under the Corporations Act; and Other roles or individuals nominated by the Board from time to time.
Remuneration Report - Audited
NEXTDC Limited and controlled entities | FY18 Annual Report 22
For
per
sona
l use
onl
y

FIGURE 1: REMUNERATION GOVERNANCE FRAMEWORK
The SER policy details how executive remuneration is structured, benchmarked and adjusted in response to changes in the circumstances of the Company. NEXTDC’s Senior Executives Total Remuneration Package (TRP) includes the following components:
FIGURE 2: TOTAL FY18 REMUNERATION (IF MAXIMUM INCENTIVE PAYMENTS ARE RECEIVED)
Base Salary Package (40%)
Base Salary Package (includes superannuation, non-monetary benefits and any applicable fringe benefits tax)
References domestic and internationalindustry benchmarks
STI (30% at risk)
STI that provides a reward for performance against the annualobjectives
EBITDA gateway
Target = 25% of Base
Maximum = 75% of Base
LTI (30% at risk)
LTI that provides a securities-basedreward for performance against indicators of long term shareholder value creation
Rights vest at TSR Index (must bepositive)
Maximum = 75% of Base
Year 1 Year 2 Year 3
50% is paid as cash
50% is deferred forone year(cash or shares)
Remuneration Report - Audited
NEXTDC Limited and controlled entities | FY18 Annual Report 23
For
per
sona
l use
onl
y

3.2 Senior Executive Remuneration Benchmarks In setting executive remuneration, the Company continues to reference domestic and international industry benchmarks. Specific adjustments are introduced to enable NEXTDC to attract and retain the necessary calibre of talent in the niche data centre industry. Many of NEXTDC’s competitors and major customers are international and NEXTDC needs to compete for talent against this backdrop, which is vital for the Company. Accordingly, the Company observes the following factors in setting executive remuneration packages:
• The individual’s contribution to long term revenue/EBITDA growth;• Their relevant industry knowledge, experience and connections; and• Domestic and international comparators with whom NEXTDC must compete for talent.
The Base Salary Package policy mid-points are set with reference to the median of the relevant market practice. TRP’s at Target (being the Base Package plus incentive awards intended to be paid for targeted levels of performance) are set with reference to the 75th percentile of the relevant market practice so as to create a strong incentive to achieve targeted objectives in both the short and long term.
Certain segments of the executive remuneration mix may not be captured solely by domestic remuneration benchmarks, noting that the retention of Senior Executive’s with first-class industry relationships is of critical importance in achieving exceptional financial performance and long-term shareholder value.
3.3 Senior Executive Remuneration Mix The Senior Executive remuneration mix refers to the proportion of remuneration executives can receive as fixed versus variable “at risk” remuneration. Assuming performance is at a level whereby incentives pay out in full, 60% of TRP remuneration received is performance-related.
The graph below sets out the remuneration mix if maximum incentive payments are received for the CEO and other Senior Executive KMP for FY18.
FIGURE 3: FY18 POTENTIAL REMUNERATION MIX
Base Salary (40%) STI (15%) Long Term Incentive (30%)
AT RISK (60%)FIXED (40%)
Deferred STI (15%)
Remuneration Report - Audited
NEXTDC Limited and controlled entities | FY18 Annual Report 24
For
per
sona
l use
onl
y

3.4 Senior Executive Remuneration and Performance Although organic growth opportunities are compelling, the Company has powerful competition from private and foreign owned corporations. The Board has therefore determined that significant remuneration opportunity be contingent on realising this growth, as prospects for future shareholder value are heavily reliant on being amongst the first to market to secure valuable sites, build needed infrastructure, offer a regional footprint for national and international customers and retain these customers with high value services that present high barriers to entry. If successful, these components of Company performance are the drivers of tomorrow’s sustainable shareholder value creation.
Senior Executive remuneration and performance is also assessed relative to NEXTDC’s performance over the past five years, as summarised below:
TABLE 2: HISTORICAL COMPANY PERFORMANCE
Underlying EBITDA excludes non-recurring items such as distributions received as well as transaction costs associated with Asia Pacific Data Centre (APDC). EBITDA is a non-statutory metric representing earnings before interest, tax, depreciation and amortisation.
Remuneration Report - Audited
NEXTDC Limited and controlled entities | FY18 Annual Report 25
For
per
sona
l use
onl
y

3.5 Variable remuneration – Short Term Incentive (STI) Plan The highly capital-intensive nature of NEXTDC’s business requires infrastructure to be built prior to generating income derived through infrastructure utilisation. With NEXTDC operating in a high-growth market, the Company needs to continually expand its infrastructure to meet customer demand. It is on this basis that the Board places emphasis on committed sales, facilities growth, margin, and EBITDA growth in incentivising Senior Executives.
FINANCIAL YEAR 2018 STI PLAN The purpose of the STI Plan is to provide an incentive for Senior Executives to achieve against the Company’s strategic objectives by delivering or exceeding annual business plan requirements for sustainable superior returns for shareholders. Key terms of the FY18 STI Plan are detailed below.
Feature Description
Maximum opportunity 25% of Base Salary Package and a stretch (maximum) of 75% of Base Salary Package.
Measurement period The Company’s financial year i.e. from 1 July to the following 30 June.
Performance metrics The below Company Key Performance Indicators (KPIs) were selected as being the most relevant drivers for improving financial performance and growth in shareholder value and are also common measures amongst NEXTDC’s global competitors.
Metric Weighting Reason for selection
Group EBITDA 1/3 Indicates the Company’s underlying profitability best suited to its stage of development
New retail NMRR* committed
1/3 New NMRR committed is connected to the level of incremental new business signed with NEXTDC’s two key customer segments – retail and wholesale New wholesale NMRR
committed 1/3
No STI can be paid if the EBITDA gateway is not achieved. The FY18 EBITDA gateway was set at 95% of budget.
Delivery of STI Payments will be in cash unless otherwise determined by the Board and will normally be paid in September following the Measurement Period subject to the deferral of 50% of the final STI payment, which may be delivered in cash or by grant of rights to acquire fully paid ordinary shares.
Deferring 50% of the awarded STI for a period of 12 months is intended to promote sustainability of annual performance over the medium term, acts as a retention mechanism and facilitates the exercise of clawback provisions should the Board determine to exercise its discretion.
Board discretion If the Company’s overall performance during the Measurement Period is substantially lower than expectations and has resulted in a significant loss to shareholders’ value, the Board may abandon the STI Plan for the Measurement Period or adjust STI payouts.
*NMRR = Net Monthly Recurring Revenue
Remuneration Report - Audited
NEXTDC Limited and controlled entities | FY18 Annual Report 26
For
per
sona
l use
onl
y

3.6 Variable remuneration – Long Term Incentive (LTI) Plan FINANCIAL YEAR 2018 LTI PLAN The purpose of the LTI Plan is to give effect to an element of Senior Executive Remuneration, which constitutes part of a market-competitive total remuneration package. The aim is to provide an incentive for Senior Executives to help achieve the Company’s strategic objectives by delivering performance that will lead to sustainable, superior returns for shareholders. Another purpose of the LTI Plan is to act as a retention mechanism to maintain a stable team of performance-focused Senior Executives. The current LTI Plan is the NEXTDC Limited Equity Incentive Plan (EIP).
Feature Description
Opportunity/Allocation Target LTI value was set at 75% of Base Salary Packages.
The LTI grant of Performance Rights is calculated by applying the following formula:
Number of Performance Rights = Base Package x Target LTI% ÷ Right Value NB: The Right Value is the volume weighted average share price of Shares over the 10 trading days following the release of the Company’s FY17 results. The “Target LTI %” recognises that the stretch level of Rights will be granted when target performance is achieved.
Measurement period The Performance Rights measurement period for FY18 is a three (3) year period beginning from the end of trade on the day of release of the FY17 Results and ending upon the end of the day of release of the annual results for FY20.
The measurement period for assessing Total Shareholder Return (TSR) performance is aligned with the release of results to ensure that the share price upon which TSR is determined at the start and end of the performance period reflects an informed market.
Performance hurdle The performance condition is market adjusted TSR which compares the TSR of the Company to the TSR of the ASX 200 Accumulation Index (Index) with the vesting percentages to be determined by the following scale:
NEXTDC’s TSR over the Measurement Period
Percentage of Rights that vest
Less than TSR of Index Nil
At TSR of Index 25%
Between TSR of Index and TSR of Index + 5% p.a.
Pro rata vesting from 25% to 100% on a straight-line basis
TSR of Index + 5% p.a. or greater 100%
A positive TSR gateway applies to all offers such that no vesting will occur if shareholder value has not increased over the Measurement Period (i.e. TSR must be positive).
The Remuneration and Nomination Committee has again reviewed whether the introduction of a second LTI performance measure is appropriate. It remains the Board’s view that an additional measure is not appropriate at NEXTDC’s current stage of development. The Remuneration and Nomination Committee regards the continued application of a relative TSR performance measure to be the most effective method for aligning long-term executive performance with shareholder wealth outcomes. The Remuneration and Nomination Committee will review the appropriateness of the single measure LTI program on an annual basis.
Reason for selection TSR was selected as it recognises the total returns (share price movement and dividends assuming they are reinvested into Company shares) that accrue to shareholders over the Measurement Period. This measure creates the most direct alignment between shareholder return and rewards realised by Senior Executives. The measurement period for assessing TSR performance is aligned with the release of results to ensure that the share price upon which TSR is determined at the start and end of the performance period reflects an informed market.
Market adjusted TSR was selected to ensure that participants do not receive windfall gains from broad market movements unrelated to the performance of the Senior Executives.
The positive TSR gate ensures that Senior Executives cannot benefit from the LTI Plan when shareholders have lost value over the Measurement Period. Vesting commences upon NEXTDC’s TSR matching the Index TSR, with full vesting occurring once NEXTDC’s TSR exceeds the Index TSR by 5% compound annual growth over the performance period. This hurdle has been determined with regard for the historic performance of the ASX 200
Remuneration Report - Audited
NEXTDC Limited and controlled entities | FY18 Annual Report 27
For
per
sona
l use
onl
y

Feature Description
Accumulation Index whereby 5% compound annual growth or greater represents upper quartile performance.
This would, in the Board’s view, represent an outstanding outcome for the Company.
Exercise of vested Incentive Rights
Upon vesting, Incentive Rights will be automatically exercised and the Board will determine the extent to which their value will be delivered in Shares and/or cash. The Board will also determine whether Shares will be issued or acquired for participants via the Employee Share Trust (EST) and if the EST is used, whether new issues or on-market purchases of Shares will be undertaken by the trustee of the EST.
No amount is payable by participants to exercise vested Incentive Rights.
Forfeiture and termination
In the event of cessation of employment due to dismissal for cause, all unvested Incentive Rights are forfeited.
In the event of cessation of employment due to resignation, all unvested Incentive Rights are forfeited unless otherwise determined by the Board.
In the event of cessation of employment due to death, total and permanent disability or redundancy, unvested performance rights will continue on-foot and be subject to the original terms as though employment had not ceased, unless the Board determines otherwise.
In any other circumstances the Board has discretion to determine how the unvested Performance Rights will be treated upon cessation of employment with the Company.
Board discretion The Board retains discretion to modify vesting outcomes. Incentive Rights that do not vest will lapse. Board discretion to vary vesting will generally only be applied when the vesting that would otherwise apply is considered by the Board to be inappropriate, and when it would not align with shareholder returns.
Change of Control In circumstances where there is a likely change in the control of NEXTDC, the Board has discretion to determine the level of vesting (if any) having regard to the portion of the performance period elapsed, performance to date against performance conditions and any other factors it considers appropriate.
If an actual change in the control of the Company occurs before the Board can exercise this discretion, unless the Board determines otherwise, unvested Performance Rights will vest and become exercisable in proportion to the Company's performance against the TSR Hurdle up to the date of the change of control.
Malus/Clawback Provisions
The Board retains the ability to reduce or clawback awards where the participant has acted fraudulently or dishonestly or is in material breach of their obligations to the Company; or where the Company becomes aware of material misstatements or omissions in the financial statements of the Company; or any circumstances occur that the Board determines to have resulted in an unfair benefit to the recipient.
Hedging The Company prohibits the hedging of Incentive Rights and Restricted Shares by Participants.
3.7 Non-Executive Director Remuneration Policy The Non-Executive Director Remuneration Policy applies to Non-Executive Directors of the Company in their capacity as Directors and as members of committees, and may be summarised as follows:
Remuneration comprises:– Board fees– Committee fees– Superannuation– Other benefits– Securities (if appropriate at the time).
Remuneration will be managed within the aggregate fee limit (AFL) or fee pool approved by shareholders of the Company. The Non-Executive Director Remuneration Policy contains guidelines regarding when the Board should seek adjustment
to the AFL such as in the case of the appointment of additional Non-Executive Directors. Remuneration should be reviewed annually. Non-Executive Directors are not entitled to termination benefits. A policy level of Board Fees (being the fees paid for membership of the Board, inclusive of superannuation and exclusive
of committee fees) will be set with reference to the median of comparable ASX listed companies.
Remuneration Report - Audited
NEXTDC Limited and controlled entities | FY18 Annual Report 28
For
per
sona
l use
onl
y

Committee fees may be used to recognise additional contributions to the work of the Board by members of committees, but that the inclusion of these should result in outcomes that, when combined with Board Fees, will not exceed the 75th percentile of comparable ASX listed companies.
The Company does not currently provide securities as part of Non-Executive Director remuneration and shareholder approval would be sought for any plan that may facilitate this form of remuneration being paid.
The document also outlines the procedure that should be undertaken to review Non-Executive Director remuneration and determine appropriate changes.
As part of its annual review of Board fees the Remuneration and Nomination Committee undertook independent benchmarking of Non-Executive Director remuneration with reference to companies of a similar size in Australia as indicated by market capitalisation. No formal recommendation was provided to the Board by any third party as part of this exercise. With regard to the growth and success of NEXTDC and the resulting increased time commitment and workload for its Non-Executive Directors it was determined that an increase (as indicated in section 6.2) in Non-Executive Director remuneration was warranted and became effective from 1 January 2018.
For FY19, the Remuneration and Nomination Committee has considered the current AFL for Non-Executive Directors which has remained unchanged at the current limit of $750,000 p.a. since the Company’s FY13 AGM. To allow for sufficient capacity to appoint up to a further two additional Non-Executive Directors, overlapping tenures as part of the Board’s orderly succession planning, and for future adjustments of Non-Executive Director fees, the Remuneration and Nomination Committee has proposed that an increase to the AFL of $500,000 be sought at the Company’s FY18 AGM, being an increase in the AFL from $750,000 to $1,250,000.
4. EMPLOYMENT TERMS FOR DIRECTORS AND SENIOR EXECUTIVES
NON-EXECUTIVE DIRECTORS On appointment to the Board, all Non-Executive Directors enter into a service agreement with the Company in the form of a letter of appointment. The letter summarises the Board policies and terms, including compensation relevant to the office of the Director.
All of the current Non-Executive Directors carry an initial contract duration of three years (subject to re-election by shareholders). The employment contracts for the Non-Executive Directors do not carry notice period provisions, nor do they provide for any termination benefits.
Directors must retire from office at the third annual general meeting after the Director was last elected and will then be eligible for re-election. Upon cessation of a Director’s appointment, the Director will be paid his or her Director’s fees on a pro-rata basis, to the extent that they are unpaid, up to the date of cessation.
SENIOR EXECUTIVES Remuneration and other terms of employment for the Chief Executive Officer and other key management personnel are also formalised in service agreements.
The CEO’s base salary package increased to $1.26 million in FY18, from $1.20 million in FY17, which was his base pay since his appointment to the role in 2012. Over this period, the CEO has overseen the company’s expansion, and has delivered:
NEXTDC is unique among ASX-listed companies due to its high capital-intensity and growth prospects requiring further capital to be invested ahead of demonstrable revenues and profits. Most comparable peers are US-based, as is the more comparable executive talent. The Board considered the Company’s long-term strategy and potential, and determined that the CEO’s remuneration remains appropriate in context of the skills and experience necessary to lead NEXTDC.
Compound annual revenue growth
138%Compound annual growth in
total assets
133%Compound annual market
capitalisation growth
152%
Remuneration Report - Audited
NEXTDC Limited and controlled entities | FY18 Annual Report 29
For
per
sona
l use
onl
y

Other major provisions of the agreements relating to service agreements are set out below.
TABLE 3: SERVICE AGREEMENTS
Name Duration of Contract Notice Period Termination Payments1
Craig Scroggie No fixed term 12 months 12 months
Simon Cooper No fixed term 6 months 6 months
Oskar Tomaszewski No fixed term 6 months 6 months
Adam Scully No fixed term 6 months 6 months
David Dzienciol No fixed term 6 months 6 months
5. STI AND LTI PERFORMANCE OUTCOMES FOR FY18
5.1 STI Vesting Outcomes The below performance measures were chosen as being the most relevant drivers for improving financial performance and growing shareholder value. More specifically, the metrics were chosen because:
Group EBITDA: This metric indicates the Company’s underlying profitability at this stage of its development; New NMRR Committed: This metric is connected to the level of incremental new business signed with NEXTDC’s
two key customer segments: Retail and Wholesale.
FIGURE 4: CALCULATION OF STI OUTCOMES
The joint assessment of these three performance objectives in the context of the Company’s overall performance resulted in overall performance falling in between target and stretch for the FY18 performance period. The actual EBITDA and NMRR targets are not quantified as they are considered to be commercially sensitive and are therefore not disclosed in the interests of shareholders.
Based on performance against these three objectives, the Board has determined that 66% of the FY18 STI opportunity has been achieved.
1 Base salary payable if the Company terminates employees with notice, and without cause (for example, reasons other than unsatisfactory performance).
Gateway Test
EBITDA greater than 95% of budgetachieved
Maximum STI Value
STI opportunity of up to 75% of Base
Performance Measure
Group EBITDA
Retail NMRR
Wholesale NMRR
Weighting
1/3
1/3
1/3
STI Outcome
STI outcome is subject to Board assessment and discretion
Remuneration Report - Audited
NEXTDC Limited and controlled entities | FY18 Annual Report 30
For
per
sona
l use
onl
y

5.2 LTI Vesting Outcomes The measurement period for the FY16 LTI was for the period 1 July 2015 to 30 June 2018. The vesting condition attached to the FY16 LTI was based on NEXTDC’s TSR over the measurement period, against the relative performance of the All Ordinaries Accumulation Index (XAOAI).
NEXTDC’s performance against the vesting conditions is summarised below:
TABLE 4: TSR PERFORMANCE
Based on the above assessment, the stretch target has been achieved, and the Board has determined that 100% of the LTI granted in FY16 will vest, and rights will be converted to ordinary shares following the release of the FY18 Annual Report.
6. STATUTORY REMUNERATION
6.1 Senior Executive Remuneration The following table outlines the remuneration received or due to be received by Senior Executives of the Company during the 2018 and 2017 financial years and has been prepared in accordance with the Corporations Act and the relevant accounting standards. The figures provided under the LTI are based on accounting values and do not necessarily reflect actual payments received during the year.
Market TSR
TSR required to achieve stretch hurdle
TSR achieved
31.2%
46.9%
225.7%
Remuneration Report - Audited
NEXTDC Limited and controlled entities | FY18 Annual Report 31
For
per
sona
l use
onl
y

6. STATUTORY REMUNERATION (CONTINUED)
TABLE 5: STATUTORY REMUNERATION
Basic package STI LTI
Name Year Salary Super- contributions
Non-monetary
benefits
Leave benefits (1) Subtotal STI (2) % of
TRP LTI Total
remuneration package
Craig Scroggie 2018 1,230,000 30,000 1,966 168,705 1,430,671 623,700 24% 497,266 2,551,637
Simon Cooper 2018 449,951 20,049 1,966 19,517 491,483 232,650 26% 178,163 902,296
Oskar Tomaszewski 2018 429,951 20,049 - 43,662 493,662 222,750 25% 168,676 885,088
Adam Scully 2018 367,451 20,049 - 37,381 424,881 191,813 25% 142,744 759,438
David Dzienciol 2018 414,951 20,049 - 53,245 488,245 215,325 25% 149,762 853,332
Total 2018 2,892,304 110,196 3,932 322,510 3,328,942 1,486,238 25% 1,136,611 5,951,791
Basic package STI LTI
Name Year Salary Super- contributions
Non-monetary
benefits
Leave benefits (1) Subtotal STI % of
TRP LTI Total
remuneration package
Craig Scroggie 2017 1,170,000 30,000 2,122 109,544 1,311,666 574,697 25% 457,782 2,344,145
Simon Cooper 2017 430,385 19,616 2,122 508 452,631 216,861 26% 154,207 823,699
Oskar Tomaszewski 2017 410,385 19,616 - 30,458 460,459 204,966 25% 158,683 824,108
Adam Scully 2017 355,385 19,616 - 27,694 402,695 177,905 25% 119,272 699,872
David Dzienciol 2017 380,385 19,616 - 22,414 422,415 192,766 26% 119,005 734,186
Total 2017 2,746,540 108,464 4,244 190,618 3,049,866 1,367,195 25% 1,008,949 5,426,010
(1) Leave benefits in the basic package includes the net movement of short-term leave benefits such as annual leave and long-term leave benefits such as long service leave.
(2) 50% of the 2018 STI will be deferred for 12 months, with employees being able to elect whether this is delivered in cash or equity.
Remuneration Report - Audited
NEXTDC Limited and controlled entities | FY18 Annual Report 32
For
per
sona
l use
onl
y

6.2 Non-Executive Director Remuneration Non-Executive Director fees are managed within the current aggregate annual fees cap of $750,000 which was approved by shareholders at the FY13 AGM in October 2013.
The rates of fees including superannuation contributions in respect of the 2018 and 2019 financial years is as follows:
TABLE 6: NON-EXECUTIVE DIRECTOR FEE SCHEDULE
FY18 FY19
Board Chair $232,500 per annum $275,000 per annum
Non-Executive Directors $116,500 per annum $135,000 per annum
Audit and Risk Management Committee Chair $25,000 per annum $30,000 per annum
Remuneration and Nomination Committee Chair $22,500 per annum $25,000 per annum
Committee Member $11,500 per annum $13,000 per annum
These fees are consistent with the Company’s policy of benchmarking fees at the market median. Remuneration received by Non-Executive Directors in FY18 and FY17 is disclosed below.
TABLE 7: NON-EXECUTIVE DIRECTOR REMUNERATION
Name Financial year Board fees Superannuation Total
Douglas Flynn 2018 233,333 22,167 255,500
Gregory J Clark AC 2018 137,443 13,057 150,500
Stuart Davis 2018 139,726 13,274 153,000
Sharon Warburton 2018 127,397 12,103 139,500
Total 2018 637,899 60,601 698,500
Douglas Flynn 2017 191,781 18,219 210,000
Gregory J Clark AC 2017 116,895 11,105 128,000
Stuart Davis 2017 116,895 11,105 128,000
Sharon Warburton 2017 26,941 2,559 29,500
Total 2017 515,374 48,960 564,334
Recommended Non-Executive Director Shareholding Non-Executive Directors are encouraged to accumulate shares on their own behalf, over a three year period, of equivalent value to their average annual Directors’ fees over the three years.
Remuneration Report - Audited
NEXTDC Limited and controlled entities | FY18 Annual Report 33
For
per
sona
l use
onl
y

6.3 Changes in Securities Held Due to Remuneration
TABLE 8: CHANGES IN SECURITIES HELD DUE TO REMUNERATION
Name Instrument
Balance at start of the
year Granted Exercised
Accounting value at
exercise date ($) Lapsed
Balance at end of the year
Craig Scroggie Loan Funded Shares 1,768,093 - (1,768,093) 820,523 - -
Craig Scroggie Performance Rights 1,116,874 194,987 (505,618) 632,174 - 806,243
Craig Scroggie Deferred Rights - 41,503 - - - 41,503
Simon Cooper Performance Rights 404,081 73,121 (174,860) 171,170 - 302,342
Simon Cooper Deferred Rights - 15,661 - - - 15,661
Oskar Tomaszewski Performance Rights 380,832 69,871 (161,798) 158,384 - 288,905
Adam Scully Performance Rights 317,421 60,934 (126,404) 123,737 - 251,951
Adam Scully Deferred Rights - 12,848 - - - 12,848
David Dzienciol Performance Rights 330,156 64,996 (126,404) 123,737 - 268,748
David Dzienciol Deferred Rights - 13,921 - - - 13,921
Remuneration Report - Audited
NEXTDC Limited and controlled entities | FY18 Annual Report 34
For
per
sona
l use
onl
y

Legacy Loan Funded Share Plan The following table details shares that have been provided to key management personnel through the Loan Funded Share Plan:
TABLE 9: LOAN FUNDED SHARE PLAN
Name Issue Date
Number of Loan Funded Shares
Allocated
Number of Loan
Funded Shares Vested
Number of Shares
Exercised
Number of Shares
Remaining
Average Issue Price
($)
Average Fair
Value ($)
Total Amount of Loan
($)
Craig Scroggie
20 Dec 2012 534,760 534,760 (534,760) - 1.87 0.60 -
500,000 500,000 (500,000) - 2.00 0.53 -
400,000 400,000 (400,000) - 2.50 0.37 -
333,333 333,333 (333,333) - 3.00 0.26 -
Simon Cooper
31 Oct 2011 142,857 142,857 (142,857) - 1.75 0.22 -
142,857 142,857 (142,857) - 1.75 0.35 -
142,857 142,857 (142,857) - 1.75 0.45 -
142,857 142,857 (142,857) - 1.75 0.53 -
Adam Scully
6 June 2013 50,000 50,000 (50,000) - 2.00 0.61 -
50,000 50,000 (50,000) - 2.50 0.43 -
TOTAL 2,439,521 2,439,521 (2,439,521) - - - -
As part of NEXTDC’s long-term incentives, eligible KMP participants had previously been offered a Loan Funded Share Plan (Share Plan).
While no further grants will be made under this plan, previous grants must be allowed to run out, and therefore this legacy incentive plan remained grandfathered during the course of FY18. NEXTDC holds the shares for the benefit of participants by issuing the shares to NEXTDC Share Plan Pty Ltd (the Trustee), a wholly-owned subsidiary of NEXTDC. Under the Share Plan, ordinary shares are issued to participants with the purchase price lent to the employee under a limited recourse loan. The loan is interest free and is provided for a maximum term of five years. The terms of the Share Plan are such that participants receive an upfront entitlement to a certain number of shares. After the participant has repaid the respective loan balance in full, shares are transferred to the participant in four annual tranches. The vesting of these shares is not dependent on performance conditions, only service conditions, which is one of the reasons that the Share Plan will no longer be used to make grants.
There were no shares in the loan funded share plan issued to key management personnel and outstanding at the end of the year (2017: 1,768,093).
The weighted average fair value of the shares has been calculated by using the Binomial Option pricing method.
Remuneration Report - Audited
NEXTDC Limited and controlled entities | FY18 Annual Report 35
For
per
sona
l use
onl
y

Performance Rights The following table details performance rights that have been provided to key management personnel.
TABLE 10: PERFORMANCE RIGHTS PROVIDED TO KEY MANAGEMENT PERSONNEL
Name Financial Year
Granted Number of
Performance Rights
Vested and paid during the
year
Forfeited during the
year
Unvested at the end of the
year
Craig Scroggie 2015 505,618 (505,618) - -
2016 387,931 - - 387,931
2017 223,325 - - 223,325
2018 194,987 - - 194,987
1,311,861 (505,618) - 806,243
Simon Cooper 2015 174,860 (174,860) - -
2016 145,474 - - 145,474
2017 83,747 - - 83,747
2018 73,121 - - 73,121
477,202 (174,860) - 302,342
Oskar Tomaszewski 2015 161,798 (161,798) - -
2016 139,009 - - 139,009
2017 80,025 - - 80,025
2018 69,871 - - 69,871
450,703 (161,798) - 288,905
Adam Scully 2015 126,404 (126,404) - -
2016 121,228 - - 121,228
2017 69,789 - - 69,789
2018 60,934 - - 60,934
378,355 (126,404) - 251,951
David Dzienciol 2015 126,404 (126,404) - -
2016 129,310 - - 129,310
2017 74,442 - - 74,442
2018 64,996 - - 64,996
395,152 (126,404) - 268,748 The fair values of each performance right at grant date are as follows:
Financial year granted Fair value at grant date
2015 Between $0.98 and $1.25
2016 $1.25
2017 $1.63
2018 $3.32
Remuneration Report - Audited
NEXTDC Limited and controlled entities | FY18 Annual Report 36
For
per
sona
l use
onl
y

Deferred Rights The following table details deferred rights that have been provided to those key management personnel who elected to received the deferred component of their STI in shares rather than cash.
TABLE 11: DEFERRED RIGHTS PROVIDED TO KEY MANAGEMENT PERSONNEL
Name Financial Year
Granted Number of
Deferred Share Rights
Vested and paid during the
year
Forfeited during the year
Unvested at the end of the
year
Craig Scroggie 2018 41,503 - - 41,503
Simon Cooper 2018 15,661 - - 15,661
Adam Scully 2018 12,848 - - 12,848
David Dzienciol 2018 13,921 - - 13,921
Total 83,933 - - 83,933
The fair value of the deferred rights at grant date is as follows:
Financial year granted Fair value at grant date
2018 $4.62
Deferred rights under the Senior Executive STI Plan are granted following release of the annual results. The shares vest one year from the grant date. On vesting, each right automatically converts into one ordinary share. Senior Executives do not receive any dividends and are not entitled to vote in relation to the rights during the vesting period. If a Senior Executive ceases employment before the rights vest, they have six months from the cessation of employment or the vesting date, whichever is later, to exercise their deferred rights. Any rights not exercised in this period will automatically lapse.
The fair value of the rights is determined based on the volume weighted average trading price of the Company’s shares over the 10 trading days following release of the Company’s annual results.
Remuneration Report - Audited
NEXTDC Limited and controlled entities | FY18 Annual Report 37
For
per
sona
l use
onl
y

6.4 Director and Senior Executive Shareholdings During FY18, KMP and their related parties held shares in NEXTDC directly, indirectly or beneficially as follows:
TABLE 12: DIRECTOR AND SENIOR EXECUTIVE SHAREHOLDINGS
Holder Opening balance
Received during the
year as compensation
Received during the
year on the exercise of
an option or right
Other changes
Closing balance
Shares held
nominally at 30 June
2018
DIRECTORS
Douglas Flynn 148,127 - - 4,404 152,531 152,531
Gregory J Clark AC 35,000 - - 27,202 62,202 62,202
Stuart Davis 32,112 - - 2,202 34,314 34,314
Sharon Warburton - - - 32,202 32,202 -
SENIOR EXECUTIVES
Craig Scroggie 1,042,043 - 2,273,711 (1,763,689) 1,552,065 379,601
Simon Cooper 81,000 - 174,860 (125,500) 130,360 11,000
Oskar Tomaszewski - - 161,798 (80,697) 81,101 -
Adam Scully 3,000 - 126,404 (45,000) 84,404 3,000
David Dzienciol 161,935 - 126,404 (97,798) 190,541 -
The Non-Executive Directors of the Company did not receive any shares in NEXTDC on behalf of the Company in respect of the 2017 and 2018 financial reporting periods.
Loans to Directors and Executives Excluding loans provided under the loan funded share plan, there were no loans to Directors or other key management personnel at any time during the year.
Remuneration Report - Audited
NEXTDC Limited and controlled entities | FY18 Annual Report 38
For
per
sona
l use
onl
y

6.5 Remuneration Received (Non-statutory)
Remuneration received in FY18
The amounts disclosed below as Senior Executive remuneration for FY18 reflect the acutal benefits received by each Senior Executive during the reporting period. The remuneration values disclosed have been determined as follows:
Fixed remuneration Fixed remuneration includes base salaries received, paid leave, payments made to superannuation funds, and the taxable value of non-monetary benefits received, and excludes any accruals of annual or long service leave.
Short-term incentives Cash STI represents bonuses that were awarded to each Senior Executive in relation to FY18 performance, which will be paid in FY19. Starting from FY18, 50% of the STI bonuses awarded will be deferred for 12 months, with employees being able to elect whether the award will be delivered in cash or equity.
Long term incentives The value of vested Loan Funded Share Plan (LFSP) shares and rights were determined based on the intrinsic value of the LFSP shares and rights at the date of vesting, being the difference between the share price on that date, and the exercise price payable by the Senior Executive. The LFSP shares and performance rights that vested in FY18 were granted in 2012 and 2015 respectively.
TABLE 13: REMUNERATION RECEIVED IN FY18
Name Fixed Remuneration Awarded STI (cash) Vested LTI Total Value
Craig Scroggie 1,261,966 311,850 10,348,718 11,922,534
Simon Cooper 471,966 116,325 743,155 1,331,446
Oskar Tomaszewski 450,000 111,375 687,642 1,249,017
Adam Scully 387,500 95,906 537,217 1,020,623
David Dzienciol 435,000 107,663 537,217 1,079,880
Total 3,006,432 743,119 12,853,949 16,603,500
The amounts disclosed above are not the same as the remuneration expensed in relation to each KMP in accordance with accounting standards. The Directors believe that the remuneration received is more relevant to users for the following reasons:
The statutory remuneration expensed is based on historic cost and does not reflect the value of the equity instrumentswhen they are actually received by the Senior Executives
The statutory remuneration shows benefits before they are actually received by the Senior Executives Where rights do not vest because a market based performance condition is not satisfied (eg. TSR), the company must
still recognise the full amount of expenses even though the Senior Executives will never receive any benefits Share based payment awards are treated differently under the accounting standards depending on whether the
performance conditions are market conditions (no reversal of expense) or non-market conditions (reversal of expensewhen shares fail to vest), even though the benefit received by the Senior Executives is the same (nil where equityinstruments fail to vest).
The information in this section has been audited together with the rest of the remuneration report.
Remuneration Report - Audited
NEXTDC Limited and controlled entities | FY18 Annual Report 39
For
per
sona
l use
onl
y

NON-AUDIT SERVICES
The Group may decide to employ the auditor, PricewaterhouseCoopers, on assignments in addition to their statutory audit duties, where the auditor’s expertise and experience with the Group are important. Details of the amounts paid or payable to the auditor for non-audit services provided during the period are set out below.
The Board of Directors has considered the position and, in accordance with advice received from the Audit and Risk Management Committee, is satisfied that the provision of the non-audit services is compatible with the general standard of auditor independence imposed by the Corporations Act 2001. The Directors are satisfied that the provision of non-audit services by the auditor, as set out below, did not compromise the auditor independence requirements of the Corporations Act 2001 for the following reasons:
all non-audit services have been reviewed by the Audit and Risk Management Committee to ensure they do not impactthe impartiality and objectivity of the auditor; and
none of the services undermine the general principles relating to auditor independence as set out in APES 110 Code ofEthics for Professional Accountants.
During the period the following fees were paid or payable for non-audit services provided by the auditor of the Group, its related practices and non-related audit firms.
PwC Australia 2018 $
2017 $
(i) Taxation Services 16,710 15,710
(ii) Other Assurance Services 47,504 -
Total remuneration of PwC Australia for non-audit services 64,214 15,710
Auditor’s independence declaration A copy of the auditor’s independence declaration as required under section 307C of the Corporations Act 2001 is set out on page 41.
Auditor PricewaterhouseCoopers continues in office in accordance with section 327 of the Corporations Act 2001.
This report is made in accordance with a resolution of the Directors.
Craig Scroggie
Managing Director and Chief Executive Officer
31 August 2018
Directors' Report
NEXTDC Limited and controlled entities | FY18 Annual Report 40
For
per
sona
l use
onl
y

NEXTDC Limited and controlled entities | FY18 Annual Report 41
For
per
sona
l use
onl
y

Corporate Governance Corporate Governance is of central importance to NEXTDC and its Board of Directors (“the Board”). The Board endorses the 3rd edition of the Australian Securities Exchange (“ASX”) Corporate Governance Council’s Corporate Governance Principles and Recommendations (“ASX Principles”).
At NEXTDC, Corporate Governance means the overarching environment that supports everything the Company does. It is the combination of processes and structures implemented by the Board and Senior Executives to inform, direct, manage and monitor NEXTDC’s activities to meet its strategic objectives.
Corporate governance provides evidence to investors and Australian Securities & Investments Commission (ASIC) that the Company:
complies with legislation such as the Corporations Act; meets expectations as a company listed on the ASX; and manages the company that is being funded by investors according to best practices.
This is important given that investors want to have confidence that the Company is being managed properly. Elements of NEXTDC’s Corporate Governance to ensure the Company stays on track to meet strategic objectives include:
an effective risk management framework and internal controls; procedures, processes and structures, including policies relating to code of conduct, the stock market and business
operations (e.g. Whistleblower Policy, Shareholder Communications Policy, Continuous Disclosure Policy, EnvironmentalPolicy, Information Security Policy, WHS Policy);
regular reporting to the Board and Senior Executives from department heads to understand how NEXTDC is performingas a company and how NEXTDC is managing its risks;
undertaking internal audits against best practice standards to independently review corporate governance, risks andcontrols, and implement continuous improvements if any gaps are identified; and
ensuring a sufficient level of management and oversight. Corporate governance roles and responsibilities have beendelegated to various committees and outlined in respective charters at the Board level, Senior Executive level and seniormanagement level.
Further details on how NEXTDC’s Corporate Governance aligns with the ASX Corporate Governance Council’s Corporate Governance Principles and Recommendations (3rd Ed.) and Appendix 4G can be found at https://www.nextdc.com/our-company/corporate-governance.
NEXTDC Limited and controlled entities | FY18 Annual Report 42
For
per
sona
l use
onl
y

NEXTDC LimitedABN 35 143 582 521
Financial reportfor the year ended 30 June 2018
NEXTDC Limited and controlled entities | FY18 Annual Report 43
For
per
sona
l use
onl
y

Financial Report
These financial statements are the consolidated financial statements of the consolidated entity consisting ofNEXTDC Limited (ABN 35 143 582 521) and its subsidiaries. NEXTDC Limited is a company limited by shares,incorporated and domiciled in Australia. The financial statements are presented in the Australian currency.
NEXTDC’s registered office is:Level 6,100 Creek Street Brisbane Qld 4000
A description of the nature of the consolidated entity's operations and its principal activities is included in theDirectors' Report, which is not part of these financial statements.
The financial statements were authorised for issue by the Directors on 31 August 2018.
The Directors have the power to amend and reissue the financial statements.
Note PageConsolidated Statement of Comprehensive Income 45Consolidated Balance Sheet 46Consolidated Statement of Changes in Equity 47Consolidated Statement of Cash Flows 48Notes to the Consolidated Financial Report 49Directors' Declaration 88Independent Auditor's Report to the Members 89Shareholder information 95Corporate directory 97
NEXTDC Limited and controlled entities | FY18 Annual Report 44
For
per
sona
l use
onl
y

Consolidated Statement of Comprehensive IncomeFor the year ended 30 June 2018
Note
30 June2018$'000
30 June2017$'000
REVENUE FROM CONTINUING OPERATIONSData centre services revenue 3 152,560 117,580Other revenue 3 8,969 5,970Total revenue 161,529 123,550
OTHER INCOMEOther income 284 263
EXPENSESDirect costs (27,558) (16,603)Employee benefits expense (26,955) (22,674)Data centre facility costs 4 (24,794) (21,475)Depreciation and amortisation expense (33,038) (23,339)Professional fees (3,266) (1,591)Marketing costs (476) (483)Office and administrative expenses (9,032) (6,044)Finance costs 4 (25,803) (18,777)Profit before income tax 10,891 12,827
Income tax benefit/(expense) 21 (4,252) 10,172
Profit after income tax 6,639 22,999
PROFIT IS ATTRIBUTABLE TO:Owners of NEXTDC Limited 6,639 22,999OTHER COMPREHENSIVE INCOMETotal comprehensive income 6,639 22,999
Attributable to:Owners of NEXTDC Limited 6,639 22,999
Cents Cents
EARNINGS PER SHARE FOR PROFIT ATTRIBUTABLE TO THEORDINARY EQUITY HOLDERS OF THE GROUP:Basic earnings per share 2 2.25 8.35Diluted earnings per share 2 2.21 8.17
The notes following the financial statements form part of the financial report.
NEXTDC Limited and controlled entities | FY18 Annual Report 45
For
per
sona
l use
onl
y

Consolidated Balance SheetAs at 30 June 2018
Note
30 June2018$'000
30 June2017$'000
ASSETSCURRENT ASSETSCash and cash equivalents 417,982 271,838Term deposits - 96,500Trade and other receivables 5 37,086 16,215Other assets 6 9,154 11,273
Total current assets 464,222 395,826
NON-CURRENT ASSETSProperty, plant and equipment 10 679,950 434,267Other assets 6 6,635 1,152Intangible assets 11 12,907 8,538Deferred tax assets 22 9,687 12,601Available-for-sale financial assets 9 62,523 -
Total non-current assets 771,702 456,558
TOTAL ASSETS 1,235,924 852,384
LIABILITIESCURRENT LIABILITIESTrade and other payables 7 33,217 38,612Other liabilities 8 2,960 4,400Finance lease liability 15 307 290
Total current liabilities 36,484 43,302
NON-CURRENT LIABILITIESOther liabilities 932 104Provisions 692 429Borrowings 15 298,104 295,973Finance lease liability 5,735 6,042
Total non-current liabilities 305,463 302,548
TOTAL LIABILITIES 341,947 345,850
NET ASSETS 893,977 506,534
EQUITYContributed equity 13 904,247 524,458Reserves 6,005 4,990Accumulated losses (16,275) (22,914)
TOTAL EQUITY 893,977 506,534
The notes following the financial statements form part of the financial report.
NEXTDC Limited and controlled entities | FY18 Annual Report 46
15
For
per
sona
l use
onl
y

Consolidated Statement of Changes in EquityFor the year ended 30 June 2018
Note
Contributedequity$'000
Reserves
$'000
Accumulatedlosses
$'000
Totalequity$'000
Balance at 1 July 2016 375,507 3,534 (45,913) 333,128
Profit for the-year - - 22,999 22,999Total comprehensive income - - 22,999 22,999
TRANSACTIONS WITH OWNERS IN THEIRCAPACITY AS OWNERS:Contributions of equity, net of transaction costs andtax 13(b) 148,951 - - 148,951Share-based payments - value of employee services 20(d) - 1,456 - 1,456
Balance at 30 June 2017 524,458 4,990 (22,914) 506,534
Balance at 1 July 2017 524,458 4,990 (22,914) 506,534
Profit for the-year - - 6,639 6,639Total comprehensive income - - 6,639 6,639
TRANSACTIONS WITH OWNERS IN THEIRCAPACITY AS OWNERS:Contributions of equity, net of transaction costs andtax 13(b) 378,567 - - 378,567Acquisition of treasury shares 13(g) (165) - - (165)Share based payments - conversion of rights toshares 1,387 (1,387) - -Share-based payments - value of employee services 20(d) - 1,963 - 1,963Share based payments - deferred STI - 439 - 439
Balance at 30 June 2018 904,247 6,005 (16,275) 893,977
The notes following the financial statements form part of the financial report.
NEXTDC Limited and controlled entities | FY18 Annual Report 47
13(b)
For
per
sona
l use
onl
y

Consolidated Statement of Cash FlowsFor the year ended 30 June 2018
Note
30 June2018$'000
30 June2017$'000
OPERATING ACTIVITIESReceipts from customers (inclusive of GST) 144,630 133,220Payments to suppliers and employees (inclusive of GST) (98,632) (78,765)
45,998 54,455Interest paid (22,127) (13,311)Payments for bank guarantees 1,607 (1,694)Distributions received 1,561 -Interest received 6,351 5,475
Net cash inflow from operating activities 23(a) 33,390 44,925
INVESTING ACTIVITIESPayments for property, plant and equipment (282,546) (143,550)Payments for available-for-sale financial assets (62,523) -Receipts of / (payments for) term deposits 96,500 (96,500)Payments for intangible assets (10,246) (5,031)
Net cash (outflow) from investing activities (258,815) (245,081)
FINANCING ACTIVITIESProceeds from issue of Notes - 300,000Repayment of Notes - (160,000)Transaction costs in relation to loans and borrowings (5,486) (5,648)Proceeds from issues of shares and other equity securities 381,690 151,261Transaction costs paid in relation to issue of shares (4,345) (4,738)Repayment of finance lease principal amounts 23(b) (290) (274)
Net cash inflow from financing activities 371,569 280,601
Net increase in cash and cash equivalents 146,144 80,445Cash and cash equivalents at the beginning of the year 271,838 191,393
Cash and cash equivalents at the end of the year 417,982 271,838
The notes following the financial statements form part of the financial report.
NEXTDC Limited and controlled entities | FY18 Annual Report 48
For
per
sona
l use
onl
y

Notes to the Consolidated Financial Report30 June 2018
Contents of the notes to the consolidated financial report
Page
BUSINESS PERFORMANCE 51
1 Segment performance 51
2 Earnings per share 53
3 Revenue and other income 54
4 Expenses 55
OPERATING ASSETS AND LIABILITIES 56
5 Trade and other receivables 56
6 Other assets 57
7 Trade and other payables 58
8 Other liabilities 58
9 Available-for-sale financial assets 58
10 Property, plant and equipment 60
11 Intangible assets 62
CAPITAL AND FINANCIAL RISK MANAGEMENT 64
12 Capital risk management 64
13 Contributed equity 64
14 Financial risk management 67
15 Borrowings 70
ITEMS NOT RECOGNISED 71
16 Commitments 71
17 Contingencies 72
18 Events occurring after the reporting period 72
EMPLOYEE REMUNERATION 73
19 Key management personnel 73
20 Share-based payments 73
OTHER 76
21 Income tax 76
22 Deferred tax 78
23 Cash flow information 79
24 Remuneration of auditors 80
25 Summary of significant accounting policies 81
NEXTDC Limited and controlled entities | FY18 Annual Report 49
For
per
sona
l use
onl
y

Notes to the Consolidated Financial Report30 June 2018(continued)
The 2018 financial statements notes have been grouped into the following sections:
• Section 1 Business performance• Section 2 Operating assets and liabilities• Section 3 Capital and financial risk management• Section 4 Items not recognised• Section 5 Employee remuneration• Section 6 Other
Each section sets out the accounting policies applied along with details of any key judgements and estimates made or information required to understand the note.
NEXTDC Limited (the Company) is domiciled in Australia. The registered office is Level 6, 100 Creek Street, Brisbane Qld 4000.
The nature of the operations and principal activities of the Company and its controlled entities (referred to as ‘the Group’) are described in the Segment information.
The consolidated general purpose financial statements of the Group for the year ended 30 June 2018 were authorised for issue in accordance with a resolution of the Directors on 30 August 2018.
The financial statements:
• Have been prepared in accordance with the requirements of the Corporations Act 2001 (Cth), AustralianAccounting Standards and other authoritative pronouncements of the Australian Accounting Standards Board(AASB) and International Financial Reporting Standards as issued by the International Accounting StandardsBoard;
• Have been prepared on a historical cost basis, except for derivative financial instruments and environmentalscheme certificates that are carried at their fair value; and trade and other receivables that are initially recognisedat fair value, and subsequently measured at amortised cost less accumulated impairment losses;
• Are presented in Australian dollars and, unless otherwise stated, all values have been rounded to the nearestthousand dollars ($'000) under the option available under the Australian Securities and Investments Commission(ASIC) Corporations (Rounding in Financial/Directors' Report) Instrument 2016/191;
• Present reclassified comparative information where required for consistency with the current year’spresentation;
• Adopt all new and amended Accounting Standards and Interpretations issued by the AASB that are relevant tothe operations of the Group and effective for reporting periods beginning on or after 1 July 2017;
• Do not early adopt any Accounting Standards and Interpretations that have been issued or amended but are notyet effective.
NEXTDC Limited and controlled entities | FY18 Annual Report 50
For
per
sona
l use
onl
y

Notes to the Consolidated Financial Report30 June 2018(continued)
Business performance
1 Segment performance
(a) Description of segments
Management considers the business from a geographic perspective and has identified six reportable segments,the first five being each state where the Group operates data centre facilities and the last capturing financialinformation from operations that do not naturally fit into any particular geography. These segments do not exist asa separate legal entity, consequently, information such as income tax expense and segment liabilities are notprepared and provided to management for review and therefore not presented.
(b) Segment information provided to management
The segment information provided to management for the reportable segments is as follows:
30 June 2018 Vic NSW Qld WA ACT Other Total$'000 $'000 $'000 $'000 $'000 $'000 $'000
Revenue from externalcustomers 64,317 56,184 16,892 11,481 2,786 900 152,560Direct and facility costs (18,171) (19,699) (4,151) (5,393) (4,482) (456) (52,352)Employee benefits expense (1,611) (1,196) (1,269) (790) (789) (548) (6,203)Other expenses (151) (100) (141) (88) (143) (453) (1,076)Segment EBITDA 44,384 35,189 11,331 5,210 (2,628) (557) 92,929
Depreciation and amortisation (10,273) (9,084) (5,049) (2,998) (2,252) (1,473) (31,129)Finance charge - - (351) - - - (351)Segment profit/(loss) beforetax 34,111 26,105 5,931 2,212 (4,880) (2,030) 61,449
Segment assets 205,813 274,009 108,660 52,058 32,459 4,934 677,933Unallocated assets - - - - - 557,991 557,991
Total segment assets 205,813 274,009 108,660 52,058 32,459 562,925 1,235,924
(270,130) (330,193) (125,552) (63,539) (35,245) (563,825) (1,388,484)30 June 2017 Vic NSW Qld WA ACT Other Total
$'000 $'000 $'000 $'000 $'000 $'000 $'000
Revenue from externalcustomers 51,315 41,004 14,697 8,306 1,700 558 117,580Direct and facility costs (12,851) (13,560) (3,105) (4,907) (3,634) (21) (38,078)Employee benefits expense (1,159) (1,127) (789) (804) (589) (236) (4,704)Other expenses (115) (339) (63) (112) (122) (731) (1,482)Segment EBITDA 37,190 25,978 10,740 2,483 (2,645) (430) 73,316
Depreciation and amortisation (7,412) (7,071) (2,387) (2,497) (895) (2,220) (22,482)Finance charge - - (367) - - - (367)Segment profit/(loss) beforetax 29,778 18,907 7,986 (14) (3,540) (2,650) 50,467
Segment assets 152,792 118,222 90,420 41,561 24,413 6,864 434,272Unallocated assets - - - - - 418,112 418,112
Total segment assets 152,792 118,222 90,420 41,561 24,413 424,976 852,384
(189,982) (144,200) (101,160) (44,044) (21,768) (424,546) (925,700)
NEXTDC Limited and controlled entities | FY18 Annual Report 51
For
per
sona
l use
onl
y

Notes to the Consolidated Financial Report30 June 2018(continued)
1 Segment performance (continued)
(b) Segment information provided to management (continued)
There was no impairment charge or other significant non-cash item recognised in 2018 (2017: nil).
(c) Other segment information
(i) Profit before tax
Management assesses the performance of the operating segments based on a measure of EBITDA. Interestincome and expenditure are not allocated to segments, as this type of activity is driven by the central treasuryfunction, which manages the cash position of the Group.
A reconciliation of profit before income tax is provided as follows:
30 June2018$'000
30 June2017$'000
Total segment profit before tax 61,449 50,467Employee benefits expense (non-facility staff) (20,752) (17,969)Interest revenue 5,778 5,970Distributions from investments 3,191 -Other income 284 263Finance costs (25,452) (18,410)Head office depreciation (1,909) (857)Overheads and other expenses (11,698) (6,637)
Profit before tax 10,891 12,827
A reconciliation of depreciation and amortisation is provided as follows:
30 June2018$'000
30 June2017$'000
Segment depreciation and amortisation expense 31,129 22,482Head office depreciation and amortisation expense 1,909 857
Total depreciation and amortisation expense 33,038 23,339
(ii) Segment liabilities
As noted above, the segment liabilities for each operating segment are not required by executive managementfor purposes of their decision making. As such, these are not provided to management and not categorised.
(d) Segment reporting
Operating segments are reported in a manner consistent with the internal reporting provided to the executivemanagement team. The executive team is responsible for allocating resources and assessing performance of theoperating segments. The executive team is the chief operating decision making body and consists of the ChiefExecutive Officer, Chief Operating Officer, Chief Financial Officer, Chief Customer Officer and ExecutiveVice-President of Technology, as well as Chief Sales Officer.
NEXTDC Limited and controlled entities | FY18 Annual Report 52
For
per
sona
l use
onl
y

Notes to the Consolidated Financial Report30 June 2018(continued)
2 Earnings per share
(a) Earnings per share
30 June2018
Cents
30 June2017
Cents
Total basic EPS attributable to the ordinary equity holders of the Group 2.25 8.35
(b) Diluted earnings per share
Total diluted EPS attributable to the ordinary equity holders of the Group 2.21 8.17
(c) Reconciliation of earnings used in calculating earnings per share
30 June2018$'000
30 June2017$'000
BASIC EARNINGS PER SHAREProfit attributable to equity holders of the Group used in calculating basic EPS:Profit used in calculating basic earnings per share 6,639 22,999
DILUTED EARNINGS PER SHAREProfit from continuing operations attributable to the equity holders of the Group:Used in calculating diluted earnings per share 6,639 22,999Profit attributable to the equity holders of the Group used in calculatingdiluted EPS 6,639 22,999
(d) Weighted average number of shares used as the denominator
2018Number of
shares
2017Number of
shares
Weighted average number of ordinary shares used as the denominator incalculating basic earnings per share 295,208,799 275,298,500Plus potential ordinary shares 4,943,617 6,084,962Weighted average number of ordinary shares and potential ordinary shares usedas the denominator in calculating diluted earnings per share 300,152,416 281,383,462
(e) Information concerning the classification of securities
(i) Performance rights and deferred rights
Performance rights and deferred rights are considered to be potential ordinary shares and have been included inthe calculation of diluted earnings per share. However, they are not included in the calculation where theinclusion would result in decreased earnings per share.
(ii) Loan funded shares
For the purposes of diluted earnings per share calculations, loan funded shares granted to employees areconsidered potential ordinary shares and have been included in the calculation of diluted earnings per share.However, they are not included in the calculation where the inclusion would result in decreased earnings pershare.
NEXTDC Limited and controlled entities | FY18 Annual Report 53
For
per
sona
l use
onl
y

Notes to the Consolidated Financial Report30 June 2018(continued)
2 Earnings per share (continued)
(f) Earnings per share
(i) Basic earnings per share
• the profit attributable to owners of the Group, excluding any costs of servicing equity other than ordinaryshares
• by the weighted average number of ordinary shares outstanding during the financial year.
(ii) Diluted earnings per share
Diluted earnings per share adjusts the figures used in the determination of basic earnings per share to take intoaccount the weighted average number of additional ordinary shares that would have been outstanding assumingthe conversion of all dilutive potential ordinary shares.
3 Revenue and other income
30 June2018$'000
30 June2017$'000
FROM CONTINUING OPERATIONSData centre services revenue 152,560 117,580
Interest income 5,778 5,970Distributions from investments 3,191 -
Subtotal - other revenue 8,969 5,970
Total revenue 161,529 123,550
(a) Revenue recognition
Revenue is measured at the fair value of the consideration received or receivable.
The Group recognises revenue when the amount of revenue can be reliably measured, it is probable that futureeconomic benefits will flow to the entity and specific criteria have been met for each of the activities as describedbelow. The Group bases its estimates on historical results, taking into consideration the type of customer, thetype of transaction and the specifics of each arrangement.
Revenue is recognised for the major business activities are as follows:
(i) Data centre services
Revenue is recognised only when the service has been provided, the amount of revenue can be measuredreliably and it is probable that the economic benefits associated with the transaction will flow to the Group.Upfront discounts provided to customers are amortised over the contract term - refer to Note 6(b).
(ii) Interest income
Interest income is recognised using the effective interest method. When a receivable is impaired, the Groupreduces the carrying amount to its recoverable amount, being the estimated future cash flow discounted at theoriginal effective interest rate of the instrument, and continues unwinding the discount as interest income. Interestincome on impaired loans is recognised using the original effective interest rate.
(iii) Distributions from investments
Distributions from investments are recognised as revenue when the right to receive payment is established.
NEXTDC Limited and controlled entities | FY18 Annual Report 54
For
per
sona
l use
onl
y

Notes to the Consolidated Financial Report30 June 2018(continued)
4 Expenses
Note
30 June2018$'000
30 June2017$'000
EXPENSEFinance costs 4(a) (25,803) (18,777)Data centre rent paid to APDC 4(b) (13,785) (13,393)
(a) Finance costs
At 30 June 2018, the Group had $300 million in unsecured notes (Notes III) on issue, carrying an annual couponrate of 6.25% paid semi-annually. Although these Notes are due 9 June 2021, the Group may repay as early as 9June 2019, and each six months thereafter. Regardless of when Notes III is redeemed, an additional 1.5%interest will also be payable on redemption. In addition, the Group may at any time prior to 9 June 2019, redeemall or part of the Notes, upon not less than 7 days and no more than 60 days prior notice.
(b) Data centre rent paid to APDC
Asia Pacific Data Centre ("APDC") is the landlord of three of NEXTDC’s data centre facilities: M1 Melbourne, S1Sydney and P1 Perth. Throughout the year, NEXTDC paid rent and ancillary amounts to APDC totalling $13.8million (2017: $13.4 million). The payments relate to the three operating leases for the facilities. These leasesexpire in 2027 and have options for a further 2 x 10 years and 1 x 5 years. Data centre rent is included in theConsolidated Statement of Comprehensive Income in Data centre facility costs.
NEXTDC Limited and controlled entities | FY18 Annual Report 55
For
per
sona
l use
onl
y

Notes to the Consolidated Financial Report30 June 2018(continued)
Operating assets and liabilities
5 Trade and other receivables
Note
30 June2018$'000
30 June2017$'000
Trade receivables 36,522 14,151Provision for impairment 5(a) (1,254) (242)
35,268 13,909
Interest receivable 5(c) 27 600GST receivable 162 1,689Other receivables 1,629 17
Total 37,086 16,215
(a) Impaired trade receivables
The ageing of these receivables is as follows:
30 June2018$'000
30 June2017$'000
1 to 3 months 126 334 months or greater 1,128 209
Total impaired trade receivables 1,254 242
Movements in the provision for impairment of receivables are as follows:
30 June2018$'000
30 June2017$'000
Opening balance 242 983Provision for impairment recognised during the year 1,166 198Receivables written off during the year as uncollectible (74) (491)Unused amount reversed (80) (448)
Closing balance 1,254 242
(b) Past due but not impaired
As at 30 June 2018, trade receivables of approximately $5.8 million (2017: $0.8 million) were past due but notimpaired. These relate to a number of independent customers for whom there is no recent history of default. Theageing analysis of these trade receivables is as follows:
30 June2018$'000
30 June2017$'000
Up to 3 months 5,291 382More than 3 months 537 457
Total past due but not impaired 5,828 839
NEXTDC Limited and controlled entities | FY18 Annual Report 56
For
per
sona
l use
onl
y

Notes to the Consolidated Financial Report30 June 2018(continued)
5 Trade and other receivables (continued)
The other classes within trade and other receivables do not contain impaired assets and are not past due. Basedon the credit history of these other classes, it is expected that these amounts will be received when due. TheGroup does not hold any collateral in relation to these other receivables.
(c) Interest receivable
Interest receivable relates to interest accrued on term deposits. Credit risk of this is assessed in the samemanner as cash and cash equivalents which is detailed in Note 14.
(d) Trade receivables
Trade receivables are recognised initially at fair value and subsequently measured at amortised cost using theeffective interest method, less provision for impairment. Trade receivables are generally due for settlement within30 days. They are presented as current assets unless collection is not expected for more than 12 months afterthe reporting date.
Collectability of trade receivables is reviewed on an ongoing basis. Debts which are known to be uncollectible arewritten off by reducing the carrying amount directly. An allowance account (provision for impairment of tradereceivables) is used when there is objective evidence that the Group will not be able to collect all amounts dueaccording to the original terms of the receivables. Significant financial difficulties of the debtor, probability that thedebtor will enter bankruptcy or financial reorganisation, and default or delinquency in payments (more than 90days overdue) are considered indicators that the trade receivable is impaired. The amount of the impairmentallowance is the difference between the asset’s carrying amount and the present value of estimated future cashflows, discounted at the original effective interest rate. Cash flows relating to short-term receivables are notdiscounted if the effect of discounting is immaterial.
The amount of the impairment loss is recognised in the Consolidated Statement of Comprehensive Income withinother expenses. When a trade receivable for which an impairment allowance had been recognised becomesuncollectible in a subsequent period, it is written off against the allowance account. Subsequent recoveries ofamounts previously written off are credited against other expenses in profit or loss.
6 Other assets
Note
30 June2018$'000
30 June2017$'000
CURRENTPrepayments 3,827 4,333Security deposits 6(a) 4,151 5,758Customer incentives 6(b) 764 893Other current assets 412 289
Total other assets - current 9,154 11,273
NON-CURRENTCustomer incentives 6(b) 1,145 1,152Prepayments 5,490 -
Total other assets - non-current 6,635 1,152
(a) Security deposits
Included in the security deposits was $4.2 million (2017: $5.8 million) relating to deposits held as security forbank guarantees.
NEXTDC Limited and controlled entities | FY18 Annual Report 57
For
per
sona
l use
onl
y

Notes to the Consolidated Financial Report30 June 2018(continued)
6 Other assets (continued)
(b) Customer incentives
Where customers are offered incentives in the form of free or discounted periods, the dollar value of the incentiveis capitalised and amortised on a straight-line basis over the life of the contract.
7 Trade and other payables
30 June2018$'000
30 June2017$'000
Trade payables 27,640 14,116Accrued capital expenditure 575 20,397Accrued expenses 2,114 1,818Other creditors 2,888 2,281
Total trade and other payables 33,217 38,612
Risk exposure
As all payables are in Australian dollars, management does not believe there are any significant risks in relationto these financial liabilities. Refer to Note 14 for details of the Group’s financial risk management policies.
Recognition and measurement
Trade and other payables, including accruals, are recorded when the Group is required to make future paymentsas a result of purchases of assets or services. Trade and other payables are financial liabilities initially recognisedat fair value and carried at amortised cost using the effective interest method.
8 Other liabilities
30 June2018$'000
30 June2017$'000
CURRENTOther liabilities 2,960 4,400
(a) Other liabilities
Included in other liabilities are payments received from customers in advance of services and in somecircumstances, potential overpayments from customers. If the overpayments or credits relating to future servicesare not expected to be used by customers in the ordinary course of business, NEXTDC may settle the liability byrepaying the excess amount.
9 Available-for-sale financial assets
30 June2018$'000
30 June2017$'000
Non-current assetsListed securities
Equity securities 62,523 -62,523 -
NEXTDC Limited and controlled entities | FY18 Annual Report 58
For
per
sona
l use
onl
y
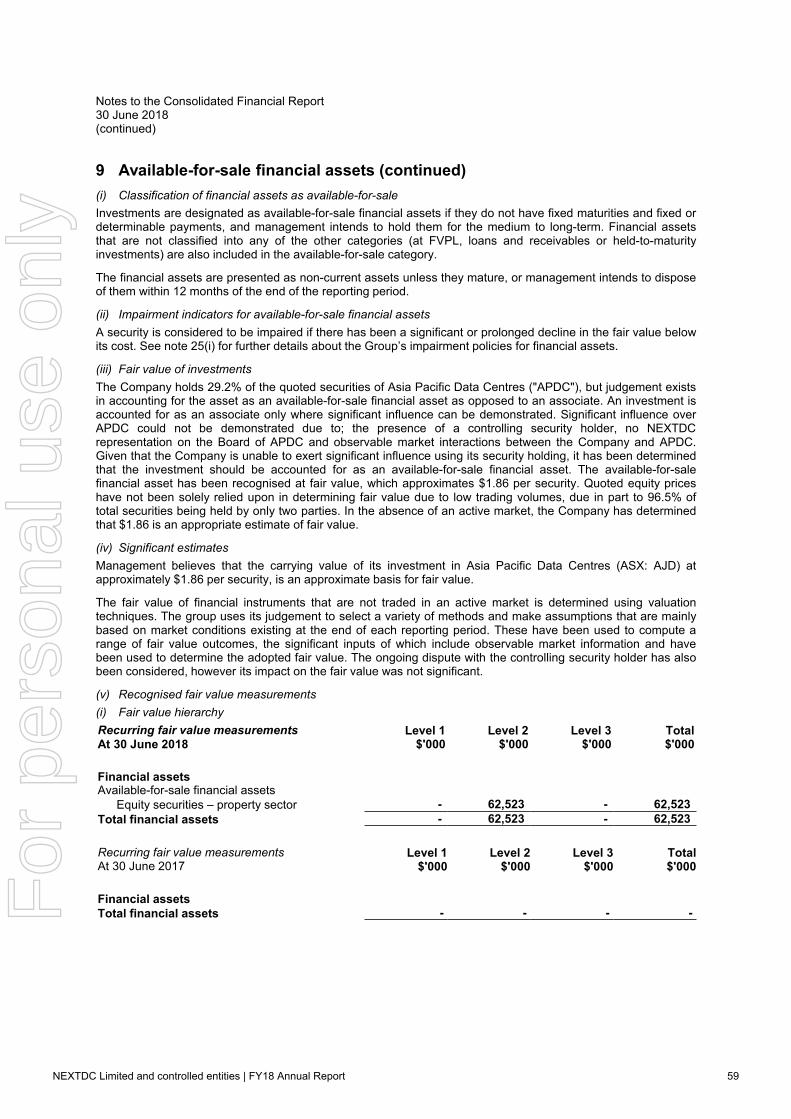
Notes to the Consolidated Financial Report30 June 2018(continued)
9 Available-for-sale financial assets (continued)
(i) Classification of financial assets as available-for-sale
Investments are designated as available-for-sale financial assets if they do not have fixed maturities and fixed ordeterminable payments, and management intends to hold them for the medium to long-term. Financial assetsthat are not classified into any of the other categories (at FVPL, loans and receivables or held-to-maturityinvestments) are also included in the available-for-sale category.
The financial assets are presented as non-current assets unless they mature, or management intends to disposeof them within 12 months of the end of the reporting period.
(ii) Impairment indicators for available-for-sale financial assets
A security is considered to be impaired if there has been a significant or prolonged decline in the fair value belowits cost. See note 25(i) for further details about the Group’s impairment policies for financial assets.
(iii) Fair value of investments
The Company holds 29.2% of the quoted securities of Asia Pacific Data Centres ("APDC"), but judgement existsin accounting for the asset as an available-for-sale financial asset as opposed to an associate. An investment isaccounted for as an associate only where significant influence can be demonstrated. Significant influence overAPDC could not be demonstrated due to; the presence of a controlling security holder, no NEXTDCrepresentation on the Board of APDC and observable market interactions between the Company and APDC.Given that the Company is unable to exert significant influence using its security holding, it has been determinedthat the investment should be accounted for as an available-for-sale financial asset. The available-for-salefinancial asset has been recognised at fair value, which approximates $1.86 per security. Quoted equity priceshave not been solely relied upon in determining fair value due to low trading volumes, due in part to 96.5% oftotal securities being held by only two parties. In the absence of an active market, the Company has determinedthat $1.86 is an appropriate estimate of fair value.
(iv) Significant estimates
Management believes that the carrying value of its investment in Asia Pacific Data Centres (ASX: AJD) atapproximately $1.86 per security, is an approximate basis for fair value.
The fair value of financial instruments that are not traded in an active market is determined using valuationtechniques. The group uses its judgement to select a variety of methods and make assumptions that are mainlybased on market conditions existing at the end of each reporting period. These have been used to compute arange of fair value outcomes, the significant inputs of which include observable market information and havebeen used to determine the adopted fair value. The ongoing dispute with the controlling security holder has alsobeen considered, however its impact on the fair value was not significant.
(v) Recognised fair value measurements
(i) Fair value hierarchy
Recurring fair value measurementsAt 30 June 2018
Level 1$'000
Level 2$'000
Level 3$'000
Total$'000
Financial assetsAvailable-for-sale financial assets
Equity securities – property sector - 62,523 - 62,523
Total financial assets - 62,523 - 62,523
Recurring fair value measurementsAt 30 June 2017
Level 1$'000
Level 2$'000
Level 3$'000
Total$'000
Financial assetsTotal financial assets - - - -
NEXTDC Limited and controlled entities | FY18 Annual Report 59
For
per
sona
l use
onl
y

Notes to the Consolidated Financial Report30 June 2018(continued)
9 Available-for-sale financial assets (continued)
(v) Recognised fair value measurements (continued)
(i) Fair value hierarchy (continued)
Level 1: The fair value of financial instruments traded in active markets (such as publicly traded securities in aliquid market) is based on quoted market prices at the end of the reporting year. The quoted market price usedfor financial assets held by the Group is the current bid price. These instruments are included in level 1.
Level 2: The fair value of financial instruments that are not traded in an active market (for example,over-the-counter derivatives or thinly traded securities) is determined using valuation techniques which maximisethe use of observable market data and rely as little as possible on entity-specific estimates. If all significant inputsrequired to fair value an instrument are observable, the instrument is included in level 2.
Level 3: If one or more of the significant inputs is not based on observable market data, the instrument isincluded in level 3. This is the case for unlisted equity securities.
10 Property, plant and equipment
Movements
Assets in thecourse of
construction$'000
Land andbuildings
$'000
Plant andmachinery
$'000
Computerequipment
$'000
Officefurniture and
equipment$'000
Total$'000
30 June 2018Opening net bookamount 135,812 15,659 277,115 4,957 724 434,267Additions 277,279 - 1,098 195 45 278,617Depreciationcharge - (1,798) (26,813) (2,363) (275) (31,249)Disposal - - (79) (827) (35) (941)Transfers (320,036) 189,120 124,308 5,854 754 -Transfersbetween classes - - - (744) - (744)Closing net bookamount 93,055 202,981 375,629 7,072 1,213 679,950
Cost 93,055 207,537 460,356 12,891 1,999 775,838Accumulateddepreciation - (4,556) (84,727) (5,819) (786) (95,888)
Net book amount 93,055 202,981 375,629 7,072 1,213 679,950
30 June 2017Opening net bookamount 62,859 16,146 217,127 5,695 919 302,746Additions 153,809 - 22 185 13 154,029Depreciationcharge - (487) (19,390) (2,248) (226) (22,351)Disposal (157) - - - - (157)Transfers (80,699) - 79,356 1,325 18 -Closing net bookamount 135,812 15,659 277,115 4,957 724 434,267
Cost or fair value 135,812 18,420 338,005 11,062 1,800 505,099Accumulateddepreciation - (2,761) (60,890) (6,105) (1,076) (70,832)
Net book amount 135,812 15,659 277,115 4,957 724 434,267
NEXTDC Limited and controlled entities | FY18 Annual Report 60
For
per
sona
l use
onl
y

Notes to the Consolidated Financial Report30 June 2018(continued)
10 Property, plant and equipment (continued)
LEASED ASSETS
Buildings include the following amounts where the Group is a lessee under a finance lease:
30 June2018$'000
30 June2017$'000
Buildings – at cost 7,665 7,665Accumulated depreciation (2,595) (2,213)
Net book amount 5,070 5,452
(a) Property, plant and equipment
Land and buildings are shown at historical cost less any accumulated depreciation and any accumulatedimpairment losses.
Property, plant and equipment is stated at historical cost less depreciation. Historical cost includes expenditurethat is directly attributable to the acquisition of the items.
Subsequent costs are included in the asset's carrying amount or recognised as a separate asset, as appropriate,only when it is probable that future economic benefits associated with the item will flow to the Group and the costof the item can be measured reliably. The carrying amount of any component accounted for as a separate assetis derecognised when replaced. All other repairs and maintenance are charged to profit or loss during thereporting year in which they are incurred.
Depreciation on other assets is calculated using the straight-line method to allocate their cost, net of their residualvalues, over their estimated useful lives or, in the case of leasehold improvements and certain leased plant andequipment, the lease term (if shorter) as follows:
Category Useful lifeLeasehold building 20 yearsPlant and machinery 2-25 yearsComputer equipment 1-15 yearsOffice furniture and equipment 5-10 years
The assets' residual values and useful lives are reviewed, and adjusted if appropriate, at the end of eachreporting year.
An asset’s carrying amount is written down immediately to its recoverable amount if the asset’s carrying amountis greater than its estimated recoverable amount. Gains and losses on disposals are determined by comparingproceeds with carrying amount. These are included in the Consolidated Statement of Comprehensive Income.
(b) Leases
Leases of property, plant and equipment where the Group, as lessee, has substantially all the risks and rewardsof ownership are classified as finance leases. Finance leases are capitalised at the lease’s inception at the fairvalue of the leased property or, if lower, the present value of the minimum lease payments. The correspondingrental obligations, net of finance charges, are included in payables. Each lease payment is allocated between theliability and finance cost. The finance cost is charged to the profit or loss over the lease period so as to produce aconstant periodic rate of interest on the remaining balance of the liability for each period. The property, plant andequipment acquired under finance leases is depreciated over the asset’s useful life or over the shorter of theasset’s useful life and the lease term if there is no reasonable certainty that the Group will obtain ownership at theend of the lease term.
NEXTDC Limited and controlled entities | FY18 Annual Report 61
For
per
sona
l use
onl
y

Notes to the Consolidated Financial Report30 June 2018(continued)
10 Property, plant and equipment (continued)
(b) Leases (continued)
Leases in which a significant portion of the risks and rewards of ownership are not transferred to the Group aslessee are classified as operating leases (Note 16). Payments made under operating leases (net of anyincentives received from the lessor) are charged to profit or loss on a straight-line basis over the year of thelease.
11 Intangible assets
30 June2018$'000
30 June2017$'000
Rights and licences 13 43Internally generated software 6,385 442Software under development 6,509 8,053
Total intangible assets 12,907 8,538
Movements
Rights andlicenses
$'000
Internallygenerated
software$'000
Softwareunder
development$'000
Total$'000
30 June 2018Opening net book amount at 1 July 2017 43 442 8,053 8,538Additions – externally acquired 13 - 5,253 5,266Additions – internally developed - - 1,256 1,256Amortisation (43) (1,746) - (1,789)Transfers - 7,563 (7,563) -Transfers between classes - 744 - 744Disposals - (618) (490) (1,108)
Closing net book amount 13 6,385 6,509 12,907
At 30 June 2018Cost 104 9,555 6,509 16,168Accumulated amortisation (91) (3,170) - (3,261)
Net book amount 13 6,385 6,509 12,907
30 June 2017Opening net book amount at 1 July 2016 58 901 3,335 4,294Additions – externally acquired - - 4,053 4,053Additions – internally developed - - 1,179 1,179Amortisation (15) (973) - (988)Transfers - 514 (514) -
Closing net book amount 43 442 8,053 8,538
At 30 June 2017Cost 91 1,866 8,053 10,010Accumulated amortisation (48) (1,424) - (1,472)
Net book amount 43 442 8,053 8,538
NEXTDC Limited and controlled entities | FY18 Annual Report 62
For
per
sona
l use
onl
y

Notes to the Consolidated Financial Report30 June 2018(continued)
11 Intangible assets (continued)
(a) Intangible assets
RIGHTS AND LICENCES
Certain licences that NEXTDC possesses have an indefinite useful life and are carried at cost less impairmentlosses and are subject to impairment review at least annually and whenever there is an indication that it may beimpaired.
Other licences that NEXTDC acquires are carried at cost less accumulated amortisation and accumulatedimpairment losses. Amortisation is recognised on a straight-line basis over the estimated useful life. Theestimated useful life and amortisation method are reviewed at the end of each annual reporting period.
INTERNALLY GENERATED SOFTWARE
Internally developed software is capitalised at cost less accumulated amortisation. Amortisation is calculatedusing the straight-line basis over the asset’s useful economic life which is generally two to three years. Theiruseful lives and potential impairment are reviewed at the end of each financial year.
SOFTWARE UNDER DEVELOPMENT
Costs incurred in developing products or systems and costs incurred in acquiring software and licenses that willcontribute to future period financial benefits through revenue generation and/or cost reduction are capitalised tosoftware and systems. Costs capitalised include external direct costs of materials and services and employeecosts.
Assets in the course of construction include only those costs directly attributable to the development phase andare only recognised following completion of technical feasibility and where the Group has an intention and abilityto use the asset.
NEXTDC Limited and controlled entities | FY18 Annual Report 63
For
per
sona
l use
onl
y

Notes to the Consolidated Financial Report30 June 2018(continued)
Capital and financial risk management
12 Capital risk management
The Group's objectives when managing capital are to safeguard its ability to continue as a going concern, so thatit can continue to provide returns for shareholders and benefits for stakeholders and to maintain an optimalcapital structure to reduce the cost of capital.
In future, the Directors may pursue funding options such as debt, sale and leaseback of assets, additional equityand various other funding mechanisms as appropriate in order to undertake its projects and deliver optimumshareholders’ return.
The Group intends to maintain a gearing ratio appropriate for a company of its size and growth.
30 June2018$'000
30 June2017$'000
Total borrowings 304,146 302,306Less: cash, cash equivalents and term deposits (417,982) (271,838)Net debt (surplus cash) (113,836) 30,468
Total equity 893,977 506,534Total capital 780,141 537,002
Gearing ratio -% 6.0%
The Group manages its capital structure by regularly reviewing its gearing ratio to ensure it maintains anappropriate level of gearing within facility covenants. This ratio is calculated as net debt divided by total capital.Net debt is calculated as total interest bearing financial liabilities, less cash and cash equivalents and termdeposits. Total capital is calculated as equity, as shown in the Consolidated Balance Sheet, plus net debt.
13 Contributed equity
(a) Share capital
Note
30 June2018
Number ofShares
30 June2018
$
30 June2017
Number ofShares
30 June2017
$
Fully paid ordinary shares 13(c) 342,252,120 904,247,017 284,197,434 524,458,284Treasury shares - LFSP 13(e) 861,813 1,851,502 2,769,602 6,202,000Treasury shares - EST 21,608 165,000 - -Total share capital 343,135,541 906,263,519 286,967,036 530,660,284
NEXTDC Limited and controlled entities | FY18 Annual Report 64
For
per
sona
l use
onl
y

Notes to the Consolidated Financial Report30 June 2018(continued)
13 Contributed equity (continued)
(b) Movements in ordinary share capital
Date Details NotesNumber of
shares $'000
Opening balance 247,784,282 382,48414 September 2016 Issue of capital - institutional investors (c) 39,182,754 150,48414 September 2016 Transaction costs - (4,737)
Conversion of loan funded shares (e) 411,428 776Adjustment from loan funded shares (e) (411,428) (776)
30 June 2017 Deferred tax credit recognised directly in equity - 2,429Sub-total 286,967,036 530,660
Less shares held by NEXTDC Share Plan Pty Ltd (e) (2,769,602) (6,202)30 June 2017 Balance 284,197,434 524,458
Date Details NoteNumber of
shares $'000
Opening balance 286,967,036 530,66014 September 2017 Conversion of rights to shares (d) 1,273,812 1,38723 April 2018 Issue of capital - institutional investors (c) 21,581,399 146,96923 April 2018 Issue of capital - institutional investor (c) 21,489,972 150,00022 May 2018 Issue of capital - share purchase plan (c) 11,801,714 80,370
Transaction costs - (4,460)30 June 2018 Deferred tax credit recognised directly in equity - 1,338
Conversion of loan funded shares (e) 1,907,789 4,350Adjustment from loan funded shares (e) (1,907,789) (4,350)Sub-total 343,113,933 906,264
Less shares held by NEXTDC Share Plan PtyLtd (1,852)Less shares held by NEXTDC Employee SharePlan Trust
(e) (861,813)
(g) (21,608) (165)30 June 2018 Balance 342,230,512 904,247
(c) Ordinary shares
On 23 April 2018, the Group issued 21,581,399 ordinary shares to institutional investors, and 21,489,972ordinary shares to an institutional investor at an average price of $6.81 and $6.98 respectively. On 22 May 2018,the Group issued an additional 11,801,714 ordinary shares under the Share Purchase Plan for a price of $6.81per share.
Ordinary shares entitle the holder to participate in dividends and the proceeds on winding up of the Group inproportion to the number of and amounts paid on the shares held. On a show of hands every holder of ordinaryshares present at a meeting in person or by proxy, is entitled to one vote, and upon a poll each share is entitledto one vote.
Ordinary shares have no par value and the Group does not have a limited amount of authorised capital.
NEXTDC Limited and controlled entities | FY18 Annual Report 65
For
per
sona
l use
onl
y

Notes to the Consolidated Financial Report30 June 2018(continued)
13 Contributed equity (continued)
(d) Performance Rights
Performance Rights, which subject to satisfaction of a performance hurdle, give rise to an entitlement to the valueof an ordinary share in NEXTDC Limited. The Board has discretion to determine if the value will be provided inshares, cash or a combination of shares and cash. The Board determined that 100% of the FY15 LTI would vestin shares, with 1,273,812 shares issued to employees on 14 September 2017.
(e) Loan funded share plan
The Group operates a Loan Funded Share Plan remuneration scheme to attract and retain key employees. Thearrangement involves the issue of shares to NEXTDC Share Plan Pty Ltd, whose sole purpose is to hold sharesas trustee for its beneficiaries (its participants). The participants are required to meet service requirements beforebeing entitled to access these shares.
Further, the participants are required to repay the loan to the subsidiary in order to access the shares.Consequently, until such time that the participants repay the loan, there is no flow of cash to the Group.
Due to the structure of the plan, in particular the use of a limited recourse loan, the Accounting Standards requirethat grants be treated the same as the issue of an option and do not permit the recognition of a loan balance.
The fair value at grant date of the shares was determined using either a Black-Scholes or binomial option pricingmodel that takes into account the exercise price, the term of the option, the impact of dilution, the share price atgrant date and expected price volatility of the underlying share, the expected dividend yield and the risk-freeinterest rate for the term of the loan. The assessed fair value is recognised as share-based payments.
The 861,813 (2017: 2,769,602) ordinary shares on issue at the end of the year are subject to dealing restrictionsuntil the loan is repaid. Due to the loan being limited recourse, equity contributions are recognised on receipt ofloan repayments. Loan repayments of $4,349,998 were received during the year (2017: $776,249).
30 June2018
30 June2017
Number of loan-funded shares held by key management personnel - 1,768,093Number of shares held by other staff - 139,696Shares held by the Trust but not allocated 861,813 861,813
Total number of loan-funded shares 861,813 2,769,602
(f) Dividend reinvestment plan
The Group does not have a dividend reinvestment plan in place.
(g) Other equity
Note2018
Shares2017
Shares
30 June2018$'000
30 June2017$'000
Treasury shares (g)(i) (21,608) - (165) -
(21,608) - (165) -
(i) Treasury shares
Treasury shares are shares in NEXTDC Limited that are held by the NEXTDC Employee Share Plan Trust for thepurpose of issuing shares under the NEXTDC Limited Employee share scheme and the executive short-termincentive (STI) and long-term incentive (LTI) schemes. Shares issued to employees are recognised on afirst-in-first-out basis.
NEXTDC Limited and controlled entities | FY18 Annual Report 66
For
per
sona
l use
onl
y

Notes to the Consolidated Financial Report30 June 2018(continued)
13 Contributed equity (continued)
(g) Other equity (continued)
(i) Treasury shares (continued)
Details Number of shares $'000
Balance 30 June 2017 - -Acquisition of shares by the Trust (21,608) (165)
Balance 30 June 2018 (21,608) (165)
14 Financial risk management
The Group’s activities expose it to a variety of financial risks: market risk (including interest rate risk and pricerisk), credit risk and liquidity risk. The Group's overall risk management program focuses on the unpredictability offinancial markets and seeks to minimise potential adverse effects on the financial performance of the Group.
At 30 June 2018, NEXTDC had an undrawn A$300 million Syndicated Senior Secured Debt Facility.
The Group’s purchases are predominantly conducted in Australian dollars. Overall, management assesses theGroup’s exposure to financial risk as low. However, the Group does have a financial risk management program inplace.
The Group holds the following financial instruments:
30 June2018$'000
30 June2017$'000
FINANCIAL ASSETSCash and cash equivalents 417,982 271,838Term deposits - 96,500Trade and other receivables 37,086 16,215Available-for-sale financial assets 62,523 -
Total financial assets 517,591 384,553
FINANCIAL LIABILITIESTrade and other payables 33,217 38,612Unsecured notes 298,104 295,973Finance lease liabilities 6,042 6,332
Total financial liabilities 337,363 340,917
(a) Market risk
Market risk is the risk that the fair value or future cash flows of a financial instrument will fluctuate because ofchanges in market prices. Market risk comprises three types of risk: foreign exchange risk, price risk and interestrate risk.
(i) Foreign exchange risk
The Group currently only operates in Australia and its purchases are predominantly conducted in Australiandollars. Consequently, management has determined that the Group has little exposure to foreign exchange risk.On this basis, the Group does not have any active risk mitigation strategies in relation to foreign exchange risk.
(ii) Price risk
The Group's exposure to equity securities price risk arises from investments held by the Group and classified inthe Consolidated Balance Sheet as available-for-sale.
NEXTDC Limited and controlled entities | FY18 Annual Report 67
For
per
sona
l use
onl
y

Notes to the Consolidated Financial Report30 June 2018(continued)
14 Financial risk management (continued)
(a) Market risk (continued)
(iii) Cash flow and fair value interest rate risk
The Group’s main interest rate risk arises from its various fixed-rate term deposits and its senior debt facility(refer to Note 15(b)) which remained undrawn at 30 June 2018.
The interest rate for the Group’s Notes III unsecured notes and finance lease liability are fixed consequently theinterest rate risk in relation to these instruments is limited.
SENSITIVITY
At 30 June 2018, if interest rates had increased by 100 basis points or decreased by 100 basis points from theyear end rates with all other variables held constant, post-tax profit for the period would have been $2,023,144higher / $2,023,144 lower (2017: $1,857,560 higher / $1,857,560 lower), mainly as a result of higher/lowerinterest income from cash and cash equivalents and term deposits.
(b) Credit risk
Credit risk arises from cash and cash equivalents, trade receivables, other receivables and loans receivable.
(i) Cash and cash equivalents
Deposits are placed with Australian banks or independently rated parties with a minimum rating of ‘BBB+’. Toreduce exposure deposits are placed with a variety of financial institutions.
The credit quality of financial assets that are neither past due nor impaired can be assessed by reference toexternal credit ratings (if available) or to historical information about counterparty default rates:
30 June2018$'000
30 June2017$'000
CASH AT BANK AND SHORT-TERM DEPOSITSA rated - 25,000AA rated 417,981 343,337
TOTAL 417,981 368,337
In determining the credit quality of these financial assets, NEXTDC has used the long-term rating from Standard& Poor’s as of July 2018.
(ii) Trade receivables
Customer credit risk is managed subject to the Group’s established policy, procedures and control relating tocustomer credit risk management. Credit evaluations are performed on all customers. Outstanding customerreceivables are monitored regularly.
The Group aims to minimise concentration of credit risk by undertaking transactions with a large number ofcustomers. In addition, receivable balances are monitored on an ongoing basis with the intention that the Group’sexposure to bad debts is minimised. The analysis of impairment is presented in Note 5.
Revenues from data centre services of $44.4 million were derived from one customer (2017: $37.9 million fromone customer) whose revenue comprised more than 29% (2017: 32%) of total data centre services revenue.
The maximum exposure to credit risk at the end of the reporting period is the carrying value of each class of thefinancial assets mentioned above and each class of receivable disclosed in Note 5. The Group does not requirecollateral in respect of financial assets.
(c) Liquidity risk
Prudent liquidity risk management implies maintaining sufficient cash and marketable securities and theavailability of funding through an adequate amount of committed credit facilities to meet obligations when due.
NEXTDC Limited and controlled entities | FY18 Annual Report 68
For
per
sona
l use
onl
y

Notes to the Consolidated Financial Report30 June 2018(continued)
14 Financial risk management (continued)
(c) Liquidity risk (continued)
At the end of the year, the Group held no term deposits (2017: $96.5 million).
Management also actively monitors rolling forecasts of the Group’s cash and term deposits.
(i) Maturities of financial liabilities
The table below analyses the Group’s financial liabilities into relevant maturity groupings based on theircontractual maturities for all non-derivative financial liabilities.
The amounts disclosed in the table are the contractual undiscounted cash flows. Balances due within 12 monthsequal their carrying balances as the impact of discounting is not significant.
Contractual Maturities of Financial Liabilities Within 12months
Between1 and 5years
Over 5years
Totalcontractual
cashflows
Carryingamount
2018 $'000 $'000 $'000 $'000 $'000
Trade payables 27,640 - - 27,640 27,640Unsecured notes 18,750 342,000 - 360,750 298,104Lease liabilities 641 2,565 5,451 8,657 6,042
Total non-derivatives 47,031 344,565 5,451 397,047 331,786
2017Trade payables 14,116 - - 14,116 14,116Unsecured notes 18,750 360,750 - 379,500 295,973Lease liabilities 641 2,565 6,092 9,298 6,332
Total non-derivatives 33,507 363,315 6,092 402,914 316,421
The cash flows for unsecured notes assume that the early redemption options would not be exercised by theGroup.
(d) Fair value measurements
(i) Trade and other payables
Due to the short-term nature of the trade and other payables, their carrying amount is assumed to be the sameas their fair value.
(ii) Borrowings
The fair value of borrowings is disclosed in Note 15(d) and Note 15(e).
NEXTDC Limited and controlled entities | FY18 Annual Report 69
For
per
sona
l use
onl
y

Notes to the Consolidated Financial Report30 June 2018(continued)
15 Borrowings
Note
30 June2018$'000
30 June2017$'000
CURRENTFinance lease - secured 307 290
NON-CURRENTFinance lease liability 5,735 6,042Unsecured notes 15(a) 298,104 295,973
Total borrowings 303,839 302,015
Total borrowings 304,146 302,305
(a) Unsecured Notes
At 30 June 2018, the Group had $300 million in Notes III on issue, carrying an annual coupon rate of 6.25% paidsemi-annually. Although these Notes are due 9 June 2021, the Group may repay as early as 9 June 2019, andeach six months thereafter. Regardless of when Notes III is redeemed, an additional 1.5% interest will also bepayable on redemption.
In addition, the Group may at any time prior to 9 June 2019, redeem all or part of the Notes, upon not less than 7days nor more than 60 days prior notice.
(b) Bank Loan
At 30 June 2018, NEXTDC had an undrawn A$300 million Syndicated Senior Secured Debt Facility.
The Company intends to use the majority of this facility to fund future growth capital expenditure for its existingfacilities and for developments that the Company is planning.
(c) Compliance with loan covenants
The Group has complied with the financial covenants of its borrowing facilities during the 2018 financial year(2017: complied).
(d) Fair value – bank borrowings
Whilst NEXTDC has an existing $300.0 million bank facility, the facility remained undrawn as at 30 June 2018.
(e) Fair value – unsecured notes
Material differences are identified for the following borrowings:
2018 2017Carryingamount
$'000Fair value
$'000
Carryingamount
$'000Fair value
$'000
Unsecured notes 298,104 304,500 295,973 304,500
NEXTDC Limited and controlled entities | FY18 Annual Report 70
For
per
sona
l use
onl
y

Notes to the Consolidated Financial Report30 June 2018(continued)
15 Borrowings (continued)
(f) Borrowings
Borrowings are initially recognised at fair value, net of transaction costs incurred. Borrowings are subsequentlymeasured at amortised cost. Any difference between the proceeds (net of transaction costs) and the redemptionamount is recognised in profit or loss over the period of the borrowings using the effective interest method. Feespaid on the establishment of loan facilities are recognised as transaction costs of the loan to the extent that it isprobable that some or all of the facility will be drawn down. In this case, the fee is deferred until the draw downoccurs. To the extent there is no evidence that it is probable that some or all of the facility will be drawn down, thefee is capitalised as a prepayment for liquidity services and amortised over the period of the facility to which itrelates.
Items not recognised
16 Commitments
(a) Capital commitments
Capital expenditure contracted for at the end of each reporting year but not recognised as liabilities is as follows:
30 June2018$'000
30 June2017$'000
Property, plant and equipment 146,890 65,539
Total capital commitments 146,890 65,539
(b) Lease commitments: Group as lessee
(a) Non-cancellable operating leases
The Group leases its M1, S1, P1 and C1 data centres under 15-year non-cancellable operating leases in additionto various offices under non-cancellable operating leases expiring within five years. The leases have varyingterms, escalation clauses and renewal rights. The Group’s leases of M1, S1 and P1 each have consecutiveoption terms of 10 years, 10 years and 5 years (total 25 years). Further, the rent increases by CPI each year andis subject to market review on the fifth and tenth year of the lease term.
30 June2018$'000
30 June2017$'000
Within one year 19,442 17,401Later than one year but not later than 5 years 76,285 68,754Later than 5 years 115,336 102,924
Total lease commitments 211,063 189,079
Not included above are contingent rental payments which may arise annually in line with rises in the consumerprice index.
NEXTDC Limited and controlled entities | FY18 Annual Report 71
For
per
sona
l use
onl
y

Notes to the Consolidated Financial Report30 June 2018(continued)
16 Commitments (continued)
(b) Lease commitments: Group as lessee (continued)
(ii) Finance leases
The land and building of the Group’s Brisbane B1 data centre facility is currently under finance lease. The leaseperiod is for an initial term of 20 years, which can be extended with a further four 5-year options.
30 June2018$'000
30 June2017$'000
Within one year 641 641Later than one year but not later than 5 years 2,565 2,565Later than 5 years 5,451 6,092Minimum lease payments 8,657 9,298
Future finance charges (2,615) (2,966)
Recognised as a liability 6,042 6,332
The present value of finance lease liabilities is as follows:Within one year 307 290Later than one year but not later than 5 years 1,417 1,339Later than 5 years 4,318 4,703
Total finance lease liabilities 6,042 6,332
17 Contingencies
(a) Contingent assets
The Group did not have any contingent assets during the year or as at the date of this report.
(b) Contingent liabilities
The Group did not have any contingent liabilities during the year or as at the date of this report.
GUARANTEES
For information about guarantees given by entities within the Group, please refer to Note 6(a).
18 Events occurring after the reporting period
In July 2018, the Group issued a further $300 million in unsecured notes (“Notes IV”), comprising of a floatingrate tranche of $200 million priced at 3.75% over 3-month BBSW and a fixed rate tranche of $100 million at 6.0%.Notes IV is complementary to the $300 million fixed rate Notes III issued by the Company in May 2017, albeit adifferent maturity date of June 2022, compared to June 2021 for Notes III.
NEXTDC Limited and controlled entities | FY18 Annual Report 72
For
per
sona
l use
onl
y

Notes to the Consolidated Financial Report30 June 2018(continued)
Employee remuneration
19 Key management personnel
(a) Key management personnel compensation
30 June2018
$
30 June2017
$
Short-term employee benefits 5,020,373 4,633,353Post-employment benefits 170,797 157,424Long-term benefits 322,510 190,618Share-based payments 1,136,611 1,008,949
Total key management personnel compensation 6,650,291 5,990,344
ComprisingSenior Executives 5,951,791 5,426,010Non-Executive Directors 698,500 564,334
Total 6,650,291 5,990,344
Detailed remuneration disclosures are provided in the Remuneration Report.
(b) Loans to key management personnel
Except for the loans provided to key management personnel in respect of the Loan Funded Share Plan, therewere no other loans made to key management personnel during the year (2017: nil).
(c) Other transactions with key management personnel
There were no other transactions with key management personnel during the year (2017: nil).
20 Share-based payments
(a) Performance rights
The performance rights plan was established by the Board of Directors to provide long-term incentives to theGroup’s Senior Executives based on total shareholder returns (TSR) taking into account the Group’s financialand operational performance. Under the Plan, eligible participants may be granted performance rights on termsand conditions determined by the Board from time to time. Performance rights were granted during the course ofFY16, FY17 and FY18. The vesting conditions for the FY16 grant relate to TSR exceeding the All-OrdinariesAccumulation Index over the measurement period. The vesting conditions for the FY17 and FY18 grants relate toTSR exceeding the ASX 200 Accumulation Index over the measurement period. Vesting of the rights will betested on or around 30 June 2018, 2019, and 2020 respectively.
Performance rights are granted by the Company for nil consideration. The Board has discretion to determine ifthe value will be provided in shares, cash or a combination of shares and cash. Rights granted under the plancarry no dividend or voting rights.
The fair value of the rights at the date of valuation, ignoring vesting conditions, was determined to be equal to thevolume weighted-average price (VWAP) ending on the day before the grant date, less the dividends expectedover the period from the expected grant date to the completion of the measurement period. This value wasconfirmed using the Black-Scholes Option Pricing Model.
NEXTDC Limited and controlled entities | FY18 Annual Report 73
For
per
sona
l use
onl
y

Notes to the Consolidated Financial Report30 June 2018(continued)
20 Share-based payments (continued)
(a) Performance rights (continued)
30 June2018
Number ofRights
30 June2018
Average FairValue
30 June2017
Number ofRights
30 June2017
Average fairvalue
Opening balance 3,460,195 $1.26 2,616,301 $1.13Granted during the year 762,577 $3.32 887,225 $1.63Vested during the year (1,273,812) $1.09 - $0.00Forfeited during the year - $0.00 (43,331) $1.11
Closing balance 2,948,960 $1.87 3,460,195 $1.26
(b) Loan Funded Share Plan
Shares have been issued to NEXTDC Share Plan Pty Ltd, a wholly-owned subsidiary of NEXTDC Limited as partof the Group’s Loan Funded Share Plan remuneration scheme to attract and retain key employees. Thearrangement involved the issue of shares to NEXTDC Share Plan Pty Ltd, whose sole purpose is to hold sharesas trustee for its beneficiaries (its participants). The participants are required to meet service requirements beforebeing entitled to access these shares. Further, the participants are required to repay the loan to the subsidiary inorder to access the shares. Consequently, until such time that the participants repay the loan, there is no flow ofcash to the Group.
30 June2018
Number ofShares
30 June2018
AverageExercise Price
30 June2017
Number ofShares
30 June2017
AverageExercise Price
As at 1 July 1,907,789 $2.28 2,319,217 $2.21Granted during the year - - - -Settled/repaid during the year (1,907,789) $2.28 (411,428) $1.89As at 30 June (allocated to employees) - $0.00 1,907,789 $2.28
Vested and exercisable at 30 June - $0.00 1,907,789 $2.28
The total number of shares in the loan funded share plan issued to employees reconciles to the total number ofshares in the loan funded share plan on issue as follows:
30 June2018
30 June2017
Number of loan funded shares issued to employees - 1,907,789Number of loan funded shares unallocated 861,813 861,813
Total number of loan funded shares on issue 861,813 2,769,602
NEXTDC Limited and controlled entities | FY18 Annual Report 74
For
per
sona
l use
onl
y

Notes to the Consolidated Financial Report30 June 2018(continued)
20 Share-based payments (continued)
(c) Deferred shares - executives short-term incentive scheme
Under the Group’s short-term incentive (STI) scheme for FY17, executives received 67% of the annual STIachieved in cash, with 33% deferred for 12 months. Employees were able to elect whether the deferredcomponent would be delivered in cash or equity. For FY18, this will increase to 50% deferred STI. The FY17tranche of deferred rights were granted in September 2017 and will vest on or around September 2018, being 12months after the date on which they were granted. They automatically convert into one ordinary share each onvesting at an exercise price of nil. The executives do not receive any dividends and are not entitled to vote inrelation to the deferred shares during the vesting period. If an executive ceases to be employed by the Groupwithin this period, they will have 6 months from cessation of employment or the vesting date (whichever is later)to exercise the deferred share right. Any rights not exercised within this period will automatically lapse.
The number of rights to be granted was determined based on the currency value of the achieved STI divided bythe volume weighted-average price at which the Company’s shares were traded on the Australian SecuritiesExchange over the 10 days following the release of the Group's FY17 results, being $4.62.
2018 2017
Number of rights to deferred shares granted 95,103 -
(d) Expenses arising from share-based payment transactions
Total expenses arising from share-based payment transactions recognised during the year as part of employeebenefit expense were as follows:
30 June2018$'000
30 June2017$'000
Loan funded shares - 18Performance rights 1,798 1,438Shares issued under employee share scheme 165 -
Total expenses arising from share-based payment transactions 1,963 1,456
NEXTDC Limited and controlled entities | FY18 Annual Report 75
For
per
sona
l use
onl
y

Notes to the Consolidated Financial Report30 June 2018(continued)
Other
21 Income tax
Income tax expense
30 June2018$'000
30 June2017$'000
Current taxCurrent tax on profits for the year 3,935 4,424Under / (over) provision in prior years (63) -
Sub-total 3,872 4,424
Deferred income taxDecrease / (increase) in deferred tax assets less deferred tax credited to equity 707 (14,368)(Decrease) in deferred tax liabilities (327) (228)
Sub-total 380 (14,596)
Income tax expense is attributable to:Profit from continuing operations 4,252 (10,172)
Profit from continuing operations 4,252 (10,172)
Numerical reconciliation of income tax expense to prima facie tax payable
30 June2018$'000
30 June2017$'000
Profit from continuing operations before income tax expense 10,891 12,827Tax credit at the Australian tax rate of 30% 3,267 3,848
Tax effect of amounts which are not deductible (taxable)in calculating taxable income:Non-deductible expenses 79 18Share-based payments 589 437Recognition of previously unrecognised timing differences - (1,851)Recognition of unused tax losses as a tax benefit - (12,624)Non-deductible borrowing expense write-off 337 -Adjustments for current tax of prior periods (63) -Sundry items 43 -
Income tax expense 4,252 (10,172)
(15,143) (2,655)
Income tax
The income tax expense or revenue for the period is the tax payable on the current period’s taxable incomebased on the applicable income tax rate in Australia adjusted by changes in deferred tax assets and liabilitiesattributable to temporary differences and to unused tax losses.
The current income tax charge is calculated on the basis of the tax laws enacted or substantively enacted at theend of the reporting period in Australia. Management periodically evaluates positions taken in tax returns withrespect to situations in which applicable tax regulation is subject to interpretation. It establishes provisions whereappropriate on the basis of amounts expected to be paid to the tax authorities.
NEXTDC Limited and controlled entities | FY18 Annual Report 76
For
per
sona
l use
onl
y

Notes to the Consolidated Financial Report30 June 2018(continued)
21 Income tax (continued)
Income tax (continued)
Deferred income tax is provided in full, using the liability method, on temporary differences arising between thetax bases of assets and liabilities and their carrying amounts in the financial statements. However, deferred taxliabilities are not recognised if they arise from the initial recognition of goodwill. Deferred income tax is also notaccounted for if it arises from initial recognition of an asset or liability in a transaction other than a businesscombination that at the time of the transaction affects neither accounting nor taxable profit or loss. Deferredincome tax is determined using tax rates (and laws) that have been enacted or substantially enacted by the endof the reporting period and are expected to apply when the related deferred income tax asset is realised or thedeferred income tax liability is settled.
Deferred tax assets are recognised for deductible temporary differences and unused tax losses only if it isprobable that future taxable amounts will be available to utilise those temporary differences and losses.
Deferred tax assets and liabilities are offset when there is a legally enforceable right to offset current tax assetsand liabilities and when the deferred tax balances relate to the same taxation authority. Current tax assets andtax liabilities are offset where the Group has a legally enforceable right to offset and intends either to settle on anet basis, or to realise the asset and settle the liability simultaneously.
Current and deferred tax is recognised in profit or loss, except to the extent that it relates to items recognised inother comprehensive income or directly in equity. In this case, the tax is also recognised in other comprehensiveincome or directly in equity, respectively.
NEXTDC Limited and controlled entities | FY18 Annual Report 77
For
per
sona
l use
onl
y

Notes to the Consolidated Financial Report30 June 2018(continued)
22 Deferred tax
(a) Deferred tax assets
30 June2018$'000
30 June2017$'000
The balance comprises temporary differences attributable to:Tax losses 4,328 8,200Black-hole expenditure deductible in future years 2,555 2,159Finance lease provisions 1,813 1,900Employee benefits 1,626 1,296Borrowing costs - 253Provisions for doubtful debts 376 73Expenses deductible in future years 172 166Revenue received in advance 919 983
Total deferred tax assets 11,789 15,030
Set-off of deferred tax liabilities pursuant to set-off provisions (Note 22(b)) (2,102) (2,429)
Net deferred tax assets 9,687 12,601
(b) Deferred tax liabilities
30 June2018$'000
30 June2017$'000
The balance comprises temporary differences attributable to:Accrued interest 8 180Finance lease asset 1,521 1,636Customer incentives 573 613
Total deferred tax liabilities 2,102 2,429
Set-off of deferred tax liabilities pursuant to set-off provisions (Note 22(a)) (2,102) (2,429)
Net deferred tax liabilities - -
NEXTDC Limited and controlled entities | FY18 Annual Report 78
For
per
sona
l use
onl
y

Notes to the Consolidated Financial Report30 June 2018(continued)
23 Cash flow information
(a) Reconciliation of profit after income tax to net cash inflow from operating activities
30 June2018$'000
30 June2017$'000
Profit for the year after income tax 6,639 22,784Depreciation and amortisation 33,038 23,339Non-cash employee benefits expense share-based payments 1,798 1,456Net (gain) loss on disposal of non-current assets 280 -
CHANGE IN OPERATING ASSETS AND LIABILITIES(Increase) / decrease in trade debtors (19,197) 1,778(Increase) / decrease in prepayments and other current assets (2,431) 561(Increase) / decrease in interest receivable 573 (495)(Increase) / decrease in cash used in bank guarantee 1,607 (1,694)(Increase) / decrease in other assets (301) 197(Increase) / decrease in GST 589 (409)(Increase) / decrease in deferred tax assets 4,252 (9,957)Decrease / (increase) in customer incentives 136 872Decrease / (increase) in trade payables 1,920 (723)Decrease / (increase) in other operating liabilities (479) 953Decrease / (increase) in employee entitlements 1,655 1,073Decrease / (increase) in interest payable 3,311 5,190
Net cash inflow from operating activities 33,390 44,925
(b) Net debt reconciliation
Net debt
30 June2018$'000
30 June2017$'000
Cash and cash equivalents 417,982 271,838Borrowings - repayable within one year (including overdraft) (307) (290)Borrowings - repayable after one year (303,839) (302,016)Net debt 113,836 (30,468)
Cash and liquid investments 417,982 271,838Gross debt - fixed interest rates (304,146) (302,306)Net debt 113,836 (30,468)
NEXTDC Limited and controlled entities | FY18 Annual Report 79
For
per
sona
l use
onl
y

Notes to the Consolidated Financial Report30 June 2018(continued)
23 Cash flow information (continued)
(b) Net debt reconciliation (continued)
Otherassets Liabilities from financing activities
Cash$'000
Financeleases due
within1 year$'000
Financeleases
due after1 year$'000
Borrow.due after 1
year$'000
Total$'000
Net debt as at 1 July 2016 191,393 - (6,606) (159,547) 25,240Cash flows 80,445 274 - (134,352) (53,633)Other non-cash movements - (274) 274 (2,075) (2,075)
Net debt as at 30 June 2017 271,838 - (6,332) (295,974) (30,468)
Cash flows 146,144 290 - - 146,434Other non-cash movements - (290) 290 (2,130) (2,130)
Net debt as at 30 June 2018 417,982 - (6,042) (298,104) 113,836
24 Remuneration of auditors
During the year the following fees were paid or payable for services provided by the auditor of the parent entity,its related practices and non-related audit firms:
(a) PwC Australia
2018$
2017$
AUDIT AND OTHER ASSURANCE SERVICESAudit and review of financial statements 265,490 224,400Other assurance services
Other assurance services 47,504 -
Total remuneration for audit and other assurance services 312,994 224,400
TAXATION SERVICESTax compliance services 16,710 15,710
Total remuneration of PwC Australia 329,704 240,110
(b) Related practices of PwC Australia
No other remuneration was provided to any related practices of PwC Australia.
(c) Non-PwC audit firms
NEXTDC Limited did not engage with any other non-PwC audit firms.
NEXTDC Limited and controlled entities | FY18 Annual Report 80
For
per
sona
l use
onl
y

Notes to the Consolidated Financial Report30 June 2018(continued)
25 Summary of significant accounting policies
The principal accounting policies adopted in the preparation of these consolidated financial statements are setout below. These policies have been consistently applied to all the years presented, unless otherwise stated. Thefinancial statements are for the consolidated entity consisting of NEXTDC Limited and its subsidiaries. NEXTDCis a public company limited by shares, incorporated and domiciled in Australia.
(a) Reporting Period and Comparative information
These financial statements cover the period 1 July 2017 to 30 June 2018. The comparative reporting period is 1July 2016 to 30 June 2017.
(b) Basis of preparation
This general purpose financial report has been prepared in accordance with Australian Accounting Standardsand interpretations issued by the Australian Accounting Standards Board and the Corporations Act 2001.NEXTDC Limited is a for-profit entity for the purpose of preparing the financial statements.
(i) Compliance with IFRS
The consolidated financial statements of the NEXTDC Group also comply with International Financial ReportingStandards (IFRS) as issued by the International Accounting Standards Board (IASB).
The consolidated financial statements were authorised for issue by the Board of Directors on the date theDirectors' Report is signed. The Directors have the power to amend and reissue the financial statements.
(ii) New and amended standards adopted by the group
None of the new standards and amendments to standards that are mandatory for the first time for the financialyear beginning 1 July 2017 affected any of the amounts recognised in the current period or any prior period andare not likely to affect future periods.
(iii) Early adoption of standards
The Group has not elected to apply any pronouncements before their operative date in the annual reportingperiod beginning 1 July 2017.
(iv) Historical cost convention
These financial statements have been prepared under the historical cost convention.
(c) Critical accounting estimates
Estimates and judgements are continually evaluated and are based on historical experience and other factors,including expectations of future events that may have a financial impact on the entity and that are believed to bereasonable under the circumstances.
This note provides an overview of the areas that involved a higher degree of judgement or complexity, and ofitems which are more likely to be materially adjusted due to estimates and assumptions turning out to be wrong.
This note provides an overview of the areas that involved a higher degree of judgement or complexity, and ofitems which are more likely to be materially adjusted due to estimates and assumptions turning out to be wrong.
NEXTDC Limited and controlled entities | FY18 Annual Report 81
For
per
sona
l use
onl
y

Notes to the Consolidated Financial Report30 June 2018(continued)
25 Summary of significant accounting policies (continued)
(c) Critical accounting estimates (continued)
(i) Fair value of investments
The Company holds 29.2% of the quoted securities of Asia Pacific Data Centres ("APDC"), but judgement existsin accounting for the asset as an available-for-sale financial asset as opposed to an associate. An investment isaccounted for as an associate only where significant influence can be demonstrated. Significant influence overAPDC could not be demonstrated due to; the presence of a controlling security holder, no NEXTDCrepresentation on the Board of APDC and observable market interactions between the Company and APDC.Given that the Company is unable to exert significant influence using its security holding, it has been determinedthat the investment should be accounted for as an available-for-sale financial asset. The available-for-salefinancial asset has been recognised at fair value, which approximates $1.86 per security. Quoted equity priceshave not been solely relied upon in determining fair value due to low trading volumes, due in part to 96.5% oftotal securities being held by only two parties. In the absence of an active market, the Company has determinedthat $1.86 is an appropriate estimate of fair value.
(ii) Deferred taxation
Full provision is made for deferred taxation at the prevailing tax rates at the year-end dates. Deferred tax assetsare recognised where it is considered probable that they will be recovered in the future and, as such, aresubjective. The deferred tax assets include an amount of $4.3 million which relates to carried forward tax lossesof NEXTDC Limited. The Group has incurred the losses during its start-up operations and has concluded that thedeferred assets are probable of recovery using the estimated future taxable income. The tax losses can becarried forward indefinitely and have no expiry date. Refer to Notes 21 and 22 for further detail.
(iii) Income taxes
The Group is subject to income taxes in Australia. Judgement is required in determining the provision for incometaxes. There are certain transactions and calculations undertaken during the ordinary course of business forwhich the ultimate tax determination is uncertain. The Group estimates its tax liabilities based on the Group’sunderstanding of the tax law. Where the final tax outcome of these matters is different from the amounts thatwere initially recorded, such differences will impact the current and deferred income tax assets and liabilities inthe period in which such determination is made.
(iv) Lease classification
NEXTDC has classified its C1 lease and its three leases (M1, S1 and P1) with APDC Group as operating leasesafter giving consideration to the criteria outlined in AASB 117 Leases. Due to the long term nature of the leases inplace, judgement exists in their determination as operating leases.
(d) Employee Share Trust
The Group has formed two trusts to administer the Group's employee share schemes. The trusts areconsolidated, as the substance of the relationships are that the trusts are controlled by the Group. Shares held byNEXTDC Share Plan Pty Ltd and NEXTDC Employee Share Plan Trust are disclosed as treasury shares anddeducted from contributed equity.
(e) Share-based payments reserve
The share-based payments reserve is used to recognise:
• the grant date fair value of long-term incentives issued to participants• the grant date fair value of shares issued to participants• the issue of shares held by NEXTDC Share Plan Pty Ltd and NEXTDC Employee Share Plan Trust
(f) Functional and presentation currency
These consolidated financial statements are presented in Australian dollars, which is the Group’s functionalcurrency.
NEXTDC Limited and controlled entities | FY18 Annual Report 82
For
per
sona
l use
onl
y

Notes to the Consolidated Financial Report30 June 2018(continued)
25 Summary of significant accounting policies (continued)
(g) Impairment of assets
Intangible assets that have an indefinite useful life are not subject to amortisation and are tested annually forimpairment, or more frequently if events or changes in circumstances indicate that they might be impaired. Otherassets are tested for impairment whenever events or changes in circumstances indicate that the carrying amountmay not be recoverable. An impairment loss is recognised for the amount by which the asset’s carrying amountexceeds its recoverable amount. The recoverable amount is the higher of an asset’s fair value less costs to selland value in use. For the purposes of assessing impairment, assets are grouped at the lowest levels for whichthere are separately identifiable cash inflows which are largely independent of the cash inflows from other assetsor groups of assets (cash-generating units). Non-financial assets other than goodwill that suffered impairment arereviewed for possible reversal of the impairment at the end of each reporting period.
(h) Cash and cash equivalents
For the purpose of presentation in the Consolidated Statement of Cash Flows, cash and cash equivalentsincludes cash on hand, deposits held at call with financial institutions and term deposits with original maturities ofthree months or less that are readily convertible to known amounts of cash and which are subject to aninsignificant risk of changes in value.
(i) Investments and other financial assets
LOANS AND RECEIVABLES
Classification
Loans and receivables are non-derivative financial assets with fixed or determinable payments that are notquoted in an active market. They are included in current assets, except for those with maturities greater than 12months after the reporting period which are classified as non-current assets. Loans and receivables are includedin trade and other receivables in the Consolidated Balance Sheet.
Measurement
At initial recognition, the Group measures a financial asset at its fair value plus, in the case of a financial assetnot at fair value through profit or loss, transaction costs that are directly attributable to the acquisition of thefinancial asset.
Loans and receivables are subsequently carried at amortised cost using the effective interest method.
(i) Impairment
The Group assesses at the end of each reporting period whether there is objective evidence that a financial assetor group of financial assets is impaired. A financial asset or a group of financial assets is impaired andimpairment losses are incurred only if there is objective evidence of impairment as a result of one or more eventsthat occurred after the initial recognition of the asset (a ‘loss event’) and that loss event (or events) has an impacton the estimated future cash flows of the financial asset or group of financial assets that can be reliablyestimated.
ASSETS CARRIED AT AMORTISED COST
For loans and receivables, the amount of the loss is measured as the difference between the asset’s carryingamount and the present value of estimated future cash flows (excluding future credit losses that have not beenincurred) discounted at the financial asset’s original effective interest rate. The carrying amount of the asset isreduced and the amount of the loss is recognised in the Consolidated Statement of Comprehensive Income.
If, in a subsequent period, the amount of the impairment loss decreases and the decrease can be relatedobjectively to an event occurring after the impairment was recognised (such as an improvement in the debtor’scredit rating), the reversal of the previously recognised impairment loss is recognised in the ConsolidatedStatement of Comprehensive Income. Impairment testing of trade receivables is described in Note 5.
NEXTDC Limited and controlled entities | FY18 Annual Report 83
For
per
sona
l use
onl
y

Notes to the Consolidated Financial Report30 June 2018(continued)
25 Summary of significant accounting policies (continued)
(j) Trade and other payables
These amounts represent liabilities for goods and services provided to the Group prior to the end of financialperiod which are unpaid. The amounts are unsecured and are usually paid within 30 days of recognition. Tradeand other payables are presented as current liabilities unless payment is not due within 12 months from thereporting date. They are recognised initially at their fair value and subsequently measured at amortised costusing the effective interest method.
(k) Provisions
Provisions for asset replacement and make good obligations are recognised when the Group has a present legalor constructive obligation as a result of past events, it is probable that an outflow of resources will be required tosettle the obligation and the amount has been reliably estimated. Provisions are not recognised for futureoperating losses.
Where there are a number of similar obligations, the likelihood that an outflow will be required in settlement isdetermined by considering the class of obligations as a whole. A provision is recognised even if the likelihood ofan outflow with respect to any one item included in the same class of obligations may be small.
Provisions are measured at the present value of management's best estimate of the expenditure required tosettle the present obligation at the end of the reporting year. The discount rate used to determine the presentvalue is a pre-tax rate that reflects current market assessments of the time value of money and the risks specificto the liability. The increase in the provision due to the passage of time is recognised as interest expense.
(l) Employee benefits
SHORT-TERM OBLIGATIONS
Liabilities for wages and salaries, including non-monetary benefits and annual leave expected to be settled within12 months after the end of each reporting period in which the employees render the related service arerecognised in respect of employees’ services up to the end of the reporting period and are measured at theamounts expected to be paid when the liabilities are settled. The liability for annual leave is recognised inpayables.
OTHER LONG-TERM EMPLOYEE BENEFIT OBLIGATIONS
The liability for long service leave and annual leave which is not expected to be settled within 12 months after theend of the reporting period in which the employees render the related service is recognised in the provision foremployee benefits and measured as the present value of expected future payments to be made in respect ofservices provided by employees up to the end of the reporting period. Consideration is given to expected futurewage and salary levels, experience of employee departures and periods of service. Expected future paymentsare discounted using market yields at the end of the reporting period on national government bonds with terms tomaturity and currency that match, as closely as possible, the estimated future cash outflows.
SHARE-BASED PAYMENTS
Share-based compensation benefits are provided to participants via the Long Term Incentive Plan or the LoanFunded Share Plan.
The fair value of performance rights and the Loan Funded Share Plan is recognised as an employee benefitsexpense with a corresponding increase in equity. The total amount to be expensed is determined by reference tothe fair value granted, which includes any market performance conditions and the impact of any non-vestingconditions but excludes the impact of any service and non-market performance vesting conditions.
Non-market vesting conditions are included in the assumptions. The total expense is recognised over the vestingperiod, which is the period over which all of the specified vesting conditions are to be satisfied. At the end of eachperiod, the Group revises its estimates of the number of rights that are expected to vest based on the non-marketvesting conditions. It recognises the impact of the revision to original estimates, if any, in the ConsolidatedStatement of Comprehensive Income, with a corresponding adjustment to equity.
NEXTDC Limited and controlled entities | FY18 Annual Report 84
For
per
sona
l use
onl
y

Notes to the Consolidated Financial Report30 June 2018(continued)
25 Summary of significant accounting policies (continued)
(l) Employee benefits (continued)
SHARE-BASED PAYMENTS (continued)
When the loan shares are settled, the net proceeds are credited directly to equity.
RETIREMENT BENEFIT OBLIGATIONS
Except for the statutory superannuation guarantee charge, the Group does not have any other retirement benefitobligations.
(m) Rounding of amounts
The Company is of a kind referred to in ASIC Corporations (Rounding in Financial/Directors' Reports) Instrument2016/191, relating to the ‘rounding off’ of amounts in the financial statements. Amounts in the financialstatements have been rounded off in accordance with that Class Order to the nearest thousand dollars, or incertain cases, to the nearest dollar.
(n) Goods and Services Tax (GST)
Revenues, expenses and assets are recognised net of the amount of associated GST, unless the GST incurredis not recoverable from the taxation authority. In this case it is recognised as part of the cost of acquisition of theasset or as part of the expense.
Receivables and payables are stated inclusive of the amount of GST receivable or payable. The net amount ofGST recoverable from, or payable to, the taxation authority is included with other receivables or payables in theConsolidated Balance Sheet.
Cash flows are presented on a gross basis. The GST components of cash flows arising from investing orfinancing activities which are recoverable from, or payable to the taxation authority, are presented as operatingcash flows.
(o) Parent entity financial information
The financial information for the parent entity, NEXTDC Limited has been prepared on the same basis as theconsolidated financial statements.
(p) New and amended standards adopted by the Company
There are no standards, interpretations or amendments to existing standards that are effective for the first timefor the financial year beginning 1 July 2017 that have a material impact on the Group.
NEW STANDARDS AND INTERPRETATIONS NOT YET ADOPTED
A number of new standards, amendments to standards and interpretations are effective for annual periodsbeginning after 1 January 2018 and have not been applied in preparing these financial statements. Those whichmay be relevant to the Group are set out below. The Group does not plan to adopt these standards early.
AASB 16 Leases
AASB 16 Leases addresses the recognition, measurement, presentation and disclosure of leases. This standardapplies to annual reporting periods beginning on or after 1 January 2019, however the Group intends to earlyadopt AASB 16 from the reporting period beginning 1 July 2018.
The adoption of AASB 16 will result in almost all leases being recognised on the balance sheet, as the distinctionbetween operating and finance leases is removed. Under the new standard, an asset (the right to use the leaseditem) and a financial liability to pay rentals are recognised. The lease liability is measured at the present value ofthe lease payments that are not paid at the balance date, and is unwound over time using the interest rate implicitin the lease repayments. The right-of-use asset comprises the initial lease liability amount, and initial direct costsincurred when entering into the lease less any lease incentives received. The asset is depreciated over the termof the lease. The new standard replaces the company’s operating lease expense with an interest anddepreciation expense.
NEXTDC Limited and controlled entities | FY18 Annual Report 85
For
per
sona
l use
onl
y

Notes to the Consolidated Financial Report30 June 2018(continued)
25 Summary of significant accounting policies (continued)
(p) New and amended standards adopted by the Company (continued)
NEW STANDARDS AND INTERPRETATIONS NOT YET ADOPTED (continued)
AASB 16 Leases (continued)
The company has elected to apply the “Modified Retrospective Approach” when transitioning to the newstandard. Under this approach, NEXTDC will not be required to restate the comparative information for itsoperating leases, as the right-of-use asset will be brought on at the same value as the lease liability on transitiondate. For existing finance leases currently accounted for under AASB 117, there will be a revaluation of existinglease liabilities recognised in the balance sheet with a corresponding adjustment to the right of use asset.
The full assessment of the impact on the Group is ongoing, however the Group estimates adoption will have thefollowing impacts on financial results for the year ending 30 June 2019:
• A right-of-use asset of $262.6, and lease liability of $263.6 million will be recognised on 1 July 2018• Opening accumulated loss adjustment of $0.8 million will be recognised on 1 July 2018 in relation to the
lease incentives previously accounted for under AASB 117• Operating lease expense of $19.1 million will be replaced by a depreciation charge of $8.3 million for the
right-of-use asset, and an interest expense of $17.3 million on the lease liability• Profit before tax will decrease by $5.7 million and EBITDA will increase by $19.1 million.
AASB 9 Financial Instruments (2010), AASB 9 Financial Instruments (2009)
AASB 9 Financial Instruments replaces the existing guidance in AASB 139 Financial Instruments: Recognitionand Measurement, and addresses the classification, measurement and derecognition of financial assets andfinancial liabilities, introduces new rules for hedge accounting and a new impairment model for financial assets.
The Group has reviewed its financial assets and liabilities and is expecting the following impact from the adoptionof the new standard on 1 July 2018:
• The Group currently holds equity instruments classified as available-for-sale that will satisfy conditions forclassification as at fair value through other comprehensive income (FVOCI). Accordingly, the Group does notexpect the new guidance to affect the classification and measurement of these financial assets. However,any gains or losses realised on the sale of financial assets at FVOCI will no longer be transferred to profit orloss on sale, but instead reclassified below the line from the FVOCI reserve to retained earnings.
• There will be no impact on the Group’s accounting for financial liabilities, as the Group does not have anyfinancial liabilities designated at fair value through profit or loss. The derecognition rules have beentransferred from AASB 139 Financial Instruments: Recognition and Measurement and have not beenchanged.
The new impairment model requires the recognition of impairment provisions based on expected credit losses(ECL) rather than only incurred credit losses, as is the case under AASB 139. It will apply to the Group’s financialassets classified at amortised cost, and will impact the Group’s loss allowance on trade debtors. However, thenew impairment model is not expected to have a significant impact on the value of the loss provision.
AASB 15 Revenue from Contracts with Customers
In December 2014, the AASB issued AASB 15 Revenue from Contracts with Customers and AASB 2014-5Amendments to Australian Accounting Standards arising from AASB 15. In October 2015, the AASB issuedAASB 2015-8: Amendments to Australian Accounting Standards - Effective Date of AASB 15 which deferred theeffective date of the new revenue standard from 1 January 2017 to 1 January 2018. In May 2016, the AASBissued AASB 2016-3 Amendments to Australian Accounting Standards - Clarifications to AASB 15. All of thesestandards apply to the Group from 1 July 2018, and are further collectively referred to as AASB 15.
AASB 15 establishes principles for reporting the nature, amount, timing and uncertainty of revenue and cashflows arising from an entity's contracts with customers and requires application of a five-step process to identifythe contract with the customer, identify performance obligations in the contract, determine transaction price,allocate the transaction price to the performance obligations and recognise revenue when performanceobligations are satisfied.
NEXTDC Limited and controlled entities | FY18 Annual Report 86
For
per
sona
l use
onl
y

Notes to the Consolidated Financial Report30 June 2018(continued)
25 Summary of significant accounting policies (continued)
(p) New and amended standards adopted by the Company (continued)
NEW STANDARDS AND INTERPRETATIONS NOT YET ADOPTED (continued)
AASB 15 Revenue from Contracts with Customers (continued)
AASB 15 also provides guidance relating to the treatment of contract costs not included in the scope of otherstandards, such as the incremental costs of obtaining a contract.
The application of AASB 15 will not affect our cash flows from operations or the manner in which we transact withour customers.
We have substantially completed our analysis of the impact of AASB 15 on our financial results. However, we willcontinue to fully integrate the new requirements into our processes throughout the coming period.
Based on our preliminary analysis, significant changes anticipated on adoption, along with the most reliableestimates of the expected impacts, are summarised below:
• Accounting for project fees - our project fees are primarily comprised of installation services relating to acustomer’s initial deployment and professional services that we perform. Historically the Group hasrecognised revenue from project fees upfront, as the services are provided. Under AASB 15, this revenue willneed to be deferred and recognised over the term of the contract with the customer. This will result in anincrease in accumulated losses of $23.0 million on 1 July 2018, and a corresponding increase in income inadvance.
• Accounting for incremental costs of obtaining a contract - eligible costs that are expected to be recovered willbe capitalised as a contract asset and amortised over the term of the customer contract from 1 July 2018.This will result in a reduction to accumulated losses of $1.1 million on 1 July 2018, with a correspondingincrease in contract assets.
These estimates may be subject to change as we progress to fully operationalise the new requirements from 1 July 2018. Final adjustments, along with detailed disclosures will be included in our financial statements for the year ending 30 June 2019.
The Group intends to adopt the standard using the modified retrospective approach from 1 July 2018, which means that the cumulative impact of the adoption will be recognised in accumulated losses as of 1 July 2018, and that comparatives will not be restated.
(q) Assets in the course of construction
Assets in the course of construction are shown at historical cost. Historical cost includes directly attributable expenditure on data centre facilities which at reporting date, has not yet been finalised and/or ready for use. Assets in the course of construction are not depreciated.
Assets in the course of construction are transferred to property, plant and equipment upon successful testing and commissioning.
NEXTDC Limited and controlled entities | FY18 Annual Report 87
For
per
sona
l use
onl
y

Directors' Declaration30 June 2018
In the Directors' opinion:
(a) the financial statements and notes set out on pages 45 to 87 are in accordance with the Corporations Act2001, including:
(i) complying with Accounting Standards, the Corporations Regulations 2001 and other mandatoryprofessional reporting requirements, and
(ii) giving a true and fair view of the consolidated entity's financial position as at 30 June 2018 and ofits performance for the financial year ended on that date, and
(b) there are reasonable grounds to believe that the Company will be able to pay its debts as and when theybecome due and payable, and
(c) at the date of this declaration, there are reasonable grounds to believe that the Group will be able to payits debts as and when they become due and payable, and
Note 25 confirms that the financial statements also comply with International Financial Reporting Standards asissued by the International Accounting Standards Board.
The Directors have been given the declarations by the chief executive officer and chief financial officer requiredby section 295A of the Corporations Act 2001.
This declaration is made in accordance with a resolution of Directors.
Craig ScroggieManaging Director and Chief Executive Officer
Sydney31 August 2018
NEXTDC Limited and controlled entities | FY18 Annual Report 88
For
per
sona
l use
onl
y

Independent auditor’s report To the members of NEXTDC Limited
Report on the audit of the financial report
Our opinion
In our opinion:
The accompanying financial report of NEXTDC Limited (the Company) and its controlled entities (together the Group) is in accordance with the Corporations Act 2001, including:
(a) giving a true and fair view of the Group's financial position as at 30 June 2018 and of itsfinancial performance for the year then ended
(b) complying with Australian Accounting Standards and the Corporations Regulations 2001.
What we have audited The Group financial report comprises:
• the consolidated balance sheet as at 30 June 2018• the consolidated statement of comprehensive income for the year then ended• the consolidated statement of changes in equity for the year then ended• the consolidated statement of cash flows for the year then ended• the notes to the consolidated financial statements, which include a summary of significant
accounting policies• the directors’ declaration.
Basis for opinion
We conducted our audit in accordance with Australian Auditing Standards. Our responsibilities under those standards are further described in the Auditor’s responsibilities for the audit of the financial report section of our report.
We believe that the audit evidence we have obtained is sufficient and appropriate to provide a basis for our opinion.
Independence We are independent of the Group in accordance with the auditor independence requirements of the Corporations Act 2001 and the ethical requirements of the Accounting Professional and Ethical Standards Board’s APES 110 Code of Ethics for Professional Accountants (the Code) that are relevant to our audit of the financial report in Australia. We have also fulfilled our other ethical responsibilities in accordance with the Code.
PricewaterhouseCoopers, ABN 52 780 433 757 480 Queen Street, BRISBANE QLD 4000, GPO Box 150, BRISBANE QLD 4001 T: +61 7 3257 5000, F: +61 7 3257 5999, www.pwc.com.au
Liability limited by a scheme approved under Professional Standards Legislation.
NEXTDC Limited and controlled entities | FY18 Annual Report 89
For
per
sona
l use
onl
y

Our audit approach
An audit is designed to provide reasonable assurance about whether the financial report is free from material misstatement. Misstatements may arise due to fraud or error. They are considered material if individually or in aggregate, they could reasonably be expected to influence the economic decisions of users taken on the basis of the financial report.
We tailored the scope of our audit to ensure that we performed enough work to be able to give an opinion on the financial report as a whole, taking into account the geographic and management structure of the Group, its accounting processes and controls and the industry in which it operates.
Materiality Audit scope Key audit matters
• For the purpose of our audit weused overall Group materiality of$1.5 million, which representsapproximately 2.5% of theGroup’s Earnings BeforeInterest, Tax, Depreciation andAmortisation (EBITDA).
• We applied this threshold,together with qualitativeconsiderations, to determine thescope of our audit and thenature, timing and extent of ouraudit procedures and to evaluatethe effect of misstatements onthe financial report as a whole.
• We chose EBITDA because, inour view, it is the benchmarkagainst which the performance ofthe Group is most commonlymeasured.
• We utilised a 2.5% thresholdbased on our professionaljudgement, noting it is within therange of commonly acceptablethresholds.
• Our audit focused on where theGroup made subjectivejudgements; for example,significant accountingestimates involvingassumptions and inherentlyuncertain future events.
• NEXTDC has Data Centresoperating in capital cities acrossAustralia, with its financefunction based in Brisbane,where we performed most ofour audit procedures.
• Amongst other relevanttopics, we communicated thefollowing key audit matters tothe Audit and RiskCommittee:
− Quote to Cash systemreplacement,
− Carrying value ofinvestment in Asia PacificData Centre,
− Non-current assetadditions.
• These are further describedin the Key audit matterssection of our report.
NEXTDC Limited and controlled entities | FY18 Annual Report 90
For
per
sona
l use
onl
y

Key audit matters
Key audit matters are those matters that, in our professional judgement, were of most significance in our audit of the financial report for the current period. The key audit matters were addressed in the context of our audit of the financial report as a whole, and in forming our opinion thereon, and we do not provide a separate opinion on these matters. Further, any commentary on the outcomes of a particular audit procedure is made in that context.
Key audit matter How our audit addressed the key audit matter
Carrying value of investment in Asia Pacific Data Centre (Refer to note 9) $62.5m
During the year NEXTDC acquired a 29.2% stake in Asia Pacific Data Centre (APDC) for a total cost of $62.5m. APDC is also 67.3% owned by 360 Capital. NEXTDC’s investment is carried at fair value with gains or losses recognised through profit or loss.
We considered this a key audit matter because:
• the investment value is financially significant tothe balance sheet,
• judgement exists in determining the classificationof the investment, and
• the fair value of the investment is based on inputsother than quoted equity prices in an activemarket.
Our audit approach included testing the number of securities held by NEXTDC together with the cost of those securities. The following tests were performed to address key judgements:
• Assessed the level of influence able to be appliedover APDC by NEXTDC in determining whetheror not the investment should be accounted for asan associate or as an asset held for sale.
• Obtained observable market information relatingto the ASX quoted equity prices which includedtrading volumes.
• Assessed available market information madeavailable by APDC, including the financial reportand ASX releases.
Non-current asset additions Refer to notes 10 ($278.6m) and 11 ($6.5m) of the financial report
NEXTDC has recently announced investment into three new data centres in Sydney, Melbourne and Perth, and is continuing its investment into existing data centre infrastructure. In addition, NEXTDC is developing new products such as ONEDC and AXON. Each of these projects requires significant capital outlay which results in the capitalisation of external and internal costs into Property, Plant and Equipment and Intangible Assets.
During the current year, $278.6m has been capitalised as additions to Property, Plant and Equipment, while $6.5m has been capitalised to Intangible Assets.
Costs should be capitalised in line with Australian Accounting Standards which outline the criteria required for the eligibility of costs to be capitalised.
Our audit approach included the testing of individually large value additions, while the residual balance of additions were tested on a sample basis. Additional focus was paid to internal costs capitalised as these are deemed more judgemental. In particular, costs relating to salaries and wages were an area of focus.
Our testing included:
• Developing an understanding of and evaluatingthe Group’s cost capitalisation policy.
• Consideration of the processes implemented bythe Group for the measurement of capitalisedcosts.
• Testing the samples noted above to supportingdocumentation and considering whether theymeet the criteria for capitalisation with referenceto Australian Accounting Standards.
NEXTDC Limited and controlled entities | FY18 Annual Report 91
For
per
sona
l use
onl
y

Key audit matter How our audit addressed the key audit matter
Judgement is often required to determine whether the criteria for capitalisation has been met for Intangible assets, and subsequently whether certain costs or classes of transactions meet the criteria for capitalisation.
This was a key audit matter because of the:
• Significance of the additions’ balance to theConsolidated Balance Sheet,
• Judgement involved in assessing whetherinternally generated intangible assets meet thecriteria for capitalisation through reference to theappropriate accounting requirements, and
• Potential significance of the additions balance tothe Statement of Comprehensive Income shouldthe costs not meet the criteria required forcapitalisation.
Quote to Cash system replacement
As part of the Group’s growth strategy, a number of system and process enhancement programs have been implemented which included the billings system in the current year. The new Quote to Cash system, which includes billings, was effective 1 April 2018, replacing the existing system for a number of key revenue streams.
We considered this a key audit matter because:
• the billings system is used to raise invoices andcalculate revenue. Billings from this system havebeen recognised in the current year’s financialresults since the effective implementation date, and
• data migration activities were required between theexisting system and the new system and this data isused to raise invoices and calculate revenue in thenew system.
In addition to our normal revenue procedures, the following tests were performed to specifically address the additional risk introduced due to the billing system replacement:
• We developed an understanding of the new systemas it relates to financial reporting, including anynew or replaced processes and controls arising as aresult of its implementation and the design ofautomated functionalities.
• We utilised computer assisted auditing techniques(CAATs) to assess the completeness and accuracyof the data migration process through comparingexpected revenue billings using data from theretired system to actual revenue billings generatedfrom the new system.
• We evaluated the automated generation of aninvoice for a sample of transactions, together withthe related revenue recognition. This includedrecalculating expected revenue outputs based oncustomer contracts.
NEXTDC Limited and controlled entities | FY18 Annual Report 92
For
per
sona
l use
onl
y

Other information
The directors are responsible for the other information. The other information comprises the information included in the annual report for the year ended 30 June 2018, including the Letter from Chairman and CEO, About NEXTDC, Directors' Report, Corporate Governance Statement, Shareholder information and Corporate Directory, but does not include the financial report and our auditor’s report thereon.
Our opinion on the financial report does not cover the other information and accordingly we do not express any form of assurance conclusion thereon.
In connection with our audit of the financial report, our responsibility is to read the other information identified above and, in doing so, consider whether the other information is materially inconsistent with the financial report or our knowledge obtained in the audit, or otherwise appears to be materially misstated.
If, based on the work we have performed, we conclude that there is a material misstatement of this other information, we are required to report that fact. We have nothing to report in this regard.
Responsibilities of the directors for the financial report
The directors of the Company are responsible for the preparation of the financial report that gives a true and fair view in accordance with Australian Accounting Standards and Corporations Act 2001 and for such internal control as the directors determine is necessary to enable the preparation of the financial report that gives a true and fair view and is free from material misstatement, whether due to fraud or error.
In preparing the financial report, the directors are responsible for assessing the ability of the Group to continue as a going concern, disclosing, as applicable, matters related to going concern and using the going concern basis of accounting unless the directors either intend to liquidate the Group or to cease operations, or have no realistic alternative but to do so.
Auditor’s responsibilities for the audit of the financial report
Our objectives are to obtain reasonable assurance about whether the financial report as a whole is free from material misstatement, whether due to fraud or error, and to issue an auditor’s report that includes our opinion. Reasonable assurance is a high level of assurance, but is not a guarantee that an audit conducted in accordance with the Australian Auditing Standards will always detect a material misstatement when it exists. Misstatements can arise from fraud or error and are considered material if, individually or in the aggregate, they could reasonably be expected to influence the economic decisions of users taken on the basis of the financial report.
A further description of our responsibilities for the audit of the financial report is located at the Auditing and Assurance Standards Board website at: http://www.auasb.gov.au/auditors_responsibilities/ar1.pdf. This description forms part of our auditor's report.
NEXTDC Limited and controlled entities | FY18 Annual Report 93
For
per
sona
l use
onl
y

NEXTDC Limited and controlled entities | FY18 Annual Report 94
For
per
sona
l use
onl
y

Shareholder Information30 June 2018
The following shareholder information was applicable as at 23 July 2018.
Distribution of equity securities
HoldingNumber ofinvestors
Number ofsecurities
100,001 and over 113 269,246,77310,001 - 100,000 1,697 38,032,2205,001 - 10,000 2,270 16,108,8811,001 - 5,000 6,346 16,536,9531 - 1000 5,226 2,327,293
Total 15,652 342,252,120
Unmarketable parcels 382 4,090
Equity security holders
The names of the twenty largest holders of quoted equity securities are listed below:
Name
Number heldPercentage ofissued shares
1. HSBC CUSTODY NOMINEES (AUSTRALIA) LIMITED 81,983,271 23.952. J P MORGAN NOMINEES AUSTRALIA LIMITED 55,708,128 16.283. CITICORP NOMINEES PTY LIMITED 33,694,277 9.844. BNP PARIBAS NOMINEES PTY LTD <AGENCY LENDING DRP A/C> 29,701,018 8.685. NATIONAL NOMINEES LIMITED 18,035,315 5.276. BNP PARIBAS NOMS PTY LTD <DRP> 9,802,440 2.867. AUSTRALIAN FOUNDATION INVESTMENT COMPANY LIMITED 4,250,000 1.248. CS THIRD NOMINEES PTY LIMITED <HSBC CUST NOM AU LTD 13 A/C> 1,657,035 0.489. AMP LIFE LIMITED 1,653,336 0.4810. CITICORP NOMINEES PTY LIMITED <COLONIAL FIRST STATE INVA/C> 1,560,562 0.4611. HSBC CUSTODY NOMINEES (AUSTRALIA) LIMITED <NT-COMNWLTHSUPER CORP A/C> 1,557,474 0.4612. BNP PARIBAS NOMS (NZ) LTD <DRP> 1,323,895 0.3913. CRAIG SCROGGIE 1,172,464 0.3414. AUST EXECUTOR TRUSTEES LTD <GFFD> 1,032,137 0.3015. FORESTER INVESTMENTS PTY LIMITED <WELLINGTON SUPERFUND A/C> 923,477 0.2716. BNP PARIBAS NOMINEES PTY LTD <IB AU NOMS RETAIL CLIENTDRP> 922,444 0.2717. SUAVE INVESTMENTS PTY LTD 752,998 0.2218. MIRRABOOKA INVESTMENTS LIMITED 710,000 0.2119. NEW ECONOMY COM AU NOMINEES PTY LIMITED <900 ACCOUNT> 673,921 0.2020. UBS NOMINEES PTY LTD 662,186 0.19
247,776,378 72.39
Unquoted equity securitiesNumberon issue
Numberof holders
Performance rights - issued in FY16 1,307,885 12Performance rights - issued in FY17 878,497 16Performance rights - issued in FY18 762,577 15Deferred share rights - issued in FY18 95,103 5
NEXTDC Limited and controlled entities | FY18 Annual Report 95
For
per
sona
l use
onl
y

Shareholder Information30 June 2018(continued)
Substantial holders
Substantial holders in the Company are set out below:
Substantial holdersNumberheld
Percentage ofissued shares
UniSuper 28,477,391 8.30%
Voting rights
The voting rights attaching to each class of equity securities are set out below:
(i) Ordinary shares
On a show of hands every member present at a meeting in person or by proxy shall have one vote and upon apoll each share shall have one vote.
(ii) Performance rights and deferred share rights
No voting rights.
NEXTDC Limited and controlled entities | FY18 Annual Report 96
For
per
sona
l use
onl
y

NEXTDC LimitedCorporate Directory
Directors Douglas FlynnChairman
Craig ScroggieChief Executive Officer
Stuart DavisNon-Executive Director
Gregory J Clark (AC)Non-Executive Director
Sharon WarburtonNon-Executive Director
Company secretary Michael Helmer
Registered office NEXTDC LimitedLevel 6,100 Creek StreetBrisbane Qld 4000Tel: +61 7 3177 4777
Website address www.nextdc.com
Auditor PricewaterhouseCoopers480 Queen StreetBrisbane Qld 4000+61 7 3257 5000
Solicitors Clayton UtzLevel 28, Riparian Plaza71 Eagle StreetBrisbane Qld 4000
Herbert Smith FreehillsANZ Tower161 Castlereagh StreetSydney NSW 2000
Share register Link Market ServicesLevel 21,10 Eagle StreetBrisbane Qld 4000Tel: 1300 554 474 (in Australia)Tel: +61 (2) 8280 7111 (overseas)
Stock exchange listing NEXTDC Limited shares are listed on the AustralianSecurities Exchange (ASX) under ticker code NXT.
NEXTDC Limited and controlled entities | FY18 Annual Report 97
For
per
sona
l use
onl
y
