strategic planning session fourth quarter fiscal …...1st qtr fy18 2nd qtr fy18 3rd qtr fy18 4th...
TRANSCRIPT

Strategic Planning Session
Fourth Quarter – Fiscal Year 2018
April – June 2018
…Creating a Campus of Distinction

Coming Fall 2018
…Creating a Campus of Distinction
Goal 1 - Continuously Improve Operation of Campus Facilities
Goal 2 - Create a Reliable and Sustainable Physical Infrastructure
Goal 3 - Foster a Customer Focused Organization
Goal 4 - Recruit, Develop, and Retain Quality Employees
Goal 5 - Promote Good Stewardship
Facilities Management’s Goals

Coming Fall 2018
GOAL #1
Continuously Improve Operations of Campus
"In business, words are
words, explanations are
explanations, promises are
promises, but only
performance is reality."
-- Harold Geneen, industrialist

Facilities Management Strategic Planning Session – Fourth Quarter FY 2018
GOAL #1 – Continuously Improve Operations of Campus FacilitiesObjective: 1.1: Improve Labor AvailabilityTactic: 1.1.1: Maintain “Wrench” Time at 70%
A C T I O N P L A N
4
Actions Planned1. Daily assignment; coordinating and monitoring of work effort (on-going)
2. Working with FIS on the “work order reinvention project” July 2018
Actions Completed1. Hired an Admin Support Supervisor
2. Completed consolidation of the Admin Support Group
3. Working w consultant to discuss WO process and materials acquisition strategies
4. Implemented 4-10 work hours
Lead
F. O.

10.0%
20.0%
30.0%
40.0%
50.0%
60.0%
70.0%
80.0%
1ST QTR FY18 2ND QTR FY18 3RD QTR FY18 4TH QTR FY18 ANNUAL AVERAGE
73.0%
82.0%
70.4%
53.4%
69.4%
Wrench Time
1st Qtr FY18 2nd Qtr FY18 3rd Qtr FY18 4th Qtr FY18 Annual Average
Facilities Management Strategic Planning Session – Fourth Quarter FY 2018
GOAL #1 – Continuously Improve Operations of Campus FacilitiesObjective: 1.1: Improve Labor AvailabilityTactic: 1.1.1: Maintain “Wrench” Time at 70%Measure: Hours (total hours charged to work requests divided by total hours recorded)
Lead: Facilities OperationsBalanced Scorecard Category: Internal Business Process
Lead
F. O.
5
STATUS
4th
Quarter
STATUS
Annual

Facilities Management Strategic Planning Session – Fourth Quarter FY 2018
GOAL #1 – Continuously Improve Operations of Campus FacilitiesObjective: 1.2: Improve Logistics EfficiencyTactic: 1.2.1: Improve Non-stock on-time delivery to 95%Tactic: 1.2.2: Reduce Average Non-stock Requisition to Receipt Time to 3.5 Days
A C T I O N P L A N
6
Actions Planned
1. Continue to identify items that have been repeatedly ordered as non-stock items to become stock items; continue to streamline existing stock inventory (Monthly).
2. Implement daily scanning of material pick-up slips from SDI to ADMIN GROUP (July 2018)
3. Continue to send out daily email reminders for approvers (Supervisors, Admins and Managers)
4. Continue to monitor the requisition to PO processing time.
5. RFP for warehousing contract (Implement December 2018)
6. Implement central receiving for Facilities Operations (October 2018)
Actions Completed
1. Met with vendor to discuss the work order material ordering process
2. Created Google Groups to expedite approvals and pick-up notices
3. Streamlined stock inventory
Lead
F. O.

81.00%
83.00%
85.00%
87.00%
89.00%
91.00%
93.00%
95.00%
97.00%
1ST QTR FY18 2ND QTR FY18 3RD QTR FY18 4TH QTR FY18 ANNUAL AVERAGE
90.00%
87.00%
93.60%
86.40%
89.47%
Improve Non-stock On-time Delivery
1st Qtr FY18 2nd Qtr FY18 3rd Qtr FY18 4th Qtr FY18 Annual Average
Facilities Management Strategic Planning Session – Fourth Quarter FY 2018
GOAL #1 – Continuously Improve Operations of Campus FacilitiesObjective: 1.2: Improve Logistics EfficiencyTactic: 1.2.1: Improve Non-stock on-time delivery to 95%Measure: Percent of non-stock orders received on or before delivery due date (SDI Key Performance Indicator (KPI))
Lead: Facilities OperationsBalanced Scorecard Category: Internal Business Process
7
Lead
F. O.
STATUS
4th
Quarter
STATUS
Annual

2.00
2.50
3.00
3.50
4.00
1ST QTR FY18 2ND QTR FY18 3RD QTR FY18 4TH QTR FY18 ANNUAL AVERAGE
3.99 5.24
3.71
4.52 4.50
Reduce Average Non-stock Requisition to Receipt Time
Facilities Management Strategic Planning Session – Fourth Quarter FY18
GOAL #1 – Continuously Improve Operations of Campus FacilitiesObjective: 1.2: Improve Logistics EfficiencyTactic: 1.2.2: Reduce Average Non-stock Requisition to Receipt Time to 3.5 DaysMeasure: Average Days from requisition to receipt (SDI KPI – Non-stock Requisition to Receipt Time)
Lead: Facilities OperationsBalanced Scorecard Category: Internal Business Process
8
STATUS
4th
Quarter
STATUS
Annual
Lead
F. O.

Facilities Management Strategic Planning Session – Fourth Quarter FY 2018
GOAL #1 – Continuously Improve Operations of Campus FacilitiesObjective: 1.3: Improve Work Request ProcessTactic: 1.3.1: Decrease Number of Work Orders Over 14 Days Old by 15%Tactic: 1.3.2: Decrease Work Request Cycle Time by 10%Measure: Hours from Work Request Submitted to Work Complete (APPA Benchmark)
A C T I O N P L A N
9
Lead
F. O.
Actions Planned
1. Implementing tablets for technicians; working with FIS to complete implementation (led techs;
looking to expand to all techs Oct 2018)
2. Bi-weekly review of recurring services and scheduled services currently being completed using PM
work request. (on-going)
3. Monthly review (Supervisors and admin support group) to monitor 30 Day Report
4. Supervisors met daily with technicians to prioritize work assignments. (on-going)
5. Grounds process improvement (Admin Support Group)(July 2018)
6. ARCHIBUS Console, a paperless system, speeds up turn around time on completions (July 2018)

500
700
900
1100
1300
1500
1700
1900
2100
2300
2500
2700
2900
1ST QTR FY18 2ND QTR FY18 3RD QTR FY18 4TH QTR FY18 ANNUAL AVERAGE
2192
27382721
2207
2464.5
Number of Work Orders Over 14 Days
Facilities Management Strategic Planning Session – Fourth Quarter FY 2018
GOAL #1 – Continuously Improve Operations of Campus FacilitiesObjective: 1.3: Improve Work Request ProcessTactic: 1.3.1: Decrease Number of Work Orders Over 14 Days Old by 15%Measure: Number of open reactive work orders over 14 Days from request (excluding scheduled work orders)
Lead: Facilities OperationsBalanced Scorecard Category: Customer Perspective
10
STATUS
4th
Quarter
STATUS
Annual
Lead
F. O.

500.00
520.00
540.00
560.00
580.00
600.00
620.00
1ST QTR FY18 2ND QTR FY18 3RD QTR FY18 4TH QTR FY18 ANNUAL AVERAGE
579.05
590.72
543.00
610.38
580.79
Decrease Work Request Cycle Time
Goal < 10% (512.32)
Facilities Management Strategic Planning Session – Fourth Quarter FY 2018
GOAL #1 – Continuously Improve Operations of Campus FacilitiesObjective: 1.3: Improve Work Request ProcessTactic: 1.3.2: Decrease Work Request Cycle Time by 10%Measure: Hours from Work Request Submitted to Work Complete (APPA Benchmark)
Lead: Facilities OperationsBalanced Scorecard Category: Customer Perspective
11
STATUS
4th
Quarter
STATUS
Annual
Lead
F. O.

GOAL #1 – Continuously Improve Maintenance and Operations
Objective: 1.4: Improve BES ProcessesTactic 1.4.1: Achieve APPA Level 2 in 98% of Buildings
ACTION PLAN
• Actions Completed
– Completed 4 Contributing Technician Hiring Pool Cycles
– Completed 4th cycle of “Expect What You Inspect” Inspections
• Actions Planned
– Implement new HPTC Digital Training Platform (8/2018)
– Develop new APPA Appearance forms into quarterly audits (8/2018)
– Develop Digital Workloading for HTPC Zones (9/2018)
– Implement High Performance Team Cleaning in all Academic and Administrative buildings (3/2022)
– Develop Standard Operating Procedures Manual (SOP) for BES&R (ongoing)
12
LeadBES

Facilities Management Strategic Planning Session – Fourth Quarter FY 2018
GOAL #1 – Continuously Improve Maintenance and Operations of the Campus
Objective: 1.4: Improve BES ProcessesTactic 1.4.1: Achieve APPA Level 2 in 98% of BuildingsMeasure: Percentage of buildings meeting APPA Level 2 cleanliness standards during quarterly inspection (APPA Benchmark)
Lead: Building Environmental ServicesBalanced Scorecard Category: Customer Perspective
LeadBES
13
STATUS
Percentage = 84%
81%
82%
82%
83%
83%
84%
84%
FY18-1stQTR
FY18-2ndQTR
FY18-3rdQTR
FY18-4thQTR
84%
82% 82%
84%
APPA LEVELS

Facilities Management Strategic Planning Session – Fourth Quarter FY 2018
GOAL #1 – Continuously Improve Operations of Campus FacilitiesObjective: 1.5: Improve Facility Systems ReliabilityTactic: 1.5.1: Improve Completion of Preventive Maintenance Work Requests to 90%Tactic: 1.5.2: Decrease number of Unscheduled Equipment Replacement Projects to less than 2 incidents per quarterTactic: 1.5.3: Fewer than 5 unscheduled outages per quarterTactic: 1.5.4: Improve Ratio of Preventive/Predictive work requests to Reactive request to 50%
A C T I O N P L A N
Actions Planned1. Realign PM Program; targeting specific areas Fire Systems, High Voltage, Zone 4/Dining Services (On going)
2. Continue expansion of PM Program; Work with key customers – Auxiliary Services (March 2018 completion)
3. Using the FIN Project to perform PM’s, collect asset data and perform select retro commissioning activities
(on-going)
4. FCAP will continue to identify and prioritize equipment conditions and needs, for replacement; This
information is used to support CRDM projects. (on-going)
5. Developing predictive maintenance condition monitoring program (Implement in 2020)
6. Activate Zone 8 to perform critical PM after normal working hours (Implement staffing plan by December
2018)
7. Increased number of PMs in the system (building reset process)
Actions Completed 1. Incorporated FCAP inspection process into CRDM and Daily Operations
2. Restructure the ARCHIBUS PM Equipment Manager module
3. Acquired vibration monitor device
4. Hired Zone 8 supervisor (June 2018) 14
Lead
F. O.

75%
80%
85%
90%
95%
100%
1ST QTR FY18 2ND QTR FY18 3RD QTR FY18 4TH QTR FY18 ANNUAL AVERAGE
84.6%
86.0%
83.0%
90.9%
86.1%
Improve Completion of PM Work Orders
Goal to 90%
Facilities Management Strategic Planning Session – Fourth Quarter FY 2018
GOAL #1 – Continuously Improve Operations of Campus FacilitiesObjective: 1.5: Improve Facility Systems ReliabilityTactic: 1.5.1: Improve Completion of Preventive Maintenance Work Requests to 90%Measure: Percentage of Preventive Maintenance Work Requests Completed
Lead: Facilities OperationsBalanced Scorecard Category: Internal Business Process
15
Lead
F. O.
STATUS
4th
Quarter
STATUS
Annual

Facilities Management Strategic Planning Session – Fourth Quarter FY 2018
GOAL #1 – Continuously Improve Operations of Campus FacilitiesObjective: 1.5: Improve Facility Systems ReliabilityTactic: 1.5.2: Decrease number of Unscheduled Equipment Replacement Projects to less than 2 incidents per quarterMeasure: Number of Unscheduled Equipment Replacement Projects
Lead: Facilities OperationsBalanced Scorecard Category: Internal Business Process
16
Lead
F. O.
0.00
0.50
1.00
1.50
2.00
2.50
3.00
3.50
4.00
1ST QTR FY18 2ND QTR FY18 3RD QTR FY18 4TH QTR FY18 ANNUAL AVERAGE
0.00
1.00 1.00
4.00
1.50
Unscheduled Equipment Replacement Projects
STATUS
4th
Quarter
STATUS
Annual

0.0
0.5
1.0
1.5
2.0
2.5
3.0
3.5
4.0
4.5
5.0
1ST QTR FY18 2ND QTR FY18 3RD QTR FY18 4TH QTR FY18 ANNUAL AVERAGE
5.0
3.0
6.0
3.0
4.3
Unscheduled Outages
1st Qtr FY18 2nd Qtr FY18 3rd Qtr FY18 4th Qtr FY18 Annual Average
Facilities Management Strategic Planning Session – Fourth Quarter FY 2018
GOAL #1 – Continuously Improve Operations of Campus FacilitiesObjective: 1.5: Improve Facility Systems ReliabilityTactic: 1.5.3: Fewer than 5 unscheduled outages per quarterMeasure: Number of Occurrences: Electric, Water, Sewer, HVAC, (Roofs, Lots, Decks, Roads measured separately).Lead: Facilities OperationsBalanced Scorecard Category: Customer Perspective
17
Lead
F. O.
STATUS
4th
Quarter
STATUS
Annual

Facilities Management Strategic Planning Session – Fourth Quarter FY 2018GOAL #1 – Continuously Improve Operations of Campus FacilitiesObjective: 1.5: Improve Facility Systems ReliabilityTactic: 1.5.4: Improve Ratio of Preventive/Predictive work requests to Reactive request to 50%Measure: Percentage (Number of completed reactive work requests divided by total number of completed work requests including
PM and Predictive work requests) (APPA Benchmark)
Lead: Facilities OperationsBalanced Scorecard Category: Customer Perspective
18
Lead
F. O.
5.0%
10.0%
15.0%
20.0%
25.0%
30.0%
35.0%
40.0%
45.0%
50.0%
55.0%
60.0%
1ST QTR FY18 2ND QTR FY18 3RD QTR FY18 4TH QTR FY18 ANNUAL AVERAGE
52.9%
40.0% 41.0%42.3% 42.5%
Improve Ratio of Preventive/Predictive Work Requests
1st Qtr FY18 2nd Qtr FY18 3rd Qtr FY18 4th Qtr FY18 Annual Average
STATUS
4th
Quarter
STATUS
Annual

Coming Fall 2018
GOAL #2
Create a Reliable and Sustainable Physical Infrastructure
"People with goals
succeed because they
know where they're going"
-- Earl Nightingale,
Motivational Speaker

Lead
FIS
GOAL #2 – Create a Reliable and Sustainable Physical Infrastructure
Objective: 2.1 Maximize Facilities Management Effectiveness and Efficiency through Information TechnologyTactic: 2.1.1 Complete 40% of the Facilities Management Five-Year Technology Plan
ACTION PLAN
Actions Planned:
1. Hire AutoCAD Technician temp position by Aug 30, 2018.
2. Meet with FO on Work Request Console reported issues and requests by Aug 30, 2018.
3. Complete Zone Shop Supervisor and Lead Tech Work Request Console Training by Aug 15, 2018.
3. Begin project meetings for BAS Analytics project by Aug 15, 2018.
4. Schedule and conduct project meeting with FM departments on Drop
box and Google Drive use by Aug 10, 2018.

Lead
FIS
GOAL #2 – Create a Reliable and Sustainable Physical Infrastructure
Objective: 2.1 Maximize Facilities Management Effectiveness and Efficiency through Information TechnologyTactic: 2.1.1 Complete 40% of the Facilities Management Five-Year Technology Plan
ACTION PLAN
Actions Completed:
1. Completed Work Request Console development.
2. Completed Refrigeration CANVAS Training.
3. Completed Phase 1 FIN VAV and Metering Data.
4. Deployed new Recycling Mobile device replacements.
5. Completed Risk Management integration.
6. Complete updates to PM/EQ views.
7. Completed Evacuation Maps (for EHS).
8. Completed remainder of AHU FIN Graphics updates.

Facilities Management Strategic Planning Session – Fourth Quarter FY 2018
GOAL #2 – Create a Reliable and Sustainable Physical Infrastructure
Objective: 2.1 Maximize Facilities Management Effectiveness and Efficiency through Information TechnologyTactic: 2.1.1 Complete 40% of the Facilities Management Five-Year Technology PlanMeasure: Percent Completion of Five-Year Technology Projects
Based upon Cumulative Average of Project Completion
Balanced Scorecard Category: Internal Business Processes
Lead
FIS
STATUS
4th QTR GOAL
Cumulative Project Task Completion Percentage
90.99%
0.00%
10.00%
20.00%
30.00%
40.00%
50.00%
60.00%
70.00%
80.00%
90.00%
100.00%
Qtr 1 FY18 Qtr 2 FY18 Qtr 3 FY18 Qtr 4 FY18

90.79%
0.00%
10.00%
20.00%
30.00%
40.00%
50.00%
60.00%
70.00%
80.00%
90.00%
100.00%
Qtr 1 FY18 Qtr 2 FY18 Qtr 3 FY18 Qtr 4 FY18
FIS Weighted Project Average Completion
Facilities Management Strategic Planning Session – Fourth Quarter FY 2018
GOAL #2 – Create a Reliable and Sustainable Physical Infrastructure
Objective: 2.1 Maximize Facilities Management Effectiveness and Efficiency through Information TechnologyTactic: 2.1.1 Complete 40% of the Facilities Management Five-Year Technology PlanMeasure: Percent Completion of Five-Year Technology Projects
Based upon Cumulative Average of Project Completion
Balanced Scorecard Category: Internal Business Processes
Lead
FIS
4th QTR GOAL
STATUS

Facilities Management Strategic Planning Session – Fourth Quarter FY 2018
GOAL #2 – Create a Reliable and Sustainable Physical Infrastructure
Objective: 2.1 Maximize Facilities Management Effectiveness and Efficiency through Information TechnologyTactic: 2.1.1 Complete 40% of the Facilities Management Five-Year Technology PlanMeasure: Percent Completion of Five-Year Technology Projects
Project Status Completion Percentage
Balanced Scorecard Category: Internal Business Processes
Lead
FIS
0.00% 10.00% 20.00% 30.00% 40.00% 50.00% 60.00% 70.00% 80.00% 90.00% 100.00%
Design Report Updates
SPACE Primary Invest.
SMAC Space Changes
AD Migration
KRONOS & Training Import
Google Sheets Integration
Security Remediation
AD/PC Inventory
FY18 PC Replacement
JACE Replacement Phase 1
Recycling Device Replacment
Asbestos Updates
Refrigeration Phase2
MISC Map Updates
Recycling Bins
Open Options Purge
Avigilon Upgrade
Light Rail Cameras
RUP2 JACE Upgrade
FIN STACK Graphics VAVs
FIN STACK Graphics AHUs
State Construction Data
Training-CANVAS
Space Public Revenue…
FIN STACK Meter History
Remote Key Admins
Risk Mgmt Integration
Open Options Install. Phase 1
Card Office EQ
Open Options (HRL)…
Evacuation Maps
Risk Mgmt Integration
Remote Key Admins
FY18 Q1
FY18 Q2
FY18 Q3
FY18 Q4
COMPLETED PROJECTS TO DATE

FM Prioritized Projects – FY18COMPLETED PROJECTS:
1. Primary Investigators (SPACE)
2. Design Services Report Updates
3. KRONOS ARCHIBUS Training Import
4. Google Sheets Integration
5. AD PC Inventory Clean Up
6. Active Directory Migration
7. FY18 Computer Replacement Project
8. Asbestos Updates
9. Classroom Support Asset Tracking
10. Space Committee Changes (SMAC)
11. Refrigeration Compliance Phase 2
12. BES Recycling Bin & APP Revamp
13. Avigilon Upgrade
14. Open Options Data Purge
15. MISC Map Updates
16. ARCHIBUS Security Remediation
17. Light Rail Cameras (Genetec)
18. RUP2 JACE Integration
19. ARCHIBUS WO Reinvention20. ARCHIBUS Canvas Training21. Open Options Integration (HRL) 22. Open Options Conversion Project Phase 1 23. Space Revenue Tracking (Private/Public) Report24. Remote Key Admins25. Evacuation Maps (EHS)26. Card Office EQ Management27. Risk Management Integration28. FIN STACK Graphics AHUs29. FIN STACK Graphics VAV30. FIN STACK Graphics Meter History Import31. State Construction Property Analysis32. Recycling Device Replacements33. JACE Replacement Phase 1
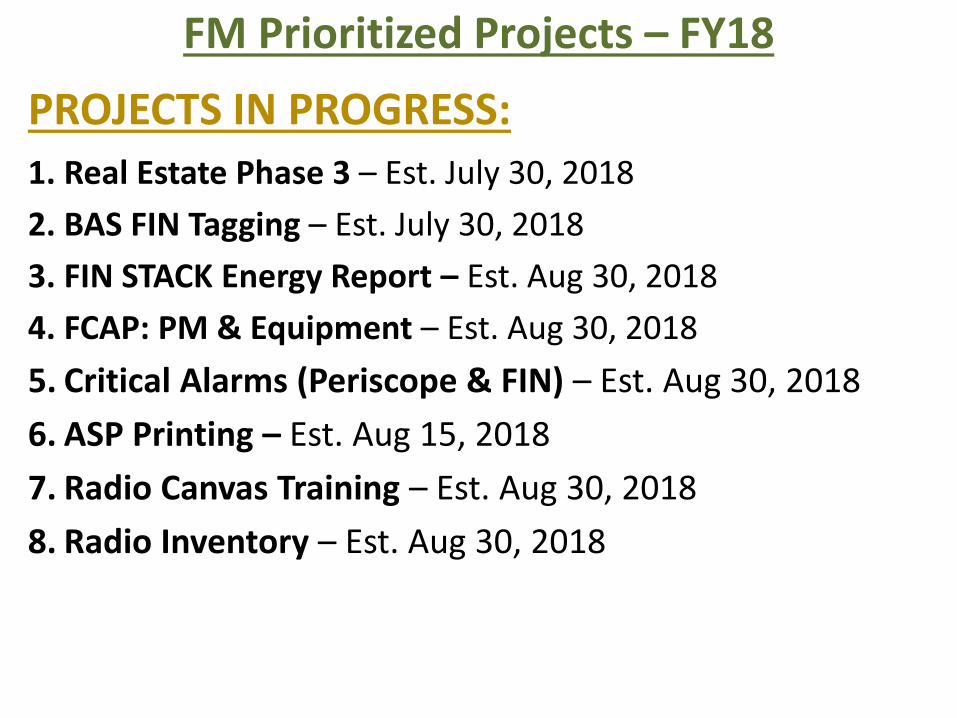
FM Prioritized Projects – FY18
PROJECTS IN PROGRESS:1. Real Estate Phase 3 – Est. July 30, 2018
2. BAS FIN Tagging – Est. July 30, 2018
3. FIN STACK Energy Report – Est. Aug 30, 2018
4. FCAP: PM & Equipment – Est. Aug 30, 2018
5. Critical Alarms (Periscope & FIN) – Est. Aug 30, 2018
6. ASP Printing – Est. Aug 15, 2018
7. Radio Canvas Training – Est. Aug 30, 2018
8. Radio Inventory – Est. Aug 30, 2018

FM Prioritized Projects – FY18CANCELLED PROJECTS1. GIS Parking Counts – Cancelled by CIO2. GIS Department Map – Cancelled by FIS
*OTHER PROJECTS – Moved to Next Fiscal Year:1. ARCHIBUS Fleet Module – (Awaiting Funding)2. 49er Mart Integration (Jaggaer) – (Awaiting Funding)3. GIS Wayfinding Signage – (Moved to FY19)4. ARCHIBUS Lockout/Tag Out (LOTO) – (Moved to FY19)5. Equipment Maps – (Moved to FY19)6. FIN STACK Hot Water Chill Water Graphics – (Moved to FY19)7. BAS Analytics – (Moved to FY19)8. Department Drop boxes – (Moved to FY19)9. Mobile Floor Plans – (Moved to FY19)10. Mobile Intent Reinvention – (Moved to FY19)11. ARCHIBUS Testing Framework – (Moved to FY19)12. Project Management Tools/Updates – (Moved to FY19)
*Projects awaiting funding/approval or moved to next year are not calculated in project tasks27

Facilities Management Strategic Planning Session – Fourth Quarter FY 2018
GOAL #2 – Create a Reliable and Sustainable Physical Infrastructure
Objective: 2.1 Maximize Facilities Management Effectiveness and Efficiency through Information TechnologyTactic: 2.1.1 Complete 40% of the Facilities Management Five-Year Technology PlanMeasure: Percent Completion of Five-Year Technology Projects
Project Status Completion Percentage
Balanced Scorecard Category: Internal Business Processes
PROJECTS IN PROGRESS
95.00%
90.00%
80.00%
60.00%
50.00%
10.00%
0.00% 10.00% 20.00% 30.00% 40.00% 50.00% 60.00% 70.00% 80.00% 90.00% 100.00%
Critical Alarms(Periscope)
Real Estate 3
BAS FIN Tagging
FCAP: PM&EQ
ASP Printing
FIN Energy Report
Radio CANVAS
Radio Inventory
FY18 Q1
FY18 Q2
FY18 Q3
FY18 Q4

NEW IMPROVEMENTS
29
ACTION PLANS FOR IMPROVEMENT
Facilities Management Strategic Planning Session – Fourth Quarter FY 2018
GOAL #2 – Create a Reliable and Sustainable Physical Infrastructure
Objective: 2.2: Improve Informal Project Design and Construction Process
Lead: Design ServicesBalanced Scorecard Category: Internal Business Process
Design Services Engineering: Monthly meetings to review projects having multiple design disciplines.Coordinate project requirements & assist other staff with engineering needs.
Timeline: FY19 QTR 1 - FY19 QTR 4 – Work In Progress
Tactic 2.2.1: 95% of All Construction Projects Meet Scheduled Beneficial Occupancy Date (BOD)Measure: Percentage (Number of Construction Projects Completed on or before Delivery Date Divided by Total Number of Projects Completed)
Tactic 2.2.2: Review Project Capacity - Goal 220 projects per yearMeasure: Number of Projects Completed (Annual Goal)
Continue to assign Classroom Capacity and provide ADA egress information per building.
ONGOING IMPROVEMENTS
LeadDesign Services
Meet with Customers to clarify full set of Design Services processes. May occur via telephone.
Seeking better understanding of Mechanical Standards for Lab Renovations – Don Janus (lead).
Timeline: FY18 QTR 3 - FY19 QTR 4– Work In Progress
Job Order Contracting (JOC) Renewal Process: Reviewing Possibility for Electrical JOC and Civil JOC.
Timeline: FY18 QTR 3 - FY19 QTR 2 – Work In Progress
Meet with Customers during Punch List Phase to validate project complete status.

Facilities Management Strategic Planning Session – Fourth Quarter FY 2018
GOAL #2 – Create a Reliable and Sustainable Physical Infrastructure
Objective: 2.2: Improve Informal Project Design and Construction Process
Lead: Design ServicesBalanced Scorecard Category: Internal Business Process
30
LeadDesign Services
Tactic 2.2.1: 95% of All Construction Projects Meet Scheduled Beneficial Occupancy Date (BOD)Measure: Percentage (Number of Construction Projects Completed on or before Delivery Date Divided by Total Number of Project Completed)
QTR 4 Status
95.3%Annual Goal
95%
Annual Status
95.2%
QUARTERLY
REVIEWNo. Of Projects
Projects
Occupied by
scheduled date
Projects not
Occupied by
scheduled date
Percent
FY09 115 100 15 87.0%
FY10 182 168 14 92.3%
FY11 224 200 24 89.3%
FY12 240 231 9 96.3%
FY13 139 134 5 96.4%
FY14 221 211 10 95.5%
FY15 216 206 10 95.4%
FY16 233 226 7 97.0%
FY17 205 196 9 95.6%
Q 1 21 20 1 95.2%
Q 2 35 33 2 94.3%
Q 3 25 24 1 96.0%
Q 4 129 123 6 95.3%
FY18 STATUS 210 200 10 95.2%
95% of All Construction Projects Meet Scheduled
Beneficial Occupancy Date (BOD)
FY 18
87.0%
92.3%
89.3%
96.3% 96.4%95.5%
95.4%
97.0%
95.6%
94.3%
95.2%95%
85%
FY09 FY10 FY11 FY12 FY13 FY14 FY15 FY16 FY17 Q 1 Q 2 Q 3 Q 4 FY18 STATUS
GOAL ALERT
95.3%
96%

Annual Status
210
Facilities Management Strategic Planning Session – Fourth Quarter FY 2018
GOAL #2 – Create a Reliable and Sustainable Physical Infrastructure
Objective: 2.2: Improve Informal Project Design and Construction Process
Lead: Design ServicesBalanced Scorecard Category: Internal Business Process
31
LeadDesign Services
Goal 220 Projects Per Year
Tactic 2.2.2: Review Project Capacity - Goal 220 projects per year.Measure: Number of Projects Completed
Annual Goal
220
COMPLETED
FY 2009 FY 2010 FY 2011 FY 2012 FY 2013 FY 2014 FY 2015 FY 2016 FY 2017 FY 2018
GOAL 210 250 250 250 220 220 220 220 220 220
Projects
Completed193 278 277 286 218 221 210 233 205 210
Project
Dollars$7,745,678 $9,935,384 $17,944,564 $19,393,759 $13,589,752 $13,648,336 $11,500,450 $11,500,450 $13,272,500 $13,606,200
250
$7,745,678
$9,935,384
$17,944,564$19,393,759
$13,589,752
$13,648,336
$11,500,450 $11,500,450$13,272,500
$13,606,200
210
250 250 250
220 220 220 220 220 220
193
278 277286
218 221210
233
205 210
FY 2009 FY 2010 FY 2011 FY 2012 FY 2013 FY 2014 FY 2015 FY 2016 FY 2017 FY 2018
GOAL14,000,00014,000,000
95.5 %
97.2 %

Facilities Management Strategic Planning Session – Fourth Quarter FY2018
GOAL #2 - Create a Reliable and Sustainable Physical Infrastructure
Objective 2.4: Improve Campus Space Planning and Utilization
Tactic 2.4.2: Assess existing and proposed space for adherence to campus space guidelines.
Measure: Measure Assignable Square Feet of allocated space compared to recommended guideline and metric.
Lead: Space Management
Balanced Scorecard Category: Internal Business Process
32
ACTION PLAN
• Actions Planned:
o Conduct annual physical audit of all campus space
o Develop Space Guidelines – incorporate in Space Management Policy
o Develop Metrics for Room Use Categories based on national standards
o Assess proposed space use for new construction and renovation projects to evaluate alignment with accepted metrics
o Conduct studies to assess space use and develop recommendations for space needs
Lead
Space
Management
STATUS

Objective 2.4: Improve Campus Space Planning and Utilization
Tactic 2.4.2: Assess existing and proposed space for adherence to campus space guidelines.
• Conduct annual physical audit of all campus space • Develop Space Guidelines • Develop Metrics for Room Use Categories • Assess proposed space use for new construction and renovation projects to evaluate
alignment with accepted metrics• Conduct studies to assess space use and develop recommendations for space needs
Tactic 2.5.1: Develop Five-Year Capital Plan
• Work with divisions and departments to identify needs and priorities for capital projects
• Conduct studies to identify programmatic and space needs • Work with Financial Services to identify potential funding for Capital Plan• Develop initial project budgets in consultation with Capital Projects• Establish project priorities and align with funding • Present plan to Chancellor and Cabinet for review and input • Complete operating Budget sheets for new capital projects for new projects
Status
Status
Status *
Facilities Management Strategic Planning Session – Fourth Quarter FY2018
GOAL #2 Create a Reliable and Sustainable Physical Infrastructure

Facilities Management Strategic Planning Session – Fourth Quarter FY2018
GOAL #2 Create a Reliable and Sustainable Physical Infrastructure
Objective 2.5: Improve the Capital Planning and Design Process
Tactic 2.5.1: Develop Five-year Capital Plan
Lead: Facilities Planning
Balanced Scorecard Category: Internal Business Process
34
• Actions Planned:
o Work with divisions and departments to identify needs and priorities for capital projects
o Conduct studies to identify programmatic and space needs o Work with Financial Services to identify potential funding for Capital
Plano Develop initial project budgets in consultation with Capital Projectso Establish project priorities and align with funding o Present plan to Chancellor and Cabinet for review and input o Complete operating Budget sheets for new capital projects
for new projects
Lead
Facilities
Planning
ACTION PLAN
STATUS

Lead
Capital
GOAL #2 – Create a Reliable and Sustainable Physical Infrastructure
Objective 2.5 Improve the Capital Planning and Design ProcessTactic 2.5.2 90% of designers under contract within 120 days of the Project posting in INTERSCOPE PLUS
2.5.3 90% of Designs complete by the scheduled completion date2.5.4 90% of designs complete within design budgeted fee
ACTION PLAN
Actions Completed
• Sycamore Hall Renovation (2.5.4)
Actions Planned
35

Facilities Management Strategic Planning Session – Fourth Quarter FY 2018
GOAL #2 – Create a Reliable and Sustainable Physical Infrastructure
Objective 2.5 Improve the Capital Planning and Design ProcessTactic 2.5.2 90% of designers under contract within 120 days of the Project posting in Interscope PlusMeasure: Percentage of designers under contract within 120 days.
Balanced Scorecard Category: Internal Business Process
Lead
Capital
36Tactic Measurement for 4th Quarter is N/A
Status
83%
67%
100% 100%
0%
100%
0%
Goal 90%
STRATEGIC
REVIEW by
Fiscal Year (July-
June)
No. of
projects
auth. in
Interscope
Designer
under
contract
w/in 120
Designer
not under
contract
w/in 120
%
Designers
under
contract
Summary FY-15 7 5 1 83%
Summary FY-16 6 4 2 67%
Summary FY-17 6 8 0 100%
1st Qtr. FY-18 2 2 0 100%
2nd Qtr. FY-18 4 0 0 N/A
3rd Qtr. FY-18 0 1 0 100%
4th Qtr. FY-18 0 0 0 N/A

Facilities Management Strategic Planning Session – Fourth Quarter FY 2018
GOAL #2 – Create a Reliable and Sustainable Physical Infrastructure
Objective 2.5 Improve the Capital Planning and Design ProcessTactic 2.5.3 90% of designs complete by the scheduled completion date
Measure: Percentage of designs completed on or before the original completion time
Balanced Scorecard Category: Internal Business Process
Lead
Capital
37Tactic Measurement for 4th Quarter is N/A
Status
STRATEGIC
REVIEW by Fiscal
Year (July-June)
No. of
projects
completed by
scheduled
time
#not
completed by
scheduled
time
% Designs
complete by
completion
time
Summary FY-15 3 1 75%
Summary FY-16 7 3 70%
Summary FY-17 6 2 75%
1st Qtr. FY-18 1 2 33%
2nd Qtr. FY-18 2 1 50%
3rd Qtr. FY-18 3 1 75%
4th Qtr. FY-18 0 0 N/A
75%
70%75%
33%
50%
75%
0%
Goal 90%

Facilities Management Strategic Planning Session – Fourth Quarter FY 2018
GOAL #2 – Create a Reliable and Sustainable Physical Infrastructure
Objective 2.5 Improve the Capital Planning and Design ProcessTactic 2.5.4 90% of designs complete within design budgeted fee
Measure: Percentage of designs completed within the original design contract amount
Balanced Scorecard Category: Internal Processes
Lead
Capital
38
Status
Tactic Measurement for 4th Quarter is 100%
STRATEGIC
REVIEW by Fiscal
Year (July-June)
# of designs
with original
budgeted
fee
# designs
complete
not within
budget
% Designs
not
complete
w/in
budgeted
fee
Summary FY-15 3 0 100%Summary FY-16 9 1 90%Summary FY-17 5 3 63%1st Qtr. FY-18 1 2 33%2nd Qtr. FY-18 0 2 0%3rd Qtr. FY-18 2 1 50%4th Qtr. FY-18 1 0 100%
Sycamore Hall Renovation
10090
63
33
0
50
100
0
10
20
30
40
50
60
70
80
90
100
Goal
Lead
Capital
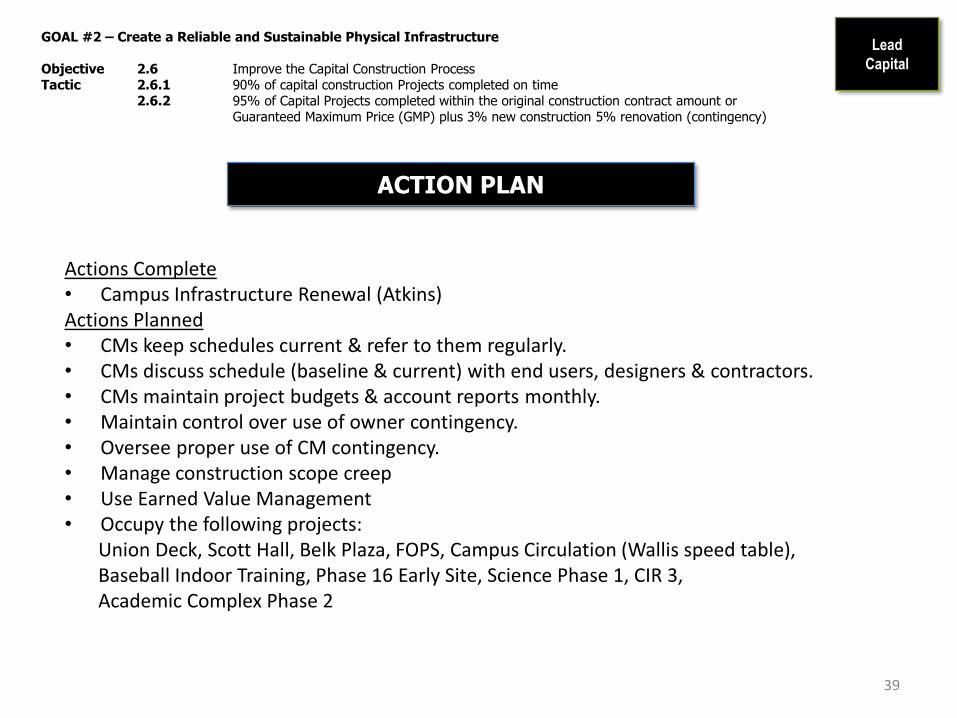
GOAL #2 – Create a Reliable and Sustainable Physical Infrastructure
Objective 2.6 Improve the Capital Construction ProcessTactic 2.6.1 90% of capital construction Projects completed on time
2.6.2 95% of Capital Projects completed within the original construction contract amount or Guaranteed Maximum Price (GMP) plus 3% new construction 5% renovation (contingency)
ACTION PLAN
Actions Complete• Campus Infrastructure Renewal (Atkins)Actions Planned• CMs keep schedules current & refer to them regularly.• CMs discuss schedule (baseline & current) with end users, designers & contractors.• CMs maintain project budgets & account reports monthly.• Maintain control over use of owner contingency.• Oversee proper use of CM contingency.• Manage construction scope creep• Use Earned Value Management• Occupy the following projects:
Union Deck, Scott Hall, Belk Plaza, FOPS, Campus Circulation (Wallis speed table), Baseball Indoor Training, Phase 16 Early Site, Science Phase 1, CIR 3, Academic Complex Phase 2
39

Facilities Management Strategic Planning Session – Fourth Quarter FY 2018
GOAL #2 – Create a Reliable and Sustainable Physical Infrastructure
Objective 2.6 Improve the Capital Construction ProcessTactic 2.6.1 90% of capital construction Projects completed on time
Measure: Percentage of construction projects completed on or before the contract completion date (CCD)
Balanced Scorecard Category: Customer Perspective
Lead
Capital
40Tactic Measurement for 4th Quarter is 100%
Status
STRATEGIC
REVIEW by Fiscal
Year (July-June)
# completed
on schedule
not
completed on
schedule
%
completed
on timeSummary FY-15 5 3 63%Summary FY-16 3 5 38%Summary FY-17 3 2 60%1st Qtr. FY-18 0 0 0%2nd Qtr. FY-18 0 3 0%3rd Qtr. FY-18 3 2 60%4th Qtr. FY-18 1 0 100%
63%
38%
60%
0% 0%
60%
100%
Goal 90%
Campus Infrastructure (Atkins), completed 3 months ahead of schedule.

Facilities Management Strategic Planning Session – Fourth Quarter FY 2018
GOAL #2 – Create a Reliable and Sustainable Physical Infrastructure
Objective 2.6 Improve the Capital Construction ProcessTactic 2.6.2 95% of Capital Projects completed within the original construction contract amount or
Guaranteed Maximum Price (GMP) plus 3% new construction 5% renovation (contingency)
Measure: Percentage of projects completed within the original contract amount or GMP plus 3% (contingency).
Balanced Scorecard Category: Internal Business Process
Lead
Capital
41
Status
Tactic Measurement for 4th Quarter is 100%
STRATEGIC
REVIEW by Fiscal
Year (July-June)
# completed
on schedule
not
completed on
schedule
%
completed
on time
Summary FY-15 4 2 67%
Summary FY-16 3 5 38%
Summary FY-17 5 0 100%
1st Qtr. FY-18 0 0 0%
2nd Qtr. FY-18 3 0 100%
3rd Qtr. FY-18 4 1 80%
4th Qtr. FY-18 1 100%
67%
38%
100%
0%
100%
80%
100%
Goal 95%
Campus Infrastructure (Atkins)

Facilities Management Strategic Planning Session – Fourth Quarter FY 2018
GOAL #2 – Create a Reliable and Sustainable Physical InfrastructureObjective: 2.9: Develop a strategic plan for supporting research facilities, including installation of adequate redundant infrastructure to ensure continuous daily support(Action Plan only)
Lead: Facilities OperationsBalanced Scorecard Category: Customer Perspective
A C T I O N P L A N
42
Lead
F. O.
Actions Planned
1. Improvements and Upgrades to the MV power distribution system (Includes non destructive cable
testing, automated switching capability and equipment upgrades - Aug 2020 – needs funding)
2. Continue monthly and annual PM service on generators
3. Predictive maintenance -implement Di-electric Oil Testing on transformers (2020 - needs funding)
4. Monthly coordination meetings with critical facility customers – on-going
5. Continuing conversations with key customers on campus-wide Service Level Agreement (SLA) and
Memorandum of Understanding (August 2018)
6. Gathering critical systems data to assist Academic Affairs with their equipment maintenance
7. Working with lab managers to implement equipment monitoring system
Actions Completed
1. Hired critical facilities intern

Lead
Capital
GOAL #2 – Create a Reliable and Sustainable Physical Infrastructure
Objective 2.X Improve Customer Satisfaction for Capital Projects Clients (Proposed New Metric)Tactic 2.X.1 Substantive project updates provided no less than monthly for design and construction status
2.X.2 Score of 90% or better for key customer satisfaction survey metrics2.X.3 Significant customer issues addressed no later than the next business day
ACTION PLAN
Actions Complete• TBDActions Planned• PMs and CMs update and distribute monthly project updates with revised milestones and
descriptive narrative of project status• PMs and CMs invite stakeholders to key meetings and provide minutes to absentees and
ensure critical issues are addressed when key attendees are not present• PMs and CMs discuss evaluation metrics periodically with client before survey to ensure
desired scores are obtained• PMs and CMs discuss underperforming metrics with client after survey to determine why
desired scores were not obtained and to see if actions can be taken to warrant revised scoring
• When a client discusses - in person or via phone/email - a significant concern, the PM or CM addresses that concern immediately; when additional time is needed, at a minimum respond that the concern has been received and a response will be provided by some date certain
43

Coming Fall 2018
GOAL #3
Foster a Customer Focused Organization
“People don’t want to
communicate with an
organization or a computer.
They want to talk to a real, live,
responsive, responsible person
who will listen and help them
get satisfaction.”
- Theo Michelson, State Farm
Insurance

Facilities Management Strategic Planning Session – Fourth Quarter FY 2018
GOAL #3 Foster a Customer Focused Organization
Objective 3.1: Continuously improve customer service/satisfaction
Lead: Facilities Management WideBalanced Scorecard Category: Customer Perspective
45
Lead
FBO
ACTION PLAN FOR IMPROVEMENT
Publicity/Public Relations:
• Campus Construction Reports*: Online updates every four weeks. April, May, and June 14
• News Releases: Write and distribute through several media channels. Continual
Inside UNC Charlotte – Phil Jones receives Frank B. Turner Award, RecycleMania results and Earth Month participation shows improvement, Motor Fleet improves ranking in 100 Best Fleets program, Bruchok joins FM as director of capital projects, and Lizotte talks sustainability on ‘Sustainable Nation’ podcast
SYC Newsletter – Construction Update (published in Issue 44 on June 22)
Customer Communication Initiatives (interrelated):
• Customer Facing technology Ongoing
“Five-year Plan” List of Projects and Schedules tab and home page rotating header (updated monthly)
Tactic 3.1.1: Achieve overall customer satisfaction of 93% for FM services. Measure: Annual Customer Survey results: Percentage of customers selecting “fair, good or very good” with the statement:
“Overall I am satisfied with <the service> I received from Facilities Management”

Facilities Management Strategic Planning Session – Fourth Quarter FY 2018
GOAL #3 – Foster a Customer Focused OrganizationObjective: 3.1: Continuously improve customer service/satisfactionTactic: 3.1.2: Decrease the Number of Hot/Cold Calls by 20%Tactic: 3.1.4: 90% of Reactive Work Request Customers are satisfied or very satisfied
A C T I O N P L A N
46
Lead
F. O.
Actions Planned
1. Continue to work with customers; educate them on the UNC Charlotte Temperature Control Policy and monitor requests for accuracy
2. Continue to develop BAS Controls section and cross-train with Zones
3. Working with FIS on FIN Project upgrade
4. Develop Retro Commissioning program; hire retro commissioning tech (October 2018)
5. Develop and implement customer follow-up plan; updating survey customer service level and follow up (on-going)
6. Working with Capital; Retro-commissioning (Woodward and Grigg) Oct 2017 and Bio March 2018 (on-going)
Actions Completed
1. Implemented daily monitoring of temperature using BAS and field verification.
2. Hired BAS Controls Specialist – Jan 2018
3. Abolished BAS position and outsourced BAS support

Facilities Management Strategic Planning Session – Fourth Quarter FY 2018
GOAL #3 – Foster a Customer Focused OrganizationObjective: 3.1: Continuously improve customer service/satisfactionTactic: 3.1.2: Decrease the Number of Hot/Cold Calls by 20%Measure: Number of Hot/Cold Calls submitted on work requests
Lead: Facilities OperationsBalanced Scorecard Category: Customer Perspective
47
Lead
F. O.
5
25
45
65
85
105
125
145
165
185
205
1ST QTR FY18 2ND QTR FY18 3RD QTR FY18 4TH QTR FY18 ANNUAL AVERAGE
Too
Hot
95
TooHot56
Too Hot
61
TooHot57
TooHot67
TooCold
38
TooCold
90
Too Cold
51
TooCold
29
TooCold
66
Total133
Total146
Total 168
Total86
Total133
Decrease the Number of Hot/Cold Calls
Goal = Decrease Number by 20% (145 Total)
STATUS
4th
Quarter
STATUS
Annual

Actions taken by Members of the Design Services Team:
• Climate Survey Review Discussions and Improvements are improving Customer Communication.
• Over communicate – Document, document, document.
• Construction field reports for “hands on” Customers.
• Punch List reviews that include the Customer.
• Design Services Team Meetings include discussing effective Customer Service.
Facilities Management Strategic Planning Session – Fourth Quarter FY 2018
GOAL #3 – Foster a Customer Focused Organization
Objective: 3.1: Continuously Improve Customer Service and Customer Satisfaction
Lead: Design ServicesBalanced Scorecard Category: Internal Business Process
48
LeadDesign Services
Tactic 3.1.3: 95% of Informal Project Customers are Satisfied or More than SatisfiedMeasure: Results from Archibus – Design Services Projects Customer Survey
ACTION PLANS FOR IMPROVEMENT
Archibus - Design Services Customer Surveys:

Annual Status
90.5 %
QTR 4 Status
0 %
49
LeadDesign Services
Tactic 3.1.3: 95% of Informal Project Customers are Satisfied or More than SatisfiedMeasure: Results from Project Related Customer Surveys
Annual Goal
95%
QTR 4 Status
87.5 %
Survey Totals
by Fiscal Year
Number of
Surveys
issued
Number of
Survey
Responses
More than
Satisfied Satisfied
Less then
Satisfied
Percent
Satisfied
FY09 22 22 18 3 0 95.5%
FY10 30 30 18 5 0 76.7%
FY11 33 33 24 6 2 90.9%
FY12 31 31 27 2 0 93.5%
FY13 22 22 18 3 0 95.5%
FY14 24 24 18 3 0 87.5%
FY15 117 41 35 3 0 92.7%
FY16 115 32 28 4 0 100.0%
FY17 38 13 6 6 1 92.3%
FY18 91 21 13 6 2 90.5%
Q 1 20 3 2 1 0 100%
Q 2 15 5 4 0 1 80.0%
Q 3 18 5 3 2 0 100%
Q 4 38 8 4 3 1 87.5%
YEAR TO DATE 91 21 23%
GOAL: 95.0%
90.5%
95% of Informal Project Customers More than Satisfied or Satisfied with
Services Received
REPSONSE RATE - TOTAL
ANNUAL STATUS:
95.5%
76.7%
90.9% 93.5% 95.5% 87.5% 92.7%
100.0%
92.3%
90.5%
95%
85%
FY09 FY10 FY11 FY12 FY13 FY14 FY15 FY16 FY17 FY18
GOAL ALERT
Facilities Management Strategic Planning Session – Fourth Quarter FY 2018
GOAL #3 – Foster a Customer Focused Organization
Objective: 3.1: Continuously Improve Customer Service and Customer Satisfaction
Lead: Design ServicesBalanced Scorecard Category: Internal Business Process

Facilities Management Strategic Planning Session – Fourth Quarter FY 2018
GOAL #3 Foster a Customer Focused Organization
Objective 3.1: Continuously improve customer service/satisfaction
Lead: Facilities Business Office - CommunicationsBalanced Scorecard Category: Customer Perspective
50
Lead
FBO
SPECIAL PROJECTS
Ongoing:• FM Apprenticeship Program Communication/Marketing Plan• Light Rail Coordination Committee (member of the communications working group)• Digital Signage Steering Committee (campus-wide initiative)• Campus Congestion, Construction, and Parking Communication Plan (joint initiative with Christy Jackson
and Lou Ann Lamb) • (University) Crisis Communication Committee (member of stakeholders group)• Academic Complex Communication Plan (implementation underway)• “Five-year Plan” External Communication Plan (implementation underway)• “Five-year Plan” website (continual updates to projects listing, other areas as needed)• Traffic communications committee (joint initiative with University Communications):
Continue to seek guidance from AVC Initiative evolved with Notification updates posted to Inside UNC Charlotte
ACTION PLAN FOR IMPROVEMENT
Tactic 3.1.5: Build brand awarenessMeasure: Action Plan Only

Facilities Management Strategic Planning Session – Fourth Quarter FY 2018
GOAL #3 Foster a Customer Focused Organization
Objective 3.1: Continuously improve customer service/satisfaction
Lead: Facilities Business Office - CommunicationsBalanced Scorecard Category: Customer Perspective
51
Lead
FBO
SPECIAL PROJECTSCompleted:• Earth Month communication initiatives • FM Business Affairs Annual Report• SACSCOC Fifth-year audit narrative (13.7 Physical Facilities)• Web site briefing with AVC
Upcoming:• Assisting FO with revision of University Policy 708• FOPS/Lock and Key Shop Moves communication plan• FM Screens assessment and strategy plan• Reinstate Web Advisory Group (web site overhaul)• Establish FM Communications Task Force and Working Group• Develop department social media strategy• FM Communication Guidebook• Update Professional Communications Policy #10
ACTION PLAN FOR IMPROVEMENT
Tactic 3.1.5: Build brand awarenessMeasure: Action Plan Only

Coming Fall 2018
GOAL #4
Recruit, Develop, and Retain Quality Employees
"All growth depends upon activity.
There is no development
physically or intellectually without
effort, and effort means work."
-- Calvin Coolidge,
30th U.S. president

Facilities Management Strategic Planning Session – Fourth Quarter FY 2018
GOAL #4 Recruit, Develop and Retain Quality Employees
Objective 4.1: Recruit a Qualified Workforce in a Timely Fashion
Lead: Facilities Business OfficeBalanced Scorecard Category: Innovation & Learning
53
Lead
FBO
ONGOING AND CONTINUOUS – Through June 2018Recruitment and Retention Strategies:
New Interview Preparation Strategy
a) Meet with Hiring Manager for more insight on hiring needs
b) Position Description – Need more specific details of job duties
c) Hiring Manager to review and update (with guidance from FM HR) interview questions to meet the needs of the position
d) Gloria Verlezza will be the point of contact for creation of the interview guides
New Orientation/On-boarding process with main HR
ACTION PLAN FOR IMPROVEMENT
Tactic 4.1.1: Vacancy time of no longer than 80 calendar days – NonexemptVacancy time of no longer than 120 calendar days - Exempt
Tactic 4.1.2: Reduce Number of Employees Terminated During Probationary Period to less than 5%

Facilities Management Strategic Planning Session – Fourth Quarter FY 2018
GOAL #4 Recruit, Develop and Retain Quality Employees
Objective 4.1: Recruit a Qualified Workforce in a Timely Fashion
Lead: Facilities Business OfficeBalanced Scorecard Category: Innovation & Learning
Lead
FBO
54
Tactic 4.1.1: Vacancy time of no longer than 80 calendar days – NonexemptVacancy time of no longer than 120 calendar days - Exempt
Measure: Days needed to fill vacant positions
02
46
810
BES
Facilities Operations
Facilities Planning
Grounds
Lock Shop
Renovations
Zone 1
Zone 5
Zone 6
Capital Projects
Design Services
Facilities Operations
No
ne
xem
pt
Exe
mp
t
9
17
1
1
3
2
1
1
1
1
1
1
2
1
1
FM New Hires / Promotions perUnit - 4th Quarter FY 2018
Transfers Promotions New Hires
0
5
10
15
20
25
30
Nonexempt Exempt
24
2
3
1
4
FM New Hire/ Promotion 4th Quarter FY 2018
New Hire Promotions Transfer
4th Qtr.New Hires = 26Promotions = 4
Transfers = 4
FY 18 TotalNew Hires = 78Promotions = 30Transfers = 10

Facilities Management Strategic Planning Session – Fourth Quarter FY 2018
GOAL #4 Recruit, Develop and Retain Quality Employees
Objective 4.1: Recruit a Qualified Workforce in a Timely Fashion
Lead: Facilities Business OfficeBalanced Scorecard Category: Innovation & Learning
55
STATUS
Lead
FBO
Tactic 4.1.1: Vacancy time of no longer than 80 calendar days – NonexemptVacancy time of no longer than 120 calendar days - Exempt
Measure: Days needed to fill vacant positions
0
20
40
60
80
100
120
140
160
Q1 Q2 Q3 Q4
2822
26
31
109
128
142
164
Average Number of Days to Fill Nonexempt Vacancies - FY 2018
# of Nonexempt Hires/Prom/Trans Average Number of Days
T Target = 80
Calendar Days
FY 18 AverageAverage = 136 daysTarget = 80 daysMissed by = 56 days

Facilities Management Strategic Planning Session – Fourth Quarter FY 2018
GOAL #4 Recruit, Develop and Retain Quality Employees
Objective 4.1: Recruit a Qualified Workforce in a Timely Fashion
Lead: Facilities Business OfficeBalanced Scorecard Category: Innovation & Learning
56
Lead
FBO
Tactic 4.1.1: Vacancy time of no longer than 80 calendar days – NonexemptVacancy time of no longer than 120 calendar days - Exempt
Measure: Days needed to fill vacant positions
STATUS
0
20
40
60
80
100
120
140
160
180
200
220
240
260
Q1 Q2 Q3 Q4
4 3 1 3
239
187
137 150
Average Number of Days to Fill Exempt (Salaried) Vacancies - FY 2018
# of Exempt Hires/Prom Average Number of Days
FY 18 AverageAverage = 178 daysTarget = 120 daysMissed by = 58 days
Target = 120
Calendar Days

Facilities Management Strategic Planning Session – Fourth Quarter FY 2018
GOAL #4 Recruit, Develop and Retain Quality Employees
Objective 4.1: Recruit a Qualified Workforce in a Timely Fashion
Lead: Facilities Business OfficeBalanced Scorecard Category: Innovation & Learning
ONGOING AND CONTINUOUS – Through June 2018
• 2017/2018 Performance Appraisal Process is completed
• Work Plans were due June 30, 2018. We still have some outstanding
• Off-cycle Reviews – Supervisors please remember to do Off-cycle reviews in NinerTalent quarterly. This is an
informal process to give feedback on performance
• Employee Relations Issues – Charleata Neal and Leigh Richardson are the points of contact. Charleata can be
reached at 7-8470 and Leigh can be reached at 7-8002
57
ACTION PLAN FOR IMPROVEMENT
Tactic 4.1.2: Reduce Number of Employees Terminated During Probationary Period to less than 5%Measure:
Lead
FBO
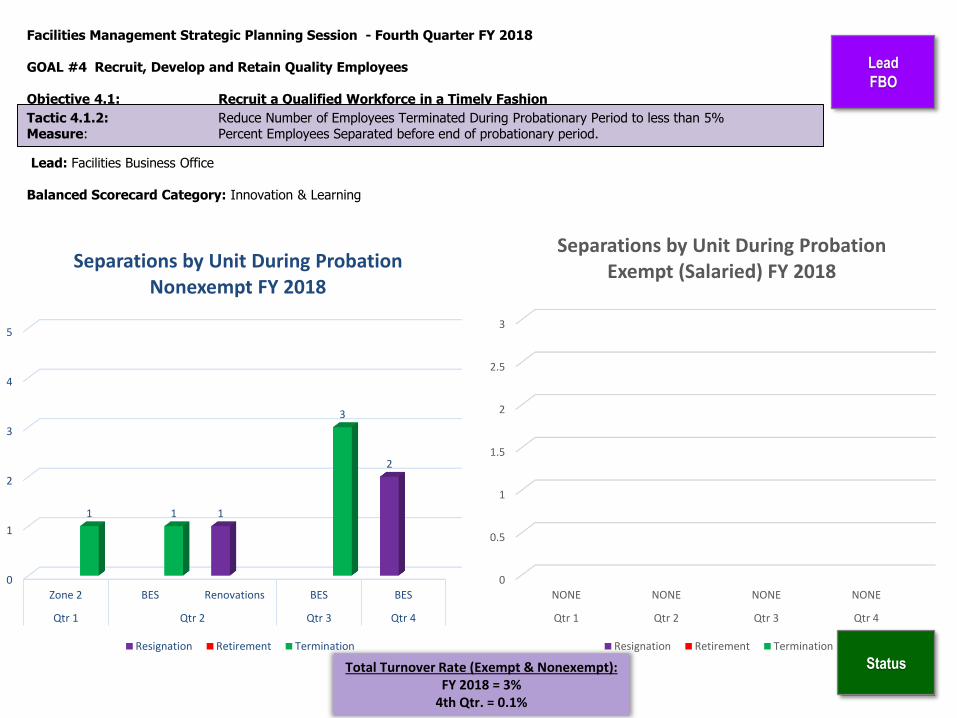
Facilities Management Strategic Planning Session - Fourth Quarter FY 2018
GOAL #4 Recruit, Develop and Retain Quality Employees
Objective 4.1: Recruit a Qualified Workforce in a Timely Fashion
Lead: Facilities Business Office
Balanced Scorecard Category: Innovation & Learning
Lead
FBO
58
Status
Tactic 4.1.2: Reduce Number of Employees Terminated During Probationary Period to less than 5%Measure: Percent Employees Separated before end of probationary period.
0
1
2
3
4
5
Zone 2 BES Renovations BES BES
Qtr 1 Qtr 2 Qtr 3 Qtr 4
1
2
1 1
3
Separations by Unit During Probation Nonexempt FY 2018
Resignation Retirement Termination
0
0.5
1
1.5
2
2.5
3
NONE NONE NONE NONE
Qtr 1 Qtr 2 Qtr 3 Qtr 4
Separations by Unit During Probation Exempt (Salaried) FY 2018
Resignation Retirement Termination
Total Turnover Rate (Exempt & Nonexempt):FY 2018 = 3%
4th Qtr. = 0.1%
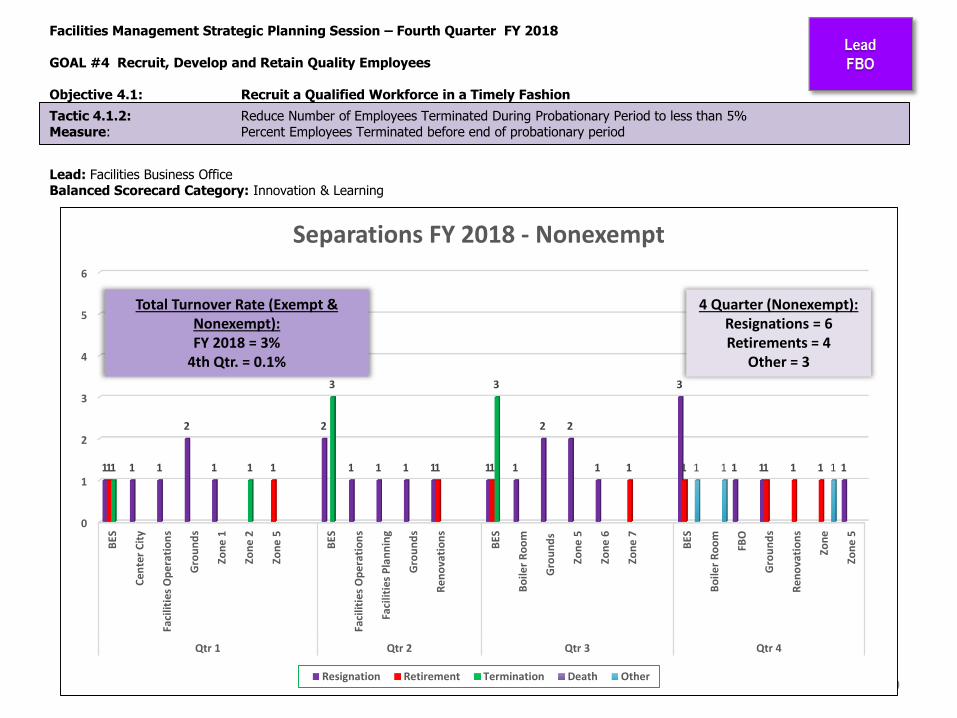
Facilities Management Strategic Planning Session – Fourth Quarter FY 2018
GOAL #4 Recruit, Develop and Retain Quality Employees
Objective 4.1: Recruit a Qualified Workforce in a Timely Fashion
Lead: Facilities Business OfficeBalanced Scorecard Category: Innovation & Learning
59
Tactic 4.1.2: Reduce Number of Employees Terminated During Probationary Period to less than 5%Measure: Percent Employees Terminated before end of probationary period
0
1
2
3
4
5
6
BES
Cen
ter
Cit
y
Faci
litie
s O
pe
rati
on
s
Gro
un
ds
Zon
e 1
Zon
e 2
Zon
e 5
BES
Faci
litie
s O
pe
rati
on
s
Faci
litie
s P
lan
nin
g
Gro
un
ds
Re
no
vati
on
s
BES
Bo
iler
Ro
om
Gro
un
ds
Zon
e 5
Zon
e 6
Zon
e 7
BES
Bo
iler
Ro
om
FBO
Gro
un
ds
Re
no
vati
on
s
Zon
e
Zon
e 5
Qtr 1 Qtr 2 Qtr 3 Qtr 4
1 1 1
2
1
2
1 1 1 1 1 1
2 2
1
3
1 1 11 1 1 1 1 1 1 1 11 1
3 3
1 1 1
Separations FY 2018 - Nonexempt
Resignation Retirement Termination Death Other
Total Turnover Rate (Exempt & Nonexempt):FY 2018 = 3%
4th Qtr. = 0.1%
4 Quarter (Nonexempt): Resignations = 6Retirements = 4
Other = 3

Facilities Management Strategic Planning Session – Fourth Quarter FY 2018
GOAL #4 Recruit, Develop and Retain Quality Employees
Objective 4.1: Recruit a Qualified Workforce in a Timely Fashion
Lead: Facilities Business OfficeBalanced Scorecard Category: Innovation & Learning
60
Tactic 4.1.2: Reduce Number of Employees Terminated During Probationary Period to less than 5%Measure: Percent Employees Terminated before end of probationary period
0
0.5
1
1.5
2
2.5
3
FIS Capital Projects Capital Projects Design Services
Qtr 1 Qtr 2 Qtr 3 Qtr 4
1 1
0
1 1
Separations FY 2018 - Exempt
Resignation Retirement Termination Death
Total Turnover Rate (Exempt & Nonexempt):FY 2018 = 3%
4th Qtr. = 0.1%
4 Quarter (Exempt): Resignations = 1Retirements = 1
Other = 0

Facilities Management Strategic Planning Session – Fourth Quarter FY 2018
GOAL #4 Recruit, Develop and Retain Quality Employees
Objective 4.2: Improve Workforce Development
Lead: Facilities Business OfficeBalanced Scorecard Category: Internal Business Process, Learning and Growth
Lead
FBO
Departmental Development
• FM Apprenticeship Program developments to date:• Apprentice(s) will participate in a four year program consisting of mentored OJT and classroom instruction.
• DOL Journeyman Credential received upon successful completion of program.• Committee in place working with program standards and operational guidelines• Steering Committee and Workgroups identified (HR, L&D, FO, Marketing)• Program Standards completed • Engaging with community colleges (CPCC & RCCC) to create educational partnerships • Apprentice Position Description submitted to campus HR. • Electrician apprentice positions approved for recruitment (HVAC positions to be added later)• FBO-Communications is creating marketing materials and a webpage with FAQs to be updated as needed.
• Program status as of July 2018: Facilities Management has decided to push back the apprentice hire date until spring 2019
• Mentors will be identified and trained (which will meet program approval requirements.) Mentors to be granted 75% credit towards DOL Journeyman credential• Currently developing Mentor training materials• Provisional Approval for FM Apprenticeship program received from Apprenticeship NC
61
ACTION PLAN FOR IMPROVEMENT
Tactic 4.2.1: Increase Supervisor/Manager Training to 40 hours/yearTactic 4.2.2: Increase Employee Training to 20 hours/year

Facilities Management Strategic Planning Session – Fourth Quarter FY 2018
GOAL #4 Recruit, Develop and Retain Quality Employees
Objective 4.2: Improve Workforce Development
Lead: Facilities Business OfficeBalanced Scorecard Category: Internal Business Process, Learning and Growth
62
Lead
FBO
Annual Target
0
400
800
1200
1600
2000
1st Qtr2nd Qtr
3rd Qtr4th Qtr
FY 18Training Hours for Supervisors & Managers by Quarter
Training Hours by QTR
YTD Training Hours
TrainingHours
FY 2018 Target - 1,960 hrs
-----------------------------Actual YTD
1,227 hrs (57 %)
Tactic 4.2.1: Increase Supervisor/Manager Training to 40 hours/yearMeasure: Average Hours of Training completed by Supervisors and Managers
Annual
668 hrs
103 hrs
771 hrs937 hrs
166 hrs
1,110 hrs
173 hrs

Facilities Management Strategic Planning Session – Fourth Quarter FY 2018
GOAL #4 Recruit, Develop and Retain Quality Employees
Objective 4.2: Improve Workforce Development
Lead: Facilities Business OfficeBalanced Scorecard Category: Internal Business Process. Learning and Growth
63
Lead
FBO
Annual Target
0
1000
2000
3000
4000
5000
6000
7000
8000
Q1Q2
Q3Q4
FY 18Training Hours for front line employees by Quarter
Training Hours by QTR
YTD Training Hours
Annual
FY 2018 Annual Target - 7,760 hrs
---------------------------Actual YTD
6,194 hrs (80 %)
Training Hours
Tactic 4.2.2: Increase Employee Training to 20 hours/yearMeasure: Average Hours of Training completed by front line employees
3,375.5 hrs
870 hrs
4,645.5 hrs
946 hrs
602 hrs
5592 hrs6,194 hrs
Facilities Management Strategic Planning Session – Fourth Quarter FY 2018
GOAL #4 Recruit, Develop and Retain Quality Employees
Objective 4.3: Create and Maintain a Quality Work Environment
Lead: Facilities Business OfficeBalanced Scorecard Category: Customer Perspective
Survey Logistics:
• Survey findings:
– Report distributed May 2017;
– Briefing to AVC-FM and directors – July 18, 2017;
– Briefing to staff – 4th Quarter AEM (August)
• Next Steps:
– Develop action plan to address issues identified in survey.
64
Lead
FBO
ACTION PLAN FOR IMPROVEMENT
Tactic 4.3.1: 90% of Employees satisfied or very satisfied working in FMTactic 4.3.2: 87% of Employees satisfied or very satisfied in each unit of FM

Facilities Management Strategic Planning Session – Fourth Quarter FY 2018
GOAL #4 Recruit, Develop and Retain Quality Employees
Objective 4.3: Create and Maintain a Quality Work Environment
Lead: Facilities Business OfficeBalanced Scorecard Category: Customer Perspective
65
Lead
F. O.
STATUS
Lead
FBO
Tactic 4.3.1: 90% of Employees satisfied or very satisfied working in FMMeasure: Annual Employee Work Climate Survey

Facilities Management Strategic Planning Session – Fourth Quarter FY 2018
GOAL #4 Recruit, Develop and Retain Quality Employees
Objective 4.4: Improve Employee Safety
Lead: FM WideBalanced Scorecard Category: Innovation and Learning Perspective
66
Lead
FM Wide
Efforts to reduce accidents: (412 hours of safety training recorded)
• Safety Training - 4th Qtr. training hours recorded – 412 hours• Hearing Conservation training• Heat Stress Awareness• Archibus WR Console training
• Safety related activities:• FM Safety Committee meeting - Bi-monthly• Supervisor Safety Talks training – Monthly
• July – Working in the Heat• Aug – Slips, Trips, and Falls
• 8th Annual FM Safety Fair – May 2nd at Hauser Pavilion• 10th annual FM Safety Slogan Contest – winner to be announced at July AEM
• Current Accident/Incident Stats (CY18)• Accidents - 19• Minor incidents - 1• Near Miss - 0
ACTION PLAN FOR IMPROVEMENT
Tactic 4.4.1: Reduce the number of reportable accidents by 20%Tactic 4.4.2: 98% of Mandatory Compliance Training completed annually

26
24
17
24
19
1112
21
12
27
19
2
01
5
7
12
6
12
1
0
5
10
15
20
25
30
2008 2009 2010 2011 2012 2013 2014 2015 2016 2017 2018Accidents First Aid Only
Facilities Management Strategic Planning Session – Fourth Quarter FY 2018
GOAL #4 Recruit, Develop and Retain Quality Employees
Objective 4.4: Improve Employee Safety
Lead: FM WideBalanced Scorecard Category: Innovation and Learning Perspective
CY 2018 Improvement Target -
reduce incidents by
20% over 2017 (≤ 21)
Lead
FM Wide
67
FM Accident Trends
Tactic 4.4.1: Reduce the number of reportable accidents by 20%Measure: Number of Reportable Accidents (Measured by Calendar Year)
Annual
YTD

Facilities Management Strategic Planning Session – Fourth Quarter FY 2018
GOAL #4 Recruit, Develop and Retain Quality Employees
Objective 4.5: Improve Workforce Performance (Action Plan Only)
Lead: Facilities Business OfficeBalanced Scorecard Category: Innovation and Learning Perspective
68
Lead
F. O.
Lead
FM Wide
Action Item ________ Target Date
ACTION PLAN FOR IMPROVEMENT
• FM Apprenticeship Program
• Apprentice(s) will participate in a four year program consisting of mentored OJT and designated classroom instruction. DOL Journeyman Certification received upon successful completion of program.
• Committee in place working with program standards and operational guidelines
• Steering Committee and Workgroups identified
• Program Standards completed
• Engaging with community colleges (CPCC & RCCC) to create educational partnerships
• Program status as of July 2018: the decision was made in Facilities Management to move apprentice recruitment to spring 2019
• Minimum requirement of 6 months of classroom based experience added
• Mentors will be identified and trained which will meet initial approval requirements.
• Mentors to be granted 75% credit towards DOL Journeyman credential after three months
• FM received Provisional Approval from Apprenticeship NC in April 2018.
(Continued on next slide)
FM Academy

Facilities Management Strategic Planning Session – Fourth Quarter FY 2018
GOAL #4 Recruit, Develop and Retain Quality Employees
Objective 4.5: Improve Workforce Performance (Action Plan Only)
Lead: Facilities Business OfficeBalanced Scorecard Category: Innovation and Learning Perspective
69
Lead
F. O.
Lead
FM Wide
Action Item ________ Target Date
ACTION PLAN FOR IMPROVEMENT
• Leadership – APPA leadership workshops– APPA Leadership Academy (Level 1 – proposed dependent on funding availability) TBD
– APPA Leadership Academy (Levels 2-4, proposed dependent on funding availability) TBD
• Digital Training Records System
– Records system launched March
– Version 2.0 enhancements to include reports capability June
– FM Training Calendar created (shared with EHS)
FM Academy

70
Facilities Management Strategic Planning Session – Fourth Quarter FY 2018
GOAL #4 Recruit, Develop and Retain Quality Employees
Objective 4.5: Improve Workforce Performance (Action Plan Only)
Lead: Facilities Business OfficeBalanced Scorecard Category: Innovation and Learning Perspective
4,1673,855
3,440
6,194
1,3041,636
1,178 1,110
0
1,000
2,000
3,000
4,000
5,000
6,000
7,000
FY 15 FY 16 FY 17 FY 18
HO
UR
S
Training Hours Comparison
Employee
Manager

Coming Fall 2018
GOAL #5
Promote Good Stewardship
"The more positive you are
when you think and work
toward your goals, the faster
you achieve them.”
-- Brian Tracy, Speaker, Author,
Consultant

Facilities Management Strategic Planning Session – Fourth Quarter FY 2018
GOAL #5 Promote Good Stewardship
Objective 5.1: Promote Fiscal Responsibility
Lead: Facilities Business OfficeBalanced Scorecard Category: Financial Perspective
Finance/Budget:• Preparations for year-end are now underway to include:
– more frequent communication,
– analysis of where we actually stand;
– Incorporation of Admin Unit Supervisor (Sofsky) into FBO YE prep meetings: May – June 2018; Process will be reinstituted in January 2019.
Budget Memo and Instructions • Based on results from submittals and solicited feedback, the FBO has begun making improvements to
instruction manual and spreadsheets for FY19;
Supplemental Grant/Award Funding:• Search for grant and award possibilities for Facilities Management organizations. For those grants requiring
matching funds, ensure buy-in from AVC prior to submitting proposals each fiscal year;
• Encourage use of APPA grant and award program to supplement funding within FM.
• Investigating grant for apprenticeship program under USDOL underway.
72
Lead
FBO
ACTION PLAN FOR IMPROVEMENT
Tactic 5.1.1: 100% of financial accounts within budgetTactic 5.1.2: Increase Supplemental Funding to the Department by 10% annuallyTactic 5.1.3: Achieve Administrative cost/GSF ± 5% of APPA Average for Peer Institutions

Facilities Management Strategic Planning Session – Fourth Quarter FY 2018
GOAL #5 Promote Good Stewardship
Objective 5.1: Promote Fiscal Responsibility
Lead: Facilities Business OfficeBalanced Scorecard Category: Financial Perspective
Cost Accounting: Ongoing and Continuous Improvements
• Continuously work on strategy to improve cost accounting measures within all areas of Facilities Management;
• Analysis of receipts supported funds to begin in FY19 for Labor Services. First steps include the creation of a new MRO pass-through fund for FO for all non-personnel transaction. Effective Date =-July 1, 2018;
• Spending trend analysis to assist with better budget projections for maintenance and service agreements is also underway. Anticipated completion: July 2018
• Financial Reports Budget Spreadsheet reviewed for reporting improvements; New spreadsheet will roll out in FY 19 (July); New budget meetings will commence in FY 19;
• Still struggling with the new FTR electronic process implemented by Financial Services.
APPA Administrative Cost/GSF Analysis:
• APPA FY 18 FPI and NACUBO Key Metrics Surveys should open in July 2018;
• Cost per GSF for administration – analysis for past 5 years completed.
73
Lead
FBO
ACTION PLAN FOR IMPROVEMENT
Tactic 5.1.1: 100% of financial accounts within budgetTactic 5.1.2: Increase Supplemental Funding to the Department by 10% annuallyTactic 5.1.3: Achieve Administrative cost/GSF ± 5% of APPA Average for Peer Institutions
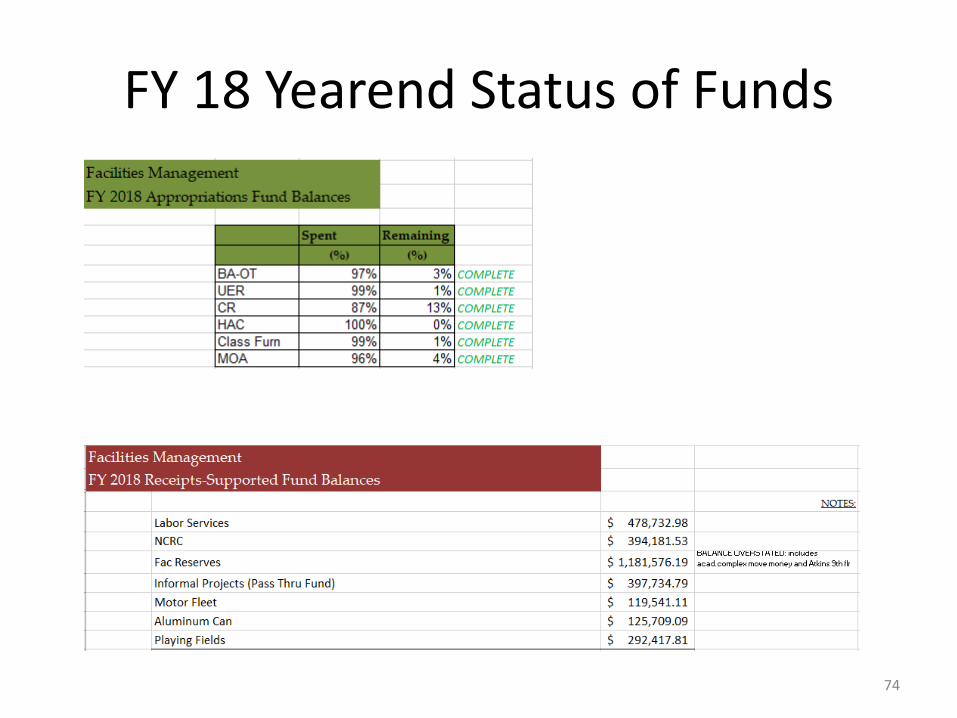
FY 18 Yearend Status of Funds
74

FM Operational Base Budget FY 18
75

Facilities Management Strategic Planning Session – Fourth Quarter FY 2018
GOAL #5 Promote Good Stewardship
Objective 5.1: Promote Fiscal Responsibility
Lead: Facilities Business OfficeBalanced Scorecard Category: Financial Perspective
76
Lead
FBO
Overall APPA Avg. = $0.54SRAPPA Avg = $0.45Target = $0.4275 (-5%)UNC Charlotte = $0.85
ANNUAL
Tactic 5.1.3: Achieve Administrative cost/GSF ± 5% of APPA Average for Peer InstitutionsMeasure: Administrative cost/GSF from annual APPA Facilities Performance Indicators Report
(APPA Benchmark)
Overall Avg (16-17)

GOAL #5 –Promote Good Stewardship
Objective: 5.1: Promote Fiscal ResponsibilityTactic 5.1.4: Achieve Custodial Costs/Student FTE Plus or Minus 5% of the APPA Average for Peer Institutions
(Internal UNC Peers = East Carolina)(National Peers – Portland State University, University of New Mexico, University of Texas at San Antonio)
ACTION PLAN
• Actions Planned
– Implement In-House Temp System (8/2018)
– Implement separate budget for Floor Crew (8/2018)
– Development of BES&R 3-year plan with budget projections (10/2018)
– Implement team cleaning model throughout all BES zones (3/2022)
– Monitor and report custodial cost/student FTE on an annual basis using data from APPA survey (Ongoing)
– Develop a BES strategic dashboard that tracks cost, quality, and process data points over time (Ongoing)
– Developed Production Tracking tool based on attendance and staffing (Ongoing tracking)
77
LeadBES

78
Facilities Management Strategic Planning Session – Fourth Quarter FY 2018
GOAL #5 –Promote Good Stewardship
Objective: 5.1: Promote Fiscal ResponsibilityTactic 5.1.4: Achieve Custodial Costs/Student between Plus or Minus 5% of the APPA Average for Peer Institutions (Internal UNC
Peers = East Carolina, UNC Greensboro) (National Peers – Kent State University, Old Dominion University, Portland State University, University of Colorado at Denver, Western Michigan, University of Texas at San Antonio)
Measure: Custodial Costs/Student from annual APPA Facilities Performance Indicators Report (APPA Benchmark) = Salaries + Supplies/Student FTE
Balanced Scorecard Category: Financial Perspective
LeadBES
Avg. cost/student = $231.08
UNCC = 4.08% above average
STATUS $-
$50.00
$100.00
$150.00
$200.00
$250.00
$300.00
$350.00
$400.00
$450.00
$500.00
$200.13 $207.60 $228.69
$121.79
$200.40
$490.71
$267.06
$122.87
$240.51
Custodial - Total Cost / Student
East Carolina University
Kent State University
Old Dominion University
Portland State University
Univ. of Colorado/Denver
Western Michigan University
UNC Greensboro
UTX San Antonio
UNC Charlotte

Facilities Management Strategic Planning Session – Fourth Quarter FY2018
GOAL #5 – Promote Good StewardshipObjective: 5.1: Promote Fiscal ResponsibilityTactic: 5.1.5: Achieve total Maintenance cost/GSF ± 5% of APPA Average for Peer InstitutionsTactic: 5.1.6: Achieve total Landscape cost/acre ± 5% of APPA Average for Peer InstitutionsTactic: 5.1.7: All Receipt Supported Funds Accounts have a positive balance at the end of the fiscal year
79
Actions Planned
1. Establish guidelines for qualifying reimbursable vs non-reimbursable work requests (To Charge or Not to Charge) by Aug 2018.
2. Weekly tracking of earnings with the FBO. 3. FBO to create separate FM MRO account (July 2018).
Actions Completed
1. Completed APPA survey.2. Holding vacant labor services positions.
A C T I O N P L A N

Facilities Management Strategic Planning Session – Fourth Quarter FY 2018
GOAL #5 – Promote Good StewardshipObjective: 5.1: Promote Fiscal ResponsibilityTactic: 5.1.5: Achieve total Maintenance cost/GSF ± 5% of APPA Average for Peer Institutions $1.42 per GSFMeasure: Maintenance cost/GSF from annual APPA Facilities Performance Indicators Report (APPA Benchmark)
Lead: Facilities OperationsBalanced Scorecard Category: Financial Perspective
Lead
F. O.
$2.30
$1.53
$0.72
$1.34
$2.10
$-
$0.50
$1.00
$1.50
$2.00
$2.50
UNC Charlotte University of
North Carolina at
Greensboro
University of
Texas at San
Antonio
Western Michigan
University
East Carolina
University
Maintenance Total Cost per GSF

Facilities Management Strategic Planning Session – Fourth Quarter FY 2018
GOAL #5 – Promote Good StewardshipObjective: 5.1: Promote Fiscal ResponsibilityTactic: 5.1.6: Achieve total Landscape cost/acre ± 5% of APPA Average for Peer Institutions - $5,267.60Measure: Landscape cost/acre from annual APPA Facilities Performance Indicators Report (APPA Benchmark)
Lead: Facilities OperationsBalanced Scorecard Category: Financial Perspective
Lead
F. O.
$3,605.31
$5,504.93
$7,218.98
$6,005.23
$2,341.27
$4,097.27
$-
$1,000.00
$2,000.00
$3,000.00
$4,000.00
$5,000.00
$6,000.00
$7,000.00
$8,000.00
University of North
Carolina at Charlotte
East Carolina
University
Portland State
University
University of North
Carolina at Greensboro
University of Texas at San Antonio
SRAPPA
Grounds Total Cost Per Acre

Facilities Management Strategic Planning Session – Fourth Quarter FY 2018
GOAL #5 – Promote Good StewardshipObjective: 5.1: Promote Fiscal ResponsibilityTactic: 5.1.7: All Receipt Supported Funds Accounts have a positive balance at the end of the fiscal yearMeasure: Dollars in account at end of fiscal year
Lead: Facilities OperationsBalanced Scorecard: Financial Perspective
82
Lead
F. O.
0% 10% 20% 30% 40% 50% 60% 70% 80% 90% 100%
$638,943 $575,529 $777,796 $569,812
$276,122 Estimated …
Dollars in Account at End of Fiscal Year
$2.92MEstimated
Annual Goal
Q1 Q2 Q3 Q4
22% 42% 68% 91%

Lead
Recycling
GOAL #5 – Promote Good Stewardship
Objective 5.2 Develop a Sustainable CampusObjective 5.2.2 Increase Percent of Solid Waste diversion on Campus to 45% by 2020
ACTION PLAN
Waste Reduction and Recycling
Actions Complete
• Education & Outreach Coordinator position hired – Steve Olson!!!
• Earth Month Activities – Tree Planting (57 trees planted); Campus Cleanup (110+ volunteers; 420+ lbs. litter picked up); Earth Day Celebration
• Move-out (with Housing and Residence Life). Collected items went to Salvation Army and Jamil Niner Student Pantry. (collected 15,300 lbs of food, clothing, and household goods)
• Updated Recycling Policy – 713. (submitted in May)
• Plastic film recycling started at the Student Union
• Waste Audits on all dining halls as well as a few academic buildings including FM/PPS (15% of trash could have been easily recycled, 56% of it could have been composted, and 29% of it really was trash)
83
1st Quarter Actions Planned• Reworking campus waste hauling contract (RFP needs to go out July/August) • Consistent labelling/signage project.• Football – Zero Waste Initiative.• Continue work with Chartwells (Mainstreet Market and Prospector begin compost programs this fall)

Facilities Management Strategic Planning Session – Fourth Quarter FY 2018
Tactic 5.2.2Increase Percent of Solid Waste Diversion on Campus to 45% by 2020Measure: Pounds of Solid Waste Recycled, composted and reusedAnnually divided by Total Solid Waste
Balanced Scorecard Category: Innovation and Learning Perspective
Lead
Recycling
84
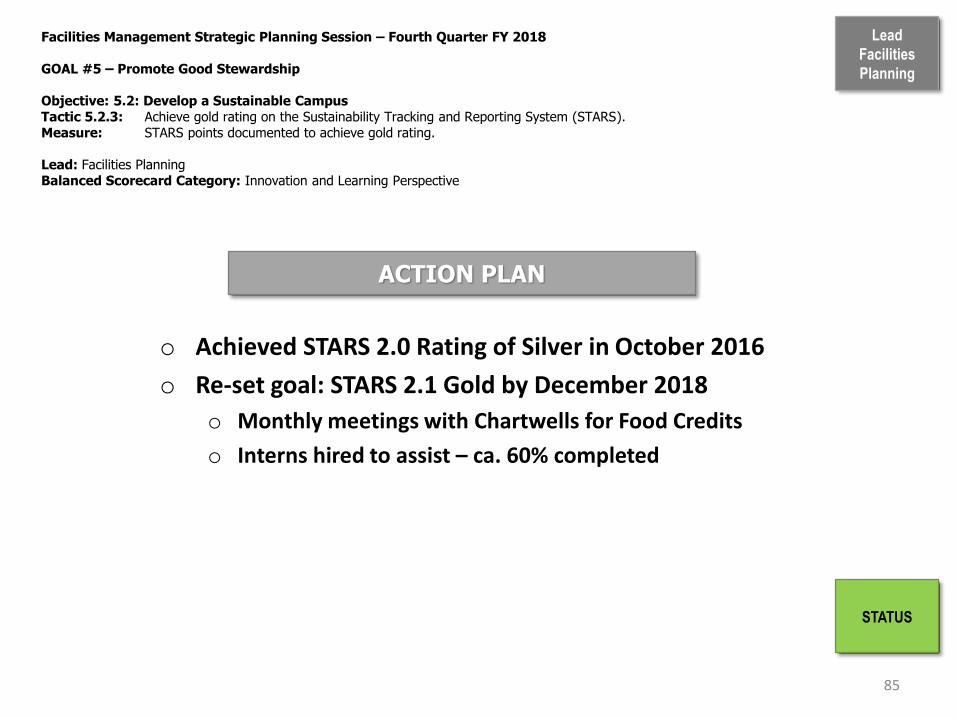
Facilities Management Strategic Planning Session – Fourth Quarter FY 2018
GOAL #5 – Promote Good Stewardship
Objective: 5.2: Develop a Sustainable CampusTactic 5.2.3: Achieve gold rating on the Sustainability Tracking and Reporting System (STARS).Measure: STARS points documented to achieve gold rating.
Lead: Facilities PlanningBalanced Scorecard Category: Innovation and Learning Perspective
85
ACTION PLAN
o Achieved STARS 2.0 Rating of Silver in October 2016
o Re-set goal: STARS 2.1 Gold by December 2018
o Monthly meetings with Chartwells for Food Credits
o Interns hired to assist – ca. 60% completed
Lead
Facilities
Planning
STATUS
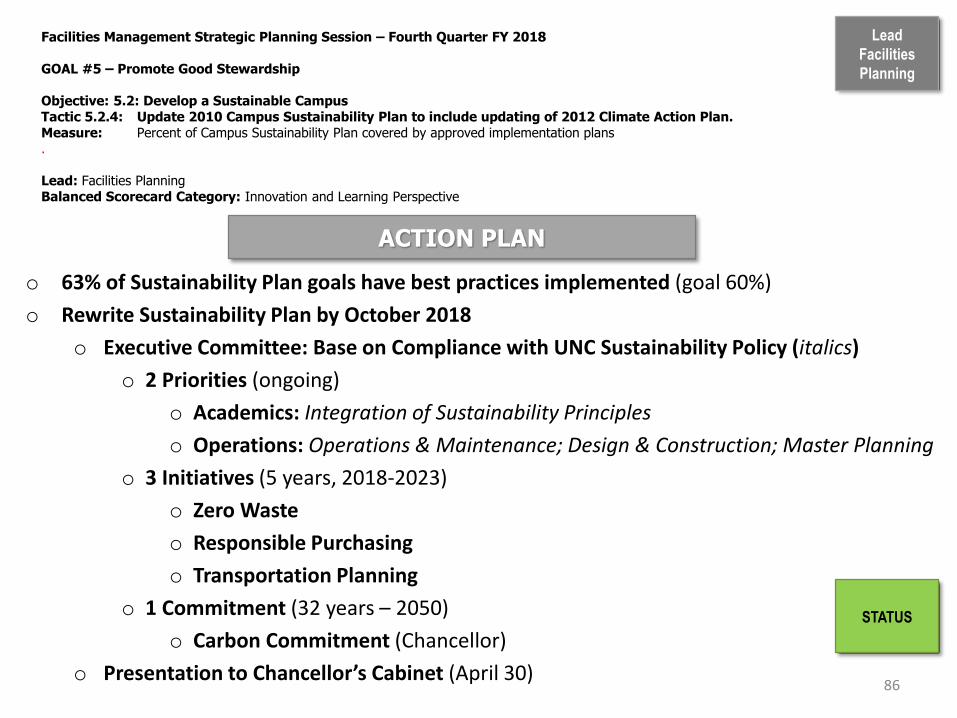
Facilities Management Strategic Planning Session – Fourth Quarter FY 2018
GOAL #5 – Promote Good Stewardship
Objective: 5.2: Develop a Sustainable CampusTactic 5.2.4: Update 2010 Campus Sustainability Plan to include updating of 2012 Climate Action Plan.Measure: Percent of Campus Sustainability Plan covered by approved implementation plans.
Lead: Facilities PlanningBalanced Scorecard Category: Innovation and Learning Perspective
86
ACTION PLAN
o 63% of Sustainability Plan goals have best practices implemented (goal 60%)
o Rewrite Sustainability Plan by October 2018
o Executive Committee: Base on Compliance with UNC Sustainability Policy (italics)
o 2 Priorities (ongoing)
o Academics: Integration of Sustainability Principles
o Operations: Operations & Maintenance; Design & Construction; Master Planning
o 3 Initiatives (5 years, 2018-2023)
o Zero Waste
o Responsible Purchasing
o Transportation Planning
o 1 Commitment (32 years – 2050)
o Carbon Commitment (Chancellor)
o Presentation to Chancellor’s Cabinet (April 30)
Lead
Facilities
Planning
STATUS

Lead
Capital
GOAL #5 – Promote Good Stewardship
Objective 5.3 Conserve Natural ResourcesTactics 5.3.1 Decrease Energy Usage 40% by FY2025
ACTIONS TO REDUCE CAMPUS ENERGY USAGE
87
• Retro-commissioning program
• Begin Bioinformatics on July 30 / Still working on King internally –
continue to Retro-Cx at least one building each FY
• Strong emphasis to continue on energy usage reduction in Woodward
(looking at temp. setback on “A-wing”, looking at ultrasonic
occupancy sensors installation)
• Activation of Load Shedding program on BAS RUP1 close to
completion
• Cold weather in FY18 had major negative impact on Kbtu/GSF
• Repair Campus energy metering in BAS, JACE or the meters themselves
• WARNING! – Going the wrong way toward reduction !

Facilities Management Strategic Planning Session – 4th Qtr. FY 2018
GOAL #5 – Promote Good Stewardship
Objective 5.3 Conserve Natural ResourcesTactics 5.3.1 Decrease Energy Usage by 40% by FY2025
Measure: KBTUs/GSF/Year consumed on campus
Balanced Scorecard Category: Financial Perspective
Lead
Capital
STATUS
CAMPUS ENERGY USAGE
Kbtu/GSF
Base Year FY 2003 Current Reduction 29%Goal of 40% by 2025
124
113109
93 9082.5 81.3 80.7
87.9
74
0
20
40
60
80
100
120
140
FY03 FY11 FY12 FY13 FY14 FY15 FY16 FY17 FY18 FY25GOAL
KB
TU/G
SF

Lead
CapitalGOAL #5 – Promote Good Stewardship – Fourth Quarter FY2018
Objective 5.4: Improve Historically Underutilized Businesses (HUB) ParticipationTactic 5.4.1: 12% HUB participation on 80% of Capital Projects Tactic 5.4.2: 5% African American Participation on Capital Projects
ACTION PLAN
Continue . . . Establish project specific participation goals for single prime projects;
Parking Lots Revitalization – 10% goal / 72% achieved
Sycamore Hall Renovation – 15% goal / 53% achieved
CRI Entrance Improvements – 15% goal / 26% achieved
Challenge GCs to obtain 25% or better participation on CMAR projects
Review Good Faith Effort documentation for compliance
Work with internal/external groups to identify skilled subcontractors
Encourage firms to bid our work
89

Facilities Management Strategic Planning Session – Fourth Quarter FY2018
GOAL #5 – Promote Good Stewardship
Objective: 5.4: Improve Historically Underutilized Businesses (HUB) ParticipationTactic 5.4.1: 12% HUB participation on 80% of Capital Projects Measure: Number of Individual Capital Projects achieving 12% HUB participation divided into Total Projects CompletedLead: Capital Projects
Balanced Scorecard Category: Financial Perspective
Lead
Capital
90
FY 2018
STATUS
4thQtr
STATUS
0
2
4
6
8
10
PR
OJE
CT
S
HUB Participation Capital Projects > $500,000
Total Projects Completed
Projects with 12% HUBParticipation
80% GOAL
50%100%
100%
__
86%

Facilities Management Strategic Planning Session – Fourth Quarter FY2018
GOAL #5 – Promote Good Stewardship
Objective: 5.4: Improve Historically Underutilized Businesses (HUB) Participation Tactic 5.4.2: 5% African American Participation on Capital ProjectsMeasure: Total Capital Dollars awarded to African American Contractors divided by Total Contract Dollars Lead: Capital Projects
Balanced Scorecard Category: Financial Perspective
Lead
Capital
91
FY 2018
STATUS
4thQtr
STATUS
__$0
$5,000,000
$10,000,000
$15,000,000
$20,000,000
$25,000,000
$30,000,000
$35,000,000
$40,000,000
$45,000,000
Capital Projects African American Participation
Total Capital Project Dollars
Capital Project Dollars w/AfricanAmerican Firms
5% GOAL
11%
__12%
12%
0%

Facilities Management Strategic Planning Session – Fourth Quarter FY2018
GOAL #5 – Promote Good Stewardship
Objective: 5.4: Improve Historically Underutilized Businesses (HUB) ParticipationTactic 5.4.3: 15% overall HUB participation on Informal contracts $30,000 and above Measure: Total Informal Contract Dollars awarded to HUB Contractors divided by Total Contract DollarsLead: Capital ProjectsBalanced Scorecard Category: Financial Perspective
Lead
Capital
92
FY 2018
STATUS
4thQtr
STATUS
$0
$1,000,000
$2,000,000
$3,000,000
$4,000,000
$5,000,000
$6,000,000
$7,000,000
$8,000,000
HUB Participation Informal Projects >$30,000
Total InformalProject Dollars
Informal ProjectDollars w/HUBFirms
15% GOAL89%
91%87%
97%84%

Facilities Management Strategic Planning Session – Fourth Quarter FY 2018
GOAL #5 – Promote Good Stewardship
Objective: 5.4: Improve Historically Underutilized Business (HUB) Participation
Lead: Design ServicesBalanced Scorecard Category: Internal Business Process
93
LeadDesign Services
Tactic 5.4.4: 13% Overall HUB Participation on Informal Projects Below $30,000 Including 3% African AmericanMeasure: Total Percentage of HUB Participation on Informal Projects’ Contracts Below $30,000 (Construction only) Divided by Total Contracts
Tactic 5.4.5: 3% African American Participation on Informal Projects Below $30,000Measure: Total African American Contract Dollars (Construction only) Divided by Total Construction Contract Dollars
Design Services’ HUB participation improvement is focused on expanding outreach to new African American contractors & vendors.
All Coordinators are encouraged to reach out to new vendors for work on our Under $30K projects - Ongoing.
ACTION PLANS FOR IMPROVEMENT
ONGOING IMPROVEMENTS
NEW IMPROVEMENTS
Design Services team continues to review and discuss HUB contractors and vendors at Design Services bi-weekly meetings.
Evamarie started a new procedure welcoming any HUB company to present to Design Services team prior to our Team meetings.
The Boswell Group - Electrical & Plumbing Contractor - State of North Carolina HUB Certified Woman-OwnedMonroe, North Carolina
Continue outreach for more African American vendors: Amanda Caudle as lead with Ashley Sisco, and Evamarie Spataro assisting.

Facilities Management Strategic Planning Session – Fourth Quarter FY 2018
GOAL #5 – Promote Good Stewardship
Objective: 5.4: Improve Historically Underutilized Business (HUB) Participation
Lead: Design ServicesBalanced Scorecard Category: Internal Business Process
94
LeadDesign Services
13% Overall HUB Participation – Summary Graph
Tactic 5.4.4: 13% overall HUB Participation on Informal Projects Below $30,000 Including 3% African AmericanMeasure: Total Contract Dollars for HUB Participation on All Informal Projects Below $30,000 (Construction only) Divided by Total Contracts
Annual Goal
13 %
QTR 4 Status
30.0 %
Annual Status
39.4 %
QUARTERLY
REVIEW
Value of Contracts
under 30KH.U.B. Contribution HUB Total
FY09 $ 996,756 $ 89,479 9.0%
FY10 1,452,202$ 88,703$ 6.1%
FY11 3,924,102$ 857,125$ 21.8%
FY12 2,878,027$ 891,793$ 31.0%
FY13 2,891,003$ 902,065$ 31.2%
FY14 1,863,533$ 700,603$ 37.6%
FY15 2,655,882$ 1,150,394$ 43.3%
FY16 2,605,540$ 1,252,152$ 48.1%
FY17 2,122,583$ 1,055,439$ 49.7%
Q 1 414,160$ 229,963$ 55.5%
Q 2 354,275$ 79,808$ 22.5%
Q 3 386,332$ 242,403$ 62.7%
Q 4 1,034,065$ 309,771$ 30.0%$1,154,766.50
FY '18 STATUS 2,188,832$ 861,945$ 39.4%
13.0%
13% Overall HUB Participation
Informal Projects Below $30,000
FY 18
HUB OVERALL GOAL:
9.0% 6.1%
21.8%
31.0%31.2%
37.6%
43.3%
48.1%49.7%
55.5%
22.5%
62.7%
30.0%
39.4%
13%
8%
0.0%
10.0%
20.0%
30.0%
40.0%
50.0%
60.0%
70.0%
FY10 FY12 FY14 FY16 Q 2 Q 4 FY '18
STATUS
GOAL
ALERT
Q 1

Facilities Management Strategic Planning Session – Fourth Quarter FY 2018
GOAL #5 – Promote Good Stewardship
Objective: 5.4: Improve Historically Underutilized Business (HUB) Participation
Lead: Design ServicesBalanced Scorecard Category: Internal Business Process
95
LeadDesign Services
3% African American Participation – Summary Graph
Tactic 5.4.5: 3% African American Participation on Informal Projects Below $30,000Measure: Total African American Contract Dollars for Informal Projects Below $30,000 (Construction only) Divided by Total Contract Dollars
QTR 4 Status
5.03 %Annual Goal
3%
Annual Status
5.13 %
QUARTERLY
REVIEW
Value of Contracts
under 30K
African Am.
ContributionAfrican Am. Total
FY09 $ 996,756 $ 40,894 4.1%
FY10 1,452,202$ 73,987$ 5.1%
FY11 3,924,102$ 77,377$ 2.0%
FY12 2,878,027$ 46,475$ 1.6%
FY13 2,891,003$ 115,219$ 4.0%
FY14 1,863,533$ 103,513$ 5.6%
FY15 2,655,882$ 46,795$ 1.8%
FY16 2,605,540$ 47,345$ 1.8%
FY17 2,122,583$ 14,905$ 0.7%
Q 1 414,160$ 30$ 0.01%
Q 2 354,275$ 23,361$ 6.59%
Q 3 386,332$ 37,000$ 9.58%
Q 4 1,034,065$ 51,980$ 5.03%
FY '18 STATUS 2,188,832$ 112,371$ 5.13%
3.0%
3% African American Participation
Informal Projects Below $30,000
FY 18
HUB AFRICAN AMERICAN GOAL:
4.1%
5.1%
2.0%1.6%
4.0%
5.6%
1.8%1.8%
0.7%
0.01%
6.59%
9.58%
5.03%
5.13%
3%
2%
0.0%
1.0%
2.0%
3.0%
4.0%
5.0%
6.0%
7.0%
8.0%
9.0%
10.0%
FY09 FY10 FY11 FY12 FY13 FY14 FY15 FY16 FY17 Q 1 Q 2 Q 3 Q 4 FY '18 STATUS
GOAL ALERT

Strategic Planning Session
Fourth Quarter – Fiscal Year 2018
April – June 2018
DISCUSSION
…Creating a Campus of Distinction