fy17 full year results and fy18 outlook - senex energy...aug 22, 2017 · and spp seismic and...
TRANSCRIPT

1
Ian Davies, Managing Director and CEO
Graham Yerbury, Chief Financial Officer
22 August 2017
FY17 full year results and FY18 outlook

2
Agenda
Performance overview
Financial results
Outlook
Project updates
Key takeaways
Appendix
WSGP reference data
Refurbishment of the Eos dam, Western Surat Gas Project

3
Exploiting core capabilities to return Senex to growth
Leveraging operational excellence and strong balance sheet to return Senex to year-on-year production and reserves growth from FY18
FY18 program is returns and growth focused
Capital investment focused on delivering growth in the gas business and returns from the western flank oil business while maintaining a strong balance sheet
Solid FY17 performance
Solid production and cost control from base oil business, excellent early operational performance in the Surat Basin, and a strong cash position achieved
Key takeaways

4
Performance overview Ian Davies, Managing Director and CEO
Drilling on the Eos block, Western Surat Gas Project

5Strategic priorities and FY17 performance
Realising the near-term potential in the east coast gas market
Focusing our material exploration and production position in Australia’s leading onshore oil region
Pursuing opportunities that strengthen our foothold in the upstream value chain
• Commenced appraisal testing of the Western Surat Gas Project, sanctioned and commenced $50 million capital program
• Commenced project to bring Vanessa gas field online during FY18; received funding via the PACE Gas Grant Program
• Targeted material uncontracted gas resources to supply the east coast through Cooper Basin unconventional exploration program
• Achieved solid production performance from base oil portfolio, delivered at low operating cost
• Matured the regional petroleum system model, resulting in a western flank focused capital program for FY18
• Birkhead oil discovery on the western flank in early FY18
• Exited FY17 with a strong financial position (cash balance of $135 million, bolstered by institutional placement and Share Purchase Plan)
• Strategic transaction with specialist energy investor EIG Global Energy Partners
• Continued disciplined review of organic and inorganic opportunities
1
2
3
FY
17 P
erfo
rmance

6Our focus on working sustainably
8.6
6.5 6.2
1.8
4.0
0.0
0.5
1.0
1.5
FY13 FY14 FY15 FY16 FY17
Mill
ions o
f w
ork
hou
rs
Work hours TRIFR
Maintaining and improving
well-established Cooper
Basin operations
Progressing environmental
approvals and a strong
environmental
management framework in
the Surat Basin
Strengthening relationships
with the local community,
landholders, Native Title
holders, business and
industry groups
Effective two-way
communication and
engagement with
stakeholders
Solid safety performance against increased work hours
Strong environmental track record
Creating a positive legacy in our communities

7
• Strong production from base oil portfolio (declining at lower end of 2 – 4% per month guided range)
• Production impacted by materially lower capex since FY15
• FY17 production of 0.75 mmboe, in line with revised guidance
• Strong cost control from base oil portfolio (A$27/bbl operating costs in the western flank)
• Production growth required to materially reduce unit operating costs
Cooper Basin operating performance
26 25
33 32
26 28
Field A Field B Field C Field D Field E Field F
A$
/ b
bl s
old
FY17 western flank operating costs per barrel sold (before royalties)
Field UOC
Average
134 151 82 28 62
1.25 1.38 1.39
1.01
0.75
FY13 FY14 FY15 FY16 FY17
Production and capex
Capex ($ million)
Production(mmboe)

8
• Consistent reserve adds in the Surat Basin demonstrate increasing confidence in subsurface:
• 65% increase in 1P reserves in 2017
• Demonstrating cost leadership:
• Phase 2 capital program commenced in June 2017, on schedule and on budget
• Phase 2 capital program targeting A$1.2 million installed cost per well, including owners’ costs
• Community and landholder engagement proceeding well
• Collaborative relationships with key suppliers; delivering on our commitment to source locally
• Committed to operating performance transparency
Surat Basin operating performance
49 81
138 157 157
358
2012 2013 2014 2015 2016 2017
Surat Basin reserves build (PJs)
2P reserves
1P reserves
427 438
1.4
1.2
1.0
Phase 1 actuals(normalised)
Phase 2 target Long run target
A$
/we
ll
Western Surat Gas Project well cost performance1
1. Installed cost per well includes engineering, procurement, approvals, land access, project management, civil construction, drill, complete, equip and connect costs per well.

9
Financial results Graham Yerbury, Chief Financial Officer

10Key financial headlines
FY17 FY16 Change
Production (mmboe) 0.75 1.01 (26%)
Sales volumes (mmboe) 0.72 0.97 (26%)
Average realised oil price ($ per bbl) 61 71 (14%)
Capital spend ($ million) 62.3 27.8 124%
Sales revenue ($ million) 43.6 69.3 (37%)
Operating cost ex royalties ($ per bbl produced) 30.2 28.0 8%
EBITDAX ($ million) 7.3 63.6 (89%)
Underlying NPAT ($ million) (22.5) 0.0 N/A
Statutory NPAT ($ million) (22.7) (33.2) 32%
Operating cash flow ($ million) (8.1) 34.3 (124%)
Cash balance ($ million) 134.8 102.4 32%
Drawn debt ($ million) 4.1 2.8 46%
• Slightly higher operating costs on a $/bbl basis, given lower volumes produced
• FY16 EBITDAX result included $38 million profit on the sale of the Maisey block
• Statutory NPAT higher given improved macro environment (no impairment) and cost control
• Given strong cash position, $60 million of corporate debt facility was released during FY17
11
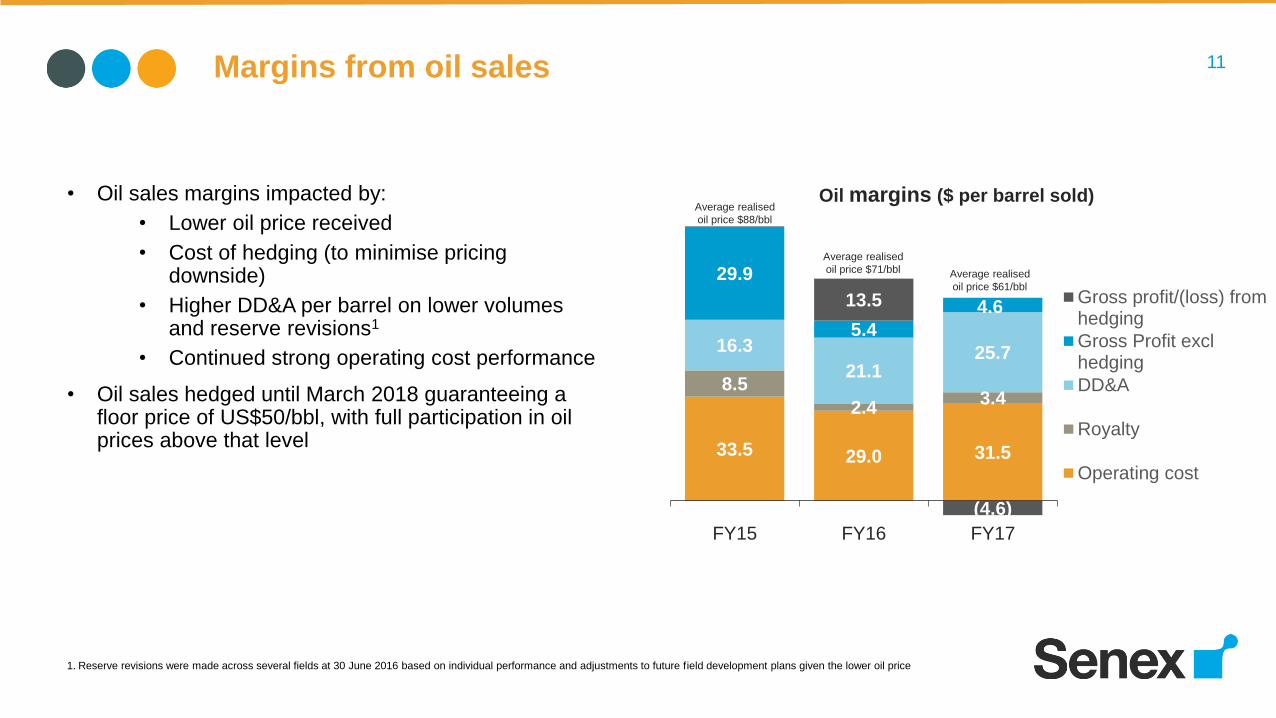
• Oil sales margins impacted by:
• Lower oil price received
• Cost of hedging (to minimise pricing downside)
• Higher DD&A per barrel on lower volumes and reserve revisions1
• Continued strong operating cost performance
• Oil sales hedged until March 2018 guaranteeing a floor price of US$50/bbl, with full participation in oil prices above that level
Margins from oil sales
33.5 29.0 31.5
8.5
2.43.4
16.3
21.125.7
29.9
5.4
4.613.5
(4.6)
FY15 FY16 FY17
Oil margins ($ per barrel sold)
Gross profit/(loss) fromhedging
Gross Profit exclhedging
DD&A
Royalty
Operating cost
1. Reserve revisions were made across several fields at 30 June 2016 based on individual performance and adjustments to future field development plans given the lower oil price
Average realised
oil price $88/bbl
Average realised
oil price $61/bbl
Average realised
oil price $71/bbl

12
Notes
1. Sales revenue down on natural field decline and lower average realised oil price, with a commensurate lower cost of
sales
2. Higher exploration expense on greater proportion of exploration wells drilled and seismic costs allocated to this
reporting period
3. Driven by improvement in rig charges and general & administrative costs
Underlying NPAT reconciliation
7.5
2.0(18.0)
(7.6) (6.4)
(22.5)
(30)
(25)
(20)
(15)
(10)
(5)
-
Underlying FY16NPAT
Sales revenue -volume
Sales revenue -A$ price
Cost of sales Explorationexpense
Other Underlying FY17NPAT
$ m
illi
on
Movement in underlying net profit after tax ($ million)
1 1
1
2
(0.0)
3

13
114.4
149.3
102.4
43.6
90.7
(10.3)
7.9
134.8(25.1) (6.5)
(19.2)
(36.6)(12.3)
0
40
80
120
160
200
240
Openingcash 1July 2016
Salesrevenue
Operatingcosts
Developmentand fixed
asset capex
Institutionalplacementand SPP
Seismic andexploration
capex -Cooper
Seismic andexploration
capex -Surat
P&AProgram
Net cashG&A (excl
FX)
Other (inclnet working
capital)
Closing cash30 June
2017
$ m
illi
on
Movement in opening and closing cash balance ($ million)
• $91 million raised through institutional placement and Share Purchase Plan
• Significant increase in growth capex reflecting improving macro environment and acceleration of Western Surat Gas Project
• Majority of P&A program now complete (Senex received $20 million from QGC in 2014 to complete this work)
• Net working capital change principally from higher payables due to increased work program
Operating cash reconciliation
OthersOpex and
developmentGrowth
1
1. Western Surat Gas Project capital expenditure treated as seismic and exploration capex until Petroleum Leases (PLs) are granted

14
Outlook Ian Davies, Managing Director and CEO

15Strategic priorities
Realising the near-term potential in the east coast gas market
Focusing our material exploration and production position in Australia’s leading onshore oil region
Pursuing opportunities that strengthen our foothold in the upstream value chain
• Reach milestones allowing Senex to make final investment decision and transition to full field development on Western Surat Gas Project
• Deliver Vanessa gas to domestic customers during FY18
• Continue to evaluate the commerciality of material unconventional gas resources in the Cooper Basin
• Continued focus on low operating costs and maximising production from base oil portfolio
• Returns focused capital program prioritising high value western flank targets
• Continued pursuit of organic and inorganic opportunities consistent with our strategy
• Establish financial facilities to support growth activities
1
2
3
FY
18 s
trate
gic
prio
rities
16
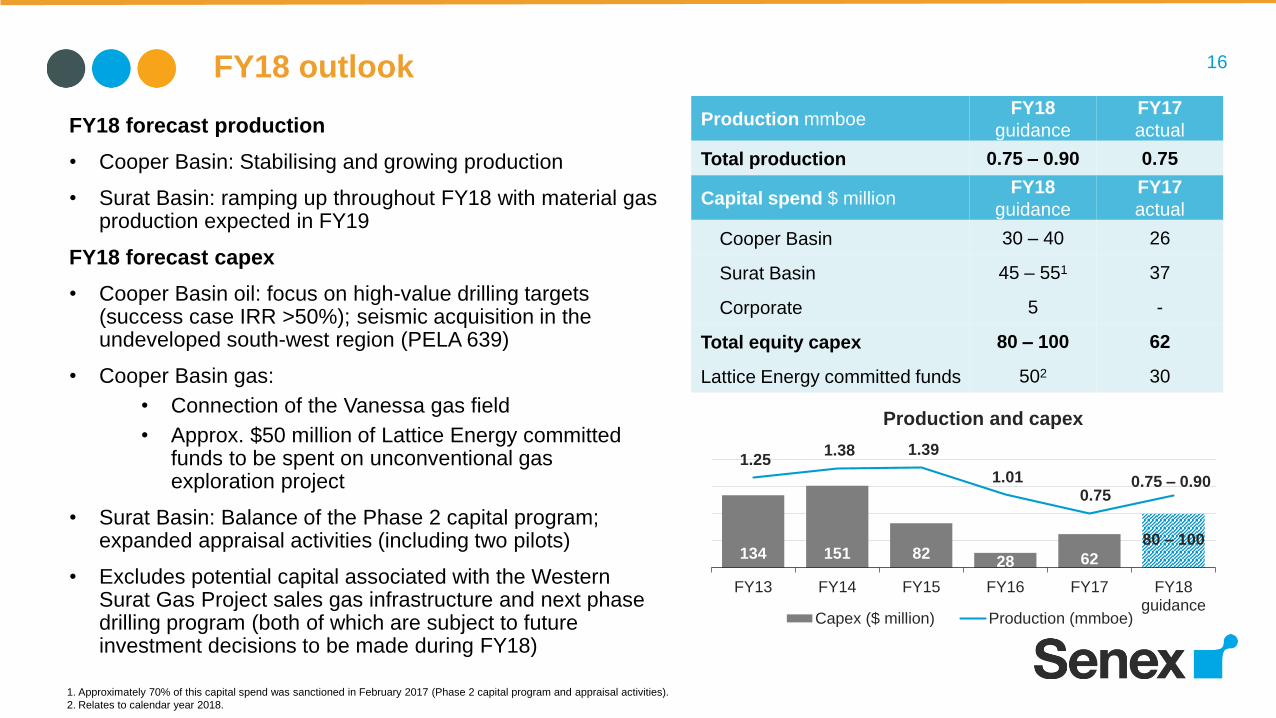
FY18 forecast production
• Cooper Basin: Stabilising and growing production
• Surat Basin: ramping up throughout FY18 with material gas production expected in FY19
FY18 forecast capex
• Cooper Basin oil: focus on high-value drilling targets (success case IRR >50%); seismic acquisition in the undeveloped south-west region (PELA 639)
• Cooper Basin gas:
• Connection of the Vanessa gas field
• Approx. $50 million of Lattice Energy committed funds to be spent on unconventional gas exploration project
• Surat Basin: Balance of the Phase 2 capital program; expanded appraisal activities (including two pilots)
• Excludes potential capital associated with the Western Surat Gas Project sales gas infrastructure and next phase drilling program (both of which are subject to future investment decisions to be made during FY18)
FY18 outlook
Production mmboeFY18
guidance
FY17
actual
Total production 0.75 – 0.90 0.75
Capital spend $ millionFY18
guidance
FY17
actual
Cooper Basin 30 – 40 26
Surat Basin 45 – 551 37
Corporate 5 -
Total equity capex 80 – 100 62
Lattice Energy committed funds 502 30
Glenora pilot (Phase 1)134 151 8228 62
1.25 1.38 1.39
1.01 0.75
FY13 FY14 FY15 FY16 FY17 FY18guidance
Production and capex
Capex ($ million) Production (mmboe)
0.75 – 0.90
80 – 100
1. Approximately 70% of this capital spend was sanctioned in February 2017 (Phase 2 capital program and appraisal activities).
2. Relates to calendar year 2018.
17
Project updates Ian Davies, Managing Director and CEO

18
During FY17:
• Strong production and cost control delivered from base oil portfolio
• Liberator seismic survey acquired to augment extensive existing coverage
• PEL182 exploration campaign undertaken to test fairway boundaries of the western flank
• Birkhead oil discovery made in July 2017: Marauder-1 exploration well
Ongoing strategy:
• High margin core business driving cash generation, with material upside potential
• Controlling expenditure given the continued low oil price environment
• Focusing on high value oil opportunities on the western flank of the Cooper Basin
• All other areas in the Cooper Basin will be a second order priority while we focus on delivering free cash flow:
• Active farm-down process is underway, with all commercialisation strategies under consideration
Cooper Basin oil

19
During FY17:
• Unconventional gas project with Lattice Energy: drilling and testing activities at well locations in the Patchawarra Trough and Allunga Trough
• Vanessa gas field: project received funding under the PACE Gas Grant Program
Ongoing strategy:
• Targeting material resources to bring to market to meet the east coast demand opportunity
• Near term focus on:
• Evaluating commerciality in tight gas and basin centred gas play on unconventional gas project with Lattice Energy, with approximately $50 million of work program left to spend
• Bringing the Vanessa gas field online during Q3 FY18 and contracting with domestic gas customers
Cooper Basin gas

20
During FY17:
• Commenced appraisal testing on the Glenora pilot (Phase 1)
• Sanctioned $50 million on Phase 2 capital program (30 wells on Glenora and Eos) and appraisal activities west of Eos
• Continued field development planning
• Completed majority of plug and abandon work on 47 legacy wells
Ongoing strategy:
• Progressing towards full field development of this project
• Near term focus on:
• Demonstrating cost leadership through the delivery of the Phase 2 capital investment program
• Expanded appraisal program
• Investment decision on sales gas infrastructure and next phase of drilling
• Delivery of financing strategy for overall project development
• Securing regulatory and environmental approvals
Western Surat Gas Project

21
Key takeaways Ian Davies, Managing Director and CEO

22
Exploiting core capabilities to return Senex to growth
Leveraging operational excellence and strong balance sheet to return Senex to year-on-year production and reserves growth from FY18
FY18 program is returns and growth focused
Capital investment focused on delivering growth in the gas business and returns from the western flank oil business while maintaining a strong balance sheet
Solid FY17 performance
Solid production and cost control from base oil business, excellent early operational performance in the Surat Basin, and a strong cash position achieved
Key takeaways

23
144 Edward Street
Brisbane, Queensland, 4000
Australia
(07) 3335 9000 www.senexenergy.com.au
Investor
Enquiries
Ian Davies
Managing Director
(07) 3335 9000
Media
Enquiries
Rhianne Bell
Corporate Communications Manager
(07) 3335 9859
Tess Palmer
Investor Relations Manager
(07) 3335 9719
Contact and Further Information

24Appendix: Reserves and resources
30 June 2016 Production Revisions 30 June 2017 % change yoy
1P reserves 12.1 (0.7) 5.3 16.7 38%
2P reserves 83.4 (0.7) 1.3 83.9 1%
2C resources 208.0 - 0.1 208.1 0%
37.4 39.9
72.4 83.4 83.9
2013 2014 2015 2016 2017
2P reserves (oil and gas) - mmboe
157 157
358 427 438
2013 2014 2015 2016 2017
2P reserves Surat Basin - PJs
10.8 13.3
11.5 10.8 9.5
2013 2014 2015 2016 2017
2P reserves Cooper Basin - mmboe
All reserves charts have been adjusted for the sale of the Maisey block in 2015

25Appendix: Net profit after tax and EBITDAX
FY17 FY16
Revenue 43.6 69.3
Operating costs (25.1) (30.6)
Gain on sale of Maisey block - 38.2
Other revenue/costs1 (11.2) (13.3)
EBITDAX 7.3 63.6
Exploration expense (8.7) (2.3)
Amortisation & depreciation (21.1) (23.6)
Impairment - (69.7)
Net Finance Costs (0.2) (1.2)
Statutory NPAT (22.7) (33.2)
Impairment - 69.7
Restructuring costs 0.1 1.8
Gain on sale of Maisey block - (38.2)
Underlying NPAT (22.5) 0.01. Other revenues/costs includes flowline revenue, other income, other operating expenses, general and administrative expenses
Numbers may not add due to rounding
FY17 FY16
Statutory net profit (loss) after tax (22.7) (33.2)
Add/(less):
Net interest 0.2 1.2
Tax - -
Amortisation & depreciation 21.1 23.6
Impairment - 69.7
EBITDA (1.4) 61.3
Add/(less):
Oil and gas exploration
expense8.7 2.3
EBITDAX 7.3 63.6

26Western Surat Gas Project: reference data
Infrastructure
Pilot Gas Pipeline connects the Glenora pilot to the GLNG low pressure gathering network
Minimal compression and water handling facilities required
Sales Gas
Proximity to GLNG’s existing transmission facilities
Potential shared use of existing GLNG gas processing and water treatment infrastructure or Senex
constructed infrastructure (competitive tender process for sales gas infrastructure is currently
underway)
Delivery of sales gas into the GLNG Comet Ridge to Wallumbilla Pipeline at a point on Senex’s
permits
Resource
Surat Basin reserves 81 PJ of net proved (1P) reserves
438 PJ of net proved and probable (2P) reserves
Government take
QLD royalty regime 10% of wellhead value1
PRRT Shield of $917 million as at 30 June 2017
1. Wellhead value revenue minus above ground costs (including processing and transport) and depreciation of above ground costs (again for processing and transport).

27Western Surat Gas Project: reference data
Market
Pilot Gas
Sales from the Glenora pilot to GLNG commenced in April 2017 (Senex receives a USD JCC oil-
linked price for raw, unprocessed gas to be supplied at its option)
Exploring all marketing options for other pilot gas prior to ‘first FID’
Gas Sales Agreement
with GLNG
GSA for gas from the Western Surat Gas Project area over a 20-year contract term (right of
termination for both parties at September 2020 if ‘first FID’ not reached)
GSA provides for, at Senex’s election, the staged ramp up in sales volumes to a maximum of
50 TJ/day following ‘first FID’
USD market pricing based on a JCC oil-linked formula
Ability to sell up to 15% of gas volumes to domestic gas customers, subject to certain conditions
Funding
Sources of funding
Cash of $135 million at 30 June 2017
Senex and EIG to work together to develop an appropriate funding model for Western Surat Gas
Project, including EIG participation in such funding
EIG development funding of up to US$300 million for Western Surat Gas Project acceleration1
1. Any future transaction or agreement between Senex and EIG regarding development funding will be subject to due diligence, any relevant internal or regulatory approvals, and the parties reaching
agreement on terms. Refer to ASX Announcement dated 1 February 2017.

28Disclaimer
Important information
This presentation has been prepared by Senex Energy Limited (Senex). It is current as at the date of this presentation. It contains information in a summary form and should be read
in conjunction with Senex’s other periodic and continuous disclosure announcements to the Australian Securities Exchange (ASX) available at: www.asx.com.au. Distribution of this
presentation outside Australia may be restricted by law. Recipients of this document in a jurisdiction other than Australia should observe any restrictions in that jurisdiction. This
presentation (or any part of it) may only be reproduced or published with Senex’s prior written consent.
Risk and assumptions
An investment in Senex shares is subject to known and unknown risks, many of which are beyond the control of Senex. In considering an investment in Senex shares, investors should
have regard to (amongst other things) the risks outlined in this presentation and in other disclosures and announcements made by Senex to the ASX. Refer to the 2016 Annual Report
for a summary of the key risks faced by Senex. This presentation contains statements (including forward-looking statements), opinions, projections, forecasts and other material, based
on various assumptions. Those assumptions may or may not prove to be correct. All forward-looking statements involve known and unknown risks, assumptions and uncertainties,
many of which are beyond Senex’s control. There can be no assurance that actual outcomes will not differ materially from those stated or implied by these forward-looking statements,
and investors are cautioned not to place undue weight on such forward-looking statements.
No investment advice
The information contained in this presentation does not take into account the investment objectives, financial situation or particular needs of any recipient and is not financial advice or
financial product advice. Before making an investment decision, recipients of this presentation should consider their own needs and situation, satisfy themselves as to the accuracy of
all information contained herein and, if necessary, seek independent professional advice.
Disclaimer
To the extent permitted by law, Senex, its directors, officers, employees, agents, advisers and any person named in this presentation:
• give no warranty, representation or guarantee as to the accuracy or likelihood of fulfilment of any assumptions upon which any part of this presentation is based or the accuracy,
completeness or reliability of the information contained in this presentation; and
• accept no responsibility for any loss, claim, damages, costs or expenses arising out of, or in connection with, the information contained in this presentation.

29Supporting information for estimates
Qualified reserves and resources evaluator statement: Information about Senex’s reserves and resources estimates has been compiled in accordance with the definitions and
guidelines in the 2007 SPE PRMS. This reserves and resources statement is based on, and fairly represents, information and supporting documentation prepared by, or under the
supervision of, a qualified petroleum reserves and resources evaluator, Mr David Spring BSc (Hons). Mr Spring is a member of the Society of Petroleum Engineers and is Executive
General Manager of Exploration. He is a full time employee of Senex. Mr Spring has approved this statement as a whole and has provided written consent to the form and context in which
the estimated reserves, resources and supporting information are presented.
Aggregation method: The method of aggregation used in calculating estimated reserves and resources was the arithmetic summation by category of reserves. As a result of the
arithmetic aggregation of the field totals, the aggregate 1P estimate may be very conservative and the aggregate 3P estimate very optimistic, as the arithmetic method does not account for
‘portfolio effects’.
Conversion factor: In converting petajoules to mmboe, the following conversion factors have been applied:
• Surat Basin gas: 1 mmboe = 5.880 PJ
• Cooper Basin gas: 1 mmboe = 5.815 PJ
Evaluation dates:
• Cooper-Eromanga Basin: 30 June 2017
• Surat Basin gas reserves and resources (Western Surat Gas Project): 30 June 2017
• Surat Basin gas reserves and resources (Don Juan): 19 July 2014
External consultants: Senex engages the services of Degolyer and MacNaughton, MHA Petroleum Consultants LLC and Netherland, Sewell and/or Associates, Inc. (all with qualified
reserves and resources evaluators) to independently assess data and estimates of reserves prior to Senex reporting estimates.
Method: The deterministic method was used to prepare the estimates of reserves, and the probabilistic method was used to prepare the estimates of resources in this presentation.
Ownership: Unless otherwise stated, all references to reserves and resources in this statement relate to Senex’s economic interest in those reserves and resources.
Reference points: The following reference points have been used for measuring and assessing the estimated reserves in this presentation:
• Cooper-Eromanga Basin: Central processing plant at Moomba, South Australia. Fuel, flare and vent consumed to the reference point are included in reserves estimates (c. 5% of 2P
oil reserves estimates may be consumed as fuel in operations depending on operational requirements).
• Surat Basin: Wallumbilla gas hub, approximately 45 kilometres south east of Roma, Queensland. Fuel, flare and vent consumed to the reference point are excluded from reserves
estimates (c. 7% of 2P gas reserves estimates have been assumed to be consumed as fuel in operations).
Reserves replacement ratio: The reserves replacement ratio is calculated as the sum of estimated reserves additions and revisions divided by estimated production for the period, before
acquisitions and divestments.