fy 2020 preliminary financial results
TRANSCRIPT
FY 2020 PREL. UNAUDITED RESULTSMilan, March 10th, 2021
Milan, March 10th, 2021
FY 2020 PRELIMINARY FINANCIAL RESULTS
FY 2020 PREL. UNAUDITED RESULTSMilan, March 10th, 20211
DISCLAIMER
In General. This disclaimer applies to this document and any oral comments of any person presenting it. This document, taken together with any such oral comments, is referred to herein as the “Presentation”. This document
has been prepared by Pirelli & C. S.p.A. (“Pirelli” or the “Company” and, together with its subsidiary the “Group”). The Presentation is being furnished to you for information purposes only and for use in presentations of the
results and strategies of the Group.
No distribution of this Presentation. This Presentation is being furnished to you solely for your information and may not be reproduced, in whole or in part, or redistributed to any other individual or legal entity.
Forward-looking statement. ““Forward-looking statements” (which expression shall include opinions, predictions or expectations about any future event) that may be contained in the Presentation are based on a variety of
estimates and assumptions by the Group, including, among others, estimates of future operating results, the value of assets and market conditions. These estimates and assumptions are inherently uncertain and are subject to
numerous business, industry, market, regulatory, geo-political, competitive and financial risks that are outside of the Group’s control. There can be no assurance that the assumptions made in connection with the forward-looking
statements will prove accurate, and actual results may differ materially. The inclusion of the forward-looking statements herein should not be regarded as an indication that the Group considers the forward-looking statements to
be a reliable prediction of future events and the forward-looking statements should not be relied upon as such. Neither the Group nor any of its representatives has made or makes any representation to any person regarding the
forward-looking statements and none of them intends to update or otherwise revise the forward-looking statements to reflect circumstances existing after the date when made or to reflect the occurrence of future events, even in
the event that any or all of the assumptions underlying the forward-looking statements are later shown to be in error.
The forward-looking statements does not take into account any additional negative effects that may arise from impacts on the global market in which Pirelli operates and more generally on the macroeconomic
scenario, also following any further governmental measures related to the spread of Covid-19 (SARS-CoV-2).
No update. The information and opinions in this Presentation is provided to you as of the dates indicated and the Group does not undertake to update the information contained in this Presentation and/or any opinions expressed
relating thereto after its presentation, even in the event that the information becomes materially inaccurate, except as otherwise required by applicable laws.
Verbal explanation. This Presentation has to be accompanied by a verbal explanation. A simple reading of this Presentation without the appropriate verbal explanation could give rise to a partial or incorrect understanding.
No offer to purchase or sell securities. The information, statements and opinions contained in this Presentation are for information purposes only and do not constitu te a public offer under any applicable legislation or an offer
to sell or solicitation of an offer to purchase or subscribe for securities or financial instruments or any advice or recommendation with respect to such securities or other financial instruments. None of the securities referred to
herein have been, or will be, registered under the U.S. Securities Act of 1933, as amended, or the securities laws of any sta te or other jurisdiction of the United States or in Australia, Canada or Japan or any other jurisdiction
where such an offer or solicitation would be unlawful (the “Other Countries”), and there will be no public offer of any such securities in the United States. This Presentation does not constitute or form a part of any offer or
solicitation to purchase or subscribe for securities in the United States or the Other Countries.
Rounding. Due to rounding, numbers presented throughout this Presentation may not add up precisely to the totals provided and percentages may not precisely reflect the absolute figures.
Miscellanea. This Presentation has been prepared on a voluntary basis. Pirelli is therefore not bound to prepare similar presentations in the future, unless where provided by law.
The data contained in this presentation are preliminary in nature and refer to the date hereof and, therefore, may be subject to further variations. Please note that these preliminary data are subject to review by the independent
auditors that still have to complete their necessary analysis in order to release their report. The 2020 final results will be approved by the Board of Directors scheduled on the 31stof March 2021 and will be disclosed to the market
according to, and in the terms set for by, the applicable laws and regulations.
Neither the Company nor any member of the Group nor any of its or their respective representatives, directors, employees or agents accept any liability whatsoever in connection with this Presentation or any of its contents or in
relation to any loss arising from its use or from any reliance placed upon it.
Francesco Tanzi, the manager in charge of preparing the corporate accounting documents, declares that, pursuant to art. 154-bis,paragraph 2, of the Legislative Decree no. 58 of February 24, 1998, the accounting information
contained herein correspond to document results, books and accounting records.
Non-IFRS and Other Performance Measures
This Presentation contains certain items as part of the financial disclosure which are not defined under IFRS. Accordingly, these items do not have standardized meanings and may not be directly comparable to similarly-titled
items adopted by other entities.
Pirelli management has identified a number of “Alternative Performance Indicators” (“APIs”). These APIs ( i) are derived from historical results of Pirelli & C. S.p.A. and are not intended to be indicative of future performance, (ii )
are non-IFRS financial measures and, although derived from the Financial Statements, are unaudited and (iii) are not an alternat ive to financial measures prepared in accordance with IFRS.
The APIs presented herein are EBIT, EBIT margin, EBITDA, EBITDA margin, net income and net income margin.
In addition, this Presentation includes certain measures that have been adjusted by us to present operating and financial per formance net of any non-recurring events and non-core events. The adjusted indicators are EBITDA
adjusted, EBIT adjusted and net income adjusted. In order to facilitate the understanding of our financial position and financial performance, this Presentation contains other performance measures, such as Net Financial
(liquidity) / debt Position, Net cash flow before dividends and convertible
bond impact, Net cash flow before dividends and Net cash flow.
These measures are not indicative of our historical operating results, nor are they meant to be predictive of future results.
These measures are used by our management to monitor the underlying performance of our business and operations. Similarly ent itled non-IFRS financial measures reported by other companies may not be calculated in an
identical manner, consequently our measures may not be consistent with similar measures used by other companies. Therefore, investors should not place undue reliance on this data.
1
FY 2020 PREL. UNAUDITED RESULTSMilan, March 10th, 20212
KEY MESSAGES
2
>
>
>
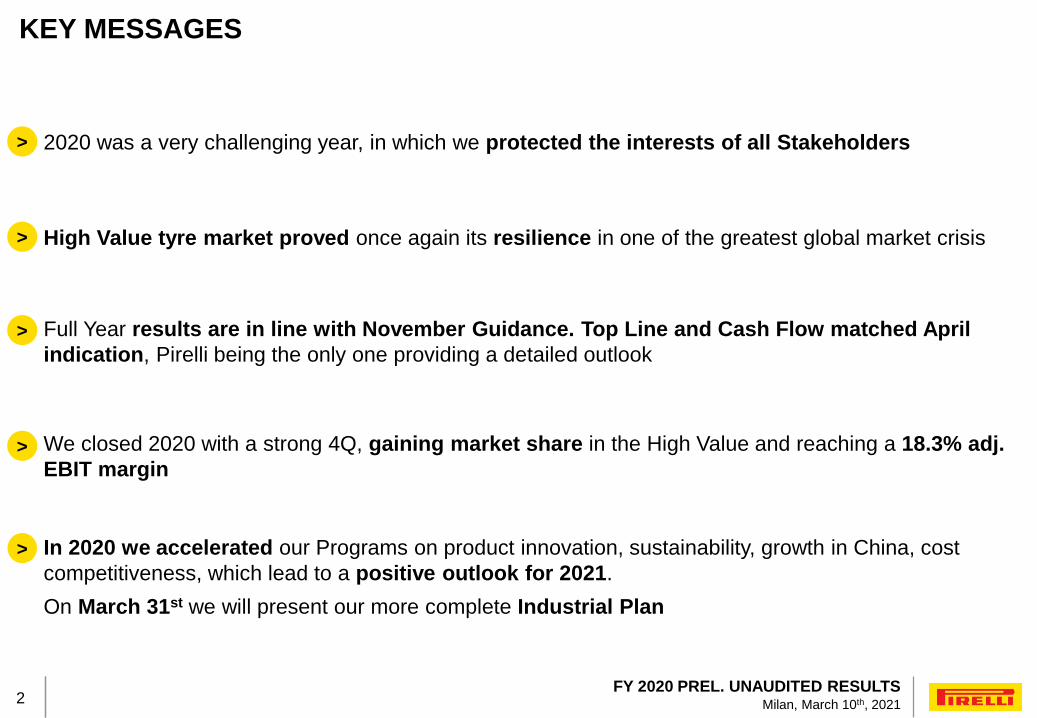
In 2020 we accelerated our Programs on product innovation, sustainability, growth in China, cost
competitiveness, which lead to a positive outlook for 2021.
On March 31st we will present our more complete Industrial Plan
2020 was a very challenging year, in which we protected the interests of all Stakeholders
> High Value tyre market proved once again its resilience in one of the greatest global market crisis
We closed 2020 with a strong 4Q, gaining market share in the High Value and reaching a 18.3% adj.
EBIT margin
Full Year results are in line with November Guidance. Top Line and Cash Flow matched April
indication, Pirelli being the only one providing a detailed outlook>
FY 2020 PREL. UNAUDITED RESULTSMilan, March 10th, 20213
2020 MARKET AND PIRELLI PERFORMANCE2
3 2020 FINANCIAL REVIEW
AGENDA
4 APPENDIX
2020 DELIVERY AND 2021 OUTLOOK1
3

FY 2020 PREL. UNAUDITED RESULTSMilan, March 10th, 20214
IN 2020 WE TOOK GREAT CARE IN PROTECTING ALL OUR
STAKEHOLDERS
Employees• Average employees in Remote working (staff) ~60%
• Plants open >85% of the year, guaranteeing the highest levels of safety standards
• ~3,000 employees involved in Up-skilling initiatives
• Launched “From welfare to well-being” program: work life balance, support for families, healthy lifestyle
and mobility management
Clients• Despite strong internal destocking (~-3M pcs reduction) high Service Level guaranteed, supporting
good 4Q performance
• Integrated supply chain with Tier 1 partners
• Collaborative Stock Management
Suppliers• Protection of Strategic Partnerships
• Higher flexibility and local suppliers guaranteed business continuity
• Reduced days payable (~-3%)
Shareholders• >€200M Cash flow generation protected
• Capital Structure strengthened with Debt maturity extended (63% expiring from 2024 & beyond)
• €500M Convertible Bond Zero coupon issued in Dec 2020 well oversubscribed
4
FY 2020 PREL. UNAUDITED RESULTSMilan, March 10th, 20215
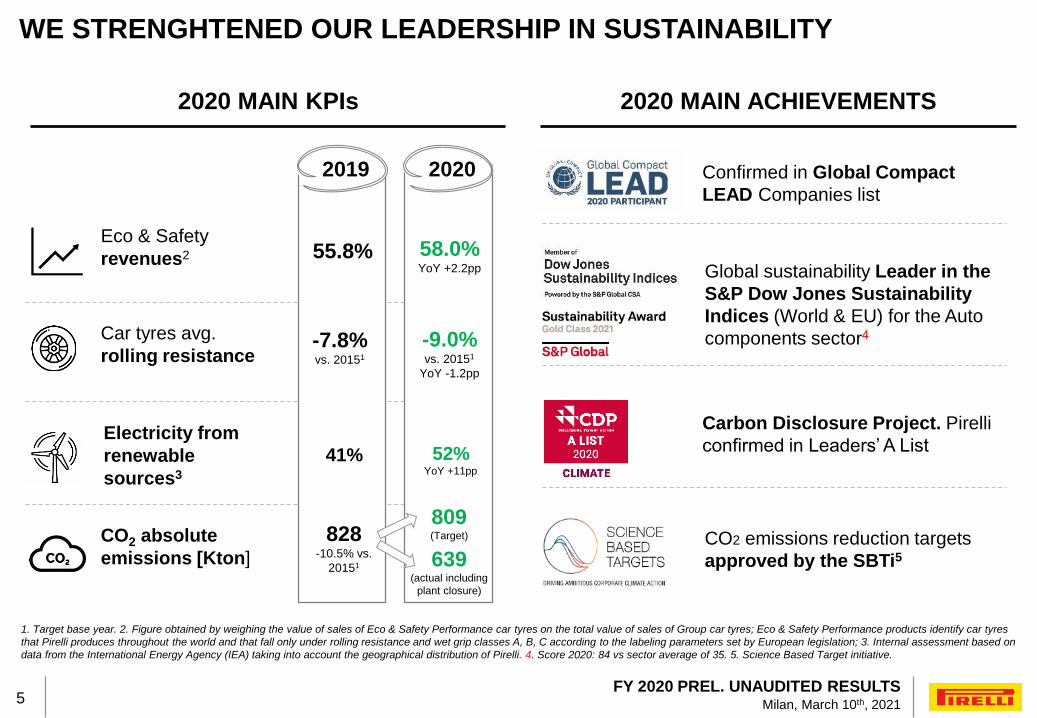
WE STRENGHTENED OUR LEADERSHIP IN SUSTAINABILITY
5
2020
CO2 emissions reduction targets
approved by the SBTi5
2020 MAIN ACHIEVEMENTS
Eco & Safety
revenues2 55.8% 58.0%YoY +2.2pp
Car tyres avg.
rolling resistance-7.8%vs. 20151
-9.0%vs. 20151
YoY -1.2pp
CO2 absolute
emissions [Kton]
828-10.5% vs.
20151 639(actual including
plant closure)
2019
2020 MAIN KPIs
Electricity from
renewable
sources3
41% 52%YoY +11pp
1. Target base year. 2. Figure obtained by weighing the value of sales of Eco & Safety Performance car tyres on the total value of sales of Group car tyres; Eco & Safety Performance products identify car tyres
that Pirelli produces throughout the world and that fall only under rolling resistance and wet grip classes A, B, C according to the labeling parameters set by European legislation; 3. Internal assessment based on
data from the International Energy Agency (IEA) taking into account the geographical distribution of Pirelli. 4. Score 2020: 84 vs sector average of 35. 5. Science Based Target initiative.
809(Target)
Confirmed in Global Compact
LEAD Companies list
Global sustainability Leader in the
S&P Dow Jones Sustainability
Indices (World & EU) for the Auto
components sector4
Carbon Disclosure Project. Pirelli
confirmed in Leaders’ A List
FY 2020 PREL. UNAUDITED RESULTSMilan, March 10th, 20216
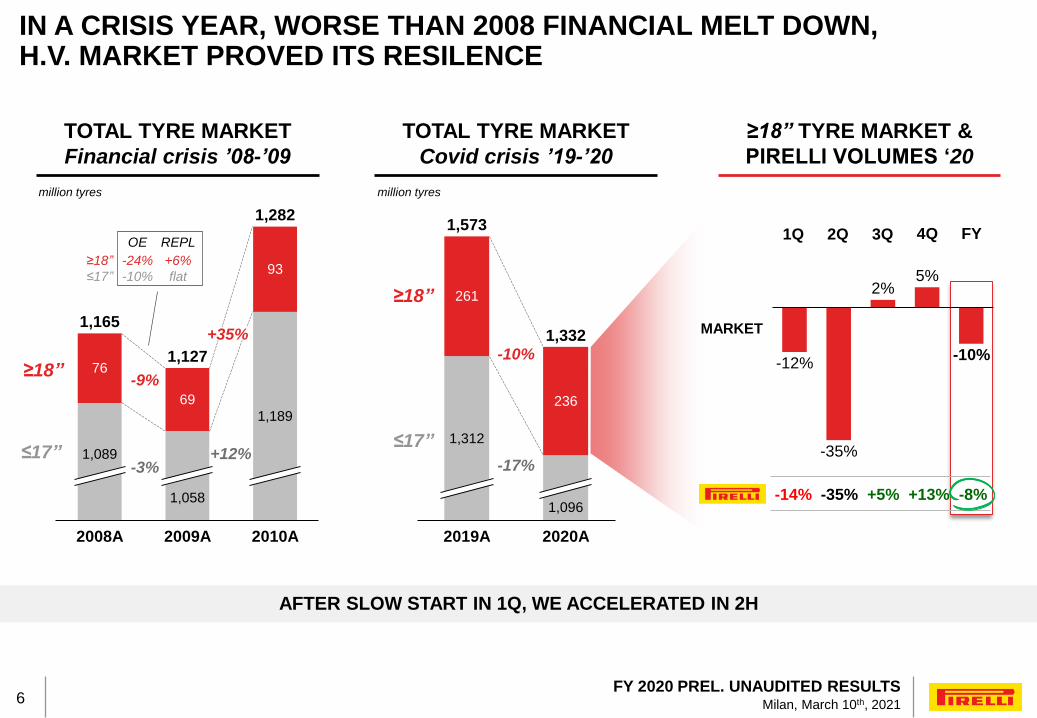
IN A CRISIS YEAR, WORSE THAN 2008 FINANCIAL MELT DOWN, H.V. MARKET PROVED ITS RESILENCE
6
76
69
93
1,089
2008A
1,058
1,189
2009A
1,165
1,127
2010A
1,282
261
236
1,332
2019A
1,312
1,096
2020A
1,573
-9%
-3% -17%
TOTAL TYRE MARKET
Financial crisis ’08-’09
+5%-14% +13% -8%-35%
1Q 2Q 3Q FY4Q
-12%-10%
-35%
2%5%
≤17”
≥18”
million tyres
TOTAL TYRE MARKET
Covid crisis ’19-’20
≥18” TYRE MARKET &
PIRELLI VOLUMES ‘20
≤17”
≥18”
-10%
MARKET
million tyres
AFTER SLOW START IN 1Q, WE ACCELERATED IN 2H
+12%
+35%
≤17”
≥18”
-10%
-24%
flat
+6%
OE REPL
FY 2020 PREL. UNAUDITED RESULTSMilan, March 10th, 20217
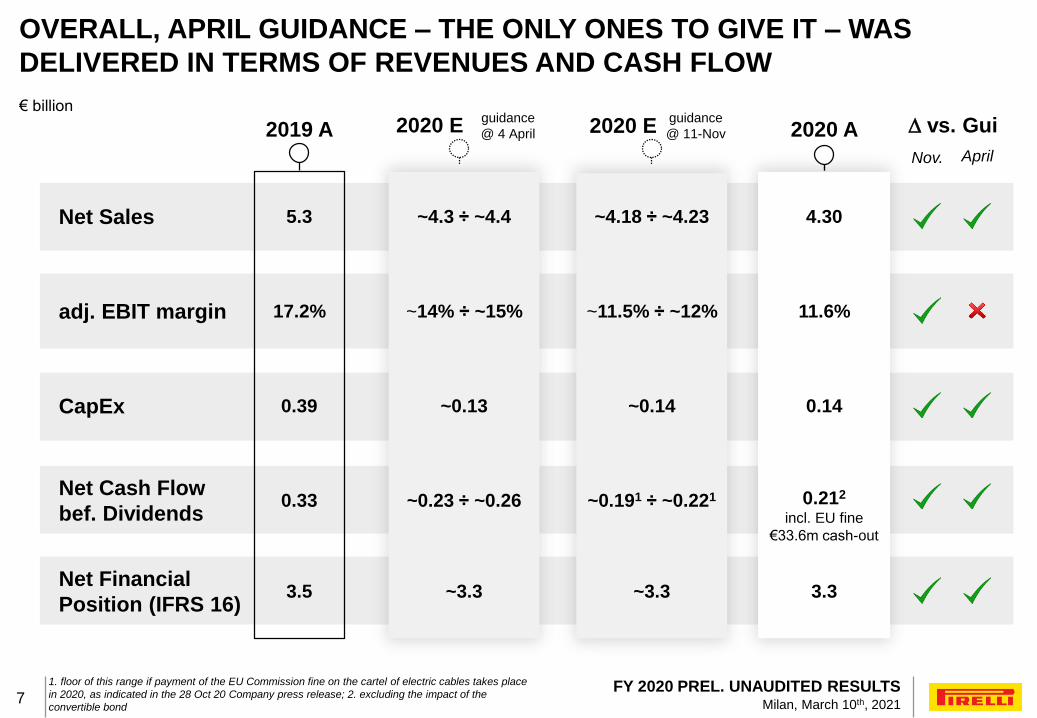
€ billion
1. floor of this range if payment of the EU Commission fine on the cartel of electric cables takes place
in 2020, as indicated in the 28 Oct 20 Company press release; 2. excluding the impact of the
convertible bond
OVERALL, APRIL GUIDANCE – THE ONLY ONES TO GIVE IT – WAS
DELIVERED IN TERMS OF REVENUES AND CASH FLOW
CapEx
Net Financial
Position (IFRS 16)
Net Cash Flow
bef. Dividends
Net Sales
adj. EBIT margin
2019 A
0.39
3.5
0.33
5.3
17.2%
2020 E
~3.3
~0.23 ÷ ~0.26
guidance
@ 4 April 2020 A
~0.13
~14% ÷ ~15%
~4.3 ÷ ~4.4
3.3
0.212
incl. EU fine
€33.6m cash-out
0.14
11.6%
4.30
7
2020 E
~3.3
~0.191 ÷ ~0.221
guidance
@ 11-Nov
~0.14
~11.5% ÷ ~12%
~4.18 ÷ ~4.23
D vs. Gui
Nov. April
FY 2020 PREL. UNAUDITED RESULTSMilan, March 10th, 20218
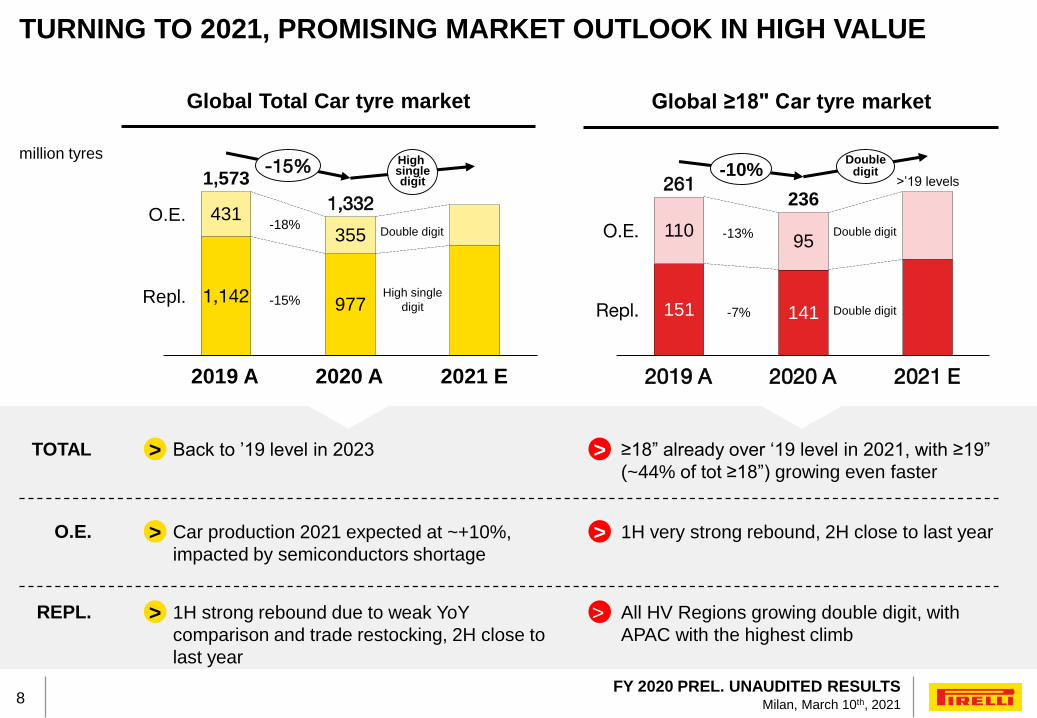
Global Total Car tyre market
million tyres
TURNING TO 2021, PROMISING MARKET OUTLOOK IN HIGH VALUE
> >
Global ≥18" Car tyre market
1,142 977
431355
2020 A
Repl.
2019 A
O.E.
2021 E
1,573
1,332
-15% High singledigit
Car production 2021 expected at ~+10%,
impacted by semiconductors shortage
O.E.
REPL.
151 141
11095
2019 A
Repl.
2020 A 2021 E
O.E.
261236
>’19 levels-10%
Doubledigit
1H very strong rebound, 2H close to last year
1H strong rebound due to weak YoY
comparison and trade restocking, 2H close to
last year
All HV Regions growing double digit, with
APAC with the highest climb
-18%
-15%High single
digit -7%
-13%
> >
Double digit Double digit
Double digit
> >Back to ’19 level in 2023TOTAL ≥18” already over ‘19 level in 2021, with ≥19”
(~44% of tot ≥18”) growing even faster
8

FY 2020 PREL. UNAUDITED RESULTSMilan, March 10th, 20219
WE HAVE BEEN EVEN MORE ACTIVE IN PREPARING PROGRAMS FOR 2021
RICH PRODUCT PIPELINE IN REPLACEMENT, PARTICULARLY IN PUSH LINES
ENHANCE HIGH VALUE LEADERSHIP THANKS TO MATURING ≥19’’ PULL DEMAND
MORE BALANCED OE/REPLACEMENT GROWTH
IMPLEMENT THE COST COMPETITIVENESS PROGRAM, IN LINE WITH OUR FEB ‘20 PLAN
MODERATE CAPEX INTENSITY (7% ON SALES): MIX, QUALITY AND DIGITAL
9
2021 PRIORITIES
CHINA ACCELERATION WITH STRONG ONLINE SALES
FY 2020 PREL. UNAUDITED RESULTSMilan, March 10th, 202110
1. excluding the impact of the convertible bond
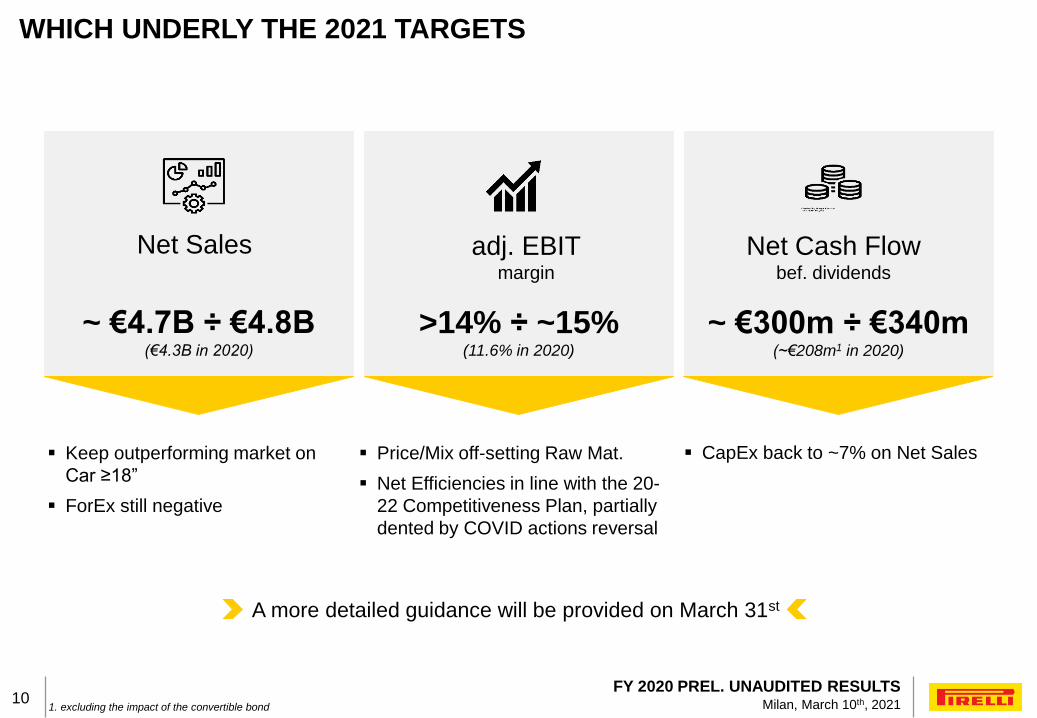
WHICH UNDERLY THE 2021 TARGETS
10
~ €4.7B ÷ €4.8B(€4.3B in 2020)
adj. EBITmargin
Net Cash Flowbef. dividends
Net Sales
>14% ÷ ~15%(11.6% in 2020)
~ €300m ÷ €340m(~€208m1 in 2020)
Keep outperforming market on
Car ≥18”
ForEx still negative
Price/Mix off-setting Raw Mat.
Net Efficiencies in line with the 20-
22 Competitiveness Plan, partially
dented by COVID actions reversal
CapEx back to ~7% on Net Sales
A more detailed guidance will be provided on March 31st
FY 2020 PREL. UNAUDITED RESULTSMilan, March 10th, 202111
2020 MARKET AND PIRELLI PERFORMANCE2
3 2020 FINANCIAL REVIEW
AGENDA
4 APPENDIX
2020 DELIVERY AND 2021 OUTLOOK1
11

FY 2020 PREL. UNAUDITED RESULTSMilan, March 10th, 202112
1Q 2Q 3Q FY4Q
≤17”
-51%-21% -11% -23%-7%
-65%-20% -12% -24%+7%
-45%-21% -11% -22%-12%
≥18”
+5%-14% +13% -8%-35%
+4%-9% +19% -6%-43%
+6%-18% +7% -9%-29%
1Q 2Q 3Q FY4Q2Q 3Q FY4Q
TOTAL
-43%-18% +2% -16%-4%
-52%-14% +15% -13%-2%
-39%-20% -5% -17%-4%
1Q
PIRELLI OVER-PERFORMING CAR TYRE MARKET IN 2H 2020
-17%-22%
-35%
-7% -2%-12%
-35%
2% 5%
-10%-6%
-21%-35%
-1%-15%
MARKET
-6%
-42%
-24%
-3%-19%
0%
-16% -13%
-47%
9%0%
-22%
-43%
-4%-18%
MARKET
-2%
-22%-33%
-7%-16%
-26%
-9%
3%
-7%
3%
-1%
-15%-20%
-32%
-6%MARKET
TOTAL
O.E.
REPL.
12
Focus on next slide
FY 2020 PREL. UNAUDITED RESULTSMilan, March 10th, 202113
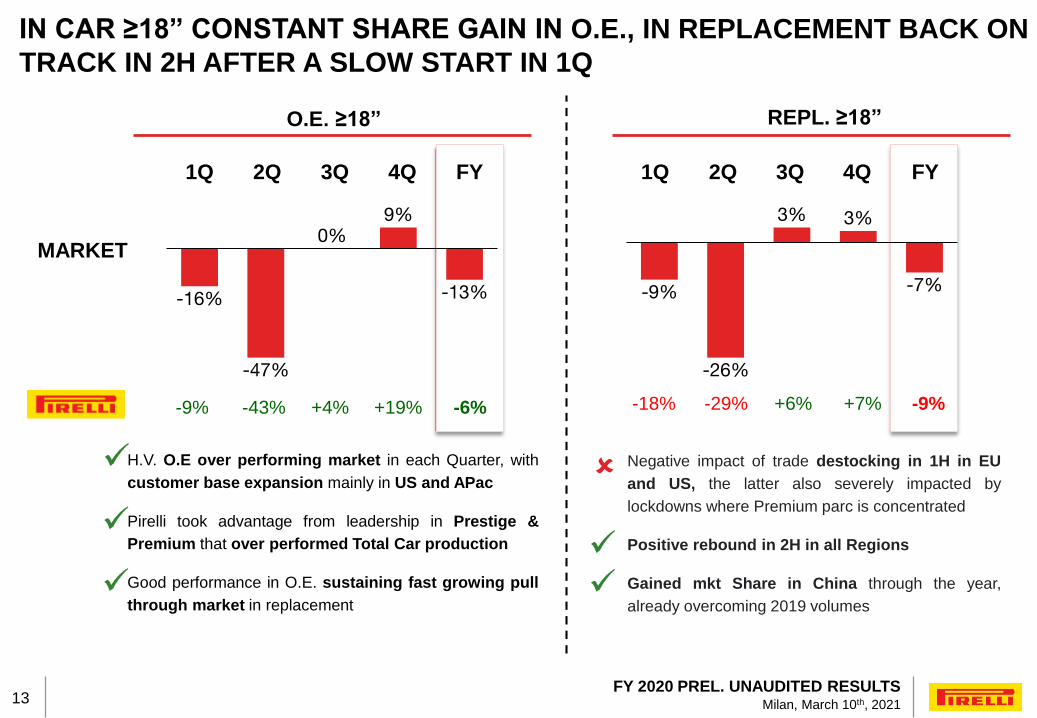
IN CAR ≥18” CONSTANT SHARE GAIN IN O.E., IN REPLACEMENT BACK ON
TRACK IN 2H AFTER A SLOW START IN 1Q
13
O.E. ≥18” REPL. ≥18”
-13%-16%
0%
-47%
9%
+4%-9% +19% -6%-43%
MARKET
1Q 2Q 3Q FY4Q 1Q 2Q 3Q FY4Q
-9%
-26%
3% 3%
-7%
+6%-18% +7% -9%-29%
H.V. O.E over performing market in each Quarter, with
customer base expansion mainly in US and APac
Pirelli took advantage from leadership in Prestige &
Premium that over performed Total Car production
Good performance in O.E. sustaining fast growing pull
through market in replacement
Negative impact of trade destocking in 1H in EU
and US, the latter also severely impacted by
lockdowns where Premium parc is concentrated
Positive rebound in 2H in all Regions
Gained mkt Share in China through the year,
already overcoming 2019 volumes
FY 2020 PREL. UNAUDITED RESULTSMilan, March 10th, 202114
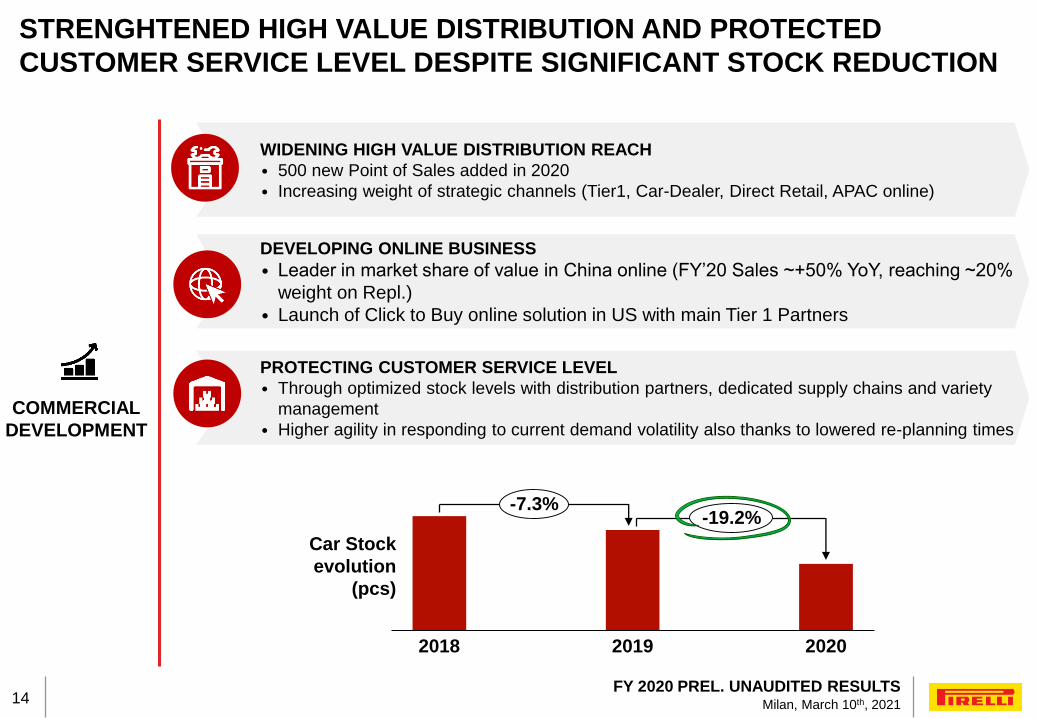
STRENGHTENED HIGH VALUE DISTRIBUTION AND PROTECTED
CUSTOMER SERVICE LEVEL DESPITE SIGNIFICANT STOCK REDUCTION
COMMERCIAL
DEVELOPMENT
DEVELOPING ONLINE BUSINESS
• Leader in market share of value in China online (FY’20 Sales ~+50% YoY, reaching ~20%
weight on Repl.)
• Launch of Click to Buy online solution in US with main Tier 1 Partners
PROTECTING CUSTOMER SERVICE LEVEL
• Through optimized stock levels with distribution partners, dedicated supply chains and variety
management
• Higher agility in responding to current demand volatility also thanks to lowered re-planning times
WIDENING HIGH VALUE DISTRIBUTION REACH
• 500 new Point of Sales added in 2020
• Increasing weight of strategic channels (Tier1, Car-Dealer, Direct Retail, APAC online)
14
Car Stock
evolution
(pcs)
2018 2019 2020
-7.3%-19.2%
FY 2020 PREL. UNAUDITED RESULTSMilan, March 10th, 202115
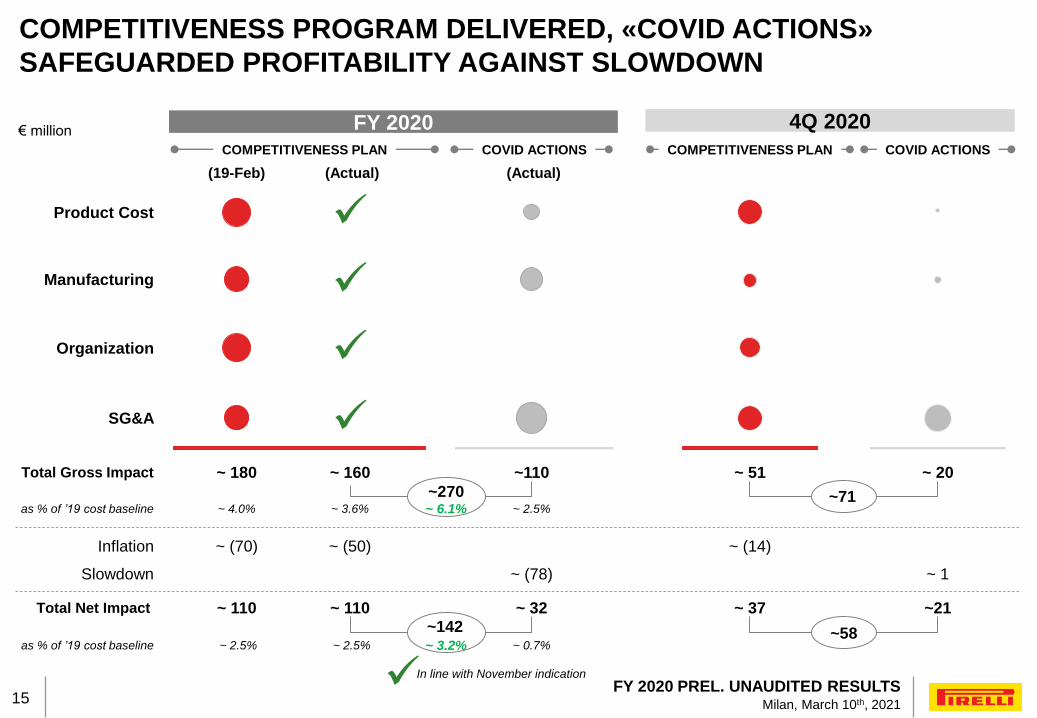
~142
€ million
COMPETITIVENESS PROGRAM DELIVERED, «COVID ACTIONS»
SAFEGUARDED PROFITABILITY AGAINST SLOWDOWN
Product Cost
Manufacturing
Organization
SG&A
~ 160
~ 110
COVID ACTIONS
~ 32
~ 180
~ 2.5%
~ 110
Total Gross Impact
Total Net Impact
~ 4.0%
as % of ’19 cost baseline
as % of ’19 cost baseline
COMPETITIVENESS PLAN
~ 2.5%
~110
4Q 2020FY 2020COVID ACTIONSCOMPETITIVENESS PLAN
~ 51
Inflation ~ (70) ~ (50) ~ (14)
~ 37
~ 20
Slowdown ~ (78) ~ 1
~21
~270~ 6.1%
~ 3.2%
~71
~58
~ 3.6%
(19-Feb) (Actual)(Actual)
In line with November indication
15
~ 2.5%
~ 0.7%
FY 2020 PREL. UNAUDITED RESULTSMilan, March 10th, 202116
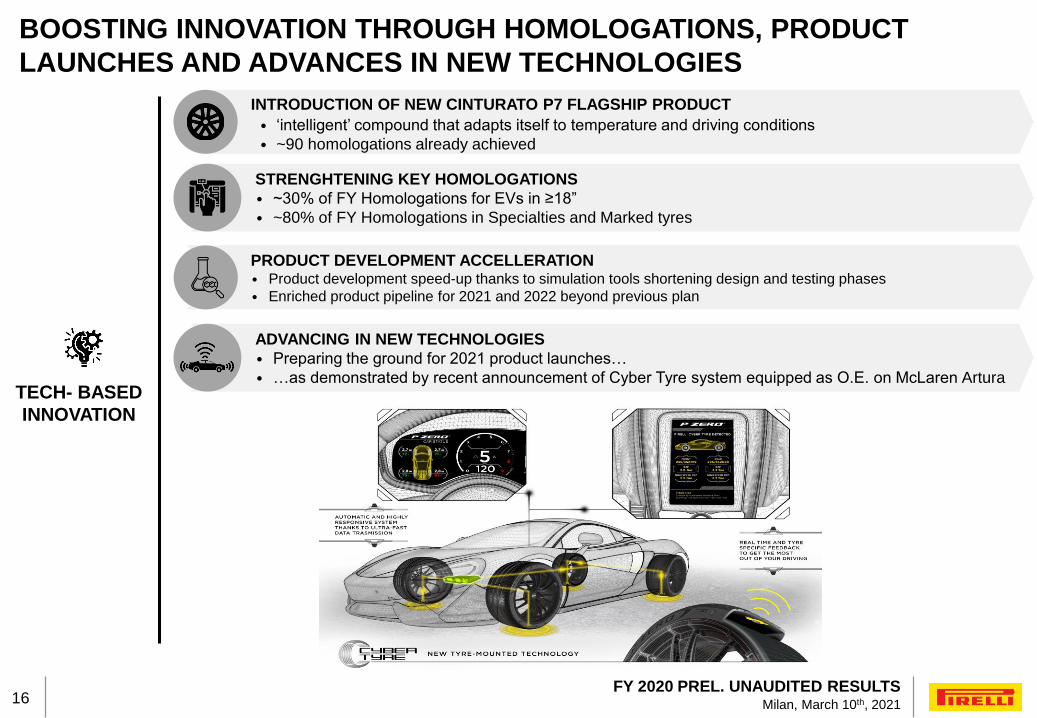
BOOSTING INNOVATION THROUGH HOMOLOGATIONS, PRODUCT
LAUNCHES AND ADVANCES IN NEW TECHNOLOGIES
TECH- BASED
INNOVATION
16
PRODUCT DEVELOPMENT ACCELLERATION• Product development speed-up thanks to simulation tools shortening design and testing phases
• Enriched product pipeline for 2021 and 2022 beyond previous plan
STRENGHTENING KEY HOMOLOGATIONS
• ~30% of FY Homologations for EVs in ≥18”
• ~80% of FY Homologations in Specialties and Marked tyres
ADVANCING IN NEW TECHNOLOGIES
• Preparing the ground for 2021 product launches…
• …as demonstrated by recent announcement of Cyber Tyre system equipped as O.E. on McLaren Artura
INTRODUCTION OF NEW CINTURATO P7 FLAGSHIP PRODUCT
• ‘intelligent’ compound that adapts itself to temperature and driving conditions
• ~90 homologations already achieved
FY 2020 PREL. UNAUDITED RESULTSMilan, March 10th, 202117
2
3 2020 FINANCIAL REVIEW
AGENDA
4 APPENDIX
1
2020 MARKET AND PIRELLI PERFORMANCE
KEY MESSAGES AND 2021 OUTLOOK
17

FY 2020 PREL. UNAUDITED RESULTSMilan, March 10th, 202118
+1.2%5,323
4,302
Net Sales
FY’19
Net Sales
FY’20
Price/Mix
-817-267
Volumes FX
63
-21.4%
-15.3% -5.1% -19.2% -14.1%
High Value
o/w Organic
1Q‘20 -20.2% -18.5%-14.2%
-14.0%
-20.0%-17.2% -1.3% -1.5%
O.E. -9.5%
Repl. -17.5%
2Q‘20 -50.4%-35.2%
-35.0%
-38.3%-43.0%-41.6% +3.3% -4.7%
O.E. -42.6%
Repl. -29.5%
Standard
€ million
FY 2020 NET SALES BRIDGE
o/w Car ≥18”
o/w Car ≥18”
3Q‘20 -11.9%+3.9%
+5.3%
-1.5%-7.5%-3.8% +2.3% -6.0%
O.E. +4.3%
Repl. +6.1%
o/w Car ≥18”
4Q‘20 -7.3%+10.3%
+12.6%
+1.7%-6.1%+0.6% -7.8%
O.E. +19.1%
Repl. +6.5%
o/w Car ≥18”
70%67%
-9.0%
-7.8%O.E. -6.3%
Repl. -8.9%
o/w Car ≥18”
+1.1%
High Value Standard
18
FY 2020 PREL. UNAUDITED RESULTSMilan, March 10th, 202119
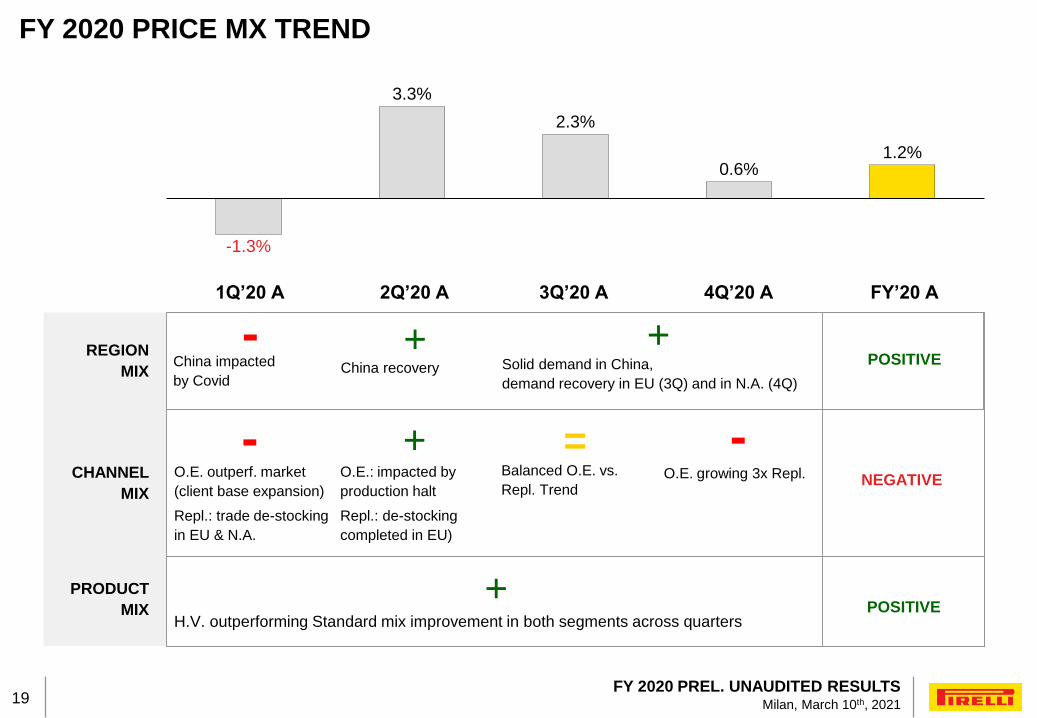
FY 2020 PRICE MX TREND
+
-
2.3%
3.3%
-1.3%
1.2%0.6%
China impacted
by Covid
O.E. outperf. market
(client base expansion)
Repl.: trade de-stocking
in EU & N.A.
China recovery Solid demand in China,
demand recovery in EU (3Q) and in N.A. (4Q)
O.E.: impacted by
production halt
Repl.: de-stocking
completed in EU)
Balanced O.E. vs.
Repl. TrendO.E. growing 3x Repl.
H.V. outperforming Standard mix improvement in both segments across quarters
REGION
MIX
CHANNEL
MIX
PRODUCT
MIX
-
- +
+
+
=
POSITIVE
POSITIVE
NEGATIVE
1Q’20 A 2Q’20 A 3Q’20 A 4Q’20 A FY’20 A
19
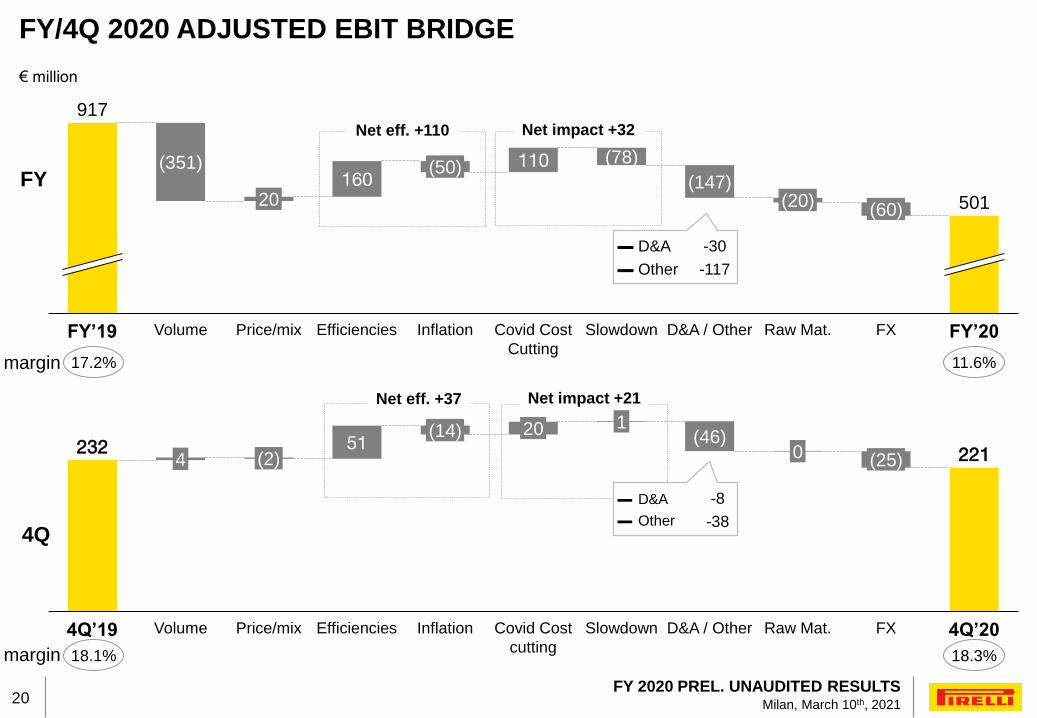
FY 2020 PREL. UNAUDITED RESULTSMilan, March 10th, 202120
160110(351)
FXFY’19 Volume
(147)
Raw Mat. FY’20Covid Cost
Cutting
Inflation
(50)
EfficienciesPrice/mix
(60)20
917
501
Slowdown D&A / Other
(20)
(78)
€ million
FY/4Q 2020 ADJUSTED EBIT BRIDGE
17.2%margin
Net eff. +110 Net impact +32
11.6%
232 22151
4Q’19
4
Volume Inflation
(14)
EfficienciesPrice/mix
(2)
20
Covid Cost
cutting
1
Slowdown 4Q’20
(46)
D&A / Other
0
Raw Mat.
(25)
FX
Net eff. +37 Net impact +21
▬ D&A
▬ Other
-8
-38
18.1%margin 18.3%
4Q
FY
▬ D&A
▬ Other
-30
-117
20

FY 2020 PREL. UNAUDITED RESULTSMilan, March 10th, 202121
43
(47)
(416)
Δ Net income
/ loss from
equity
participations
458
6
Net Income
reported
FY’19
Δ non rec. /
restr. costs
Δ adj. EBIT
(108)
Δ Financial
income /
charges
150
Δ Taxes Net Income
reported
FY’20
% on Sales
Non recurring / restr. costs / other adj. +60 +168
Adj. Net Income 246514
PPA amortization +115 +115
Financial income (Brazilian tax credit) -107 -
43458Net Income reported
FY’19 FY’20
Taxes impact -79-11
€ million
FY 2020 NET INCOME BRIDGE
8.6% 1.0%
incl. +60 of COVID-19
direct costs
incl. -71 of Brazialian
tax credit impact
21
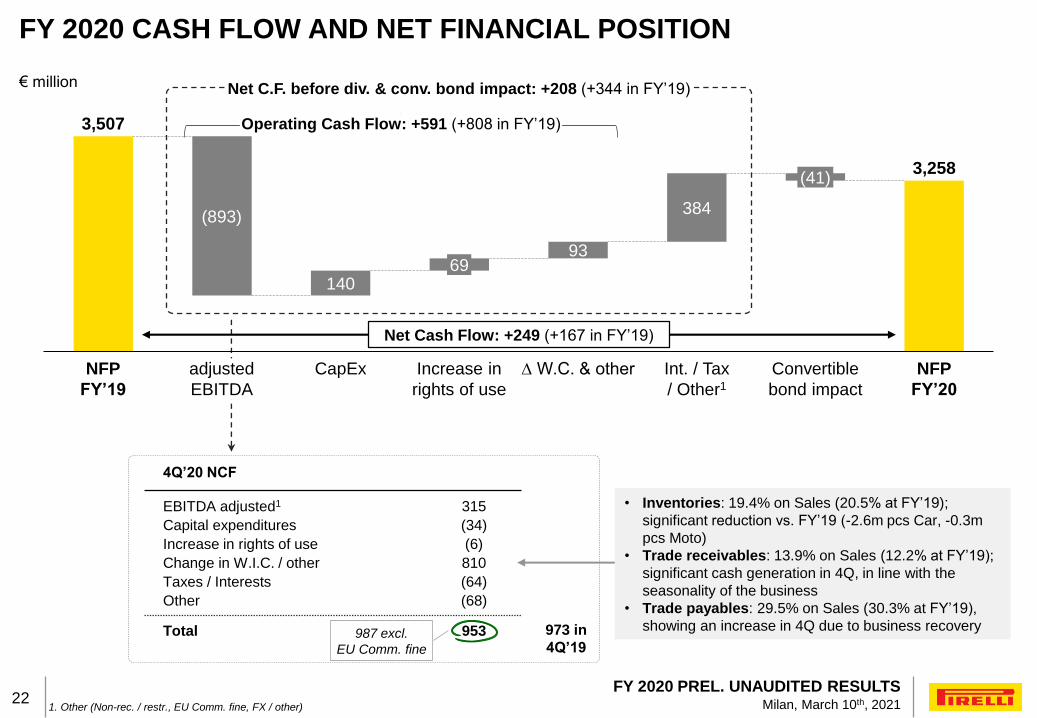
FY 2020 PREL. UNAUDITED RESULTSMilan, March 10th, 202122
3,507
3,258
140
93
384
Increase in
rights of use
adjusted
EBITDA
NFP
FY’19
(893)
CapEx ∆ W.C. & other
69
Int. / Tax
/ Other1
(41)
Convertible
bond impact
NFP
FY’20
€ million
1. Other (Non-rec. / restr., EU Comm. fine, FX / other)
FY 2020 CASH FLOW AND NET FINANCIAL POSITION
Net Cash Flow: +249 (+167 in FY’19)
4Q’20 NCF
EBITDA adjusted1 315
Capital expenditures (34)
Increase in rights of use (6)
Change in W.I.C. / other 810
Taxes / Interests (64)
Other (68)
Total 953 973 in
4Q’19
• Inventories: 19.4% on Sales (20.5% at FY’19);
significant reduction vs. FY’19 (-2.6m pcs Car, -0.3m
pcs Moto)
• Trade receivables: 13.9% on Sales (12.2% at FY’19);
significant cash generation in 4Q, in line with the
seasonality of the business
• Trade payables: 29.5% on Sales (30.3% at FY’19),
showing an increase in 4Q due to business recovery987 excl.
EU Comm. fine
Operating Cash Flow: +591 (+808 in FY’19)
Net C.F. before div. & conv. bond impact: +208 (+344 in FY’19)
22
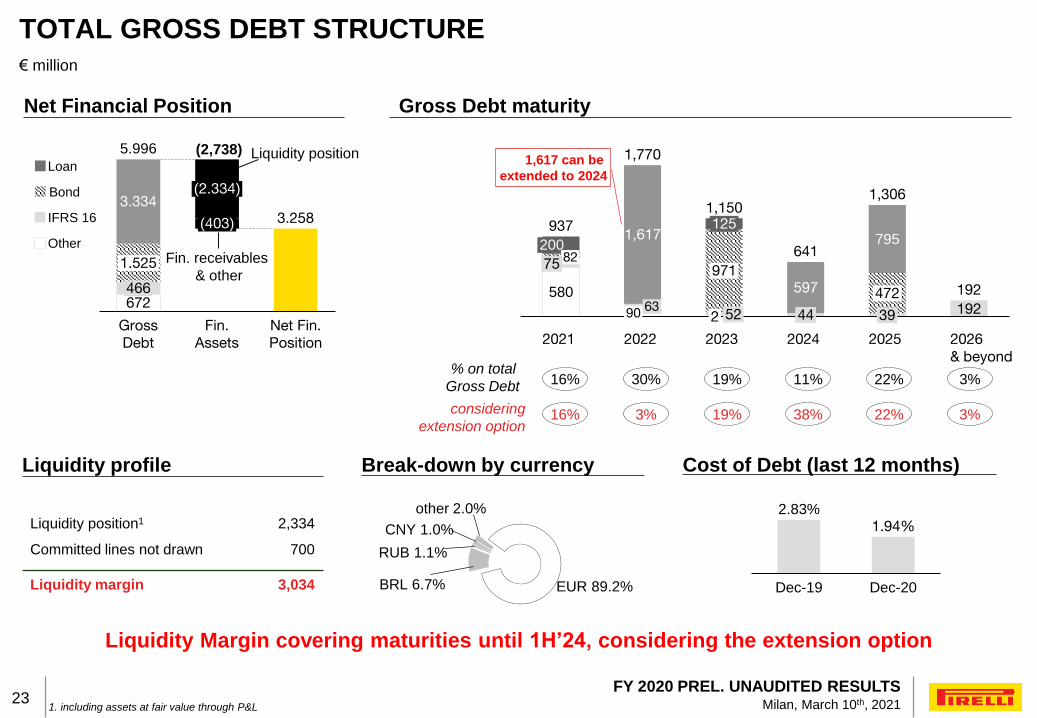
FY 2020 PREL. UNAUDITED RESULTSMilan, March 10th, 202123
Dec-19 Dec-20
2.83%1.94%
Gross Debt maturityNet Financial Position
580192
597
1,617 795
90
2023
20082
75
2021 2022
63
1251,150
971
522
641
44
2024
472
39
2025 2026
& beyond
937
1,770
1,306
192672
Net Fin.
Position
1.525
466
Gross
Debt
Fin.
Assets
(403)
(2.334)
5.996
3.3343.258
Liquidity profile
Liquidity position1
Liquidity margin
2,334
3,034
% on total
Gross Debt
Fin. receivables
& other
16% 19% 11% 3%
Cost of Debt (last 12 months)
30%
(2,738)
€ million
1. including assets at fair value through P&L
TOTAL GROSS DEBT STRUCTURE
22%
1,617 can be
extended to 2024
Liquidity positionLoan
Bond
Other
IFRS 16
Break-down by currency
EUR 89.2%
other 2.0%
RUB 1.1%
CNY 1.0%
BRL 6.7%
Committed lines not drawn 700
Liquidity Margin covering maturities until 1H’24, considering the extension option
considering
extension option16% 19% 38% 3%3% 22%
23
FY 2020 PREL. UNAUDITED RESULTSMilan, March 10th, 202124
2
3 2020 FINANCIAL REVIEW
AGENDA
4 APPENDIX
1
2020 MARKET AND PIRELLI PERFORMANCE
2020 DELIVERY AND 2021 OUTLOOK
24
FY 2020 PREL. UNAUDITED RESULTSMilan, March 10th, 202125
€ million
1. Excl. FX; 2. before non-recurring items & restructuring costs; 3. before amortization of PPA, non-recurring items &
restructuring costs; 4. calculated by adjusting Net Income (Loss) for EBIT adjustments, net financial expenses and taxes
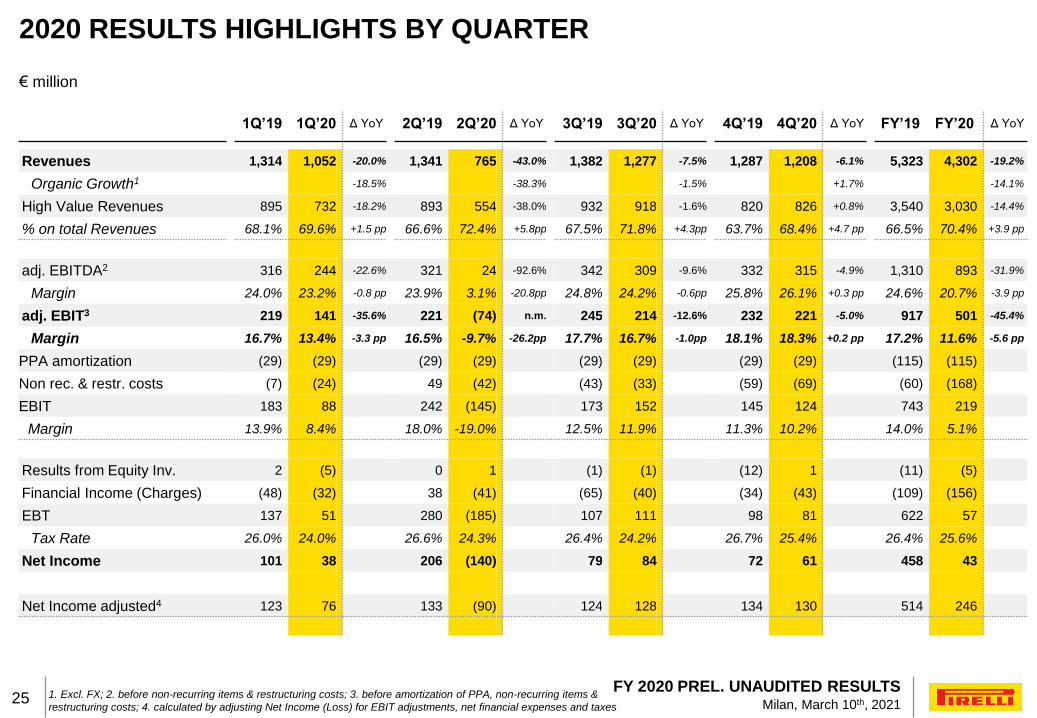
2020 RESULTS HIGHLIGHTS BY QUARTER
1Q’19 1Q’20 Δ YoY 2Q’19 2Q’20 Δ YoY 3Q’19 3Q’20 Δ YoY 4Q’19 4Q’20 Δ YoY FY’19 FY’20 Δ YoY
Revenues 1,314 1,052 -20.0% 1,341 765 -43.0% 1,382 1,277 -7.5% 1,287 1,208 -6.1% 5,323 4,302 -19.2%
Organic Growth1 -18.5% -38.3% -1.5% +1.7% -14.1%
High Value Revenues 895 732 -18.2% 893 554 -38.0% 932 918 -1.6% 820 826 +0.8% 3,540 3,030 -14.4%
% on total Revenues 68.1% 69.6% +1.5 pp 66.6% 72.4% +5.8pp 67.5% 71.8% +4.3pp 63.7% 68.4% +4.7 pp 66.5% 70.4% +3.9 pp
adj. EBITDA2 316 244 -22.6% 321 24 -92.6% 342 309 -9.6% 332 315 -4.9% 1,310 893 -31.9%
Margin 24.0% 23.2% -0.8 pp 23.9% 3.1% -20.8pp 24.8% 24.2% -0.6pp 25.8% 26.1% +0.3 pp 24.6% 20.7% -3.9 pp
adj. EBIT3 219 141 -35.6% 221 (74) n.m. 245 214 -12.6% 232 221 -5.0% 917 501 -45.4%
Margin 16.7% 13.4% -3.3 pp 16.5% -9.7% -26.2pp 17.7% 16.7% -1.0pp 18.1% 18.3% +0.2 pp 17.2% 11.6% -5.6 pp
PPA amortization (29) (29) (29) (29) (29) (29) (29) (29) (115) (115)
Non rec. & restr. costs (7) (24) 49 (42) (43) (33) (59) (69) (60) (168)
EBIT 183 88 242 (145) 173 152 145 124 743 219
Margin 13.9% 8.4% 18.0% -19.0% 12.5% 11.9% 11.3% 10.2% 14.0% 5.1%
Results from Equity Inv. 2 (5) 0 1 (1) (1) (12) 1 (11) (5)
Financial Income (Charges) (48) (32) 38 (41) (65) (40) (34) (43) (109) (156)
EBT 137 51 280 (185) 107 111 98 81 622 57
Tax Rate 26.0% 24.0% 26.6% 24.3% 26.4% 24.2% 26.7% 25.4% 26.4% 25.6%
Net Income 101 38 206 (140) 79 84 72 61 458 43
Net Income adjusted4 123 76 133 (90) 124 128 134 130 514 246
25
FY 2020 PREL. UNAUDITED RESULTSMilan, March 10th, 202126 Source: Pirelli tyre market estimates based on main data provider for the Region; historical market
data may be subject to restatement
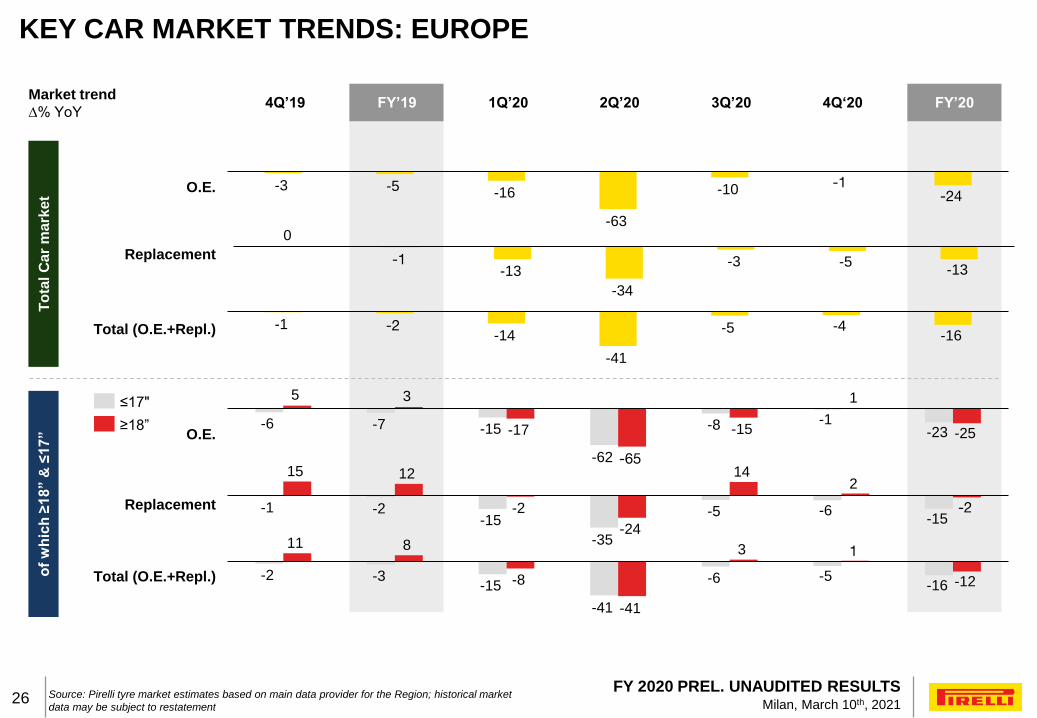
KEY CAR MARKET TRENDS: EUROPE
O.E.
Replacement
Total (O.E.+Repl.)
O.E.
Total (O.E.+Repl.)
4Q’19 FY’19 1Q’20 3Q’20 4Q‘20
Replacement
Market trend
∆% YoY2Q’20 FY’20
-6 -7 -15
-62
-8 -1 -23
5 3
-17
-65
-15
1
-25
-1 -2 -15
-35
-5 -6 -15
15 12
-2
-24
14 2
-2
-2 -3 -15
-41
-6 -5 -16
11 8
-8
-41
3 1
-12
-3 -5 -16
-63
-10 -1
-24
0
-1 -13
-34
-3 -5 -13
-1 -2 -14
-41
-5 -4 -16
≤17"
≥18”
To
tal C
ar
ma
rke
to
f w
hic
h ≥
18” &
≤1
7”
26
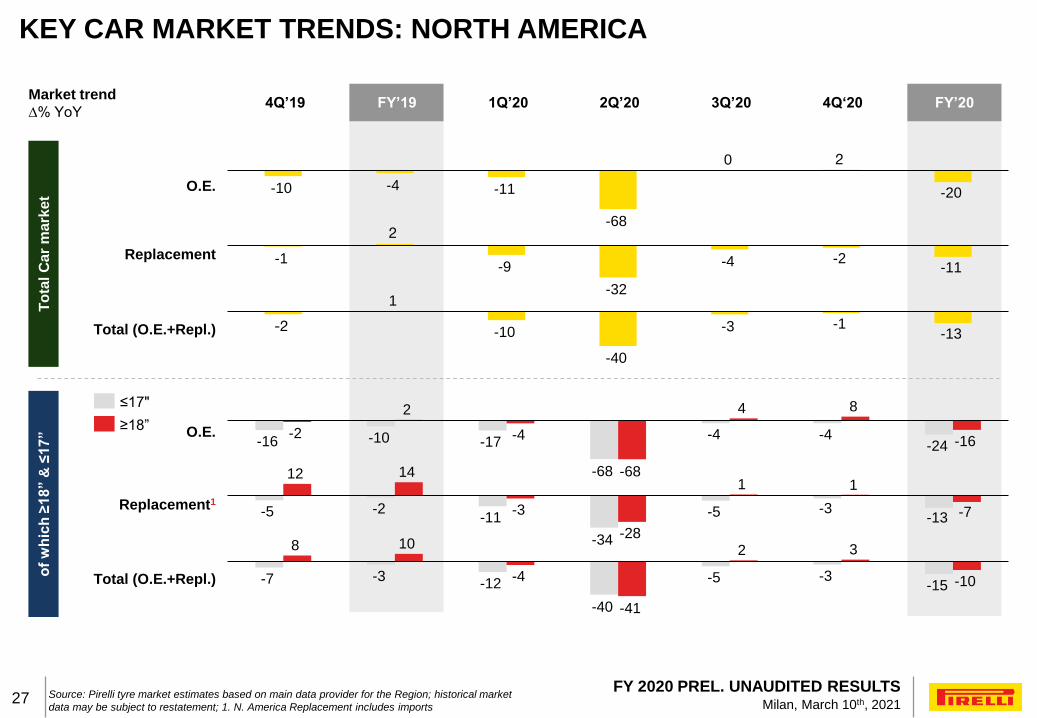
FY 2020 PREL. UNAUDITED RESULTSMilan, March 10th, 202127 Source: Pirelli tyre market estimates based on main data provider for the Region; historical market
data may be subject to restatement; 1. N. America Replacement includes imports
KEY CAR MARKET TRENDS: NORTH AMERICA
O.E.
Replacement
Total (O.E.+Repl.)
O.E.
Total (O.E.+Repl.)
Replacement1
-16 -10 -17
-68
-4 -4 -24
-2
2
-4
-68
4 8
-16
-5 -2 -11
-34
-5 -3 -13
12 14
-3
-28
1 1
-7
-7 -3 -12
-40
-5 -3 -15
8 10
-4
-41
2 3
-10
-10 -4 -11
-68
2
-20
0
-1
2
-9
-32
-4 -2 -11
-2
1
-10
-40
-3 -1 -13
Market trend
∆% YoY
≤17"
≥18”
To
tal C
ar
ma
rke
to
f w
hic
h ≥
18” &
≤1
7”
4Q’19 FY’19 1Q’20 3Q’20 4Q‘202Q’20 FY’20
27
FY 2020 PREL. UNAUDITED RESULTSMilan, March 10th, 202128
Market trend
∆% YoY
O.E.
Replacement
Total (O.E.+Repl.)
O.E.
Total (O.E.+Repl.)
Replacement
-6 -9
-33 -16
-3 -4 -14
10 4
-28 -12
5 14
-4
-1
3
-43 -16
-2
7
-13
7 10
-38 -13
8 9
-7
-3 -2
-39 -16
-3
3
-13
9 6
-31 -13
6 13
-5
≥18”
≤17"
-3 -6
-32 -15
-1 0 -12
3
-43
-16 -2
7
-13 0
-1 -1
-38 -16
-1
4
-12
To
tal C
ar
ma
rke
to
f w
hic
h ≥
18” &
≤1
7”
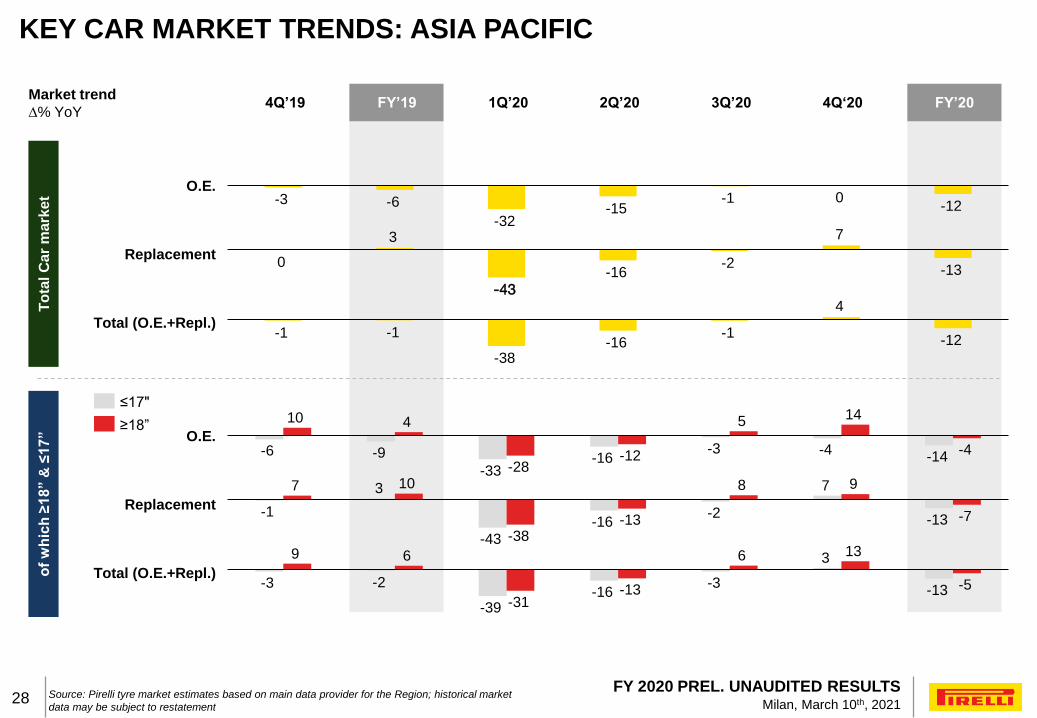
Source: Pirelli tyre market estimates based on main data provider for the Region; historical market
data may be subject to restatement
KEY CAR MARKET TRENDS: ASIA PACIFIC
4Q’19 FY’19 1Q’20 3Q’20 4Q‘202Q’20 FY’20
28
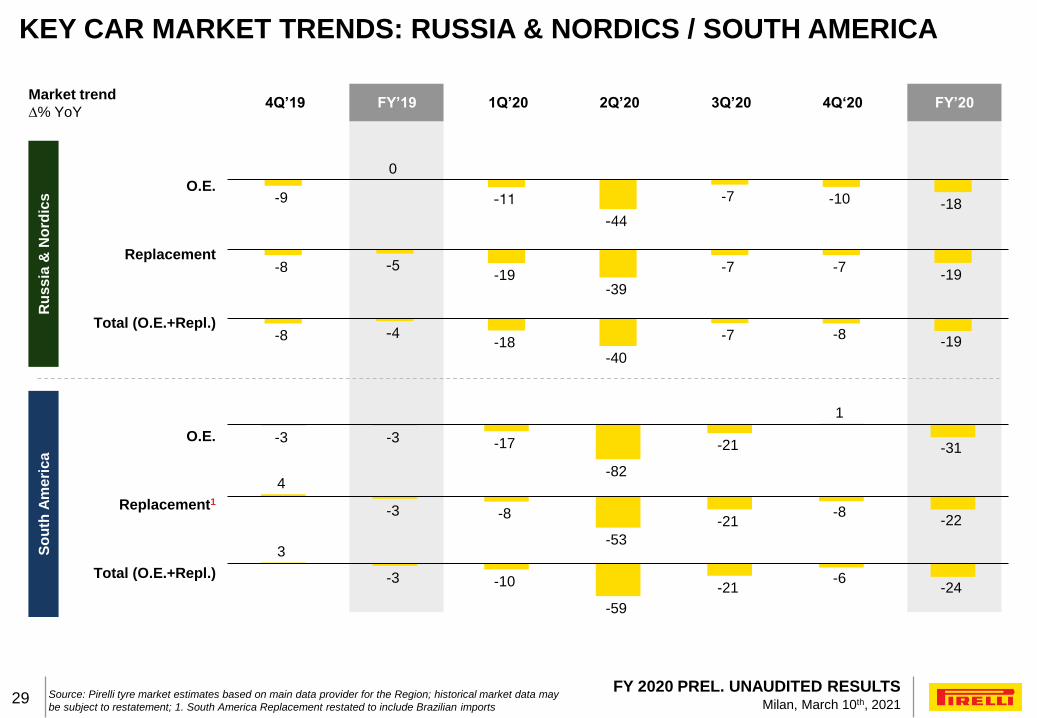
FY 2020 PREL. UNAUDITED RESULTSMilan, March 10th, 202129 Source: Pirelli tyre market estimates based on main data provider for the Region; historical market data may
be subject to restatement; 1. South America Replacement restated to include Brazilian imports
KEY CAR MARKET TRENDS: RUSSIA & NORDICS / SOUTH AMERICA
O.E.
Replacement
Total (O.E.+Repl.)
O.E.
Total (O.E.+Repl.)
Replacement1
Market trend
∆% YoY
-9
0
-11
-44
-7 -10 -18
-8 -5 -19
-39
-7 -7 -19
-8 -4 -18
-40
-7 -8 -19
-3 -3 -17
-82
-21
1
-31
4
-3 -8
-53
-21 -8
-22
3
-3 -10
-59
-21 -6
-24
Ru
ss
ia &
No
rdic
sS
ou
th A
me
ric
a
4Q’19 FY’19 1Q’20 3Q’20 4Q‘202Q’20 FY’20
29

FY 2020 PREL. UNAUDITED RESULTSMilan, March 10th, 202130
Source: Natural Rubber -> Sicom; Brent -> www.oilnergy.com
RAW MATERIAL COSTS TREND AND MIX
main raw materials price trend
25
35
45
55
65
75
85
0.75
1.00
1.25
1.50
1.75
2.00
2.25
J F M A M J J A S O N D J F M A M J J A S O N D J F M A M J J A S O N D J F M A M J J A S O N D
$ / kg $ / barrelBrent Oil (in $ / barrel) Natural Rubber (in $ / kg)
Synth. Rubber
25%
(-1ppYoY)
Textiles
18%
(-1pp YoY)
Steel Reinf.
10%
(0pp YoY)
Natural Rubber
13%
(0pp YoY)
30%
raw mat. costs
on sales
Carbon Black
11%
(-1ppYoY)
Chemicals
23%
(+1pp YoY)
FY 2020 mix (based on purchasing cost)
54.8 ; +22% YoY
1.651 ; +20% YoY
71.5 ; +31% YoY
1.365 ; -17% YoY
20202017 2018
yearly avg. ; Δ YoY
2019
64.2 ; -10% YoY
1.406 ; +3% YoY
43.2 ; -33% YoY
1.317 ; -6% YoY
30

FY 2020 PREL. UNAUDITED RESULTSMilan, March 10th, 202131
1. 49% Joint Venture with the Hixih Group
MANUFACTURING FOOTPRINT AS OF DECEMBER 31ST, 2020
U.S.
▬ Rome – Car
Brazil
▬ Campinas –
Car
▬ Feira de
Santana – Car
▬ Gravatai – Moto Argentina
▬ Merlo – Car
Mexico
▬ Silao – Car
U.K.
▬ Burton – Car
▬ Carlisle – Car
Indonesia
▬ Subang –
Moto (JV)
China
▬ Yanzhou –
Car / Moto
▬ Jiaozuo – Car
▬ Shenzhou –
Car (JV)1
Russia
▬ Kirov – Car
▬ Voronezh –
Car
Turkey
▬ Izmit – Car
Italy
▬ Bollate – Car
▬ Settimo – Car
Germany
▬ Breuberg –
Car / Moto
Romania
▬ Slatina – Car
31

FY 2020 PREL. UNAUDITED RESULTSMilan, March 10th, 2021