fy 2019 economic forecast and revenue...
TRANSCRIPT

Presented by:
Jim Muschinske, Revenue Manager
Commission on Government Forecasting and Accountability
703 Stratton Office Building; Springfield, Illinois 62706
February 27, 2018
FY 2019 Economic Forecast and Revenue Estimate
and FY 2018 Revenue Update

-2-
CGFA Commission Members
Senate
Senator Heather Steans
Co-Chair
Senator David Koehler
Senator Chapin Rose
Senator Elgie Sims
Senator Dave Syverson
Senator Jil Tracy
Jim Muschinske
Revenue Manager
House of Representatives
Representative Robert Pritchard
Co-Chair
Representative Kelly Burke
Representative C.D. Davidsmeyer
Representative Al Riley
Representative Barbara Wheeler
Vacant
http://cgfa.ilga.gov
Clayton Klenke
Executive Director
Laurie Eby
Deputy Director

-3-
CGFA Background & Responsibilities
• Bi-Partisan, joint legislative commission, provides the General Assembly with information relevant to the Illinois economy, taxes and other sources of revenue and debt obligations of the State.
• Preparation of annual revenue estimates with periodic updates;
• Analysis of the fiscal impact of revenue bills;
• Preparation of State Debt Impact Notes;
• Periodic assessment of capital facility plans;
• Annual estimates of the liabilities of the State’s group health insurance program and approval of contract renewals promulgated by the Department of Central Management Services;
• Implement the provisions of the State Facility Closure Act;
• Annual estimates of public pension funding requirements and preparation of pension impact notes.

-4-
THE ECONOMY

CHANGE IN REAL GDP
-5-
• The chart shows quarterly
GDP growth for the years 2007
through the fourth quarter of
2017.
• As can be seen, after the severe
recession, the recovery that
began in June 2009 has been
steady but erratic on a
quarterly basis.
• Preliminary numbers from
2017 indicate that the U.S.
economy grew at 2.3% which
is an improvement from the
1.5% in 2016, but a slowdown
from the levels seen in 2015
(2.9%) and 2014 (2.6%).
• An aggregate of economic
forecasts has a mean estimate
for real GDP growth of 2.9%
in 2018 and 2.4% in 2019.
-10.0
-8.0
-6.0
-4.0
-2.0
0.0
2.0
4.0
6.0
1 2 3 4 1 2 3 4 1 2 3 4 1 2 3 4 1 2 3 4 1 2 3 4 1 2 3 4 1 2 3 4 1 2 3 4 1 2 3 4 1 2 3 4
% C
hange
in R
eal G
DP
U.S. REAL GDP(Calendar Years)
| 07 | 08 | 09 | 10 | 11 | 12 | 13 | 14 | 15 | 16 | 17
U.S. Department of Commerce, Bureau of Economic Analysis
PURCHASING MANAGERS INDEX
-6-
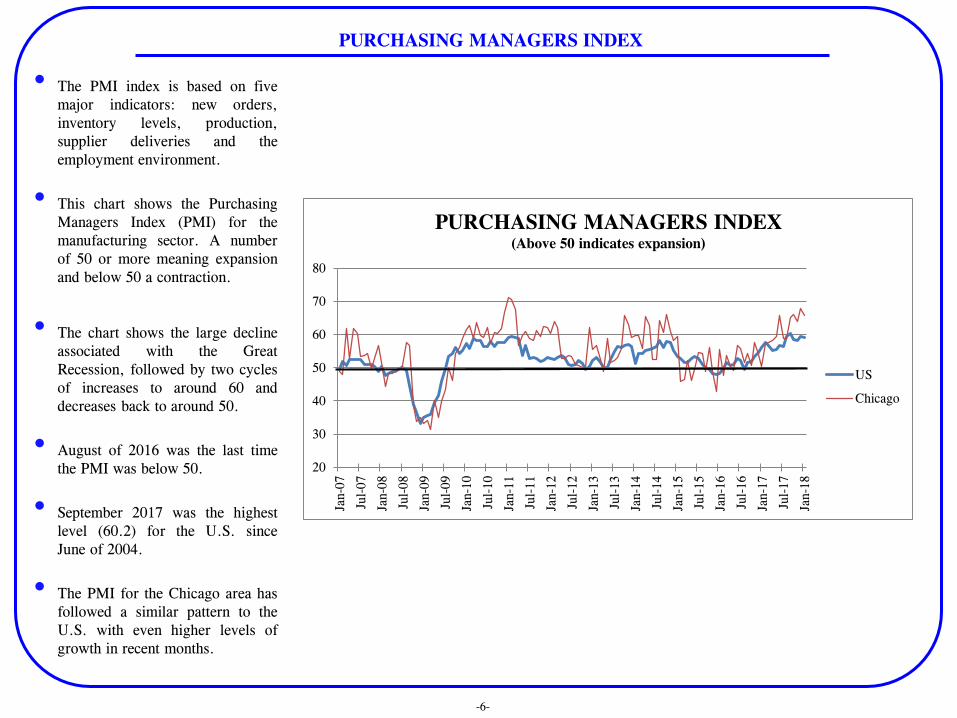
• The PMI index is based on five
major indicators: new orders,
inventory levels, production,
supplier deliveries and the
employment environment.
• This chart shows the Purchasing
Managers Index (PMI) for the
manufacturing sector. A number
of 50 or more meaning expansion
and below 50 a contraction.
• The chart shows the large decline
associated with the Great
Recession, followed by two cycles
of increases to around 60 and
decreases back to around 50.
• August of 2016 was the last time
the PMI was below 50.
• September 2017 was the highest
level (60.2) for the U.S. since
June of 2004.
• The PMI for the Chicago area has
followed a similar pattern to the
U.S. with even higher levels of
growth in recent months.
20
30
40
50
60
70
80
Jan-0
7
Jul-
07
Jan-0
8
Jul-
08
Jan-0
9
Jul-
09
Jan-1
0
Jul-
10
Jan-1
1
Jul-
11
Jan-1
2
Jul-
12
Jan-1
3
Jul-
13
Jan-1
4
Jul-
14
Jan-1
5
Jul-
15
Jan-1
6
Jul-
16
Jan-1
7
Jul-
17
Jan-1
8
PURCHASING MANAGERS INDEX (Above 50 indicates expansion)
US
Chicago

NON-MANUFACTURING INDEX (NMI)
-7-
• The NMI is a composite index
based on the diffusion indexes for
four of the indicators with equal
weights: business activity, new
orders, and employment – all of
which are seasonally adjusted –
and supplier deliveries.
• The Non-Manufacturing Index
(NMI) is a composite index that is
calculated as an indicator of the
overall economic condition for the
non-manufacturing sector, which
is far larger than the
manufacturing sector.
• The chart shows the large decline
associated with the Great
Recession, followed by steady
expansion.
• Based on the NMI, the non-
manufacturing sector doesn’t show
the same ups and downs seen in
the manufacturing sector as
illustrated in the previous slide by
the PMI.
30
35
40
45
50
55
60
65
70
Jan
-08
Jul-
08
Jan
-09
Jul-
09
Jan
-10
Jul-
10
Jan
-11
Jul-
11
Jan
-12
Jul-
12
Jan
-13
Jul-
13
Jan
-14
Jul-
14
Jan
-15
Jul-
15
Jan
-16
Jul-
16
Jan
-17
Jul-
17
Non-Manufacturing Index (NMI) (Above 50 indicates expansion)
US

CONSUMER PRICE INDEX (CPI)
-8-
• The Consumer Price Index (CPI)
is a measure of the average change
over time in the prices paid by
urban consumers for a market
basket of consumer goods and
services.
• The first chart shows the CPI for
the U.S. and the CPI without food
and energy included; these are two
of the more volatile components of
the index.
• While there was some price
volatility around the time of the
Great Recession, it has been
mostly steady between 1.5% to
2.0% since 2011, especially when
food and energy are removed.
• The federal reserve raised interest
rates three times in 2017 but it
does not yet appear to have
affected CPI in a significant way.
• Consumer prices for Chicago have
basically tracked with the nation as
a whole, though Chicago’s price
growth has been consistently a
little lower since February of
2015.
-3.0%
-2.0%
-1.0%
0.0%
1.0%
2.0%
3.0%
4.0%
5.0%
6.0%
Jan-0
7
Jun-0
7
Nov-0
7
Apr-
08
Sep
-08
Feb
-09
Jul-
09
Dec
-09
May
-10
Oct
-10
Mar
-11
Aug-1
1
Jan-1
2
Jun-1
2
Nov-1
2
Apr-
13
Sep
-13
Feb
-14
Jul-
14
Dec
-14
May
-15
Oct
-15
Mar
-16
Aug-1
6
Jan-1
7
Jun-1
7
Nov-1
7
U.S. Consumer Price Index (CPI-U)
CPI CPI less Food & EnergyBureau of Labor Statistics
-4.0%
-3.0%
-2.0%
-1.0%
0.0%
1.0%
2.0%
3.0%
4.0%
5.0%
6.0%
Jan-0
7
Jun-0
7
Nov-0
7
Apr-
08
Sep
-08
Feb
-09
Jul-
09
Dec
-09
May
-10
Oct
-10
Mar
-11
Aug-1
1
Jan-1
2
Jun-1
2
Nov-1
2
Apr-
13
Sep
-13
Feb
-14
Jul-
14
Dec
-14
May
-15
Oct
-15
Mar
-16
Aug-1
6
Jan-1
7
Jun-1
7
Nov-1
7
U.S. vs. ChicagoCPI-U
U.S. ChicagoBureau of Labor Statistics

PRODUCER PRICE INDEX (PPI)
-9-
• While price pressures have not yet
been felt at the consumer level, the
current PPI shows that there has
been an increase in the prices seen
at the wholesale level over the last
year.
• The Producer Price Index (PPI)
program measures the average
change over time in the selling
prices received by domestic
producers for their output. The
prices included in the PPI are from
the first commercial transaction for
many products and some services.
• Similar to other economic
variables, the PPI for the U.S.
rose dramatically prior to the
Great Recession and then fell
precipitously.
• Since January of 2017, the PPI has
averaged 3.5% per month which is
the highest levels since early 2012.
• Price increases at the wholesale
level could indicate higher prices
at the consumer level in the future.
-20.0%
-15.0%
-10.0%
-5.0%
0.0%
5.0%
10.0%
15.0%
20.0%
Jan-0
7
Oct
-07
Jul-
08
Apr-
09
Jan-1
0
Oct
-10
Jul-
11
Apr-
12
Jan-1
3
Oct
-13
Jul-
14
Apr-
15
Jan-1
6
Oct
-16
Jul-
17
Apr-
18
Producer Price Index (Dec. 1984 = 100)
Total Manufacturing Industries
All Commodities
Bureau of Labor Statistics

10-YEAR TREASURY RATE
-10-
• In addition to the increase of the
PPI, the potential for increased
inflation can also be seen in the
recent increase in the 10-year
treasury rate which is a key rate
tied to many transactions,
particularly home mortgages.
• The 10-year treasury rate, while
erratic, had been on a downward
trend since early 2014.
• After hitting the lowest level in
history during the 3rd quarter of
2016, it started to recover.
• However, the upward trend
appeared to be reversed again
beginning March of 2017.
• In early September of 2017, it
fell to 2.07%, but began to
gradually climb. Currently, the
rate is around 2.9%.
1.00
1.25
1.50
1.75
2.00
2.25
2.50
2.75
3.00
3.25
Feb
-14
Apr-
14
Jun-1
4
Aug-1
4
Oct
-14
Dec
-14
Feb
-15
Apr-
15
Jun-1
5
Aug-1
5
Oct
-15
Dec
-15
Feb
-16
Apr-
16
Jun-1
6
Aug-1
6
Oct
-16
Dec
-16
Feb
-17
Apr-
17
Jun-1
7
Aug-1
7
Oct
-17
Dec
-17
Feb
-18
Percent
10-YEAR TREASURY RATE
(Not seasonally adjusted)

UNITED STATES EMPLOYMENT
-11-
• United States employment has
been increasing since a low
reached at the end of 2009.
• Nationally, all the jobs lost
during the last recession were
recovered after 5 years of the
expansion and have been added
to since.
• Most economic forecasters
agree that the economy is at or
closer to full employment.
• Even while employment
growth has continued, the
labor participation rate remains
near its lowest level since the
late 1970s for the past few
years, even if it has shown
continuous improvement as
discouraged workers return to
the labor market.
Household Survey
Establishment Survey
115
120
125
130
135
140
145
150
155
160
Jan-0
4
Jul-
04
Jan-0
5
Jul-
05
Jan-0
6
Jul-
06
Jan-0
7
Jul-
07
Jan-0
8
Jul-
08
Jan-0
9
Jul-
09
Jan-1
0
Jul-
10
Jan-1
1
Jul-
11
Jan-1
2
Jul-
12
Jan-1
3
Jul-
13
Jan-1
4
Jul-
14
Jan-1
5
Jul-
15
Jan-1
6
Jul-
16
Jan-1
7
Jul-
17
Jan-1
8
Jul-
18
Millions
UNITED STATES EMPLOYMNENT
Seasonally-Adjusted

ILLINOIS EMPLOYMENT
-12-
• Like the U.S., Illinois employment
also has shown gains but at a much
slower pace.
• As mentioned, it took 5 years for
U.S. employment to finally recoup
all the jobs lost during the 2007
recession. It was not until around
mid-2015, however, that the
Establishment Survey showed
Illinois recouped all its payroll jobs
lost.
• As shown, the Household
employment measure has yet to do
the same.
• The Establishment Survey shows a
slow upward movement in Illinois
employment, and the Household
Survey finally starts to show a
recovery during the 4th quarter from
the continued drop in the 2nd and 3rd
quarters of 2017.
Household Survey
Establishment Survey
5,500
5,700
5,900
6,100
6,300
6,500
Jan-0
7
Jul-
07
Jan-0
8
Jul-
08
Jan-0
9
Jul-
09
Jan-1
0
Jul-
10
Jan-1
1
Jul-
11
Jan-1
2
Jul-
12
Jan-1
3
Jul-
13
Jan-1
4
Jul-
14
Jan-1
5
Jul-
15
Jan-1
6
Jul-
16
Jan-1
7
Jul-
17
Jan-1
8
Thousands
ILLINOIS EMPLOYMNENT
Seasonally-Adjusted

UNEMPLOYMENT RATES
-13-
• As shown in the chart, the gap
between the nation’s unemployment
rate and that in Illinois has widened
over time.
• The two rates were virtually even in
2006, and both rates rose sharply as
the recession got underway at the
end of 2007.
• However, as the recovery began in
mid-2009, the gap widened, with
Illinois’ rate reaching a high in the
11% area from October 2009
through March 2010.
• While both rates then began to
decline, the gap remained large
before narrowing in 2014 into 2015.
• Since then, while erratic, the spread
has widened again, although the gap
narrowed during the 2nd quarter of
2017, before recently rising.
ILLINOIS
UNITED STATES
0
2
4
6
8
10
12
Jan-0
4
Jul-
04
Jan-0
5
Jul-
05
Jan-0
6
Jul-
06
Jan-0
7
Jul-
07
Jan-0
8
Jul-
08
Jan-0
9
Jul-
09
Jan-1
0
Jul-
10
Jan-1
1
Jul-
11
Jan-1
2
Jul-
12
Jan-1
3
Jul-
13
Jan-1
4
Jul-
14
Jan-1
5
Jul-
15
Jan-1
6
Jul-
16
Jan-1
7
Jul-
17
Jan-1
8
Percent UNEMPLOYMENT RATES

COMPARATIVE UNEMPLOYMENT RATES
-14-
• Unemployment rates have not
moved in sync in recent years.
The chart shows comparative
unemployment rates for the
nation, Midwest, and Illinois.
• In 2008, Midwest and Illinois
rates were similar and only
slightly higher than the nation,
but a gap between Illinois’ rate
and national or Midwest rates
started to widen in 2009.
• Since 2010, unemployment in the
Midwest fell below or at the
national level as resurgence in
several “rust belt” states from
increased energy production
caused an employment spurt.
• Unemployment in Illinois,
however, continued to exceed
both the national and Midwest
rates. Latest data as of December
of 2017 have the national rate at
4.1%, the Midwest at 4.0%, and
the Illinois rate at 4.8%.
2008 2009 2010 2011 2012 2013 2014 2015 2016 2017
U.S. 7.3 9.9 9.3 8.5 7.9 6.7 5.6 5.0 4.7 4.1
Midwest 7.6 10.1 8.8 7.8 7.4 6.7 5.2 4.7 4.7 4.0
Illinois 7.9 11.2 9.5 9.3 9.1 8.4 6.1 6.1 5.7 4.8
0.0
2.0
4.0
6.0
8.0
10.0
12.0Percent
COMPARATIVE UNEMPLOYMENT RATES
Year End

U.S. REAL GDP FORECAST
-15-
• Displayed here are three
alternative forecasts of the U.S.
economy through 2019. The
BASELINE shows the most
likely solution with a 65%
chance of occurrence and has the
economy continuing to grow at
approximately 2.7%.
• A more PESSEMISTIC
scenario, with a 20% probability,
shows a decline in the second
half of 2018 with two
consecutive quarters of
contraction followed by a return
to growth just over 2%.
• A final OPTIMISTIC scenario,
with a 15% probability,
envisions a surge in short term
growth to over 4% in the second
half of 2018 and through the first
half of 2019 related to strong
growth in the housing sector and
improvements associated with the
federal tax reform bill.
-10.0
-8.0
-6.0
-4.0
-2.0
0.0
2.0
4.0
6.0
% C
hange
in R
eal G
DP
U.S. REAL GDP FORECAST(Calendar Years)
Real GDP
Baseline (65%)
Pessimistic (20%)
Optimistic (15%)
IHS Markit

-16-

-17-

-18-
2010
Annual
Average
2011
Annual
Average
2012
Annual
Average
2013
Annual
Average
2014
Annual
Average
2015
Annual
Average
2016
Annual
Average
2017 Annual
Average
(preliminary)
Mining 9.1 9.6 10.2 9.7 9.9 9.3 8.0 8.1
Construction 198.3 195.7 189.1 191.4 201.7 213.6 217.0 215.0
Manufacturing 561.0 573.9 583.0 579.2 580.1 581.3 574.1 572.6
Trade, Transportation, and Utilities 1,125.6 1,143.8 1,156.3 1,164.4 1,179.7 1,201.4 1,208.8 1,206.5
Information 101.8 100.6 100.1 99.0 99.1 101.0 98.7 99.3
Financial Activities 371.6 371.2 374.3 377.5 376.5 380.7 383.2 393.8
Professional and Business Services 793.9 823.5 856.8 883.1 909.5 923.4 934.6 946.5
Education and Health Services 830.8 847.5 862.3 874.4 885.1 899.4 914.3 925.9
Leisure and Hospitality 515.4 522.2 536.1 545.9 558.2 578.3 594.0 597.5
Other Services 249.1 249.7 249.7 249.9 252.2 252.0 250.7 250.6
Government 853.8 837.9 832.4 829.9 827.4 829.1 829.3 825.7
Annual Average Totals 5,610.4 5,675.6 5,750.3 5,804.4 5,879.4 5,969.5 6,012.7 6,041.4
Illinois' Annual % Change -0.8% 1.2% 1.3% 0.9% 1.3% 1.5% 0.7% 0.5%
2010
Annual
Average
2011
Annual
Average
2012
Annual
Average
2013
Annual
Average
2014
Annual
Average
2015
Annual
Average
2016
Annual
Average
2017 Annual
Average
(preliminary)
Mining* N/A N/A N/A N/A N/A N/A N/A N/A
Construction $1,236 $1,282 $1,291 $1,265 $1,302 $1,339 $1,336 $1,356
Manufacturing $926 $978 $982 $1,000 $1,022 $1,042 $1,042 $1,030
Trade, Transportation, and Utilities $693 $734 $766 $790 $805 $807 $806 $820
Information $1,040 $1,005 $1,027 $1,102 $1,155 $1,153 $1,129 $1,202
Financial Activities $1,036 $1,054 $1,131 $1,116 $1,184 $1,244 $1,330 $1,395
Professional and Business Services $1,024 $1,007 $1,027 $1,025 $1,038 $1,049 $1,073 $1,088
Education and Health Services $724 $757 $792 $814 $810 $806 $808 $806
Leisure and Hospitality $319 $322 $337 $323 $340 $365 $377 $392
Other Services $712 $703 $728 $751 $780 $834 $864 $839
Government* N/A N/A N/A N/A N/A N/A N/A N/A
Illinois' Annual Average Weekly Earnings* $799 $820 $846 $856 $875 $890 $902 $914
% Change in Avg. Weekly Earnings 0.9% 2.7% 3.2% 1.2% 2.2% 1.7% 1.3% 1.4%
Annualized Wage/Employment Comparison 0.1% 3.8% 4.6% 2.1% 3.5% 3.2% 2.0% 1.9%
Average Employment Levels by Subsector in Illinois
Non-Seasonally Adjusted Averages: 2010 to 2017 (in thousands)
Average Weekly Earnings and Employment Change by Subsector in Illinois
Calendar Year Averages: 2010 to 2017
* Because the Mining and Government subsectors' weekly earnings are not available from the Bureau of Labor Statistics, "Statewide Average Weekly
Earnings" is calculated by using the weekly earnings of the other nine subsectors. The statewide value was calculated by multiplying each subsector's average
jobs by its average earnings and dividing the sum of these figures by the total number of jobs from these nine subsectors.
Source: www.bls.gov

-19-
GENERAL FUNDS
REVENUE

-20-
As shown in the accompanying table, the FY 2018 budget was based upon assumed revenues of $36.410
billion. The budget assumed a modified base revenue forecast of $30.931 billion, to which was added $5.479
billion through income tax rate increases and other tax changes per SB 9 [P.A. 100-0022]. The budget also
assumed $300 million in proceeds from the sale of the Thompson Center. [For a more detailed explanation of
the revenue components used in the GA’s formulation of the FY 2018 budget, please see Section 2 of the
Commission’s FY 2018 Budget Summary].
In addition, the FY 2018 enacted budget allowed for $6 billion in bond sales, $293 million in fund
sweeps/reallocations, and up to $1.2 billion of interfund borrowing. Approximately $4.581 billion of additional
resources has been, or is anticipated to become, available to the general funds as a result of these items [see
following page for details].
All told, when the above $4.581 billion in additional available resources are combined with the initial enacted
revenue assumption of $36.410, a total of $40.991 billion in available general funds revenues results.
($ millions) Base Changes EnactedRevenue Source Mar-15 Feb-15 GOMB Feb-15
Income Taxes [Net] $14,541 $4,989 $19,530
Sales Tax [Net] $7,931 $90 $8,021
All Other State Sources $3,180 $400 $3,580
Transfers In $1,723 $0 $1,723
Federal Sources $3,556 $0 $3,556
Total $30,931 $5,479 $36,410
Fund Sweeps/Reallocations $275
Interfund Borrowing $600
Federal Sources Due to Medicaid Backlog Payments $1,206
Bond Fund Transfer Proceeds $2,500
Total Additional Resources to General Funds $4,581
Total General Funds with Additional Resources Since Enactment $40,991
Additional Resources to General Funds Since Enactment
FY 2018 GENERAL FUNDS BUDGET PLAN--July 2017
Revenue Assumptions
FY 2018 BUDGETED REVENUE ASSUMPTIONS

-21-
• P.A. 100-0023 allows for fund sweeps/fund reallocations totaling $293 million into the GRF,
Budget Stabilization, Healthcare Provider Relief Fund, or the Health Insurance Reserve Fund.
Through late February, approximately $251 million in fund sweeps/reallocations have been made
into the GRF. It is anticipated that for the fiscal year, $275 million will be made available to the
general funds.
• P.A. 100-0023 also allowed for up to $1.2 billion in Interfund Borrowing from unspecified
special state funds to the general funds and/or the Health Insurance Reserve Fund [repayment is
to occur within 24 months of date borrowed]. Through late February, of the allowed amount,
$510 million has been borrowed and deposited into the GRF. It is anticipated that for the fiscal
year, $600 million will be transferred into the general funds.
• Pursuant to authorization granted by the General Assembly under P. A. 100-0023, the State of
Illinois issued $6 billion in General Obligation bonds in the fall of 2017. The stated purpose of
the bond proceeds was to pay vouchers incurred by the State prior to July 1, 2017. The law
created the Income Tax Bond Fund, in which bond proceeds were deposited prior to
disbursement. In November 2017, $2.5 billion was transferred from the Income Tax Bond Fund
to the GRF for the purpose of paying old Medicaid bills. The action of making those
reimbursable expenditures resulted in $1.206 billion in federal sources being receipted into the
GRF. All told, therefore, the action of the bond sale proceeds and subsequent federal spending
reimbursement amounted to $3.706 billion in additional resources made available to the GRF in
FY 2018.
FY 2018 BUDGETED REVENUE ASSUMPTIONS (continued)

-22-

-23-
Excluding November’s $2.5 billion bond sale transfer
proceeds, as well as $354 million from interfund
borrowing, base general funds grew $5.701 billion
during the first seven months of the fiscal year.
Increased income tax receipts [stemming from the
recently enacted higher tax rates and timing elements
presumably related to estimated payment
abnormalities], as well as fund sweeps, and an
increase in federal sources resulted in the significant
gain.
Through January, gross personal income taxes are up
$2.752 billion, or $2.536 billion net of refunds and
other changes. Gross corporate income taxes are
ahead of last year by $569 million, or $408 million
net. Overall sales taxes are up only $36 million,
although once direct sales tax receipts diverted to the
transportation funds are included, net receipts are
actually down $184 million. Smaller revenue sources
posted a combined gain of $85 million.
Overall transfers, boosted by $207 million in fund
sweeps, are up by $332 million. Federal sources,
reflecting significantly higher reimbursable spending
made possible by the November bond sale, generated
$2.524 billion in growth.
YEAR-TO-DATE FY 2018 GENERAL FUNDS (JULY-JANUARY)

-24-
As shown in the table, the Commission’s updated FY 2018 general funds estimate is $40.604 billion. The outlook reflects
revenue performance through January and incorporates updated expectations over the remainder of the fiscal year. The
forecast represents an outlook that is $387 million less than the modified enacted budget plan of $40.991 billion. Highlights
of the forecast include:
• The $19.519 billion in net income taxes includes updated timing elements related to the recent increase in income tax
rates, accounts for the accelerated estimated payment experienced over the past couple of months and the probable
impact of those and other elements on final payments. Overall, the update only differs $11 million from the
expectations utilized to craft the FY 2018 budget plan.
• Sales tax receipts are forecast to improve very modestly over the remainder of the fiscal year. Growth will be assisted
by approximately $160 million due to timing associated with an interruption in the usual distribution of sales tax that
took place last spring, per IDoR. However, despite those expected growth producing elements, sales tax performance
has to be considered disappointing, as it has been over the last couple of fiscal years, due largely to lack of meaningful
inflationary growth. While improvement is more likely next fiscal year given economic and inflation outlooks, we are
too far into FY 2018 to expect an abrupt turn around. Consequently, sales tax is anticipated to be $166 less than
previously expected when compared to the enacted budget.
($ millions) CGFA Modified Enacted DifferenceRevenue Source Mar-15 Feb-15 GOMB Feb-15
Income Taxes [Net] $19,519 $19,530 ($11)
Sales Tax [Net] $7,855 $8,021 ($166)
All Other State Sources $3,376 $3,580 ($204)
Transfers In $1,992 $1,998 ($6)
Federal Sources $4,762 $4,762 $0
Total $37,504 $37,891 ($387)
Interfund Borrowing $600 $600 $0
Bond Fund Transfer Proceeds [Backlog] $2,500 $2,500 $0
Total General Funds $40,604 $40,991 ($387)
FY 2018 GENERAL FUNDS REVENUE UPDATE
CGFA ESTIMATE vs. Modified Enacted Budget Plan
FY 2018 CGFA UPDATE

-25-
• All other state sources for the most part have performed and are expected to continue to perform
as previously thought. However, with only four months left in the fiscal year, clearly the hoped
for sale of the Thompson Center, and its assumed $300 million sale proceeds, will not
materialize before year end. Partially offsetting that disappointment is a $103 million
overpayment deposit from SERS, which was not expected in the initial outlook. Primarily due
to these two items, the updated forecast of all other state sources falls $204 million below
enacted budgeted assumptions.
• Transfers into the general funds are expected to total $1.992 billon. The estimate now includes
an anticipated $275 million in fund sweeps. Since that same value is included in the modified
enacted budget total, the differential between the forecast periods differ by only $6 million.
• Federal sources are anticipated to total $4.762 billion in FY 2018. The total includes the initial
base forecast of $3.556 billion as well as the $1.206 billion related to reimbursements stemming
from the $2.5 billion bill backlog payment. The estimate reflects no difference from the
modified enacted budget and is based on performance to date coupled with a very conservative
outlook over the remainder of the year. In fact, it would not be surprising to see federal sources
exceed expectations by several hundred million, but uncertainty over reimbursable spending
prevents that revision at this time.
• It is assumed that interfund borrowing will reach $600 million by fiscal year’s end, while the
$2.5 billion in bond proceeds directed towards the repayment of Medicaid bills already has
occurred. These same amounts are incorporated into the modified enacted budget plan.
FY 2018 CGFA UPDATE (continued)

-26-
FY 2018 New Revenue FY 2018
Modified Base per Legislative Enacted
Revenue Sources July-17 Changes With Changes
State Taxes
Personal Income Tax $15,688 $4,915 $20,603
Corporate Income Tax (regular) $1,900 $678 $2,578
Sales Taxes $8,380 $90 $8,470
Public Utility (regular) $917 $0 $917
Cigarette Tax $353 $0 $353
Liquor Gallonage Taxes $172 $0 $172
Vehicle Use Tax $29 $0 $29
Inheritance Tax $275 $0 $275
Insurance Taxes & Fees $395 $0 $395
Corporate Franchise Tax & Fees $203 $0 $203
Interest on State Funds & Investments $24 $0 $24
Cook County Intergovernmental Transfer $244 $0 $244
Other Sources $568 $400 $968
Subtotal $29,148 $6,083 $35,231
Transfers
Lottery $719 $0 $719
Riverboat transfers and receipts $274 $0 $274
Proceeds from sale of 10th license $10 $0 $10
Other $720 $0 $720
Total State Sources $30,871 $6,083 $36,954
Federal Sources [Base] $3,556 $0 $3,556
Subtotal Federal & State Sources $34,427 $6,083 $40,510
Nongeneral Funds Distribution:
Refund Fund
Personal Income Tax ($1,569) ($495) ($2,064)
Corporate Income Tax ($333) ($109) ($442)
Local Government Distributive Fund
Personal Income Tax ($1,017) $0 ($1,017)
Corporate Income Tax ($129) $0 ($129)
Sales Tax Distribution to the PTF and DPTF ($449) $0 ($449)
Subtotal General Funds $30,931 $5,479 $36,410
Fund Sweeps/Reallocations $275
Interfund Borrowing $600
Federal Sources Due to Medicaid Backlog Payments $1,206
Income Tax Bond Fund Transfer [Backlog] $2,500
Total Revenues General Funds $40,991
Additional Resources to General Funds Since Enactment
FY 2018 GENERAL FUNDS BUDGET PLAN--July 2017
Revenue Assumptions(millions)
FY 2018 Modified
CGFA Enacted $
Revenue Sources Feb-18 Budget Plan Difference
State Taxes
Personal Income Tax $20,566 $20,603 ($37)
Corporate Income Tax (regular) $2,558 $2,578 ($20)
Sales Taxes $8,304 $8,470 ($166)
Public Utility (regular) $903 $917 ($14)
Cigarette Tax $353 $353 $0
Liquor Gallonage Taxes $172 $172 $0
Vehicle Use Tax $28 $29 ($1)
Inheritance Tax $295 $275 $20
Insurance Taxes & Fees $400 $395 $5
Corporate Franchise Tax & Fees $203 $203 $0
Interest on State Funds & Investments $70 $24 $46
Cook County Intergovernmental Transfer $244 $244 $0
Other Sources $708 $968 ($260)
Subtotal $34,804 $35,231 ($427)
Transfers
Lottery $719 $719 $0
Riverboat transfers and receipts $268 $274 ($6)
Proceeds from sale of 10th license $10 $10 $0
Fund Sweeps/Reallocations $275 $275 $0
Other $720 $720 $0
Total State Sources $36,796 $37,229 ($433)
Federal Sources $4,762 $4,762 $0
Subtotal Federal & State Sources $41,558 $41,991 ($433)
Nongeneral Funds Distribution:
Refund Fund
Personal Income Tax [9.8%] ($2,015) ($2,064) $49
Corporate Income Tax [17.5%] ($448) ($442) ($6)
Local Government Distributive Fund
Personal Income Tax ($1,012) ($1,017) $5
Corporate Income Tax ($130) ($129) ($1)
Sales Tax Distribution to the PTF and DPTF ($449) ($449) $0
Subtotal General Funds $37,504 $37,891 ($387)
Interfund Borrowing $600 $600 $0
Income Tax Bond Fund Transfer [Backlog] $2,500 $2,500 $0
Total Revenues General Funds $40,604 $40,991 ($387)
FY 2018 GENERAL FUNDS REVENUE UPDATE
CGFA ESTIMATE vs. Modified Enacted Budget Plan(millions)

-27-
The accompanying table below compares the updated FY 2018 Commission’s
estimate to the GOMB’s updated outlook presented in the FY 2019 Budget
Book. As shown, the Commission’s overall estimate is $115 million higher
than the GOMB forecast. While there are modest variances between several
revenue sources, the differential is almost entirely due to higher federal
source expectations over the remainder of the fiscal year. A more detailed
comparison and brief discussion of the differences follows on the next page.
($ millions) CGFA GOMB DifferenceRevenue Source Mar-15 Feb-15 GOMB Feb-15
Income Taxes [Net] $19,519 $19,493 $26
Sales Tax [Net] $7,855 $7,951 ($96)
All Other State Sources $3,376 $3,318 $58
Transfers In $1,992 $2,003 ($11)
Federal Sources $4,762 $4,624 $138
Total $37,504 $37,389 $115
Interfund Borrowing $600 $600 $0
Bond Fund Transfer Proceeds [Backlog] $2,500 $2,500 $0
Total General Funds $40,604 $40,489 $115
FY 2018 GENERAL FUNDS REVENUE COMPARISON
CGFA vs. GOMB Feb-2018
FY 2018 COMPARISON – CGFA and GOMB

-28-
• Overall net income taxes differ by only $26 million, with the
Commission’s projection just slightly higher than GOMB. While
CGFA’s forecast of personal income tax is somewhat less than
GOMB [$70 million net], year to date performance and a moderately
better outlook for corporate income taxes [$96 million], comprise the
differential.
• The GOMB assumes a significant near term turnaround in sales tax
performance. While the Commission also anticipates improvement,
the outlook is more conservative given year to date performance and
a view that underlying receipt growth will be less abrupt. As a
result, the Commission’s estimate of sales tax is $95 million less
than the GOMB.
• The estimates of all other state sources differ by $58 million, with
the Commission’s outlook being the higher of the two estimates.
Most of the miscellaneous revenue lines are quite similar, with the
exceptions being inheritance tax receipts as well as interest income.
While very volatile, CGFA’s outlook for inheritance taxes takes into
account the stellar performance thru January, as well as preliminary
February results which indicate growth. In terms of anticipated
interest earnings, due to advancing rates of returns over what can be
described as historically low interest rates, it’s not surprising to see
considerably better performance. The Commission’s estimates takes
that into account, while the GOMB forecast seems unusually low
given positive returns year to date.
• The Commission estimate of federal sources is $138 million higher
than the GOMB’s outlook. Federal source receipts reflect
reimbursable spending and as explained earlier, $2.5 billion in bond
proceeds were utilized to pay down the accumulated backlog of
Medicaid bills. In doing so, utilizing the initial reimbursement of
that bill pay down to leverage even more spending and
reimbursement, has resulted in federal source growth of over $2.5
billion thru January. Even assuming very conservative performance
on par with recent February-June periods, the Commission’s outlook
will be reached, and likely exceeded.
FY 2018 COMPARISON – CGFA and GOMB (continued)
FY 2018 FY 2018
CGFA GOMB $
Revenue Sources Feb-18 Budget Book Difference
State Taxes
Personal Income Tax $20,566 $20,649 ($83)
Corporate Income Tax (regular) $2,558 $2,434 $124
Sales Taxes $8,304 $8,399 ($95)
Public Utility (regular) $903 $890 $13
Cigarette Tax $353 $351 $2
Liquor Gallonage Taxes $172 $172 $0
Vehicle Use Tax $28 $30 ($2)
Inheritance Tax $295 $275 $20
Insurance Taxes & Fees $400 $395 $5
Corporate Franchise Tax & Fees $203 $205 ($2)
Interest on State Funds & Investments $70 $46 $24
Cook County Intergovernmental Transfer $244 $244 $0
Other Sources $708 $710 ($2)
Subtotal $34,804 $34,800 $4
Transfers
Lottery $719 $719 $0
Riverboat transfers and receipts $268 $270 ($2)
Proceeds from sale of 10th license $10 $10 $0
Fund Sweeps/Reallocations $275 $275 $0
Other $720 $729 ($9)
Total State Sources $36,796 $36,803 ($7)
Federal Sources [Base] $4,762 $4,624 $138
Subtotal Federal & State Sources $41,558 $41,427 $131
Nongeneral Funds Distribution:
Refund Fund
Personal Income Tax [9.8% '18; 9.7% '19] ($2,015) ($2,024) $9
Corporate Income Tax [17.5% 18; 15.5% '19] ($448) ($426) ($22)
Local Government Distributive Fund
Personal Income Tax ($1,012) ($1,016) $4
Corporate Income Tax ($130) ($124) ($6)
Sales Tax Distribution to the PTF and DPTF ($449) ($448) ($1)
Subtotal General Funds $37,504 $37,389 $115
Interfund Borrowing $600 $600 $0
Income Tax Bond Fund Transfer [Backlog] $2,500 $2,500 $0
Total Revenues General Funds $40,604 $40,489 $115
FY 2018 GENERAL FUNDS REVENUE COMPARISON
CGFA vs.GOMB(millions)
-29-
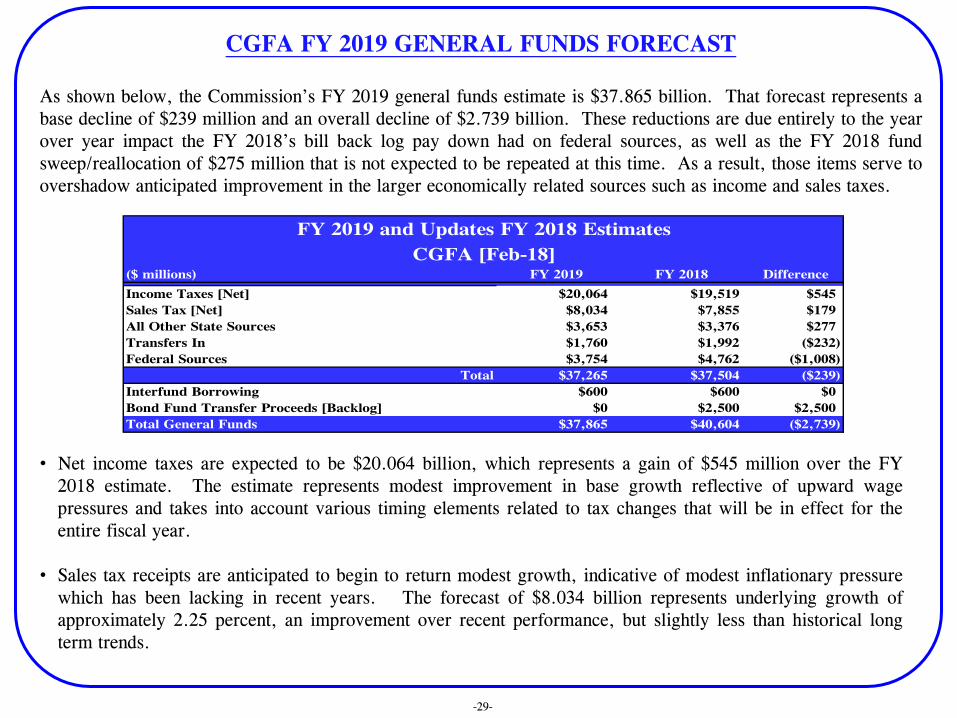
As shown below, the Commission’s FY 2019 general funds estimate is $37.865 billion. That forecast represents a
base decline of $239 million and an overall decline of $2.739 billion. These reductions are due entirely to the year
over year impact the FY 2018’s bill back log pay down had on federal sources, as well as the FY 2018 fund
sweep/reallocation of $275 million that is not expected to be repeated at this time. As a result, those items serve to
overshadow anticipated improvement in the larger economically related sources such as income and sales taxes.
• Net income taxes are expected to be $20.064 billion, which represents a gain of $545 million over the FY
2018 estimate. The estimate represents modest improvement in base growth reflective of upward wage
pressures and takes into account various timing elements related to tax changes that will be in effect for the
entire fiscal year.
• Sales tax receipts are anticipated to begin to return modest growth, indicative of modest inflationary pressure
which has been lacking in recent years. The forecast of $8.034 billion represents underlying growth of
approximately 2.25 percent, an improvement over recent performance, but slightly less than historical long
term trends.
($ millions) FY 2019 FY 2018 DifferenceRevenue Source Mar-15 Feb-15 GOMB Feb-15
Income Taxes [Net] $20,064 $19,519 $545
Sales Tax [Net] $8,034 $7,855 $179
All Other State Sources $3,653 $3,376 $277
Transfers In $1,760 $1,992 ($232)
Federal Sources $3,754 $4,762 ($1,008)
Total $37,265 $37,504 ($239)
Interfund Borrowing $600 $600 $0
Bond Fund Transfer Proceeds [Backlog] $0 $2,500 $2,500
Total General Funds $37,865 $40,604 ($2,739)
FY 2019 and Updates FY 2018 Estimates
CGFA [Feb-18]
CGFA FY 2019 GENERAL FUNDS FORECAST

-30-
• All other state sources are estimated to be $3.653 billion, which reflects overall growth of
$277 million. However, all of that growth is due to the shift in timing expectations related to
the sale of the Thompson Center. With the movement of $300 million in assumed sale
proceeds into FY 2019, that year over year gain serves to mitigate an otherwise modest
decline in the other revenue lines.
• Overall transfers are expected to drop $232 million as at this point no additional fund
sweeps/reallocations are planned for FY 2019. In FY 2018, the outlook is for $275 million
of such activity to take place.
• Federal sources are forecast to be $3.754 billion, which represents a falloff of $1.008 billion.
Obviously, that decline is related to FY 2018 Medicaid backlog pay down. If the $1.206
billion in reimbursement is excluded from the FY 2018 base, the FY 2019 estimate actually
would project into a year over year gain of $198 million.
• While the FY 2019 estimate assumes a similar $600 million in interfund borrowing as that
expected in FY 2018, legislation will have to modify current statute which allowed for up to
$1.2 billion in interfund borrowing only in FY 2018. The assumption is that the $1.2 billion
will be allowed to occur over a two-year rather than one-year period.
• Finally, the primary reason the overall FY 2019 revenue estimate falls significantly from FY
2018 is the year over year impact of the $2.5 billion bond proceeds transfer that took place in
FY 2018.
CGFA FY 2019 GENERAL FUNDS FORECAST (continued)

-31-
Other items of note include:
• Public utility taxes are expected to decline $25 million
based on anticipated normalized weather patterns, as well
as the long term trend of falling telecommunications taxes.
• Interest income from investments is forecast to jump $30
million and continue to see large growth rates as the
outlook for higher rates of interest on short-term
investments continue to rise on Fed actions.
• At this time, the Commission is utilizing income tax
refund percentages for FY 2019 as presented in the
Governor’s proposed budget—personal income tax at
9.7%, and corporate income tax at 15.5%.
• The forecast also assumes that the state will continue to
retain 10% of the LGDF distributive to local governments
from net income taxes. The retention of these LGDF
monies was put into statute for FY 2018 only. To continue
this practice would require legislative action. If it is not
allowed in FY 2019, the estimate of net income taxes to
the general funds would have to be reduced by
approximately $130 million.
• While previously mentioned, but to reiterate, current
statute allows for $1.2 billion in interfund borrowing.
Through late February, $457 million has taken place in FY
2018 and only $600 million is anticipated. The forecast
assumes that the remaining $600 million will be allowed to
take place in FY 2019. However, legislative action would
be required to extend the time period of that borrowing
into next fiscal year. If not, those monies would have to
be removed from the forecast.
• For now, the Commission will accept the GOMB’s
expected level of federal sources for FY 2019, at $3.754
billion. Obviously, a number of items could impact that
outlook i.e. appropriations levels, actual bill transmittals
from DHFS, cash available for reimbursable spending, and
bill payment priorities at the Comptroller’s Office.
CGFA FY 2019 GENERAL FUNDS FORECAST (continued)
FY 2019 FY 2018
CGFA CGFA $
Revenue Sources Feb-18 Feb-18 Difference
State Taxes
Personal Income Tax $21,071 $20,566 $505
Corporate Income Tax (regular) $2,618 $2,558 $60
Sales Taxes $8,491 $8,304 $187
Public Utility (regular) $878 $903 ($25)
Cigarette Tax $353 $353 $0
Liquor Gallonage Taxes $174 $172 $2
Vehicle Use Tax $29 $28 $1
Inheritance Tax $290 $295 ($5)
Insurance Taxes & Fees $405 $400 $5
Corporate Franchise Tax & Fees $205 $203 $2
Interest on State Funds & Investments $100 $70 $30
Cook County Intergovernmental Transfer $244 $244 $0
Other Sources $975 $708 $267
Subtotal $35,833 $34,804 $1,029
Transfers
Lottery $733 $719 $14
Riverboat transfers and receipts $266 $268 ($2)
Proceeds from sale of 10th license $10 $10 $0
Fund Sweeps/Reallocations $0 $275 ($275)
Other $751 $720 $31
Total State Sources $37,593 $36,796 $797
Federal Sources [Base] $3,754 $4,762 ($1,008)
Subtotal Federal & State Sources $41,347 $41,558 ($211)
Nongeneral Funds Distribution:
Refund Fund
Personal Income Tax [9.8% '18; 9.7% '19] ($2,044) ($2,015) ($29)
Corporate Income Tax [17.5% 18; 15.5% '19] ($406) ($448) $42
Local Government Distributive Fund
Personal Income Tax ($1,038) ($1,012) ($26)
Corporate Income Tax ($137) ($130) ($7)
Sales Tax Distribution to the PTF and DPTF ($457) ($449) ($8)
Subtotal General Funds $37,265 $37,504 ($239)
Interfund Borrowing $600 $600 $0
Income Tax Bond Fund Transfer [Backlog] $0 $2,500 ($2,500)
Total Revenues General Funds $37,865 $40,604 ($2,739)
FY 2019 and UPDATED FY 2018 ESTIMATES
CGFA(millions)

-32-
The following table compares the FY 2019 revenue outlooks of the Commission and the GOMB. As shown, the overall
difference is $99 million, with the Commission being the lower of the two forecasts. While there is some variance by
revenue source [see following page for more detail], overall the estimates are very similar, only separated by
approximately three-tenths of a percent.
•The Commission’s estimate of net income taxes is $87 million below that of the GOMB and reflects a slightly lower
outlook for personal income taxes, which is partially offset by a higher estimate of corporate income taxes.
•The Commission’s forecast for sales tax receipts is $76 million below that of the GOMB. This differential is due to the
base FY 2018 forecast, as CGFA’s growth rate assumed for FY 2019 is slightly higher than the GOMB.
•The Commission’s estimate of all other state sources is higher than the GOMB by $76 million. As shown in more detail
on the following page, this net difference is attributed to somewhat higher estimates of public utility, inheritance, and
interest earnings.
•Transfers into the general funds differ by only $12 million and are very similar with no appreciable differences in the
major transfer categories.
•As mentioned earlier, the Commission will utilize the same FY 2019 projection of federal sources as that of the GOMB.
Final budgetary decisions could significantly alter that outlook.
FY 2019 OUTLOOK COMPARISON – CGFA and GOMB
($ millions) CGFA GOMB DifferenceRevenue Source Mar-15 Feb-15 GOMB Feb-15
Income Taxes [Net] $20,064 $20,151 ($87)
Sales Tax [Net] $8,034 $8,110 ($76)
All Other State Sources $3,653 $3,577 $76
Transfers In $1,760 $1,772 ($12)
Federal Sources $3,754 $3,754 $0
Total $37,265 $37,364 ($99)
Interfund Borrowing $600 $600 $0
Bond Fund Transfer Proceeds [Backlog] $0 $0 $0
Total General Funds $37,865 $37,964 ($99)
FY 2019 General Funds Estimates
CGFA vs. GOMB [Feb-18]
-33-
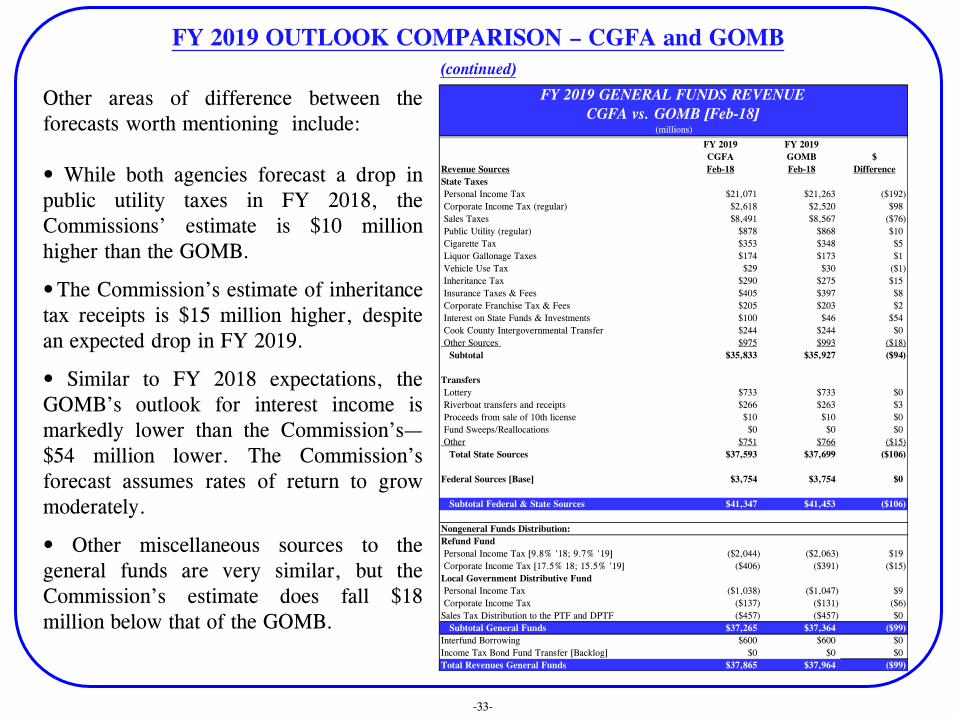
Other areas of difference between the
forecasts worth mentioning include:
• While both agencies forecast a drop in
public utility taxes in FY 2018, the
Commissions’ estimate is $10 million
higher than the GOMB.
• The Commission’s estimate of inheritance
tax receipts is $15 million higher, despite
an expected drop in FY 2019.
• Similar to FY 2018 expectations, the
GOMB’s outlook for interest income is
markedly lower than the Commission’s—
$54 million lower. The Commission’s
forecast assumes rates of return to grow
moderately.
• Other miscellaneous sources to the
general funds are very similar, but the
Commission’s estimate does fall $18
million below that of the GOMB.
FY 2019 OUTLOOK COMPARISON – CGFA and GOMB
(continued)
FY 2019 FY 2019
CGFA GOMB $
Revenue Sources Feb-18 Feb-18 Difference
State Taxes
Personal Income Tax $21,071 $21,263 ($192)
Corporate Income Tax (regular) $2,618 $2,520 $98
Sales Taxes $8,491 $8,567 ($76)
Public Utility (regular) $878 $868 $10
Cigarette Tax $353 $348 $5
Liquor Gallonage Taxes $174 $173 $1
Vehicle Use Tax $29 $30 ($1)
Inheritance Tax $290 $275 $15
Insurance Taxes & Fees $405 $397 $8
Corporate Franchise Tax & Fees $205 $203 $2
Interest on State Funds & Investments $100 $46 $54
Cook County Intergovernmental Transfer $244 $244 $0
Other Sources $975 $993 ($18)
Subtotal $35,833 $35,927 ($94)
Transfers
Lottery $733 $733 $0
Riverboat transfers and receipts $266 $263 $3
Proceeds from sale of 10th license $10 $10 $0
Fund Sweeps/Reallocations $0 $0 $0
Other $751 $766 ($15)
Total State Sources $37,593 $37,699 ($106)
Federal Sources [Base] $3,754 $3,754 $0
Subtotal Federal & State Sources $41,347 $41,453 ($106)
Nongeneral Funds Distribution:
Refund Fund
Personal Income Tax [9.8% '18; 9.7% '19] ($2,044) ($2,063) $19
Corporate Income Tax [17.5% 18; 15.5% '19] ($406) ($391) ($15)
Local Government Distributive Fund
Personal Income Tax ($1,038) ($1,047) $9
Corporate Income Tax ($137) ($131) ($6)
Sales Tax Distribution to the PTF and DPTF ($457) ($457) $0
Subtotal General Funds $37,265 $37,364 ($99)
Interfund Borrowing $600 $600 $0
Income Tax Bond Fund Transfer [Backlog] $0 $0 $0
Total Revenues General Funds $37,865 $37,964 ($99)
FY 2019 GENERAL FUNDS REVENUE
CGFA vs. GOMB [Feb-18](millions)
-34-
Actual Actual Actual Actual Actual Actual Actual Actual Actual CGFA CGFA
Receipts Receipts Receipts Receipts Receipts Receipts Receipts Receipts Receipts Feb-18 Feb-18
Revenue Sources FY 2009 FY 2010 FY 2011 FY 2012 FY 2013 FY 2014 FY 2015 FY 2016 FY 2017 FY 2018 FY 2019
State Taxes
Personal Income Tax $10,219 $9,430 $12,301 $17,000 $18,323 $18,388 $17,682 $15,299 $15,385 $20,566 $21,071
Corporate Income Tax (regular) 2,073 1,649 2,277 2,983 3,679 3,640 3,129 2,334 1,610 2,558 2,618
Sales Taxes 6,773 6,308 6,833 7,226 7,355 7,676 8,030 8,063 8,043 8,304 8,491
Public Utility Taxes (regular) 1,168 1,089 1,147 995 1,033 1,013 1,006 926 884 903 878
Cigarette Tax 350 355 355 354 353 353 353 353 353 353 353
Liquor Gallonage Taxes 158 159 157 164 165 165 167 170 171 172 174
Vehicle Use Tax 27 30 30 29 27 29 32 30 30 28 29
Inheritance Tax (Gross) 288 243 122 235 293 276 333 306 261 295 290
Insurance Taxes and Fees 334 322 317 345 334 333 353 398 391 400 405
Corporate Franchise Tax & Fees 201 208 207 192 205 203 211 207 207 203 205
Interest on State Funds & Investments 81 26 28 21 20 20 24 24 36 70 100
Cook County Intergovernmental Transfer 253 244 244 244 244 244 244 244 244 244 244
Other Sources 418 431 404 399 462 585 693 534 685 708 975
Subtotal $22,343 $20,494 $24,422 $30,187 $32,493 $32,925 $32,257 $28,888 $28,300 $34,804 $35,833
Transfers
Lottery 625 625 632 640 656 668 679 677 720 719 733
Gaming Fund Transfer [and related] 430 431 324 413 360 331 302 287 280 278 276
Other 538 828 1,226 885 688 1,113 2,012 627 552 995 751
Total State Sources $23,936 $22,378 $26,604 $32,125 $34,197 $35,037 $35,250 $30,479 $29,852 $36,796 $37,593
Federal Sources $6,567 $5,920 $5,386 $3,682 $4,154 $3,903 $3,330 $2,665 $2,483 $4,762 $3,754
Total Federal & State Sources $30,503 $28,298 $31,990 $35,807 $38,351 $38,940 $38,580 $33,144 $32,335 $41,558 $41,347
Nongeneral Funds Distribution:
Refund Fund
Personal Income Tax ($996) ($919) ($1,076) ($1,488) ($1,785) ($1,746) ($1,769) ($1,493) ($1,724) ($2,015) ($2,044)
Corporate Income Tax (363) (289) (426) (522) (502) (476) (439) (362) (278) (448) (406)
Fund for Advancement of Education 0 0 0 0 0 0 (242) (458) (464) 0 0
Commitment to Human Services Fund 0 0 0 0 0 0 (242) (458) (464) 0 0
LGDF--Direct from PIT 0 0 0 0 0 0 0 0 0 (1,012) (1,038)
LGDF--Direct from CIT 0 0 0 0 0 0 0 0 0 (130) (137)
Downstate Pub/Trans--Direct from Sales 0 0 0 0 0 0 0 0 0 (449) (457)
Subtotal General Funds $29,144 $27,090 $30,488 $33,797 $36,064 $36,718 $35,888 $30,373 $29,405 $37,504 $37,265
Change from Prior Year ($515) ($2,054) $1,344 $3,309 $2,267 $654 ($830) ($5,515) ($968) $8,099 $6,892
Percent Change -1.7% -7.0% 4.6% 10.9% 6.7% 1.8% -2.3% -15.4% -3.2% 27.5% 22.7%
Short-Term Borrowing $2,400 $1,250 $1,300 $0 $0 $0 $454 $0 $0 $600 $600
Income Tax Bond Fund backlog transfer $0 $0 $0 $0 $0 $0 $0 $0 $0 $2,500 $0
FY'13/14 Backlog Payment Fund Transfer $0 $0 $0 $0 $264 $50 $0 $0 $0 $0 $0
Tobacco Liquidation Proceeds $0 $0 $1,250 $0 $0 $0 $0 $0 $0 $0 $0
HPF and HHSMTF Transfers $0 $0 $0 $0 $0 $0 $0 $0 $0 $0 $0
Budget Stabilization Fund Transfer $576 $1,146 $535 $275 $275 $275 $275 $125 $0 $0 $0
Pension Contribution Fund Transfer $0 $843 $224 $0 $0 $0 $0 $0 $0 $0 $0
Total General Funds $32,120 $30,329 $33,797 $34,072 $36,603 $37,043 $36,617 $30,498 $29,405 $40,604 $37,865
Change from Prior Year ($1,718) ($1,791) $1,677 $275 $2,531 $440 ($426) ($6,119) ($1,093) $11,199 ($2,739)
Percent Change -5.1% -5.6% 5.2% 0.8% 7.4% 1.2% -1.2% -16.7% -3.6% 38.1% 24.2%
SOURCE: CGFA
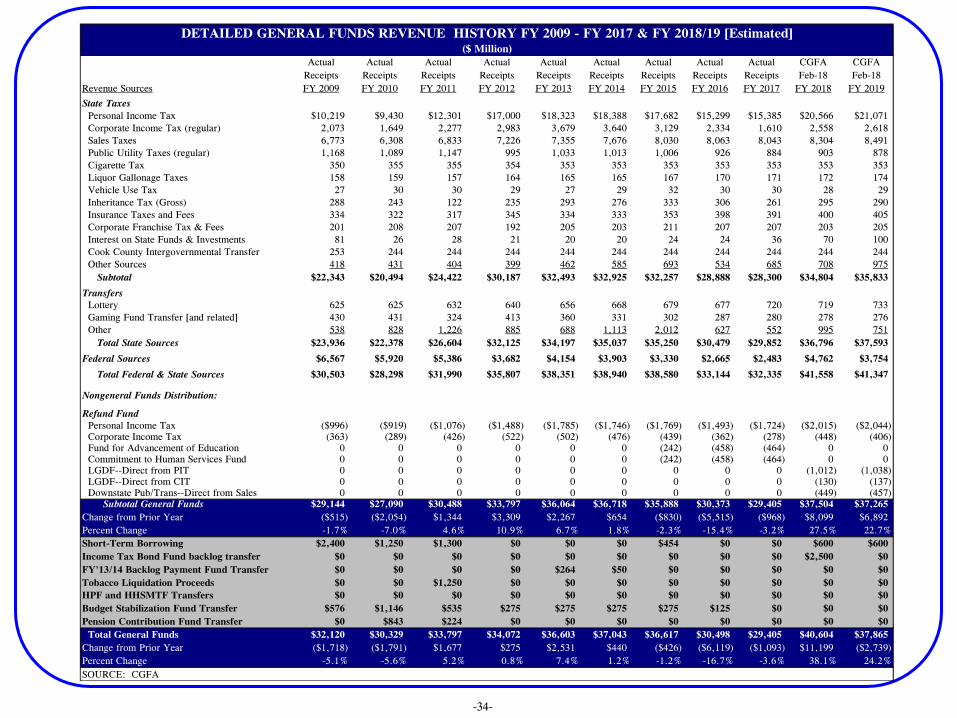
DETAILED GENERAL FUNDS REVENUE HISTORY FY 2009 - FY 2017 & FY 2018/19 [Estimated]($ Million)

-35-
ACTUAL ACTUAL ACTUAL ACTUAL ACTUAL ACTUAL ACTUAL ACTUAL ACTUAL Feb-18 Feb-18
RECEIPTS RECEIPTS RECEIPTS RECEIPTS RECEIPTS RECEIPTS RECEIPTS RECEIPTS RECEIPTS Estimate Estimate
REVENUE SOURCES FY 2009 FY 2010 FY 2011 FY 2012 FY 2013 FY 2014 FY 2015 FY 2016 FY 2017 FY 2018 FY 2019
State Sources
CASH RECEIPTS:
Personal Income Tax (gross) $10,219 $9,430 $12,302 $17,000 $18,324 $18,388 $17,682 $15,301 $15,385 $20,566 $21,071
Corporate Income Tax (gross) $2,073 $1,649 $2,285 $2,983 $3,679 $3,640 $3,132 $2,339 $1,614 $2,558 $2,618
Sales Taxes $8,216 $7,752 $8,400 $8,851 $9,054 $9,451 $9,908 $9,073 $9,053 $9,145 $9,351
Short-Term Borrowing $2,400 $1,500 $1,300 $0 $0 $0 $0 $0 $0 $0 $0
Fund Transfers $1,725 $1,576 $1,396 $2,366 $2,689 $2,322 $2,882 $460 $849 $3,307 $2,204State Employees Retirement System $1,316 $1,258 $1,566 $1,764 $1,875 $2,136 n/a n/a n/a n/a n/aCorporate Personal Property Replacement Taxes $1,487 $1,192 $1,537 $1,460 $1,690 $1,657 $1,786 $1,628 $1,922 $1,846 $1,871Health Care Provider Assessment Fees & Taxes $1,724 $1,575 $1,635 $1,677 $1,656 $2,413 $1,961 $1,952 $2,138 $2,247 $2,226
Public Utility Taxes $1,741 $1,666 $1,691 $1,584 $1,564 $1,498 $1,510 $1,417 $1,423 $1,440 $1,410
Motor Vehicle & Operators Licenses $1,302 $1,370 $1,494 $1,498 $1,462 $1,511 $1,539 $1,552 $1,585 $1,555 $1,555
Lottery Tickets & Licenses $991 $1,074 $1,104 $1,502 $1,388 $1,341 $1,589 $1,308 $1,341 $1,444 $1,472
Motor Fuel Tax (gross) $1,499 $1,371 $1,347 $1,324 $1,292 $1,326 $1,326 $1,354 $1,348 $1,358 $1,358
Cigarette Taxes $582 $582 $588 $606 $856 $860 $862 $845 $782 $780 $770
Riverboat Gambling Taxes & Fees $553 $532 $458 $611 $579 $533 $520 $494 $489 $488 $486
Revolving Funds $505 $526 $565 $617 $544 $595 $606 $242 $678 $545 $881
Insurance Tax & Fees $422 $411 $414 $447 $442 $443 $466 $515 $519 $528 $533
Inheritance Tax (gross) $288 $243 $122 $235 $309 $294 $355 $325 $278 $314 $309
Liquor Gallonage Taxes $164 $188 $182 $279 $280 $280 $283 $288 $294 $295 $297
Optional Health Insurance Deductions $229 $263 $268 $266 $269 $404 $376 $352 $340 $337 $334
County Intergovernmental Transfers $305 $261 $244 $244 $244 $244 $244 $244 $244 $244 $244
Hotel Tax $203 $173 $192 $208 $221 $227 $257 $264 $227 $278 $283
Corporate Franchise Tax & Fees $210 $216 $215 $200 $213 $211 $219 $216 $215 $214 $216
Tobacco Settlement $340 $284 $290 $133 $133 $163 $120 $84 $105 $110 $108
Investment Income $156 $46 $49 $43 $37 $52 $52 $52 $83 $160 $228
Video Gaming Tax $0 $0 $0 $0 $29 $137 $235 $302 $356 $406 $441
Other Taxes, Licenses, Fees & Earnings $2,855 $3,207 $3,545 $3,586 $4,153 $3,995 $4,186 $4,403 $4,729 $4,672 $4,800
Total, State Source Cash Receipts $41,505 $38,345 $43,189 $49,484 $52,982 $54,121 $52,096 $45,010 $45,997 $54,837 $55,066
Transfers in from Other State Funds: $314 $223 $454 $361 $316 $315 $493 $249 $219 $247 $247
TOTAL, STATE SOURCES $41,819 $38,568 $43,643 $49,845 $53,298 $54,436 $52,589 $45,259 $46,216 $55,084 $55,313
Federal Sources $16,383 $18,284 $18,149 $14,669 $16,252 $17,095 $18,722 $19,033 $18,523 $20,958 $19,783
Sale of Bonds $151 $8,551 $6,125 $4,099 $1,872 $4,244 $42 $1,084 $2,977 $7,500 $1,250
TOTAL, REVENUES - APPROPRIATED FUNDS $58,353 $65,403 $67,917 $68,613 $71,422 $75,775 $71,353 $65,376 $67,716 $83,542 $76,346
Short Term Borrowing $2,400 $1,500 $1,300 $0 $0 $0 $0 $0 $0 $0 $0
TOTAL BASE REVENUE - ALL APPROPRIATED $55,953 $63,903 $66,617 $68,613 $71,422 $75,775 $71,353 $65,376 $67,716 $83,542 $76,346
ALL APPROPRIATED FUNDS REVENUE FY 2009 to FY 2017 & ESTIMATED FY 2018-19
($ millions)

-36-
DEVELOPMENT OF CGFA ESTIMATES
Econometric Firms—The Commission utilizes the services of IHS Markit, Moody’s Analytics, and
Consenus Economics Inc. They provide a wealth of economic measures and forecasts, both on a national
and state specific basis, which are utilized to varying degrees during the estimating process.
Data Sources—The Commission utilizes actual receipt data via the Comptroller’s warehouse. Additional
tax collection data reports prepared by the DoR, as well as employment and earning reports produced by the
Bureau of Labor Statistics and IDES are also utilized, as are other pertinent data that may be necessary and
available.
Forecasting models—Depending on the revenue source being forecasted, model complexity can range from
the very simple to fairly complex. Several smaller sources with relatively low volatility need nothing more
than simple trend analysis to produce accurate forecasts, while the estimates of the larger more economically
driven revenue sources such as income and sales benefit from more sophisticated econometric models which
utilize regressions and various time series techniques.
Application of Adjustments—Often times a base forecast must be adjusted by factors such as tax changes
made at either the federal or state level that will disrupt historical receipt patterns, either by acceleration or
delay. As has been the case in recent years, impacts related to IDOR accounting procedures must also be
included. These are usually one-time phenomena, but must be accounted for by adjusting the estimate.
Examples include tax rates, credits, deductions, exemptions, amnesty, etc.
Review Process and Tests of Reasonableness— Before a forecast is presented, it must pass internal review.
In other words, the forecast must make sense. Any questionable forecast is reexamined for error. Accuracy
of the estimates is reviewed during each forecasting period and, if necessary, appropriate revisions to the
models are made in an effort to improve accuracy.