future soc: sans 2017 security operations center surveypages.endgame.com/rs/627-ybu-612/images/soc...
TRANSCRIPT

©2017 SANS™ Institute
A SANS SurveyWritten by Christopher Crowley
May 2017
Sponsored by Endgame
Future SOC: SANS 2017 Security Operations Center Survey
Security operations centers (SOCs) are growing up, according to our new SANS survey.
Respondents indicated that the SOC’s primary strengths are flexibility and adaptability
while its biggest weakness is lack of visibility: SOCs still can’t detect previously unknown
threats, which is a consistent problem across many other SANS surveys. The survey
also found a need for more automation across the prevention, detection and response
functions—particularly in prevention and detection, where the tools respondents use are
mostly the same.
As a sign that SOCs are becoming multifunctional and maturing, 67% of respondents
said they are satisfied with their flexibility of response, while 65% are satisfied with
their overall response time and 64% felt satisfied with containment abilities. However,
satisfaction numbers dip below 50% for SOC-NOC (network operations center)
coordination and effectiveness, as well as the ability to detect previously unknown
threats, which is also the capability that received the most “not satisfied” responses,
at 45%. These are clear areas where more automation and integration will help
organizations take their SOCs to the next level.
Most SOCs (83%) have a defined notion of what an incident is, and
57% of respondents said they utilize metrics for assessing the SOC’s
performance. Yet, 69% of those who use metrics require substantial
manual effort to compile those metrics. This is another area where better
automation and SOC-NOC information sharing would help organizations
take their SOCs to the next level. However, only 32% of SOCs have close
integration with network operations and only 12% have strong technical
integration between the groups.
This lack of integration may be due, in part, to the variety of architectures
respondents utilize. Overall, 61% currently have centralized their security,
response and remediation functions into a single SOC, and 28% disperse
their SOC functions to different security, response and remediation
departments. Respondents are also mixing up their capabilities with the
cloud, particular for their preventive capabilities.
While organizational SOCs are maturing and expanding their capabilities today, there are
clear opportunities to improve security operations, starting with better relationships and
coordination with IT operations. SOCs can better self-assess with metrics and do a better
job of understanding how to serve the organization more effectively. These and other
issues, along with advice and best practices, are discussed in the following pages.
SANS ANALYST PROGRAMFuture SOC: SANS 2017 Security Operations Center Survey1
Executive Summary
1 “Ten Strategies of a World-Class Cybersecurity Operations Center,” Carson Zimmerman, MITRE, 2014, www.mitre.org/sites/default/files/publications/pr-13-1028-mitre-10-strategies-cyber-ops-center.pdf
Security Operations Center
(SOC)
A team primarily composed
of security analysts organized
to detect, analyze, respond
to, report on and prevent
cybersecurity incidents.1
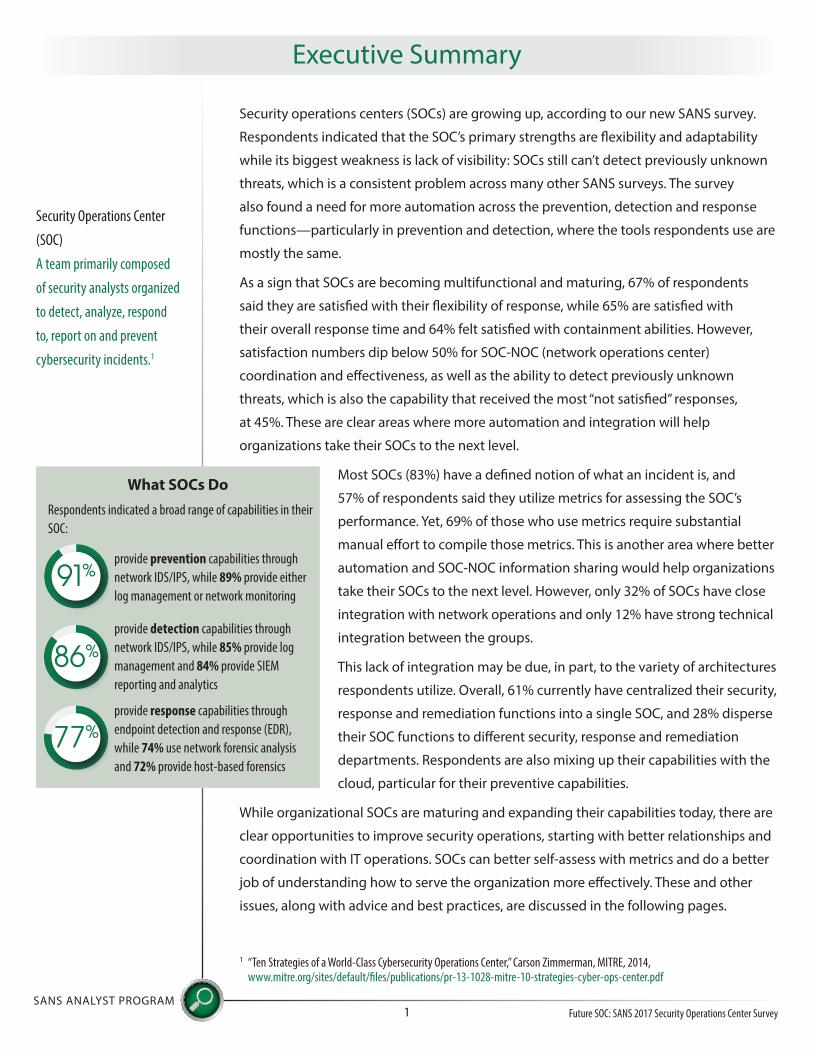
What SOCs DoRespondents indicated a broad range of capabilities in their SOC:
provide prevention capabilities through network IDS/IPS, while 89% provide either log management or network monitoring
provide detection capabilities through network IDS/IPS, while 85% provide log management and 84% provide SIEM reporting and analytics
provide response capabilities through endpoint detection and response (EDR), while 74% use network forensic analysis and 72% provide host-based forensics
91%
86%
77%
SOC Architectures
SANS ANALYST PROGRAM2
The 309 respondents who qualified for this survey most commonly described
themselves as technical practitioners (50%), with roles such as developer, architect,
analyst, administrator or operator of some form. Managers (manager, director, officer or
C-level) made up 40% of respondents, while another 8% worked in a spectrum of jobs
related to incident response and 2% were auditors.
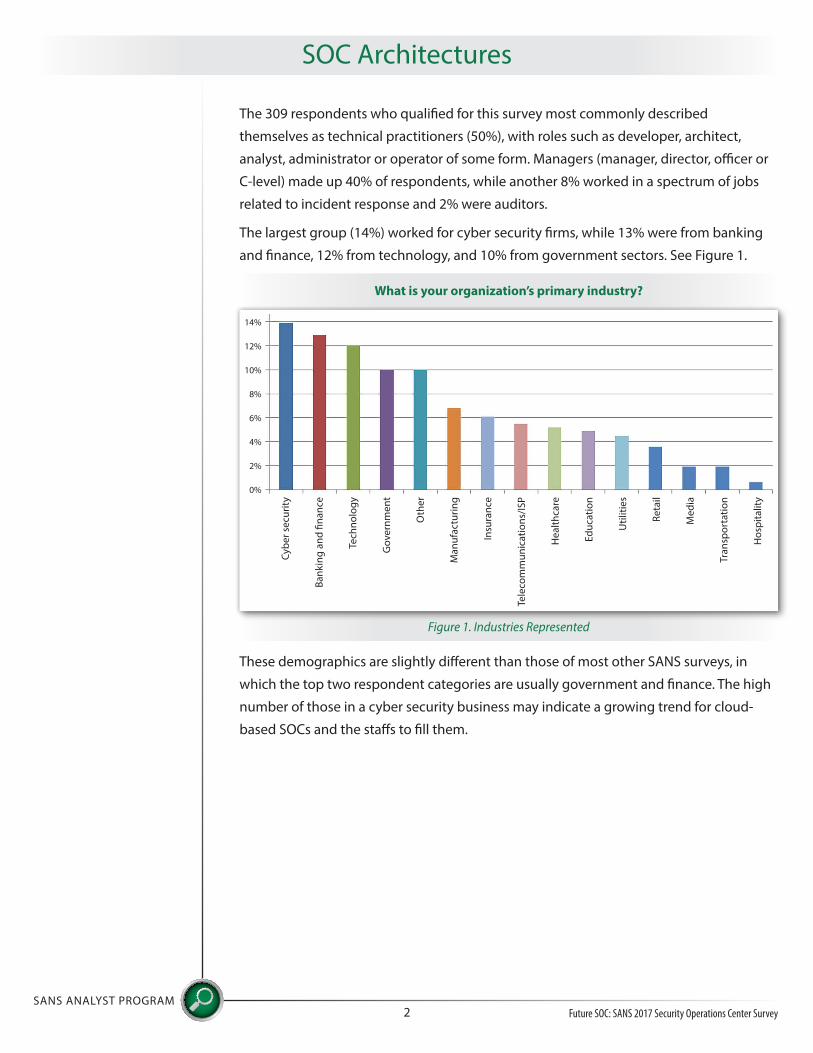
The largest group (14%) worked for cyber security firms, while 13% were from banking
and finance, 12% from technology, and 10% from government sectors. See Figure 1.
These demographics are slightly different than those of most other SANS surveys, in
which the top two respondent categories are usually government and finance. The high
number of those in a cyber security business may indicate a growing trend for cloud-
based SOCs and the staffs to fill them.
Future SOC: SANS 2017 Security Operations Center Survey
What is your organization’s primary industry?
Man
ufac
turin
g
Tech
nolo
gy
Cybe
r sec
urity
Insu
ranc
e
Util
ities
Gov
ernm
ent
Bank
ing
and
finan
ce
Tele
com
mun
icat
ions
/ISP
Reta
il
Hea
lthca
re
Med
ia
Educ
atio
n
Tran
spor
tatio
n
Hos
pita
lity
Oth
er
Figure 1. Industries Represented
14%
12%
10%
8%
6%
4%
2%
0%
SOC Architectures (CONTINUED)
SANS ANALYST PROGRAM3
Locations and Centralization
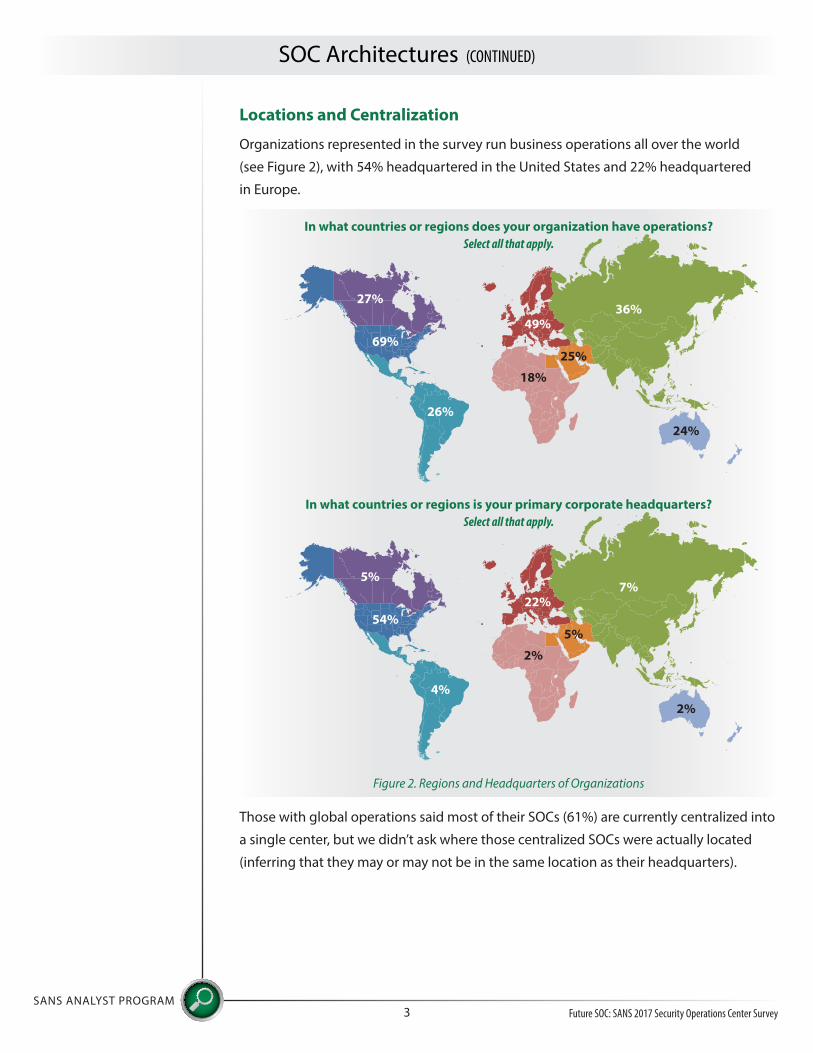
Organizations represented in the survey run business operations all over the world
(see Figure 2), with 54% headquartered in the United States and 22% headquartered
in Europe.
Those with global operations said most of their SOCs (61%) are currently centralized into
a single center, but we didn’t ask where those centralized SOCs were actually located
(inferring that they may or may not be in the same location as their headquarters).
Future SOC: SANS 2017 Security Operations Center Survey
In what countries or regions does your organization have operations? Select all that apply.
69%
26%
18%
24%
25%
27%
49%36%
In what countries or regions is your primary corporate headquarters? Select all that apply.
54%
4%
2%
2%
5%
5%
22%7%
Figure 2. Regions and Headquarters of Organizations
SOC Architectures (CONTINUED)
SANS ANALYST PROGRAM4
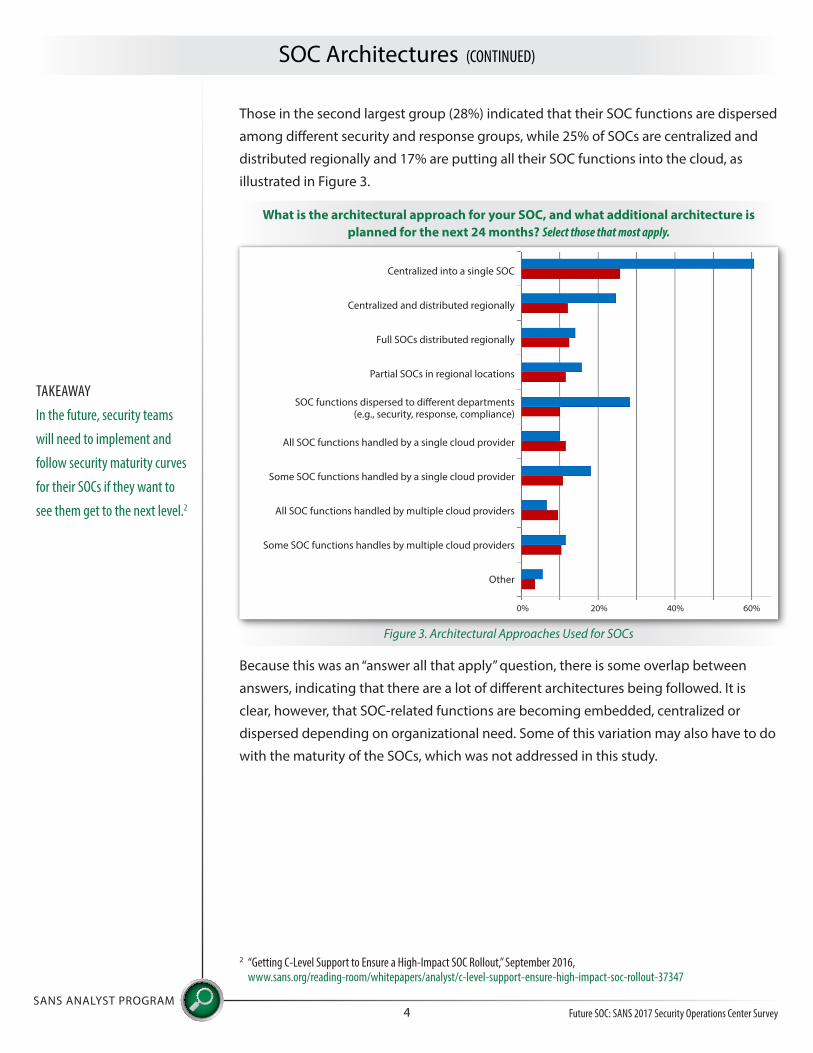
Those in the second largest group (28%) indicated that their SOC functions are dispersed
among different security and response groups, while 25% of SOCs are centralized and
distributed regionally and 17% are putting all their SOC functions into the cloud, as
illustrated in Figure 3.
Because this was an “answer all that apply” question, there is some overlap between
answers, indicating that there are a lot of different architectures being followed. It is
clear, however, that SOC-related functions are becoming embedded, centralized or
dispersed depending on organizational need. Some of this variation may also have to do
with the maturity of the SOCs, which was not addressed in this study.
Future SOC: SANS 2017 Security Operations Center Survey
What is the architectural approach for your SOC, and what additional architecture is planned for the next 24 months? Select those that most apply.
Centralized into a single SOC
Full SOCs distributed regionally
SOC functions dispersed to different departments (e.g., security, response, compliance)
Some SOC functions handled by a single cloud provider
Some SOC functions handles by multiple cloud providers
Other
Centralized and distributed regionally
Partial SOCs in regional locations
All SOC functions handled by a single cloud provider
All SOC functions handled by multiple cloud providers
Figure 3. Architectural Approaches Used for SOCs
0% 40%20% 60%
TAKEAWAY
In the future, security teams
will need to implement and
follow security maturity curves
for their SOCs if they want to
see them get to the next level.2
2 “Getting C-Level Support to Ensure a High-Impact SOC Rollout,” September 2016, www.sans.org/reading-room/whitepapers/analyst/c-level-support-ensure-high-impact-soc-rollout-37347
SOC Architectures (CONTINUED)
SANS ANALYST PROGRAM5
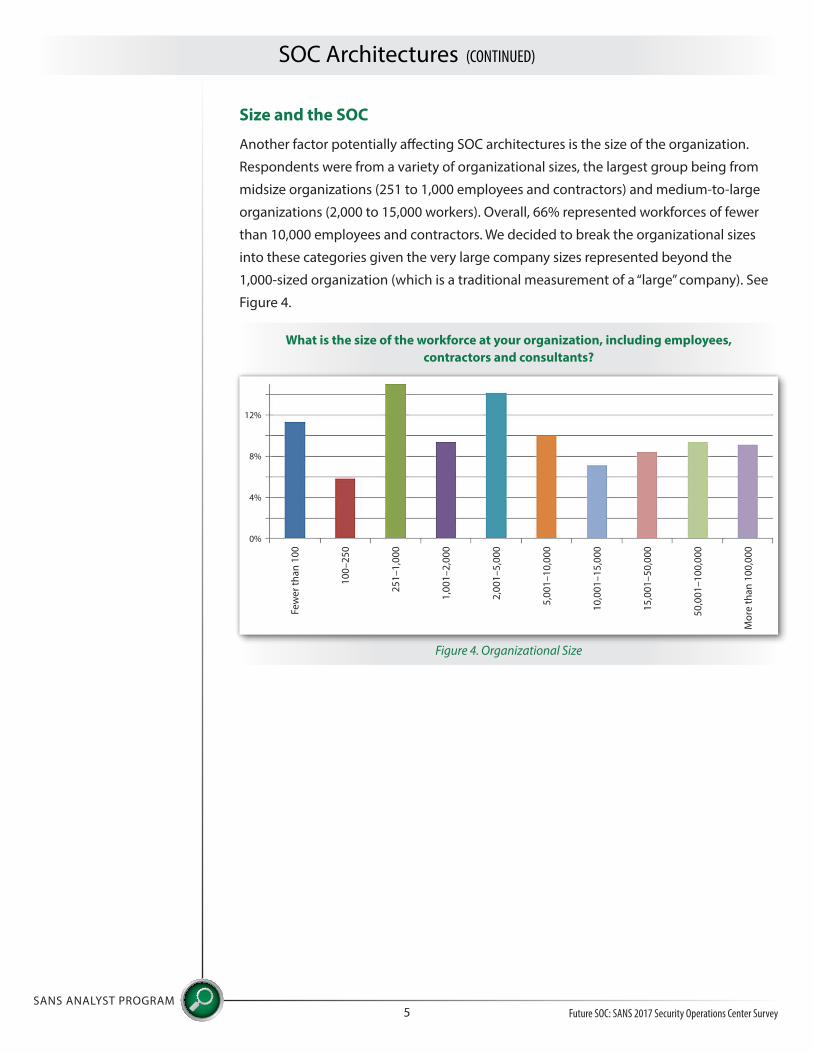
Size and the SOC
Another factor potentially affecting SOC architectures is the size of the organization.
Respondents were from a variety of organizational sizes, the largest group being from
midsize organizations (251 to 1,000 employees and contractors) and medium-to-large
organizations (2,000 to 15,000 workers). Overall, 66% represented workforces of fewer
than 10,000 employees and contractors. We decided to break the organizational sizes
into these categories given the very large company sizes represented beyond the
1,000-sized organization (which is a traditional measurement of a “large” company). See
Figure 4.
Future SOC: SANS 2017 Security Operations Center Survey
What is the size of the workforce at your organization, including employees, contractors and consultants?
5,00
1–10
,000
251–
1,00
0
Few
er th
an 1
00
10,0
01–1
5,00
0
1,00
1–2,
000
100–
250
15,0
01–5
0,00
0
50,0
01–1
00,0
00
Mor
e th
an 1
00,0
00
2,00
1–5,
000
Figure 4. Organizational Size
12%
8%
4%
0%

SOC Architectures (CONTINUED)
SANS ANALYST PROGRAM6
Survey results indicate that SOC size does not closely depend on organizational size,
at least for organizations with workforces under 10,000. The general size of the SOC for
most small to what we’re labeling medium and medium-to-large organizations (i.e., with
workforces of 10,000 or fewer) seems to be between two and five full-time employee
(FTE) positions authorized. See Figure 5.
Figure 5. SOC Size in Positions Authorized Versus Organization Size
The top answer for even those organizations with fewer than 100 workers was two to
five FTEs. This may be another indicator of their utilization of cloud services. While two to
five FTEs was still the most selected answer at the 5,001 to 10,000 range, the shift toward
more FTEs becomes fully visible as we reach 10,001 and over, where staffing moves
toward the 11-to-25 range, with organizations over 100,000 trending toward the 26-to-
100 SOC staff size.
Future SOC: SANS 2017 Security Operations Center Survey
Organization Size Versus Positions Authorized
5,00
1–10
,000
251–
1,00
0
Few
er th
an 1
00
10,0
01–1
5,00
0
1,00
1–2,
000
100–
250
15,0
01–5
0,00
0
50,0
01–1
00,0
00
Mor
e th
an 1
00,0
00
2,00
1–5,
000
Figure 5. SOC Size in Positions Authorized Versus Organization Size
7%
6%
5%
4%
3%
2%
1%
0%
<1 (part time) 1 2–5 6–10 11–25 26–100 100–1,000
SOC Architectures (CONTINUED)
SANS ANALYST PROGRAM7
SOC Staffing
This survey asked the size of the SOC but not how the organization determined what the
size should be. The primary parameters determining size are:
• Capability required—Compliance based, heavily customized, all in-house or
mostly outsourced
• Performance objectives—Detection, response, forensics, hours of performance (9
to 5 or 24/7)
• Duplication necessary—Potential need for different SOCs in geographical areas,
for example, an EU-specific SOC for European Union data
• Budget—Limits the delivery of capability, performance and duplication
Mixing It Up with Cloud
Cloud computing is currently part of 46% of the SOC infrastructures represented in this
survey, with 21% of respondents saying some functions will be cloud-based in the next
24 months and another 21% saying all of their SOC functions will be handled by one or
multiple cloud providers in the next 24 months.
When it comes to managing specific capabilities in their SOCs, respondents said most
activities are primarily handled in-house, particularly strategic activities such as their
security roadmap and planning, security architecture and engineering, and security
administration, all with over 78% claiming in-house management.
Future SOC: SANS 2017 Security Operations Center Survey
Percentage of respondents who
manage their security roadmap and planning,
architecture and administration in-house
78%
SOC Architectures (CONTINUED)
SANS ANALYST PROGRAM8
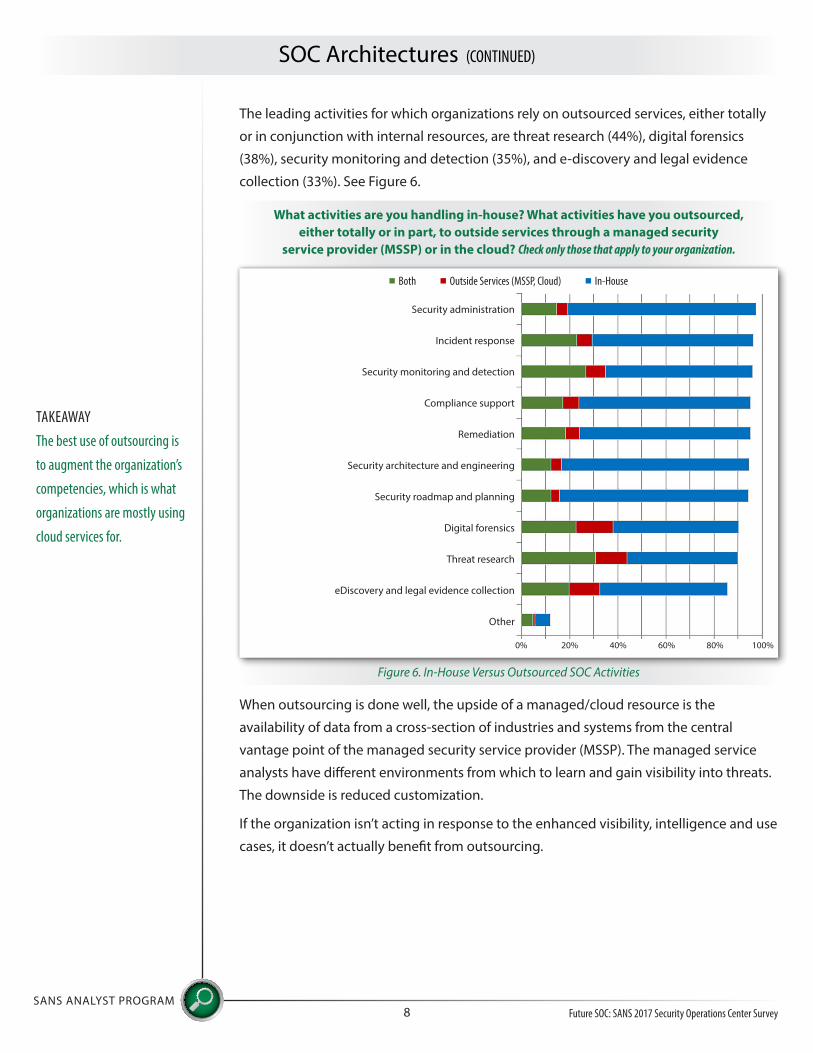
The leading activities for which organizations rely on outsourced services, either totally
or in conjunction with internal resources, are threat research (44%), digital forensics
(38%), security monitoring and detection (35%), and e-discovery and legal evidence
collection (33%). See Figure 6.
When outsourcing is done well, the upside of a managed/cloud resource is the
availability of data from a cross-section of industries and systems from the central
vantage point of the managed security service provider (MSSP). The managed service
analysts have different environments from which to learn and gain visibility into threats.
The downside is reduced customization.
If the organization isn’t acting in response to the enhanced visibility, intelligence and use
cases, it doesn’t actually benefit from outsourcing.
Future SOC: SANS 2017 Security Operations Center Survey
What activities are you handling in-house? What activities have you outsourced, either totally or in part, to outside services through a managed security
service provider (MSSP) or in the cloud? Check only those that apply to your organization.
Security administration
Security monitoring and detection
Remediation
Security roadmap and planning
Threat research
eDiscovery and legal evidence collection
Other
Incident response
Compliance support
Security architecture and engineering
Digital forensics
Figure 6. In-House Versus Outsourced SOC Activities
0% 40%20% 60% 80% 100%
Both Outside Services (MSSP, Cloud) In-House
TAKEAWAY
The best use of outsourcing is
to augment the organization’s
competencies, which is what
organizations are mostly using
cloud services for.
SOC Architectures (CONTINUED)
SANS ANALYST PROGRAM9
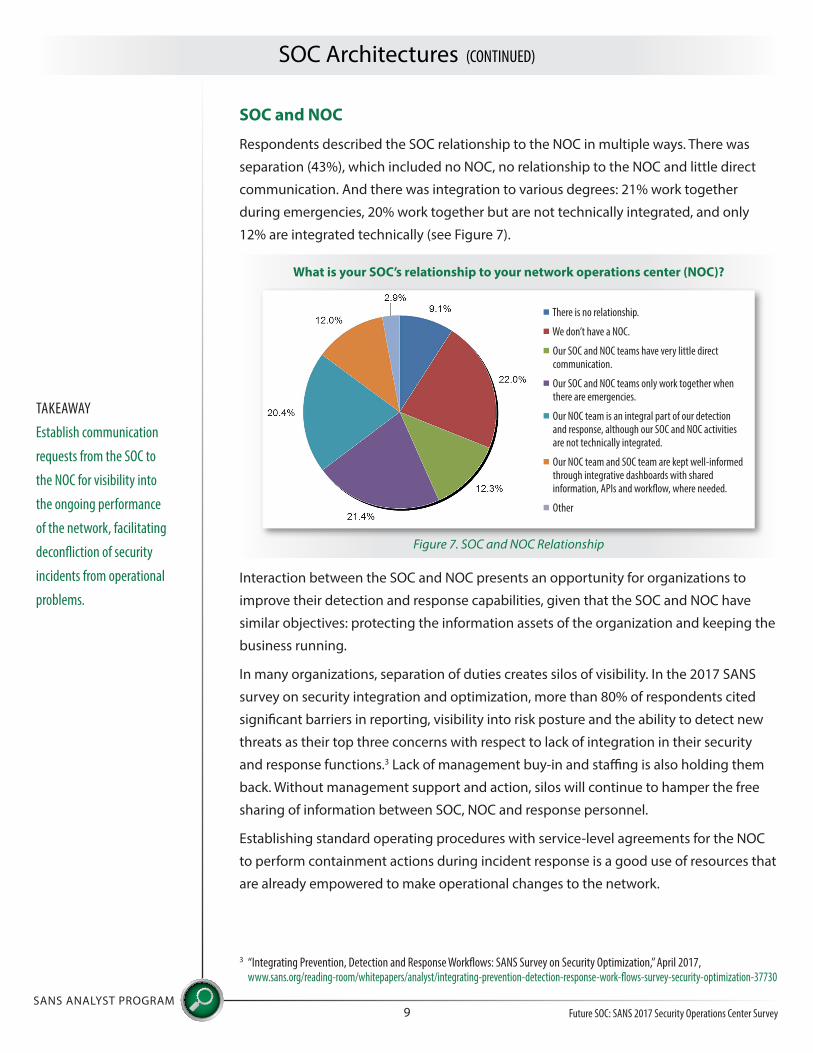
SOC and NOC
Respondents described the SOC relationship to the NOC in multiple ways. There was
separation (43%), which included no NOC, no relationship to the NOC and little direct
communication. And there was integration to various degrees: 21% work together
during emergencies, 20% work together but are not technically integrated, and only
12% are integrated technically (see Figure 7).
Interaction between the SOC and NOC presents an opportunity for organizations to
improve their detection and response capabilities, given that the SOC and NOC have
similar objectives: protecting the information assets of the organization and keeping the
business running.
In many organizations, separation of duties creates silos of visibility. In the 2017 SANS
survey on security integration and optimization, more than 80% of respondents cited
significant barriers in reporting, visibility into risk posture and the ability to detect new
threats as their top three concerns with respect to lack of integration in their security
and response functions.3 Lack of management buy-in and staffing is also holding them
back. Without management support and action, silos will continue to hamper the free
sharing of information between SOC, NOC and response personnel.
Establishing standard operating procedures with service-level agreements for the NOC
to perform containment actions during incident response is a good use of resources that
are already empowered to make operational changes to the network.
Future SOC: SANS 2017 Security Operations Center Survey
TAKEAWAY
Establish communication
requests from the SOC to
the NOC for visibility into
the ongoing performance
of the network, facilitating
deconfliction of security
incidents from operational
problems.
What is your SOC’s relationship to your network operations center (NOC)?
Figure 7. SOC and NOC Relationship
There is no relationship.
We don’t have a NOC.
Our SOC and NOC teams have very little direct communication.
Our SOC and NOC teams only work together when there are emergencies.
Our NOC team is an integral part of our detection and response, although our SOC and NOC activities are not technically integrated.
Our NOC team and SOC team are kept well-informed through integrative dashboards with shared information, APIs and workflow, where needed.
Other
3 “Integrating Prevention, Detection and Response Workflows: SANS Survey on Security Optimization,” April 2017, www.sans.org/reading-room/whitepapers/analyst/integrating-prevention-detection-response-work-flows-survey-security-optimization-37730

SOC Capabilities
SANS ANALYST PROGRAM10
SOCs carry a lot of responsibility for organizational success, and as such, the
capabilities they provide are continuing to grow. Based on responses, there is a lot of
crossover between prevention and detection capabilities, while response operations
differ greatly. For example, network intrusion detection and response were equally
important for detection and prevention, while endpoint detection and response (EDR)
was the most used capability for response. There are also some variations: Security
information and event management (SIEM) is being used more often for detection
and less for prevention—for example, threat intelligence is utilized slightly more for
detection than prevention.
As suggested earlier in the architecture section of this paper, SOCs are beginning to
combine cloud-based services with their own internal services, and responses show
that services are used far more for prevention and detection capabilities. For example,
more than 50% of respondent organizations are using some cloud-based services for
penetration testing and threat intelligence for their prevention capabilities, while 10%
fewer, on average, are using the two services for detection. The highest uses of cloud
for detection were denial of service and distributed denial of service (DDoS) at just over
40%; intelligence was the second highest use of cloud-based services for detection at
just under 40%.
Meanwhile, cloud services are used far less for response capabilities, where, with the
exception of reverse engineering of malware, cloud services are utilized in less than 25%
of respondents’ organizations.
Future SOC: SANS 2017 Security Operations Center Survey
SOC Capabilities (CONTINUED)
SANS ANALYST PROGRAM11
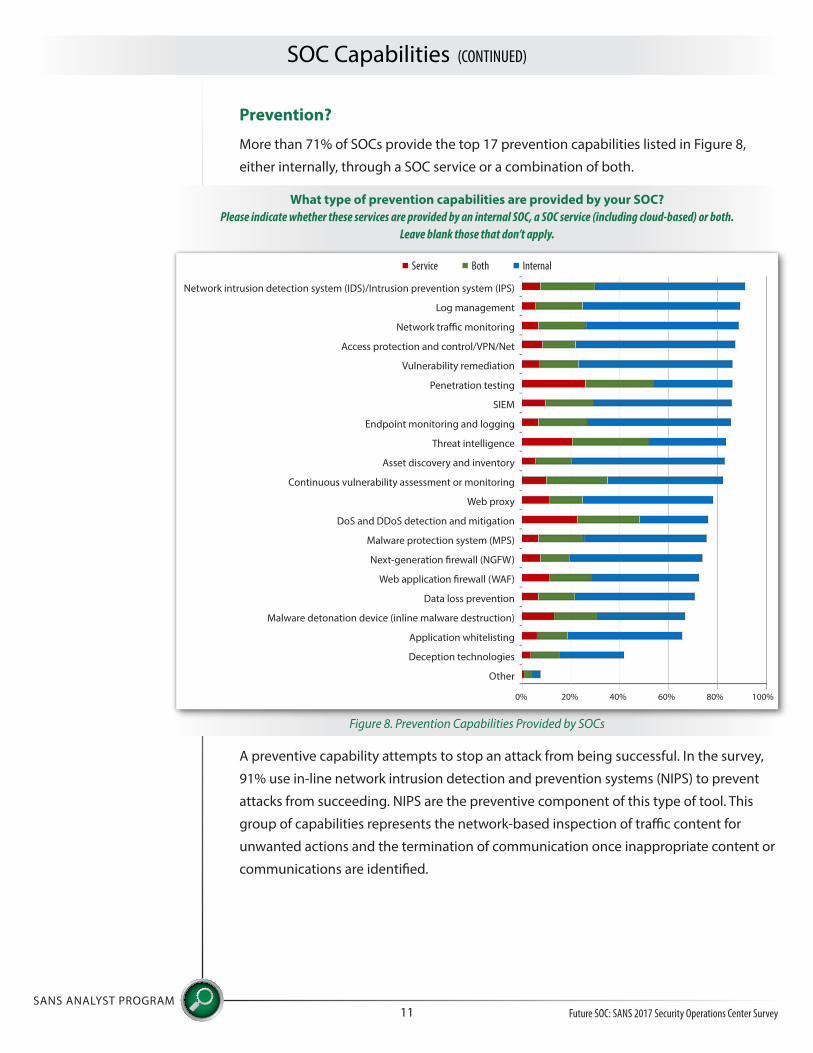
Prevention?
More than 71% of SOCs provide the top 17 prevention capabilities listed in Figure 8,
either internally, through a SOC service or a combination of both.
A preventive capability attempts to stop an attack from being successful. In the survey,
91% use in-line network intrusion detection and prevention systems (NIPS) to prevent
attacks from succeeding. NIPS are the preventive component of this type of tool. This
group of capabilities represents the network-based inspection of traffic content for
unwanted actions and the termination of communication once inappropriate content or
communications are identified.
Future SOC: SANS 2017 Security Operations Center Survey
What type of prevention capabilities are provided by your SOC? Please indicate whether these services are provided by an internal SOC, a SOC service (including cloud-based) or both.
Leave blank those that don’t apply.
Network intrusion detection system (IDS)/Intrusion prevention system (IPS)
Web proxy
Network traffic monitoring
Malware protection system (MPS)
Vulnerability remediation
Web application firewall (WAF)
SIEM
Malware detonation device (inline malware destruction)
Threat intelligence
Deception technologies
Asset discovery and inventory
Other
Continuous vulnerability assessment or monitoring
Log management
DoS and DDoS detection and mitigation
Access protection and control/VPN/Net
Next-generation firewall (NGFW)
Penetration testing
Data loss prevention
Endpoint monitoring and logging
Application whitelisting
Figure 8. Prevention Capabilities Provided by SOCs
0% 40%20% 60% 80% 100%
Service Both Internal

SOC Capabilities (CONTINUED)
SANS ANALYST PROGRAM12
Unfortunately, other network-based prevention tools such as next-generation firewalls
(NGFWs) and web application firewalls (WAFs) are trailing near the end of the capabilities
provided by SOCs, even though these are just as critical.
WAFs are the most specific type of network intrusion prevention, protecting only web
applications, which is the probable cause of the lower adoption rate. But the general-
purpose NIPS and NGFWs are ill-equipped to deal with custom web applications.
Cloud Services Preventing?
Of the 20 preventive controls listed in Figure 8, not including “Other,” less than 10%
use 14 of those controls as services. Three answers were 10% to 20% service only,
while another three had over 20% service only. Then the picture emerges that the top
three SOC functions used solely as services are penetration testing (26%), DoS/DDoS
mitigation (23%) and threat intelligence (21%).
These three functions stand out as being far more likely to be outsourced than any of the
other control capabilities, given their areas of specialization. They were also the top three
in the “both” category of outsourced and internal capabilities but in slightly different
order: threat intelligence (31%), penetration testing (28%) and DoS/DDoS mitigation (25%).
The least chosen preventive capabilities offered in the SOC include deception
capabilities (42%) and application whitelisting (66%).
Whitelisting Isn’t Easy
Application whitelisting is primarily a preventive tool, and there are some detective
benefits as well. Yet, in our experience, SOCs are opting not to use application
whitelisting because of the overhead of operations in establishing and maintaining the
lists. In most environments, the tool to deploy application whitelists is already owned via
enterprise versions of Microsoft Windows with AppLocker, available since Windows 7.
Many endpoint protection suites also provide the ability to restrict execution. In most IT
environments, whitelisting is difficult to maintain and keep up to date.
Future SOC: SANS 2017 Security Operations Center Survey
TAKEAWAY
SOCs are inclined to deploy a
general-purpose preventive
tool with broad coverage
capabilities that may be
lacking in quality in a
preventive arrangement where
false positives are intolerable.
This creates evasion
opportunities for attackers,
making it a poor strategy.
The better approach is to
deploy tuned and targeted
prevention tools and develop
use cases for detection based
on threat intelligence and
understanding of deployed
systems.
SOC Capabilities (CONTINUED)
SANS ANALYST PROGRAM13
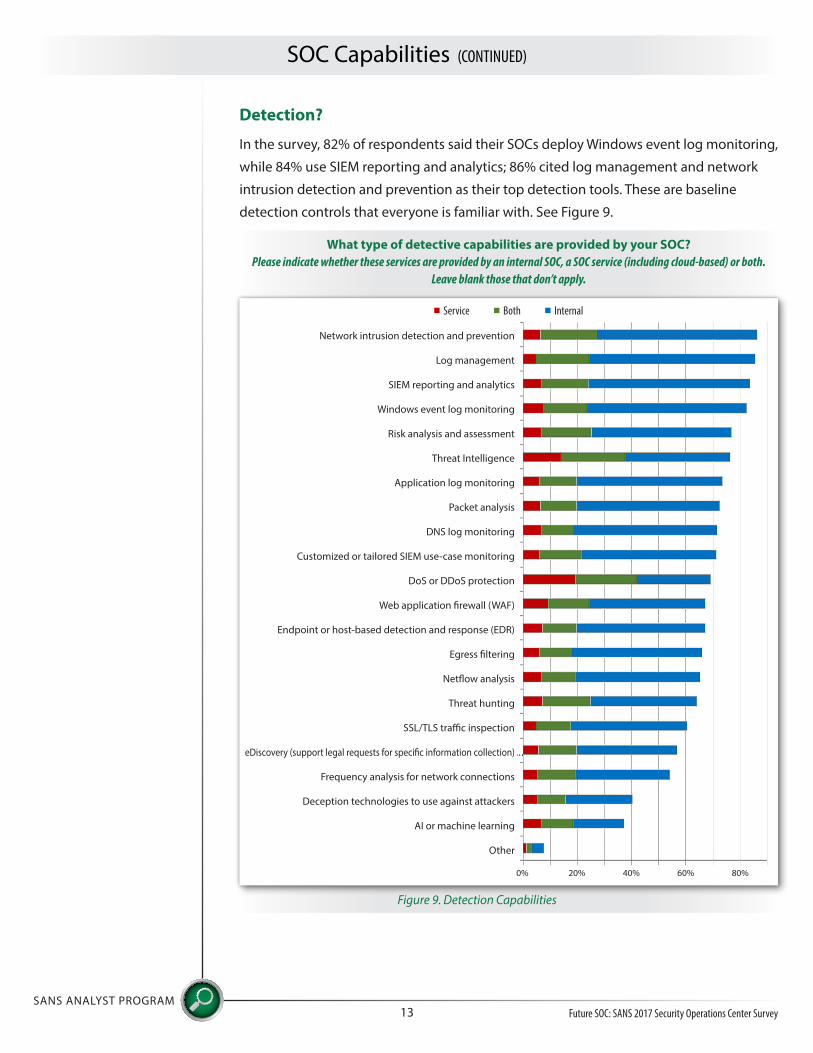
Detection?
In the survey, 82% of respondents said their SOCs deploy Windows event log monitoring,
while 84% use SIEM reporting and analytics; 86% cited log management and network
intrusion detection and prevention as their top detection tools. These are baseline
detection controls that everyone is familiar with. See Figure 9.
Future SOC: SANS 2017 Security Operations Center Survey
What type of detective capabilities are provided by your SOC? Please indicate whether these services are provided by an internal SOC, a SOC service (including cloud-based) or both.
Leave blank those that don’t apply.
Network intrusion detection and prevention
Web application firewall (WAF)
SIEM reporting and analytics
Egress filtering
Risk analysis and assessment
Threat hunting
Application log monitoring
eDiscovery (support legal requests for specific information collection)
DNS log monitoring
Deception technologies to use against attackers
Customized or tailored SIEM use-case monitoring
AI or machine learning
Other
DoS or DDoS protection
Log management
Endpoint or host-based detection and response (EDR)
Windows event log monitoring
Netflow analysis
Threat Intelligence
SSL/TLS traffic inspection
Packet analysis
Frequency analysis for network connections
Figure 9. Detection Capabilities
0% 40%20% 60% 80%
Service Both Internal

SOC Capabilities (CONTINUED)
SANS ANALYST PROGRAM14
Windows event log monitoring involves potentially overwhelming amounts of data to
monitor the health and status of a system. To deal with the overload, a few strategies
can be employed. First, organizations can employ targeted inspection for indicators of
interest, usually from threat intelligence. This should be
applied historically as new threat intelligence comes
to light. A second option is threat hunting by analysts
for relationships that might not be identified through
automated correlation. This process is time consuming,
but it’s necessary for long-term improvement. Finally,
SOCs can use system-provided correlation to identify
scenarios of anomalies for detection and validation. This
is also called use-case development, and this automation of correlation should be an
output from threat hunting exercises.
Responding to the Call?
Most people think of incident response as the manifestation of the defense of the
organization. In practice, we can respond only when we detect. This is where threat
intelligence tools—such as adversary deception, threat campaign tracking, threat
attribution and threat neutralization—should be used most. Yet these functions score
lowest on the list of response capabilities SOCs offer. See Figure 10.
Future SOC: SANS 2017 Security Operations Center Survey
Cloud Services Detecting?
As you can see from Figure 9 (on the previous page), respondent organizations are adopting even fewer cloud services for their detection functions. But the ones that do stand out—DoS/DDoS detection and threat intelligence—make sense, given that most intelligence providers are third parties and you need to externally choke off DoS attacks before they disrupt business.
SOC Capabilities (CONTINUED)
SANS ANALYST PROGRAM15
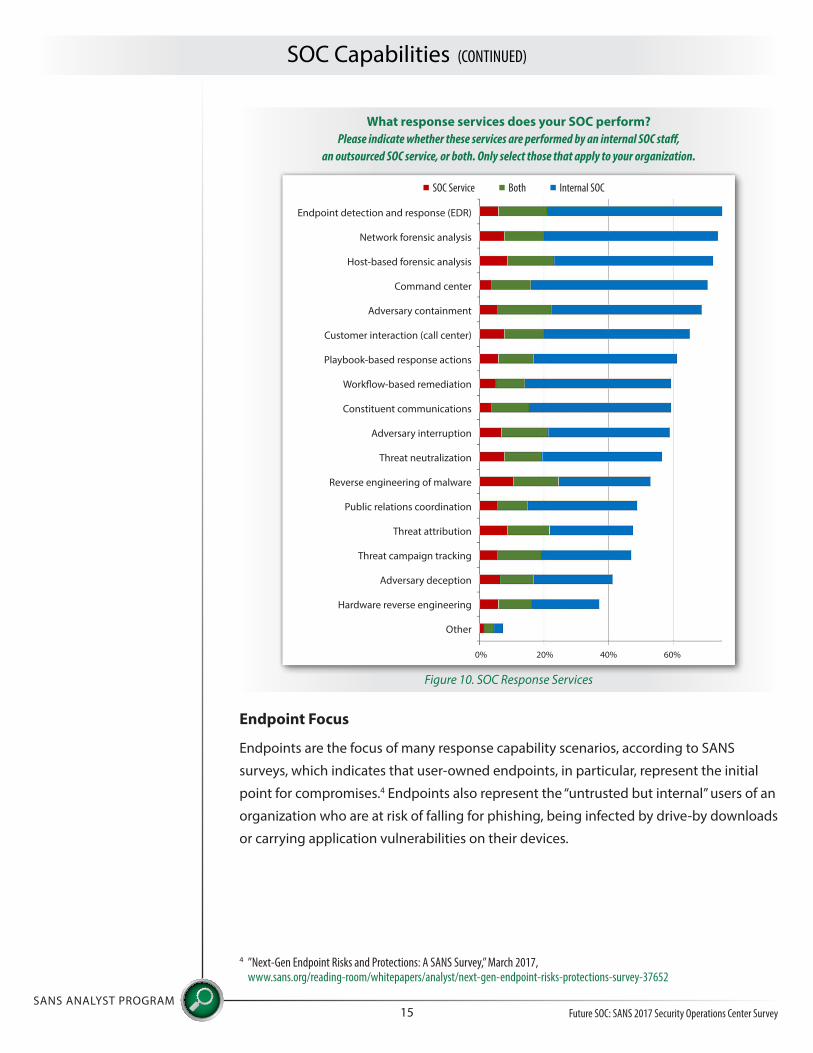
Endpoint Focus
Endpoints are the focus of many response capability scenarios, according to SANS
surveys, which indicates that user-owned endpoints, in particular, represent the initial
point for compromises.4 Endpoints also represent the “untrusted but internal” users of an
organization who are at risk of falling for phishing, being infected by drive-by downloads
or carrying application vulnerabilities on their devices.
Future SOC: SANS 2017 Security Operations Center Survey
What response services does your SOC perform? Please indicate whether these services are performed by an internal SOC staff,
an outsourced SOC service, or both. Only select those that apply to your organization.
Figure 10. SOC Response Services
Endpoint detection and response (EDR)
Reverse engineering of malware
Host-based forensic analysis
Threat attribution
Adversary containment
Adversary deception
Playbook-based response actions
Other
Constituent communications
Adversary interruption
Threat neutralization
Network forensic analysis
Public relations coordination
Command center
Threat campaign tracking
Customer interaction (call center)
Hardware reverse engineering
Workflow-based remediation
0% 40%20% 60%
SOC Service Both Internal SOC
4 ”Next-Gen Endpoint Risks and Protections: A SANS Survey,” March 2017, www.sans.org/reading-room/whitepapers/analyst/next-gen-endpoint-risks-protections-survey-37652

SOC Capabilities (CONTINUED)
SANS ANALYST PROGRAM16
In the case of user endpoints, containment and remediation are easier because there
is only a single user impacted by the remediation process. On servers, there is typically
a larger community of employees or customers that the containment action affects,
sometimes with an unacceptable availability interruption.
Cloud Services Responding?
SOCs use cloud-based services far less for response capabilities, which survey takers
indicated is mostly done in-house. This makes sense, given that most tool vendors follow
events and provide advice, maps and even patches. But remediation and other response
functions are generally up to the impacted organizations to handle.
Organizations most commonly outsourced reverse engineering, likely because
specialization is required and it is infrequently needed to perform incident response.
Monitoring Things?
Interestingly, the Internet of Things (IoT)—all the stuff that’s connected to computer
networks that isn’t a traditional user system like a phone or a laptop—is not getting
much SOC coverage. See Figure 11.
Only 9% said they support all organizational IoT systems, while 21% currently have
no plans for their SOC to support smart systems. The most common answer was that
currently there’s partial coverage (24%).
Future SOC: SANS 2017 Security Operations Center Survey
TAKEAWAY
SOCs need to act as the
equivalent to “911” for
computer emergencies. They
should have clear means for
customers to report issues.
Yet in the survey, only 65% of
respondents said they have
this capability in any form.
Does your SOC support nontraditional computing devices (Internet of Things, such as smart sensors, building devices, building monitoring,
manufacturing and industrial control systems, etc.)?
Other
We haven’t assessed and inventoried smart system yet, but we plan to.
Yes. Our SOC supports all of our smart systems deemed at risk.
Unsure
No. We have no plans to support smart systems.
Partly. Our SOC supports some of our connected, at-risk smart systems.
Figure 11. SOC Support of Nontraditional Computing Devices
0% 10%5% 15% 20%
Now In the Next 24 Months
25%
SOC Capabilities (CONTINUED)
SANS ANALYST PROGRAM17
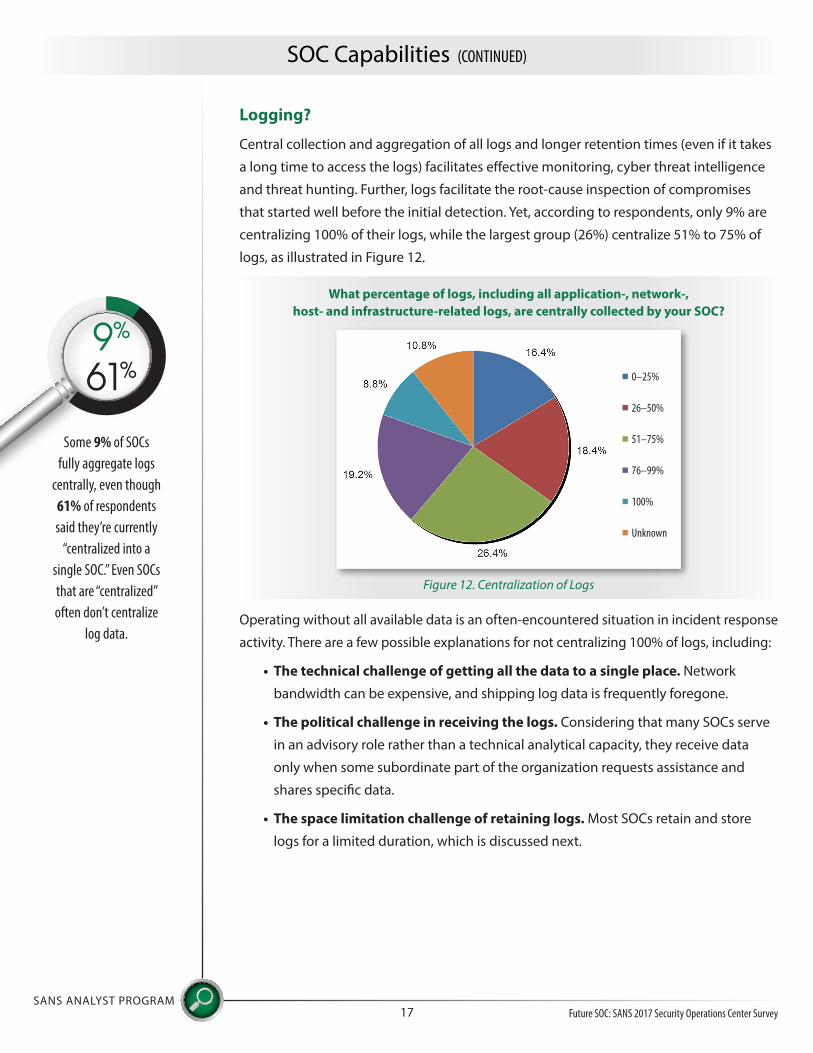
Logging?
Central collection and aggregation of all logs and longer retention times (even if it takes
a long time to access the logs) facilitates effective monitoring, cyber threat intelligence
and threat hunting. Further, logs facilitate the root-cause inspection of compromises
that started well before the initial detection. Yet, according to respondents, only 9% are
centralizing 100% of their logs, while the largest group (26%) centralize 51% to 75% of
logs, as illustrated in Figure 12.
Operating without all available data is an often-encountered situation in incident response
activity. There are a few possible explanations for not centralizing 100% of logs, including:
• The technical challenge of getting all the data to a single place. Network
bandwidth can be expensive, and shipping log data is frequently foregone.
• The political challenge in receiving the logs. Considering that many SOCs serve
in an advisory role rather than a technical analytical capacity, they receive data
only when some subordinate part of the organization requests assistance and
shares specific data.
• The space limitation challenge of retaining logs. Most SOCs retain and store
logs for a limited duration, which is discussed next.
Future SOC: SANS 2017 Security Operations Center Survey
What percentage of logs, including all application-, network-, host- and infrastructure-related logs, are centrally collected by your SOC?
Figure 12. Centralization of Logs
0–25%
26–50%
51–75%
76–99%
100%
Unknown
Some 9% of SOCs fully aggregate logs
centrally, even though 61% of respondents said they’re currently
“centralized into a single SOC.” Even SOCs that are “centralized” often don’t centralize
log data.
9%
61%

SOC Capabilities (CONTINUED)
SANS ANALYST PROGRAM18
Of the logs that are being retained for the SOC, 57% of regulated data is retained for one
year or less, while 42% of unregulated data is retained for one year or less. This is adequate
if the incidents being investigated are fully wrapped up within one year. Unfortunately,
industry studies such as Verizon’s 2016 data breach report and SANS surveys show there is
a longer duration than one year before discovery in many instances.5, 6
Making Sense?
In the survey, 77% of respondents said their SOCs are using SIEM tools to stitch together
the disparate sources and look for patterns. This is a costly proposition, but usually more
cost-effective than custom, internally developed APIs and dashboards, which 23% of
respondents said they are using. See Figure 13.
As with most of our questions, respondents were able to select all that apply so there is
some overlap, reflecting the real-world environments in which teams use multiple tools
to perform analytics functions.
Future SOC: SANS 2017 Security Operations Center Survey
TAKEAWAY:
Collection of information
is valuable for the purpose
of correlation. Aggregating
massive amounts of data to
look for anomalies is what
the SOC does as a matter of
ongoing operations.
How does your SOC correlate and analyze event data, IOCs and other security- and threat-related data?
Select those that apply.
Don’t always know—it all happens in the cloud
Other
Through home-developed APIs and dashboards
Through our SIEM
Through home-developed APIs and dashboards
Through our aggregated log management systems
Figure 13. Data Correlation and Analysis Methodologies
0% 20%10% 30% 40% 50%
5 “2016 Verizon Data Breach Investigations Report,” www.verizonenterprise.com/verizon-insights-lab/dbir6 “Incident Response Capabilities in 2016: The 2016 SANS Incident Response Survey,” June 2016,
www.sans.org/reading-room/whitepapers/analyst/incident-response-capabilities-2016-2016-incident-response-survey-37047

SOC Capabilities (CONTINUED)
SANS ANALYST PROGRAM19
There are many specialized systems in place to assist with pattern matching and
guidance. For example, cyber threat intelligence (CTI) platforms, selected by 38% of
respondents as part of their SOC capability, have created opportunities to correlate
information. Their ongoing collection of attacker behavior helps analysts seek out
indicators, such as:
• IP addresses
• SMTP gateways
• Malware programming techniques
• Commonly employed adversary tactics
• Adversary working hours
• Preferred targets
In the survey, 38% of respondents said they are using log collection and aggregation
tools to analyze their event data. Or, as one respondent candidly responded, they
correlate through “luck, mostly.” SIEM tools tend to have a challenge with massive
amounts of data because they attempt to process everything as it is ingested. On
the other hand, log aggregation maintains a raw collection of data, with analytical
processing happening as needed.
Threat hunting is an area of responsibility for the SOC. Even with an armada of
equipment and software, analysts must tune that technology to suit the organization’s
changing IT landscape, as well as the adaptive threat environment. The adversaries
defrauding and damaging organizations are human.
Adversaries are adaptive, motivated and profitable. Some
SOCs are embracing threat hunting as a part of standard
operations.
Responses show that organizations are using multiple
platforms to help with the correlation, meaning there are
multiple platforms and consoles from which analysts collect,
correlate and remediate.
Threat hunting with automated data collection and correlation improves the speed
with which analysts can investigate and remediate unknown threats. For known threats,
inclusion of learned intelligence in correlation engines is the way to improve accuracy
and performance.
Future SOC: SANS 2017 Security Operations Center Survey
Hunting Means Looking for Something
The lucky ones are those who are looking for something rather than waiting for it to find them. This involves collecting data (registry, process, file, user, etc.) and correlating it to find suspicious behavior in your enterprise environment. Every correlation and use case built into EDR, SIEM and incident response platforms or homegrown tools stems from an analyst investigating something that is a bit off.

SOCs are clearly on their toes for incident definition. In this survey, only 17% of
respondents lack a formal definition of what an incident is or is not, which is an
important starting measurement for defenders and analysts alike (see Figure 14).
The prospect of running a SOC without a formal definition of what is appropriate to
detect or respond to represents a major obstacle to effective SOC operation. Most
organizations (45%) do have a formal definition with specific impact categories. The
next largest group uses a less formal approach: “any adverse event above the normal
level of noise.”
Even the 2% who stated their organization purposefully avoids the term incident
because it would trigger legal action know what they’re trying to avoid. This represents
an interesting but not uncommon problem. All SOCs must conform to the legal
guidance provided by the organization, and there are specific actions that might be
very expensive for the organization. This legal maneuvering takes care and caution. The
danger is when the legal caution prevents the SOC from doing optimal work.
SANS ANALYST PROGRAM20
Metrics and Performance
Which of these most closely resembles your organization’s definition of a security incident?
Figure 14. Organizational Definitions of “Incident”
We have no formal definition of a security incident.
An incident is any adverse event or the threat of an adverse event above the normal level of noise.
An incident is a cyber intrusion that impacts our systems and causes direct or indirect financial damage to us or our clients/customers.
There are multiple specific incident types and impact levels that are formally defined as an incident in our organization.
The organization doesn’t use the term incident, because that would trigger regulatory or industrial reporting requirements it wants to avoid.
We haven’t sorted out the difference in the definitions of an incident, a breach and a threat, but we are hoping to.
Other
Future SOC: SANS 2017 Security Operations Center Survey
An incident is
“an observed and
declared occurrence
of the compromise
or imminent
compromise of
our system.”
—Survey respondent
Metrics and Performance (CONTINUED)
SANS ANALYST PROGRAM21
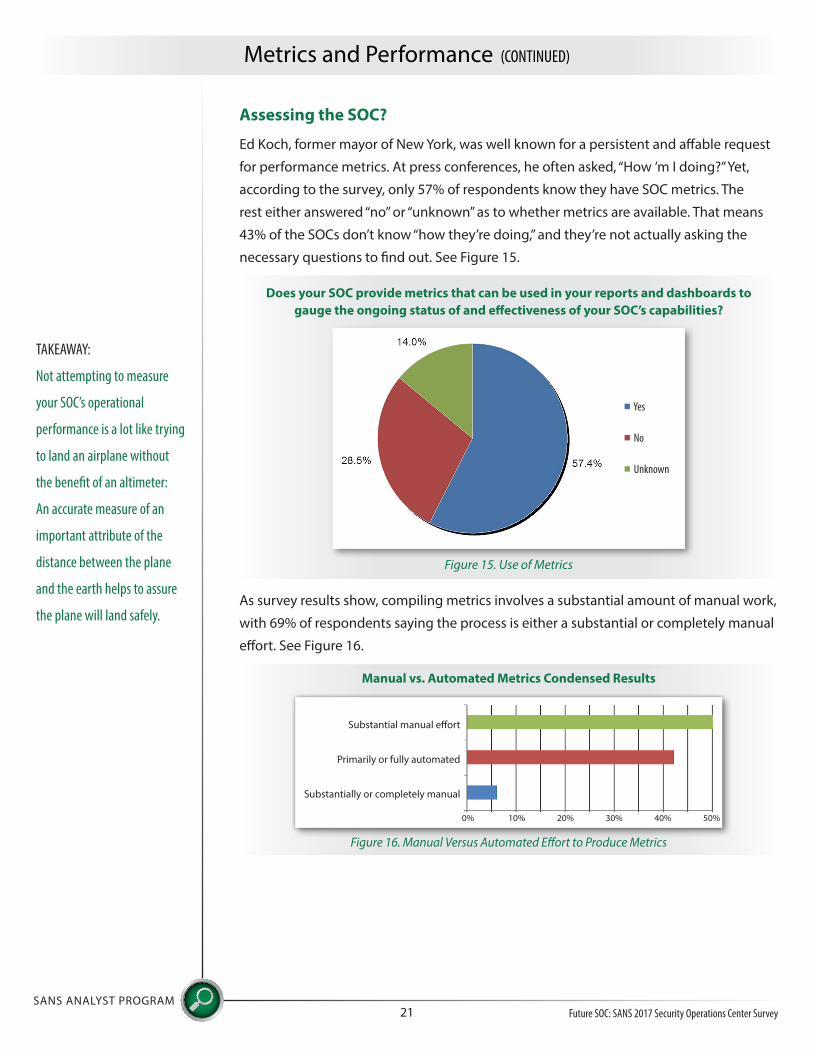
Assessing the SOC?
Ed Koch, former mayor of New York, was well known for a persistent and affable request
for performance metrics. At press conferences, he often asked, “How ’m I doing?” Yet,
according to the survey, only 57% of respondents know they have SOC metrics. The
rest either answered “no” or “unknown” as to whether metrics are available. That means
43% of the SOCs don’t know “how they’re doing,” and they’re not actually asking the
necessary questions to find out. See Figure 15.
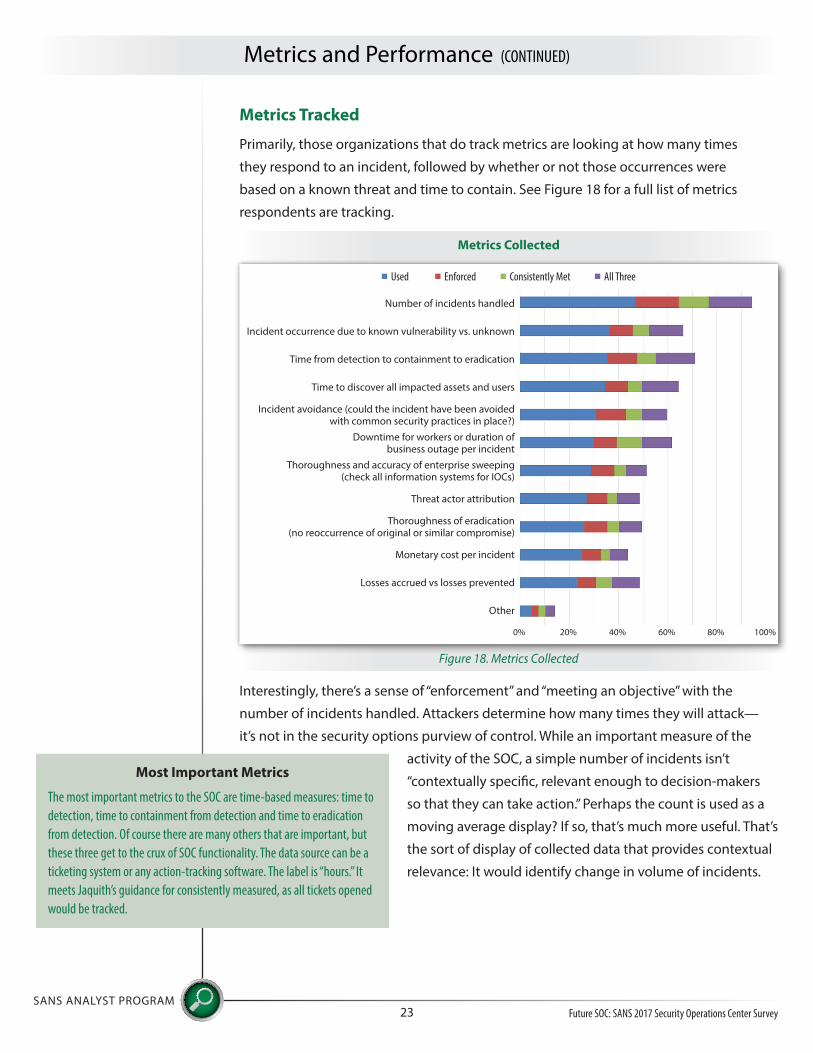
As survey results show, compiling metrics involves a substantial amount of manual work,
with 69% of respondents saying the process is either a substantial or completely manual
effort. See Figure 16.
Future SOC: SANS 2017 Security Operations Center Survey
Does your SOC provide metrics that can be used in your reports and dashboards to gauge the ongoing status of and effectiveness of your SOC’s capabilities?
Figure 15. Use of Metrics
Yes
No
Unknown
TAKEAWAY:
Not attempting to measure
your SOC’s operational
performance is a lot like trying
to land an airplane without
the benefit of an altimeter:
An accurate measure of an
important attribute of the
distance between the plane
and the earth helps to assure
the plane will land safely.
Manual vs. Automated Metrics Condensed Results
Figure 16. Manual Versus Automated Effort to Produce Metrics
Substantial manual effort
Substantially or completely manual
Primarily or fully automated
0% 20%10% 30% 40% 50%

Metrics and Performance (CONTINUED)
SANS ANALYST PROGRAM22
If you compare this with Jaquith’s assertion of what a metric should be, we see that the
manual components are not in alignment with the ideal state: “consistently measured,
without subjective criteria; cheap to gather, preferably in an automated way….”7
The key is to equip the systems for data collection and compile the data on an ongoing
basis to see what the SOC is doing and how well it is doing it. Figure 17 shows how the
57% of respondents who are collecting metrics are tracking and reporting on them.
Future SOC: SANS 2017 Security Operations Center Survey
How are metrics tracked and reported?
Partially automated data extraction, with substantial manual effort required, and partially automated calculation
Completely manual process requiring extraction of data from multiple sources and mostly manual calculation
Other
Primarily automated, with minimal manual effort to complete reporting
Fully automated via an integrated dashboard, with complete, ongoing visibility into SOC performance metrics
Figure 17. How SOCs Track and Report Metrics
0% 20%10% 30% 40% 50%
Security Expert on Metrics
“A good metric should be: consistently measured, without subjective criteria; cheap to gather, preferably in an automated way; expressed as a cardinal number or percentage, not with qualitative labels like “high,” “medium” and “low”; expressed using at least one unit of measure, such as “defects,” “hours” or “dollars.” Ideally it should also be “contextually specific, relevant enough to decision-makers so that they can take action.”
It’s a simple analogy. Anyone can relate. But we frequently lack such simple metrics for SOCs.8
7 Jaquith, Andrew. Security Metrics: Replacing Fear, Uncertainty, and Doubt. Upper Saddle River, NJ: Addison-Wesley, 2010. p. 22.8 Jaquith, Andrew. Security Metrics: Replacing Fear, Uncertainty, and Doubt. Upper Saddle River, NJ: Addison-Wesley, 2010. p. 22
Metrics and Performance (CONTINUED)
SANS ANALYST PROGRAM23
Metrics Tracked
Primarily, those organizations that do track metrics are looking at how many times
they respond to an incident, followed by whether or not those occurrences were
based on a known threat and time to contain. See Figure 18 for a full list of metrics
respondents are tracking.
Interestingly, there’s a sense of “enforcement” and “meeting an objective” with the
number of incidents handled. Attackers determine how many times they will attack—
it’s not in the security options purview of control. While an important measure of the
activity of the SOC, a simple number of incidents isn’t
“contextually specific, relevant enough to decision-makers
so that they can take action.” Perhaps the count is used as a
moving average display? If so, that’s much more useful. That’s
the sort of display of collected data that provides contextual
relevance: It would identify change in volume of incidents.
Future SOC: SANS 2017 Security Operations Center Survey
Metrics Collected
Number of incidents handled
Other
Time from detection to containment to eradication
Incident avoidance (could the incident have been avoided with common security practices in place?)
Thoroughness and accuracy of enterprise sweeping (check all information systems for IOCs)
Thoroughness of eradication (no reoccurrence of original or similar compromise)
Monetary cost per incident
Losses accrued vs losses prevented
Incident occurrence due to known vulnerability vs. unknown
Time to discover all impacted assets and users
Downtime for workers or duration of business outage per incident
Threat actor attribution
Figure 18. Metrics Collected
0% 40%20% 60% 80% 100%
Used Enforced Consistently Met All Three
Most Important Metrics
The most important metrics to the SOC are time-based measures: time to detection, time to containment from detection and time to eradication from detection. Of course there are many others that are important, but these three get to the crux of SOC functionality. The data source can be a ticketing system or any action-tracking software. The label is “hours.” It meets Jaquith’s guidance for consistently measured, as all tickets opened would be tracked.

Metrics and Performance (CONTINUED)
SANS ANALYST PROGRAM24
Satisfaction with Performance
Those collecting metrics are most satisfied with their own flexibility of response. See
Figure 19.
Addressing unknown problems means discovering them. This entails unveiling what
appears to be normal as actually problematic. Taking this step includes looking for
malicious activity via log review, etc. Second, this entails analysis using externally provided
information, as well as developing internal threat information via threat hunting.
Respondents are most satisfied with their SOC’s flexibility response. While it is common
advice to be flexible, and this is very important, routines and automation are methods
for efficiency and speed, which are represented by the second-most satisfied response,
“Overall response time.” Speed of discovery and satisfaction with discovering likely
incidents in advance is an advisable strategic and tactical objective. This likely takes the
form of more organizational awareness, which leads to better SIEM use cases, which is
further informed by threat intelligence.
Future SOC: SANS 2017 Security Operations Center Survey
Percent Satisfied Versus Percent Answered
Other
Configurability of tools
SOC-NOC coordination and effectiveness
Effectiveness and thoroughness of containment
Clarity of reports
Flexibility of response
False positive rates
Time to detect
Remediation time
Thoroughness of remediation
Ability to detect previously unknown attacks
Accuracy of detection
Time to deflect or disrupt attacks and abuse
Overall response time
Workflow
Time to contain attacks
Figure 19. Satisfaction with Metrics
0% 40%20% 60% 80% 100%
Percent Satisfied Percent Reported as Measured
If the “Satisfied”
rankings were a
report card, our
parents would be
disappointed.
Conclusion
SANS ANALYST PROGRAM25
The SOC is a new and developing space architected in many ways across organizations
with some consensus on what should be done: log, monitor, correlate and respond.
The notion of an incident seems to be clear in the SOC, yet performance assessment
capability and alignment to business appears lacking and is an important area for
improvement.
The survey highlights that a lot of SOC data collection and analysis is done via manual
methods, meaning the need to sift through and correlate hundreds of events every day.
Automation of data collection and analysis can empower SOC teams to deal with the
overwhelming number of alerts with confidence.
Results also show that many organizations are moving some portion of their SOC to
managed service providers. This model seeks efficiency by transferring tasks to a third
party, but it risks diminishing the tailored actions and localized knowledge associated
with the needs of the business.
The use of clearly articulated metrics to express performance offers an opportunity
to improve SOCs. Development of useful metrics requires reuse of available data and
selection of performance criteria that are valuable to the specific business needs and
measure the effectiveness of the SOCs detection and remediation activities. Metrics
are challenging, however, because there’s not always a consensus on what makes good
metrics within the SOC.
Another opportunity for enhancement is more effective collaboration between NOCs
and SOCs. Organizations have been performing IT operations for a long time, while
SOCs typically are newer phenomena. The SOC and NOC can share data access to help
IT operations make effective architecture decisions and to help the SOC make effective
containment and monitoring decisions. Hunting and correlation are other areas
organizations should improve on over the next 24 months.
The alchemical formula for completely effective SOCs won’t be cracked in the immediate
future. But over the course of the next year, we will likely see a better community
consensus of what a SOC is.
Future SOC: SANS 2017 Security Operations Center Survey
Christopher Crowley, a principal SANS instructor and course author for SANS courses in Managing
Security Operations and Incident Response Team Management, holds multiple certifications. He
received the SANS 2009 Local Mentor of the Year award for excellence in providing mentor classes
to his local community. Chris is a consultant based in Washington, D.C., who has more than 15 years
of experience in managing and securing networks. His areas of expertise include network and
mobile penetration testing, mobile device deployments, security operations, incident response and
forensic analysis.
SANS ANALYST PROGRAM26
About the Author
Sponsor
SANS would like to thank this survey’s sponsor:
Future SOC: SANS 2017 Security Operations Center Survey