future of manufacturing in south east … of manufacturing in south east melbourne steering...
TRANSCRIPT

FUTURE OF
MANUFACTURING IN
SOUTH EAST
MELBOURNE
FUTURE OF
MANUFACTURING IN
SOUTH EAST
MELBOURNE
Steering Committee
Ian Monger (Chair)
Anita Buczkowsky
Paul Dowling
Sandra George
Rod Nelson
Project Team
Rodney Bourke
John Dean
Rodin Genoff
Tony Quick
Garry Wall
This study was commissioned by the Southern Melbourne Regional Development
Australia Committee in partnership with South East Business Networks and the
South East Melbourne Manufacturers‘ Alliance.
December 2011

Page | 3
Contents Abbreviations ........................................................................................................................ 5 1. Executive Summary ......................................................................................................... 6 2. Project objectives and methodology ................................................................................. 9
2.1 Objectives ............................................................................................................... 9 2.2 Defining manufacturing ......................................................................................... 10 2.3 Defining the region ................................................................................................ 10 2.4 Method ................................................................................................................. 10 2.5 Policy context ....................................................................................................... 11
3: Manufacturing in a Global Context ................................................................................. 13 3.1 Forces shaping the global economy ...................................................................... 13
3.1.1 Changing players in the international economy .............................................. 13 3.1.2 Rising cost of resources ................................................................................. 13 3.1.3 Reach of Information and Communications Technology (ICT). ...................... 14 3.1.4 Growth of services sector .............................................................................. 15
3.2 Pressures on the business of manufacturing ........................................................ 15 3.2.1 Origins of manufacturing organisation ............................................................ 15 3.2.2 New customers and changing demands ........................................................ 16 3.2.3 More stakeholder requirements ..................................................................... 16 3.2.4 Intense competition ........................................................................................ 16 3.2.5 The pace of innovation and development of new technologies ....................... 16
3.3 Responding to change ........................................................................................ 157 3.3.1 Flexible manufacturing ................................................................................... 18 3.3.2 Evolution in how manufacturers create value ................................................. 21 3.3.3 Customers and markets ................................................................................. 20 3.3.4 Manufacturing operations .............................................................................. 21 3.3.5 Organisation of production: Global supply chains ......................................... 21 3.3.6 Computer integrated manufacturing ............................................................... 22 3.3.7 New Enabling Technologies ........................................................................... 23
3.4 Innovation in Business Models .............................................................................. 24 3.5 Implications of technology development................................................................ 25
4: Manufacturing - the Australian Context ......................................................................... 26 4.1 Performance of Australia‘s manufacturing sector .................................................. 26 4.2 Performance of manufacturing sub-sectors ........................................................... 30 4.3 Technology ........................................................................................................... 36 4.4 Firm size ............................................................................................................... 37 4.5 Demand side issues.............................................................................................. 38 4.6 Implications for manufacturers in South East Melbourne ...................................... 40
5: Manufacturing in South East Melbourne......................................................................... 40 5.1 Characteristics of manufacturing in South East Melbourne ................................... 40
5.1.1 Importance of manufacturing in South East Melbourne ................................. 40 5.1.2 Industry profile ............................................................................................... 44 5.1.3 Sub-region characteristics............................................................................. 45 5.1.4 Evidence of change and restructuring ............................................................ 46
5.2 Managers attitudes and firm strategy: Preparing for the future ............................. 48 5.2.1 Competitive advantages ................................................................................ 48 5.2.2 Factors driving change ................................................................................... 49 5.2.3 Risks .............................................................................................................. 49 5.2.4 Firm responses to change.............................................................................. 50 5.2.5 Strategic intentions: Technology investment ................................................. 51

Page | 4
5.2.6 Strategic intentions: Capability acquisition .................................................... 52 5.2.7 Market development ...................................................................................... 52 5.2.8 Service offerings ............................................................................................ 52 5.2.9 Location of customers and sales .................................................................... 53 5.2.10 Engagement with local suppliers .................................................................... 54 5.2.11 Opportunities for local collaboration ............................................................... 55 5.2.12 Regional manufacturing leaders..................................................................... 55
5.3 Labour force issues .............................................................................................. 55 5.4 Supporting infrastructure ....................................................................................... 56
5.4.1 Economic infrastructure .................................................................................. 56 5.4.2 Public Research Organisations ...................................................................... 57 5.4.3 Education and Training .................................................................................. 57 5.4.4 Supporting organisations ................................................................................. 58
6: Findings ......................................................................................................................... 63 6.1 Forces shaping manufacturing .............................................................................. 63
6.1.1 Structural issues shaping Australian manufacturing ....................................... 63 6.1.2 Global integration of manufacturing activity .................................................... 64 6.1.3 Organisation of production ............................................................................. 64 6.1.4 Technology .................................................................................................... 65 6.1.5 Sustainability.................................................................................................. 65
6.2 Firm readiness and capabilities ............................................................................. 65 6.2.1 Firm leadership and management .................................................................. 65 6.2.2 Sources of value ............................................................................................ 67
6.3 Infrastructure ........................................................................................................ 67 6.4 Regional manufacturing leadership and morale .................................................... 68 6.5 Interfirm linkages .................................................................................................. 69 6.6 Support mechanisms ............................................................................................ 69 6.7 Education and training .......................................................................................... 70 6.8 Land supply .......................................................................................................... 70
7: Shaping the strategy – strategic considerations ............................................................. 71 7.1 Strategic options – possible elements of a strategy .............................................. 71 7.2 Overview of the strategic environment .................................................................. 72 7.3 Focus of activity .................................................................................................... 74
7.3.1 Firms, sectors and other commonalities ............................................................. 74 7.3.2 Knowledge flows and segmentation of firms ....................................................... 75 7.3.3 Attraction and retention of manufacturing firms .................................................. 79
7.4 Leadership ............................................................................................................ 79 7.5 Resources ............................................................................................................ 80 7.6 Timeframe ............................................................................................................. 82
8. Strategy and recommendations ..................................................................................... 83 8.1 Theme 1: Shared vision of viable manufacturing of the future.................................. 84 8.2 Theme 2: Global outlook .......................................................................................... 85
8.2.1 Global view ........................................................................................................ 85 8.2.2 Global connections ............................................................................................. 86
8.3 Theme 3: Encouraging a culture of change .......................................................... 86 8.4 Theme 4: Building on the strength of existing bodies ........................................... 87 8.5 Theme 5: Leadership and management skills ...................................................... 89 8.6 Recommended Actions ......................................................................................... 90

Page | 5
Abbreviations
ABS Australian Bureau of Statistics
AiG Australian Industry Group
ANZSIC Australian and New Zealand Standard Industrial Classification
ASX Australian Securities Exchange
BIG Business Improvement Group
CAD Central Activity District
CBD Central Business District
CGD City of Greater Dandenong
CNC Computer Numerical Control
CRC Cooperative Research Centre
CSIRO Commonwealth Scientific and Industrial Research Organisation
DBI Department of Business and Innovation
DDB Dandenong Development Board
DIISR Department of Innovation, Industry, Science and Research
EC Enterprise Connect
emp Employment
GMC Geelong Manufacturing Council
HPC High Performance Consortium
ICN Industry Capability Network
ICT Information and Communications Technology
GDP Gross Domestic Product
LGA Local Government Authority
MNC multi national corporation
nec not elsewhere classified
NIEIR National Institute for Economic and Industry Research
OECD Organisation for Economic Cooperation and Development
OHS Occupational Health and Safety
PAC Principal Activity Centres
PRO Public Research Organisation
R&D Research and Development
RDA Regional Development Australia
SEBN South East Business Networks
SEMIP South East Melbourne Innovation Precinct
SEMMA South East Melbourne Manufacturers Alliance
SME Small and Medium Enterprise
SMRDA Southern Melbourne RDA
SMRDAC Southern Melbourne RDA Committee
STRIP (Monash) Science Technology Research and Innovation Precinct
TAFE Technical and Further Education
TCF Textiles, Clothing and Footwear
VA Value Added
VCAMM Victorian Centre for Advanced Materials Manufacturing
VCEC Victorian Competition and Efficiency Commission
Page | 6
1. Executive Summary
This report is about the future of manufacturing in South East Melbourne, source of
around 40 per cent of Victoria‘s manufacturing value added. It looks beyond the
immediate business cycle to identify the issues that, if addressed, can raise the trajectory
of the region‘s manufacturing sector. It was commissioned by the Southern Melbourne
Regional Development Australia Committee in partnership with South East Business
Networks and the South East Melbourne Manufacturers‘ Alliance.
The global manufacturing sector has been reshaped over the last twenty years. Based
on the rapid change in global markets, Australian and Victorian manufacturers would
have been in for a turbulent time even if they had already been well integrated into global
manufacturing markets. As it stands, they have had to face the same changes as their
counterparts while also coping with the specific weaknesses in the structure of
Australia‘s manufacturing sector. These include legacy issues from protection, few large
indigenous manufacturers to pull through small firms, and a long tail of very small firms
with limited capabilities. The appreciation of the dollar and the volatility around it
presents yet another dimension which has some manufacturers overwhelmed.
Modern manufacturing has moved beyond the paradigm of the 1950s and 1960s and,
although it is no longer a large employer of unskilled labour, the manufacturing sector is
a vital part of the economy of South East Melbourne. There are some outstanding firms
in the region which demonstrate that regional manufacturers can take a position in global
markets, be profitable, provide highly skilled and interesting jobs, and lead innovation.
Our assessment is that a regionally-based initiative for manufacturers in South East
Melbourne can improve the prospects for firms in the region. In making this observation,
we note that there are already worthwhile initiatives in place to support manufacturers
through Commonwealth and Victorian government offerings, and those of specialist
regional bodies such as SEBN and SEMMA.
It only makes sense to proceed with a regionally-based strategy if it delivers
opportunities beyond those already in place. We see two obstacles in this regard. First,
to implement a regionally-based strategy will require a level of energy, commitment and
vision. This can only come from manufacturing leaders. Generally, the leaders of the
best firms are involved in regional bodies in only a passive way. Without their authority,
influence and credibility a strategy is unlikely to be well focused and attract interest,
support and resources from stakeholders. We see the absence of top-level industry
leadership as the primary obstacle to proceeding with a strategy. The second and
related issue is that it is not clear which of the several relevant regional bodies would be
the ‗owner‘ and primary driver of the strategy. There would need to be a clear
governance structure around the strategy, recognised and accepted by the main regional
stakeholders. We have proposed that SMRDAC should promote the strategy to
stakeholders and seek resources for its implementation, but the strategy needs to be led
by industry.

Page | 7
Active engagement of leading firms is important not only for the credibility they lend to a
strategy, but because they are potentially a fundamental resource for upgrading efforts.
The best firms will be those which are in contact with international best practice, leading
edge developments and other innovation and market information. While some of this will
be confidential, it is by engaging with other firms that the leaders, often unconsciously,
transmit this knowledge to other regional firms. However, in many cases the linkages
between firms in the region appear weak and so the transmission of knowledge and the
potential for learning is not as strong as it could be. Hollowing out of local manufacturing
supply chains is exacerbating this and increasing the sense of isolation in many firms.
Nevertheless, the project survey shows there is a reasonable base on which to build with
nearly 40 per cent of participants indicating at least one local manufacturer was a critical
supplier to their business. The ideal arrangement is a regional manufacturing community
that is well connected both through market transactions and by participation in
networking and other non-market linkages. The most useful connections are directly
between firms and not through intermediaries, although intermediaries are critical in
making some of the initial connections.
We do not recommend a sector-based strategy. Sectors make less sense in the world of
modern manufacturing as firms bundle services and products, innovate at the
intersection of disparate technologies, and supply many different types of customer and
markets. There is more chance of success in building on the strengths of world class
firms and working with firms around commonalities such as supply chains, markets,
technologies and innovation. There will potentially be many such commonalities and it
will not be possible to be involved in them all.
Many existing activities will fit within the strategy‘s framework. Any additional resources
obtained are likely to be modest. Therefore a clear sense of priorities will be needed.
Without creating difficulties arising from exclusion, we suggest the strategy should focus
primarily on the linkages between world class firms and potential leaders. A primary goal
will be to diffuse knowledge in order to expand insights and lift capabilities of firms
around management and leadership.
Any positive changes to the environment in which firms operate should be supported.
New transport, utilities, broadband and so on all have the potential to impact positively
on the performance of the manufacturing sector in South East Melbourne. However in
the short to medium term, the impact on the locational decisions and viability of existing
businesses will be minor. It does not matter how good the schools, the infrastructure,
the land supply or the tax system might be - if business leaders do not have the skills to
profitably run their business, all else is to no avail. The quality of the regional economic
environment will be of prime significance in attracting new manufacturers to the region
rather than retaining those which are already located here.
We suggest that a regional strategy should be formed around a long term focus on a set
of themes intended to lift the performance of firms. The themes we have suggested are:

Page | 8
Creating and promoting a shared vision of a viable manufacturing sector in South
East Melbourne
Expanding the global outlook for South East Melbourne manufacturers
Encouraging a culture of anticipatory change
Building on the strengths of existing bodies
Leadership and management skills
The themes are inter-related and suggest actions, some of which are a continuation of
existing activities.
Finally, it is important to recognise the business of facilitating change is a hard one.
Firms themselves are responsible for devising their strategies and managing their
businesses. The best incentives they can have is exposure to market forces,
supplemented with knowledge and information to understand what price signals mean. It
is in this latter role that regional and other bodies can be of assistance. Because
resources are limited it is important for these bodies to develop decision-making
arrangements which have the highest chance of reaping positive change. Identifying
and nurturing those firms with the potential to become leaders, introducing and
facilitating linkages between potential leaders, and other leading firms which are sources
of innovation are among the most valuable functions regional bodies can undertake. A
strategy to lift regional manufacturing performance will require a concerted effort which
will extend over many years.

Page | 9
2. Project objectives and methodology
2.1 Objectives
The brief for this project was to develop a strategy to strengthen the manufacturing
sector in South East Melbourne, to help it be more competitive and viable over the
medium to longer term. The focus of the project is on the future. The purpose in looking
at the present is to gain insights and identify trends which could be relevant to the future.
2.2 Defining manufacturing
The Australian Bureau of Statistics (ABS) defines manufacturing as:
The Manufacturing Division in the Australia and New Zealand Standard Industry
Classification (ANZSIC) includes units mainly engaged in the physical or chemical
transformation of materials, substances or components into new products (except
agriculture and construction). The materials, substances or components transformed
by units in this division are raw materials that are products of agriculture, forestry,
fishing and mining, or products of other manufacturing units. Units in the
Manufacturing Division are often described as plants, factories or mills and
characteristically use power-driven machines and other materials-handling
equipment. However, units that transform materials, substances or components into
new products by hand, or in the unit's home, are also included.
Activities undertaken by units incidental to their manufacturing activity, such as
selling directly to the consumer products manufactured on the same premises from
which they are sold, such as bakeries and custom tailors, are also included in the
division. The view excludes manufacturing activities undertaken by private individuals
or organisations whose principal activity is not manufacturing. This is because an
ANZSIC, or industry code, is allocated based on the predominant activity of an
organisation. It is important to understand this difference between manufacturing
activity and manufacturing industry as most of ABS statistics on manufacturing are
based on an industry view.
Manufacturing covers a myriad of inputs, processes and products. It embraces
production of thousands of different types of goods. These range from ships to sugar
to sheep shearing equipment, and from micro circuits to motor vehicles to medicines.
The number and complexity of the processes involved in the production of these
goods varies. The extent of transformation involved in these processes form the
basis of a view of manufacturing which differs from the standard industry, or ANZSIC,
view. Some products are simple primary product manufactures such as flour, cheese,
tanned hides and skins and pig iron. Some are simply transformed manufactures
such as basic metal shapes (billets, coils, ingots), Portland cement, basic organic

Page | 10
and inorganic chemicals (such as caustic soda). Others are moderately transformed
manufactures such as wire rods, metal pipes and tubes, basic glass, soap and
detergents, textile fabrics and tissue paper, while others are elaborately transformed
manufactures such as prefabricated metal buildings, wire products, glassware,
ceramic products, paints, medicines and perfumes.
The degree of mechanisation involved in the production process provides another
view of manufacturing. Manufacturing in Australia covers a wide range of situations
from highly mechanised production lines using robotics to simple mechanical
activities such as soft drink bottling or concrete mixing through to production of fine
jewellery by hand.
This formal definition of manufacturing, which is the basis for the vast majority of the
statistics which describe the sector, is problematic. As we discuss further in Section 3.3,
the trend is towards manufacturers bundling of services with goods and their businesses
being providers of solutions rather than transformers of materials. This makes the
question of what constitutes a manufacturer less clear. Over time many ‗manufacturing‘
firms will find the proportion of their revenue sourced from the activities defined in the
formal definition will decline.
2.3 Defining the region
The region covered in this report is that of the Southern Melbourne RDA. It comprises
ten Local Government Areas (LGAs): Port Phillip, Stonnington, Bayside, Glen Eira,
Kingston, Greater Dandenong, Cardinia, Casey, Frankston and the Mornington
Peninsula.
This area incorporates a significant part of Australia‘s manufacturing sector. There were
6,613 manufacturing businesses in this area in 2009, representing 7.2 per cent of all the
manufacturing businesses in Australia, and 34.8 per cent of all the manufacturing
businesses in Melbourne. While not covered by the Southern Melbourne Regional
Development Australia Committee (SMRDAC), Monash and Knox have strong
commercial links to the South East region. These areas too have a sizeable number of
manufacturing firms that no doubt are involved in significant trade with firms in the formal
Southern Melbourne region.
2.4 Method
The primary determinants of firm competitiveness are the capabilities, systems, plant,
resources, leadership and business model which the firm itself brings to bear in its
activities. Firm competitiveness is also influenced by aspects such as infrastructure,
availability of specialised factors, connections between firms and Public Research
Organisations (PROs), and linkages between firms themselves. Of course beyond those
factors general economic and social conditions, derived from the international economy
Page | 11
and influenced by state and Commonwealth Government actions, are important
elements of the business operating environment.
The project methodology has involved these activities:
Reviewing previous reports and existing material on manufacturing in South East
Melbourne
Identifying global trends shaping manufacturing
Analysing trends in manufacturing in Australia
Preparing a statistical profile of manufacturing in the region
Engaging senior managers in manufacturing firms, either by interview, survey or
workshop, to gauge the key aspects of their strategies for the future. This survey
and interview work focused on industry leaders and so is not intended to be
representative of all the firms in the region
Identifying hard and soft infrastructure issues in South East Melbourne
Analysing this information in the context of past and current policy trends and
bringing the key information obtained above into findings
From these stages we have proposed a strategy to lift performance at the firm level. The
strategy involves five themes that focus primarily on how regional bodies can assist firms
to upgrade and maintain and increase their competitiveness.
2.5 Policy context
The place of manufacturing in the Australian economy continues to attract government
interest, as it has done at numerous stages over the past sixty years.
In March 2011, the Victorian Government announced a review of manufacturing industry
policies. It commissioned the Victorian Competition and Efficiency Commission (VCEC)
to report on the existing program mix and propose priorities for the future. VCEC
published a draft report in June 20111 and presented its final report to Government in
September 2011. The final report and Government response was initially expected in
September 2011 but is not yet public.
The draft report set out a set of principles intended to ensure any interventions produced
a community benefit. VCEC endorsed the concept of moving programs to an
‗intelligence-based‘ approach. The thinking is that the needs of firms should be
assessed on an individual basis and assistance packaged to meet those needs, rather
than being delivered through an inventory of standardised offerings.
It is anticipated that the Government will respond to the VCEC report shortly and it is
possible that there may be opportunities for regional bodies such as SEMMA and SEBN

Page | 12
to obtain resources to pursue initiatives consistent with the strategy articulated in this
report.
The Commonwealth Government also has established a task force to map out a shared
vision for the future of Australia‘s manufacturing sector and to help strengthen local firms
as they adapt to changes in our economy, including the rise of Asia. It will identify a plan
for how best to leverage existing efforts, including government policies and programs, to
capture the opportunities and respond to the challenges facing manufacturing. The
Commonwealth has indicated that it wants to see the sector move up the value chain by
building up its skills and innovation base.
Depending on outcomes, once again there may be opportunities for regional bodies to
obtain resources to take the strategy forward.

Page | 13
3: Manufacturing in a Global Context
Many forces are shaping the global manufacturing sector. Our goal in this section is to
identify and discuss the implications of these.
3.1 Forces shaping the global economy
At the macro-level, four ‗mega-trends‘ are shaping the international economy:
3.1.1 Changing players in the international economy
Rapid economic growth outside western economies is creating new players with
considerable market power. Faster growing economies like Brazil, Russia, China and India
are having a substantial impact on global markets. It estimated that by 2025 India and China
will account for 25-40 per cent of the total world demand for goods and services, displacing
North America and Europe as the major global sources of demand.2 In addition, emerging
economies like Indonesia, Vietnam and the Ukraine are expected to become significant both
as manufacturing locations and consumer marketplaces. Some estimates indicate China‘s
GDP will be larger than that of the US by 2025 and that India will have a larger economy
than the US by 2050.
3.1.2 Rising cost of resources
The cost of resources increases both as stocks diminish. They will also increase as a price
is placed on carbon and together will affect the price of energy, waste, water and carbon-
intensive inputs into production.
Resources will become scarcer as high grade reserves are exhausted. Figures 3.1 and 3.2
below demonstrate that the quality of new finds of oil and other minerals is diminishing. The
implication is that the cost of extraction and refining becomes higher as high grade deposits
are exhausted, which means that the price of resources will rise over time.
Figure 3.1: New discoveries of oil, 1930-1950

Page | 14
Figure 3.2: Quality of discoveries of new deposits of selected ores, 1840-2005
3.1.3 Reach of Information and Communications Technology (ICT).
The pervasiveness of digital technologies and the world wide web have changed forever the
nature of information management and communication. The exponential growth of capacity
in this area is demonstrated by Moore‘s Law, coined in 1965, which proposed that the
number of transistors which could be placed in an integrated circuit would double every two
years. While industry experts expect this trend to slow or reverse by the mid 2010s, the last
fifty years have witnessed an extraordinary expansion of digital technology based on rapidly
expanding capabilities and falling costs.
Figure 3.3: Transistor counts on integrated circuits, 1971-2011
General Trend
Page | 15
3.1.4 Growth of services sector
A fourth factor is the growth of services within economies and the emergence of international
trade in services, facilitated in part by advances in information and communication
technologies. Services are the dominant sector in all OECD economies today, generally
accounting for 65-80 per cent of value added and the proportion of ‗internationally exposed‘
services continues to rise.
3.2 Pressures on the business of manufacturing
3.2.1 Origins of manufacturing organisation
Over the last century, manufacturing evolved based on high volume and mass production.
Products had standard designs and parts were interchangeable. The emphasis was on long
production runs and increasing economies of scale. Large manufacturers of complex
products like vehicles had vertically integrated businesses, processing raw materials at one
end and controlling distribution and marketing channels at the other.
Firm growth was based on increasing volume. Large inventories were used to maintain
material flows and to buffer production in the face of changes in supplier and customer
behaviour. Manufacturers relied on mass markets, but production facilities were primarily
regionally focused.
Production followed a sequential process of product conception, engineering, manufacturing,
marketing, sales, and after sales service. The entire process, together with a variety of
services, was undertaken in stand-alone production facilities. Inside the factory, machinery
and equipment were stationary and heavily reliant on manual labour. Each process had a
limited number of variations.
Organisations ran along Taylorist principles of scientific management. Production flexibility
was gained simply by expanding or contracting production lines, by adding or subtracting
people who were to carry out specific tasks and could easily be replaced. It was the job of
management experts to plan and make decisions, and of workers simply to carry them out.
Static job assignments were given to workers on the shop floor. Each worker was trained for
a small number of tasks and given responsibility for a particular machine, process, or
function along the production line. Tasks were conventional and repetitive. Even in smaller
enterprises, responsibilities were usually clearly divided between management and workers
on one hand, and among workers on the other. Quality was the job of inspectors who
reviewed operations periodically. Performance benchmarks were defined internally, most
commonly by accounting departments. Problems were identified primarily as a result of
customer complaints.
This situation has been revolutionised. The challenges of the global business environment
have made traditional manufacturing increasingly obsolete. More flexible production systems
Page | 16
have emerged together with quality-oriented business practices that aim to serve customers
better and at lower costs.
3.2.2 New customers and changing demands
Emerging markets are creating new sources of rapidly growing demand for products and
services on the part of consumers and businesses alike. At the same time consumer tastes
in established markets are not static, and needs are becoming more specific and at the
same time more diverse. Aging populations, changing life patterns, higher incomes leading
to changes in consumption preferences, immigration and other demographic trends are
opening new markets and closing old ones. Innovation is also driving change in customer
needs and expectations. Demand is for greater variety, better quality, performance and
service, at lower cost.
3.2.3 More stakeholder requirements Manufacturers, and other businesses, must observe a growing set of requirement set not
only by customers but by other stakeholders – the ‗social license to operate‘. They must
deliver returns to their investors and value to shareholders as well as meet responsibilities to
their employees and the communities in which they operate. Manufacturers also have to
respond to more and more stringent requirements set by governments and other regulating
agencies. These rules cover the way companies are run, the nature of their goods and
services and the way they are produced, the health, safety and security of employees and
the public at large, as well as current and future impacts on the environment.
3.2.4 Intense competition
Manufacturers are facing intense competition in their efforts to defend and grow market
shares. Globalisation of markets reaches as far as individual customers through electronic
commerce which provides the ability to source products, services, innovation and
technologies on a global basis. Geographic proximity is diminishing as a competitive
advantage.
The emergence of highly populated and rapidly industrialising economies like China and
India, with relatively low labour costs, has shifted patterns of production across industries on
a global basis and disrupted established production systems.
3.2.5 The pace of innovation and development of new technologies
New and improved products and processes are being brought to market at a more rapid
pace. The application of information and communication technologies has revolutionised
control and information systems in manufacturing. This has allowed more outsourcing,
integration, automation and remote management of production processes. The rate of
change continues to accelerate as a result of new and transformational applications of
software programming, computing and information technologies, biotechnology, micro- and

Page | 17
nano- technologies, new materials, energy technologies, sensors, robotics, and to more
advanced machining, measuring, and automated systems.
Technology is contributing to fundamental changes in the processes of innovation. Some
examples:
‗eScience‘ is being used by companies such as Rolls-Royce to draw on wide ranging
expertise;
Virtual reality is being applied in fashion and clothing industries to improve consumer
choice;
Simulation and modelling is being deployed to predict the effects of products;
Rapid prototyping using 3D printers opens up the prospect of digital fabrication, using
fabrication laboratories to by-pass existing manufacturers3; and
Mixed reality simulation to streamline prototyping such as in the design of the Boeing
787 Dreamliner.4
The pace of innovation has been assisted by growth in production and trade in intermediate
products - that is, products that are designed to be incorporated into or combined with a final
product. So, for example, in the motor vehicle sector it is common to see innovation being
led by component manufacturers – parking sensors, electronic monitoring and control,
lighting, and so on. It is increasingly common for innovation to be outsourced to component
suppliers with their own highly specialised knowledge available for the innovation effort.
3.2.6 Commoditisation and the integration of global markets
Prices of manufactured goods are set in global markets and determined by global supply
and demand. For most manufacturing sectors today, intense competition and excess
capacity are driving down prices, but the cost of raw materials is rising as demand increases
and supply becomes scarcer. The ‗commodity threshold‘ continues to creep up as products,
technologies and features that were previously reserved for premium products and markets
become expected in standard offerings. Base model computers and mobile phones, cars
and other products have all become commodities that manufacturers seek to differentiate
with brands, bundling with services and continual innovation. Production must be highly
efficient for firms to remain relevant.
3.3 Responding to change
Over the last thirty years manufacturers have been moving toward increased flexibility,
higher quality standards, and greater responsiveness to the needs of a larger array of
customer segments.
World-class competitiveness requires product differentiation, flexible and lean production
systems, and supply chains and business networks aligned to deliver value to customers at

Page | 18
competitive costs. Contemporary manufacturing is characterised by innovation and the
ability to make a variety of high value products. The objective is rapid response to variable
and changing customer demands.
3.3.1 Flexible manufacturing
Flexible manufacturing processes are adaptable and reconfigurable for short, low volume
production runs. The emphasis is on process change and product diversification. But
economies of scale are still important. As products become more specialised, manufacturers
have looked to high volume customers and increasingly to international markets to provide
sufficient volumes.
Time has become a key competitive factor, in addition to product costs, quality, and
performance. Manufacturers are reducing human effort in the factory, their stock of
inventories, the space it takes to manufacture, and the time it takes to get products out the
door. Their objective is to cut changeover times from hours to minutes, avoid downtimes for
repair, simplify the information systems that track the flow of materials and industrial
processes, and arrange manufacturing processes into cells that both increase flow
efficiencies and are capable of achieving regularly changing rather than constant production
schedules. Lean management methods are pervasive across manufacturing systems and
help in eliminating waste.
Flexible manufacturing involves minimal inventories. Materials and components are received
and goods supplied just in time, or as required – and manufacturers pay a steep penalty if
they are unable to when they cannot. Processing, fabrication, and assembly technologies
are automated and integrated through computer networks such as in additive manufacturing
or 3D printing. Product differentiation is achieved through design and quality assurance,
logistics and distribution systems, financing and after-sales service and there is a premium
on customer service.
Organisational design in flexible manufacturing is flat with horizontal management methods.
There are complex communication systems to integrate all of the product development,
production, and services functions that go into meeting customer demand. There has to be
direct communication among senior managers, marketing, design, engineering, and
manufacturing operations personnel. In flexible manufacturing systems, communication
systems extend beyond the firm and are integrated across supply chains and business
networks.
Teams of multi-skilled workers are empowered with responsibilities to make operating
decisions, assure quality standards, and solve problems as they arise. On-the-job training is
a necessity to improve technical skills, maintain quality, and increase flexibility.
Quality products, processes, and procedures are essential to meet customer requirements.
Flexible manufacturing requires that quantifiable quality controls apply to all aspects of the
Page | 19
business – from corporate governance to operations and financial management to supply
chains, production, information systems, and preventative maintenance.
The rate of change is increasing exponentially and because of this it is more difficult for
manufacturers to catch up if they have missed earlier waves of change.
3.3.2 Evolution in how manufacturers create value
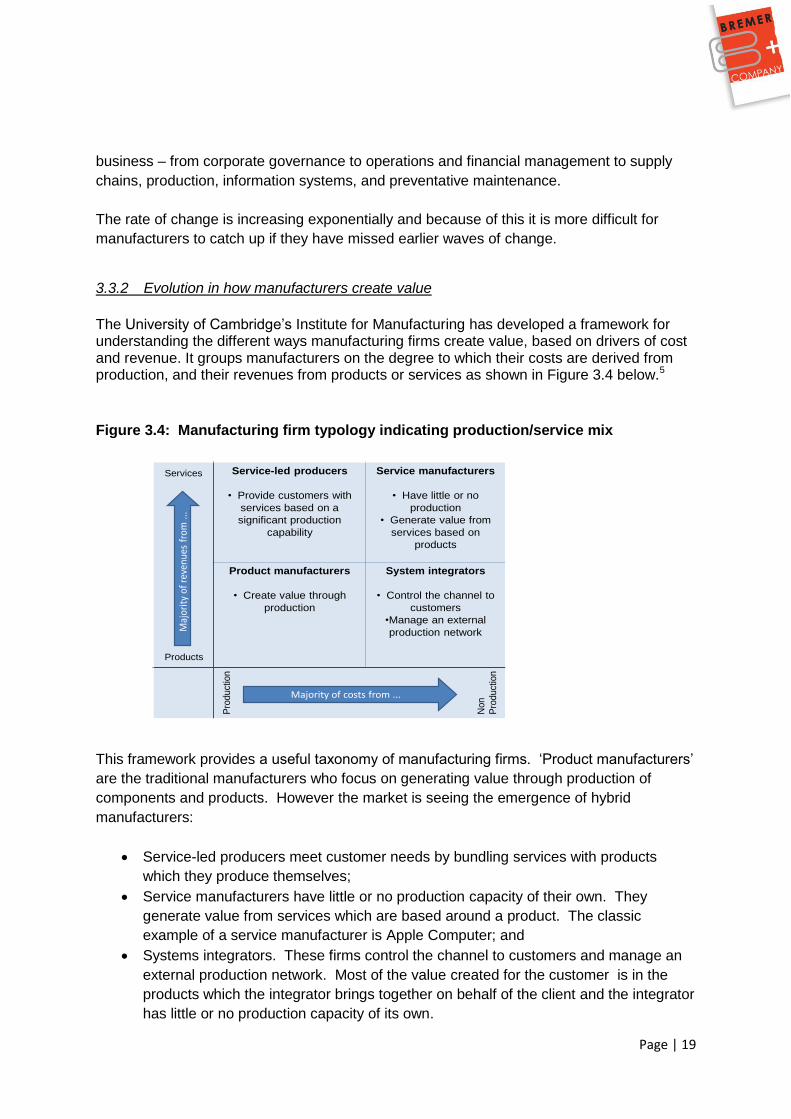
The University of Cambridge‘s Institute for Manufacturing has developed a framework for understanding the different ways manufacturing firms create value, based on drivers of cost and revenue. It groups manufacturers on the degree to which their costs are derived from production, and their revenues from products or services as shown in Figure 3.4 below.5
Figure 3.4: Manufacturing firm typology indicating production/service mix
This framework provides a useful taxonomy of manufacturing firms. ‗Product manufacturers‘
are the traditional manufacturers who focus on generating value through production of
components and products. However the market is seeing the emergence of hybrid
manufacturers:
Service-led producers meet customer needs by bundling services with products
which they produce themselves;
Service manufacturers have little or no production capacity of their own. They
generate value from services which are based around a product. The classic
example of a service manufacturer is Apple Computer; and
Systems integrators. These firms control the channel to customers and manage an
external production network. Most of the value created for the customer is in the
products which the integrator brings together on behalf of the client and the integrator
has little or no production capacity of its own.
Service-led producers
• Provide customers with
services based on a
significant production
capability
Service manufacturers
• Have little or no
production
• Generate value from
services based on
products
Product manufacturers
• Create value through
production
System integrators
• Control the channel to
customers
•Manage an external
production network
Pro
duct
ion
Non
Pro
duct
ion
Majority of costs from ...
Products
Services
Maj
orit
y of
rev
enue
s fr
om ..
.

Page | 20
Services (design, quality assurance, installation, training, financing, after-sales services,
remote monitoring, disposal, etc) can each be distinguishing elements in adding customer
value. To provide these services will often require collaborative arrangements between
manufacturers and services firms such as those in software, IT and electronics.
These developments challenge the traditional notion of a manufacturer as being in the
businesses of the physical or chemical transformation of materials, as outlined in the ABS
definition in Section 2.2. The activities which distinguish a manufacturer are becoming much
less clear. Meanwhile the need to acquire new skills in accessing technology and
collaborating is becoming more urgent.
3.3.3 Customers and markets
Manufacturers will continue to compete on delivering customer value at lower and lower
prices. That will reinforce the trend towards individual products meeting individual needs –
and increase opportunities for packaging of services with products. Competitive cost
structures will be needed to ensure that customisation is commercially viable - the ultimate
goal is the competitive batch of one.
Mass customisation will entail businesses tailoring product functionality, design, and service
to satisfy individual customer requirements, but also making differentiated products at high
speed and in high volume production runs in order to keep unit costs to a minimum. Digital
manufacturing allows a high volume production run of ‗cousin‘ products using the same
feedstock and tooling, with unique customisation of batches of one within the production run.
Manufacturers will have to accelerate flexibility through continuous innovation and shorter
production runs that can accommodate changing and more specialised customer
requirements together with shorter product life cycles.
Mass customisation will require further changes within the business of manufacturing.
Information systems will need to quickly identify customer specifications, turn them into work
orders, and create pull systems throughout supply chains and production processes.
Cost increases can no longer automatically be passed on to customers. Manufacturers
have to focus on delivering customer value at the lowest possible cost, knowing that
customers can source globally. Returns are maximised by meeting new or more specific
customer needs quickly, rather than by increasing production volumes and selling more of
the same product. As noted above, packaging of services with the product can be an
important aspect of strategies to escape the effects of commoditisation.
Page | 21
3.3.4 Manufacturing operations
Customer-pull systems are replacing production-push manufacturing which means systems
can be reconfigured quickly for shorter production runs. Greater variability is allowing for
greater control over product and production defects through quantitative methods of quality
assurance. Processes are more highly automated, controlled and integrated through
advanced information and communication technologies which may also allow remote
operation of plant.
Process efficiency and cost reductions are being driven throughout manufacturing
businesses, from materials handling and production processes to information systems and
supply chain logistics. Time has become the driving consideration in profitability. Companies
are striving to reduce wait times, down times, and the time required for product and process
changeovers.
Strategies for growth are coming to rely on product and process innovation, not simply
adding volume. Consequently innovation is permeating organisations and is understood as
a broad concept, no longer solely as a technical activity, the province of research and
development and engineering departments. Innovation is important on the shop floor, in
purchasing and logistics, in marketing and design, as well as in management systems.
Workers are part of the innovation effort and their work has become more knowledge-
intensive with greater flexibility for individual decision making. Workers need a higher level
of technical skills and experience, so they can engage in problem solving, multi-tasking,
teaming and collaboration.
3.3.5 Organisation of production: Global supply chains
Manufacturers are increasingly serving customers around the globe and are restructuring
their operations, production systems, and supply chains to achieve this. They will continue to
seek the rapidly expanding markets of emerging economies. E-business technologies will
allow manufacturers to connect anywhere at any time with customers around the world. In
Australia the national broadband is expected to provide a platform for significant expansion
in the use of digital technologies by manufacturers across a wide range of business
functions.
As market reach expands, production and services will be sourced on a global basis to take
advantage of the best skills, technologies, and cost structures. This will allow firms to
increase their profit margins while offering customers higher value at lower price.
In the classic integrated manufacturing businesses of the early twentieth century, such as
the Ford Motor Company, most of what was needed was produced by the company. At one
stage Ford produced its own steel and owned its own forests. However, over time integrated
production has evolved into systems with tiers of suppliers with their own supply chains and
value networks. With globalisation, specialisation, and advances in information technology,
Page | 22
supply chains stretch internationally and are intermingled, with firms participating in many
supply chains. Where once firms competed with each other, now it is supply chains that
compete and innovation takes place at all it levels and stages. Companies are participating
in consortia, strategic alliances, and joint ventures to leverage their resources and expertise
and create opportunities for new product and market development.
While larger businesses are expanding their operations around the world, at the same time
they are consolidating investment in research, design, engineering, and other key decision-
making functions in one or only a few locations. Few if any Australian owned-firms are large
―primes‖. The vast majority of Australian manufacturers are either in the lower reaches of
the supply chain or have relatively small niche positions in markets for consumer products.
In global production, Australian manufacturers need to move from supply chains oriented
toward the Australian market to global supply chains.
3.3.6 Computer integrated manufacturing
The manufacturing systems of the future will embody the intelligence of advanced software
applications, modelling and simulation capabilities. They will be built around integrated
systems of human and artificial intelligence – allowing for the specification, communication,
and technical translation of exact customer expectations; the application of machine
intelligence, expert systems, and neural networks in production; and the design,
coordination, and integration of complex production, logistics, and business systems. Future
production systems are being planned on the basis of virtual engineering and virtual
factories: Computer automated technologies are allowing manufacturers to combine design,
engineering, testing, scheduling, production, maintenance, quality assurance, services, and
supply chain management into single processes. Manufacturing capabilities will then depend
on the efficient management of information and the rapid translation of that information into
production systems.
The ‗factory‘ will become an information network. Customers will participate in the design
and testing of products in accordance with their specific needs. Virtual reality will play a key
role in permitting customer participation in design and engineering. Intelligent equipment,
sensors, robotics, and smart materials will help to control quality and process flows.
Customer requirements will be communicated to computer-integrated and mobile machining,
processing, and material delivery systems. Computer integrated factories will allow for
machines and production cells to automatically reconfigure themselves on the production
floor in response to new orders or new product variations. Purchasing and scheduling will
take place automatically as orders are received. Machines will be capable of producing a
wide variety of products and parts. Fully automated systems will allow for continuous ―lights-
out‖ production, and people will be employed to maintain, program, schedule, and plan
processes of change. Virtual engineering processes will integrate simulation, modelling,
analysis, testing, diagnostic, and analytical technologies in design, production, and control
functions affecting all aspects of manufacturing.

Page | 23
Manufacturers will be able to control, repair, and service their products remotely. Smart
engineering systems will increase the degree of flexibility and speed up cycle times
significantly. They will integrate and simplify manufacturing processes. They will be the key
to making customisation commercially viable.
ICT and related technologies have provided the capabilities that make flexible, automated
production systems, global supply chains, and global customer reach possible. New
applications of information and communication technologies will continue to revolutionise
manufacturing activity, including the use of advanced modelling and simulation, artificial
intelligence, digital imaging, high density data storage, and virtual reality.
3.3.7 New Enabling Technologies
Other advanced technologies will also transform future manufacturing capabilities, including:
Biotechnology and genetics. Manufacturers are already working with biomaterials,
creating bio-products, and using bio-processes as a result of advances in the science
of genomics.
Nano-technology. Molecular engineering is allowing manufacturers to build things
from their most basic atomic structures up.
Micro-machining. Techniques that exist for producing devices and mechanical parts,
whose size can be measured in microns, will enable greater precision, sensitivity,
and flexibility in micro production processes.
Metrology. Advanced measurement systems will allow for greater precision in
production and process control.
Mechatronics. Systems that integrate sensors, actuators, and control functions in one
intelligent system will improve product precision, performance, efficiency, and ease of
use.
New materials. The development of new materials from bio-materials and advanced
polymers, to light weight composites and superconductive materials are providing
manufacturers with a capacity to develop new and improved products and processes
that can get the job done better for customers at much lower costs.
Smart Materials. Smart materials change shape, colour, form, phase, electric and
magnetic fields, temperature, optical qualities, and other characteristics in response
to external stimuli. Designers will be able to use smart materials to set new standards
in meeting customer needs, as well as simplify products, add features, reduce
material use, and lower the expense of product specialisation. Future smart materials
will be capable of self-diagnosis, repair, and learning.
Fuel Cells and Alternative Energy. Hydrogen fuel cells, solar energy, and nuclear
applications will be used in products and processes as alternative energy sources.
Integrated technologies. Future manufacturing capabilities will be expanded even
more by the integration of these technologies.

Page | 24
3.4 Innovation in business models
Advances in electronics, information and communication technologies, computing
capabilities, software programming, and e-business networks are already revolutionising the
business of manufacturing. While drivers of production technology are important, perhaps
the more significant change is in the manufacturing business model itself.
Business models are the ‗recipe‘ of how a firm plans to generate and capture value – the
firm‘s value proposition, the customer segments it targets, the distribution channels it uses,
how it generates sales, its systems to control costs and how it configures its resources. For
many years manufacturers were able to work within a static business model. But all the
developments outlined earlier require revision of business models, sometimes
fundamentally. The ability to reinvent the business to exploit new technologies, changes in
supply chain arrangements, e-commerce and new channels to customers all point to the
need to be able evolve the firm‘s business model. In many cases this will involve the
acquisition of new capabilities and competencies.
3.5 Implications of technological developments for manufacturers in South East
Melbourne
As illustrated above the implications of these technologies are expected to be pervasive,
touching most aspects of modern life. The impacts on manufacturers in South East
Melbourne will vary, depending on the sectors they operate in. Developments in
biotechnologies, for example, may have a greater effect on food and beverage producers
than on a manufacturer of air circulation equipment for commercial buildings, although even
this cannot be certain with biotechnologies having increasing application in air and water
filtration systems.
Perhaps the broadest impact on manufacturing in South East Melbourne over the next
decade or so will come from a cluster of technologies known as Cleantech. The application
of these technologies is driven by resource constraints (raw materials, energy and water),
community concerns about pollution, and associated policy instruments such as carbon
pricing, waste disposal charges, and recycling legislation (return, recycle, re-use).
Cleantech technologies are expected to affect the way goods are made, the materials used
in manufacturing, the way goods are distributed and sold, and just as importantly the way the
goods are perceived and used by the purchasers, as well as the way they are disposed of.
Energy in particular has a pervasive impact. Energy efficiency is a driver in transport and in
buildings as well as in manufacturing processes. Building design, materials, equipment and
techniques are being pushed by the thermal properties of construction materials in striving
for reduced energy consumption and smaller carbon footprints. Lightweight materials, such
as composites and light metals, are driving change in the manufacture of transport
components. Low emission, energy efficiency and alternative fuels are accelerating
changes in vehicle powertrain systems – from combustion systems, to hybrid vehicles, to
hydrogen and fuel cells, to electric and battery operated vehicles. However, these changes

Page | 25
are occurring at a global scale and only manufacturers who are both technologically
advanced and enjoy a high echelon position in the automotive value chain can expect to
participate in and benefit from these developments. Smart materials, deploying
nanotechnologies, with the capacity to transform themselves and perform a range of
functions, are also expected to be significant in industries as diverse as clothing and textile
products, fine chemicals, surface finishes and coatings, pharmaceuticals and personal
healthcare, building materials, printing and packaging, and transport.
Digital technology is another technology grouping with the potential to transform South East
Melbourne manufacturers. Much of the discussion earlier in this section was on the
combined impact of these technologies and other technologies to trigger changes in the
production processes and the products produced. What is less well understood is that digital
technologies will enable small and medium (SME) manufacturers in South East Melbourne
to transform downstream processes such as delivering high value services and moving up
the value chain. In effect broadband opens the possibility for manufacturers in South East
Melbourne of competing more effectively and extending their reach into international
markets. It is expected to enable them to leverage changes in areas like the business model
(new product offerings - value add services and customer solutions), administration,
customer relationships (sales and marketing), and managing assets and resources.

Page | 26
4: Manufacturing - the Australian Context
In Section 3 we reviewed the key drivers shaping manufacturing on a global basis. This
section is concerned with outlining the underlying trends in Australia‘s manufacturing sector.
This provides the backdrop to consider manufacturing in South East Melbourne.
4.1 Performance of Australia’s manufacturing sector
At the end of 2008-09 there were 91,400 manufacturing businesses in Australia, a three per
cent decline over the previous financial year6. These 91,400 manufacturing businesses
represent about 4.5 per cent of the total 2,050,000 businesses operating in Australia at that
time.
It‘s common to talk of the ‗decline‘ of manufacturing in Australia. It is true that measured as
a proportion of Gross Domestic Product (GDP), manufacturing output peaked in the late
1960s and early 1970s at around 30 per cent of industry value added. However, since then
manufacturing output has continued to grow, but at a lower rate than that of other sectors. It
is this pattern – relatively slower growth of manufacturing, rather than absolute decline -
which drives the change in position of manufacturing in the Australian economy. Chart 4.1
below shows the output of the manufacturing and mining sectors since 1991. Aside from the
disturbance in 2009 from which the sector is still recovering, manufacturing output continues
to increase, up by about 30 per cent over the last twenty years.
Chart 4.1
While output from the manufacturing sector continues to increase, the slower growth with
respect to services and, more recently, mining, means that its relative importance has
declined. Services sector output has come to account for nearly 80 per cent of industry
value added, as shown in Chart 4.2 below which traces contributions to value added from
1991 to the present.

Page | 27
However it should also be noted that changes in production systems means that data
collections tend to understate the overall contribution of manufacturing. As businesses have
become more specialised and focused on core competencies they have outsourced various
activities. This is true in manufacturing as much as elsewhere and so activities which are
now outsourced – for example, logistics, some office functions, specialised technical inputs –
are counted as services outputs where previously they were included as manufacturing
value added because they were performed ―in-house‖.
Chart 4.2
Chart 4.3 shows a similar pattern in terms of employment in the various sectors.
Manufacturing employment has declined from around 14 per cent of the workforce in 1991 to
around 8.5 per cent today. Services employment has increased from around 79 to 86 per
cent, mining has increased to 2 per cent, and, like manufacturing, agriculture has fallen from
5.5 to 2.8 percent.
In absolute terms, the pattern of the past twenty years has been that around 1 million people
have been employed in the manufacturing sector, as shown in Chart 4.4 below. This
number has fallen away after the global financial crisis and it remains to be seen whether
these jobs will be recovered by the manufacturing sector, or the labour will be permanently
transferred to services and mining. Employment in the services sector has grown from
around 6 million people to nearly 10 million over this time.

Page | 28
Chart 4.3
Chart 4.4
Table 4.1 below aggregates this data and provides a measure of overall sectoral productivity
as a ratio of the percentage of industry value added divided by the percentage of
employment for each sector (VA/Emp) for 1991 and 2011. The table shows a small increase
in the sectoral productivity of manufacturing, and a large increase in the productivity of the
agricultural sector. Productivity of the services sector remains constant and there is,
interestingly, a decline in productivity in the mining sector.

Page | 29
Table 4.1: Composition of employment and industry value added, Australia, 1991-
2011
1991 2011
% Emp %VA VA/Emp % Emp % VA VA/Emp
Agriculture 5.5 2.5 0.5 2.8 3.2 1.1
Mining 1.2 11.5 9.6 2.0 10.0 5.0
Manufacturing 13.8 14.7 1.1 8.5 10.0 1.2
Services 79.4 71.0 0.9 86.3 77.2 0.9
Source: Bremer+Company based on Thomson Reuters Datastream
Chart 4.5 below provides another dimension on productivity performance. The chart shows
the value added created for each dollar spent on labour in Victorian manufacturing against a
dollar spent on labour in the Australian mining sector. Over the last ten years, each dollar of
labour in Victorian manufacturing is associated with value added of around $1.80 to $1.90.
The same dollar spent in mining is associated with value added of between $4.00 and $6.50.
This demonstrates the power of the mining sector in being able to pull resources from other
sectors, and its capacity to pay higher wages.
Chart 4.5: Value added generated by a dollar of labour input – Victorian
manufacturing and Australian mining

Page | 30
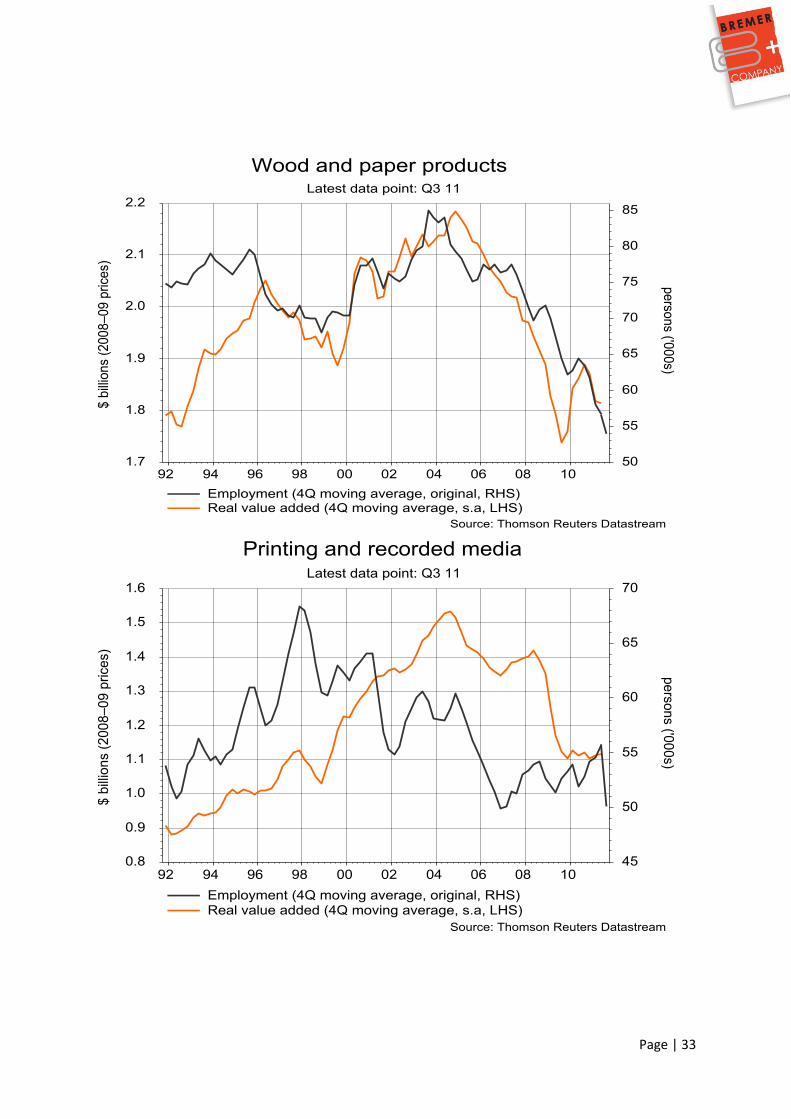
4.2 Performance of manufacturing sub-sectors
Table 4.2 below summarises the performance of the primary manufacturing sub-sectors from
1991 to 2011. Data for each sub-sector is shown in Charts 4.6 – 4.13 on the following
pages. Unfortunately the data is highly aggregated, which masks a richer and more
interesting picture of the dynamics within each sub-sector. The data shows that value added
in all sectors expanded, except Textiles, Clothing and Other Manufacturing (largely furniture)
which contracted by about half. Growth in Wood and Paper Products was very small.
The sectors with the largest proportional growth were Non-metallic Mineral Products –
largely building materials, followed by Equipment and Machinery and then Metal Products.
In terms of employment, the only sector with growth was Food, Beverage and Tobacco
manufacturing. The largest falls were in Textiles, Clothing and Other Manufacturing, Non-
metallic mineral products and Wood and Paper.
An important measure is Value Added per employee, which gives an indication of the overall
productivity of each sub-sector. The sector with the highest value added is Petroleum, Coal,
Plastics and Rubber, which tend to be characterised by capital intensive operations with high
throughput. Next is Metal Products, followed by Non-metallic Mineral Products. Over the
twenty year period under review, the sub-sectors with the greatest increase in value added
per employee are Non-metallic Mineral Products (up 161 per cent), Machinery and
Equipment (up 82 per cent) and Metal Products, up 78 per cent. These are also the sectors
with the largest proportional growth, as noted above. However it does not follow that
workers displaced from one sector can automatically move to another as the skill
requirements are unlikely to be similar, aside from any locational issues.
The data illustrates the differing performance of the various sub-sectors. Further on in the
report we discuss the importance of avoiding dealing with the manufacturing sector as a
homogeneous set of firms. While some issues in the economic environment impact in
similar ways across the sub-sectors, different drivers are shaping performance in each. The
trajectories and prospects of the sub-sectors differ. And even within declining sectors such
as Textiles, Clothing and Other Manufacturing, firms can be found with performance which
runs against the sectoral trend. These firms are not lucky. They have strategies which
capitalise on the evolving realities of the market place together with management and
operational capabilities to continue delivering value to the customer.

Page | 31
Table 4.2: Australian manufacturing employment and value added, 1991-2011
Emp 1991
Emp 2011
% Change
VA 1991
VA 2011
% Change
VA/worker 1991
VA/ worker 2011
% Change
000s 000s $b $b
Food, beverage and tobacco 184 229 24% 4.15 5.65 36% $ 22,554
$ 24,672
9
Textiles, clothing and other manufacturing
178 96 -46% 2.1 1.05 -50% $ 11,798
$ 10,938
-7
Wood and paper products 75 54 -28% 1.79 1.82 2% $ 23,867
$ 33,704
41
Printing and recorded media 54 50 -7% 0.9 1.1 22% $ 16,667
$ 22,000
32
Petroleum, coal, chemical and rubber 98 86 -12% 4.2 5 19% $ 42,857
$ 58,140
36
Non metallic mineral products 54 37.5 -31% 0.76 1.38 82% $ 14,074
$ 36,800
161
Metal products 185 149 -19% 4.4 6.3 43% $ 23,784
$ 42,282
78
Machinery and equipment 239 206 -14% 3.5 5.5 57% $ 14,644
$ 26,699
82
1067 907.5 21.8 27.8
Source: Bremer+Company, based on Thomson Reuters Datastream

Page | 32
Page | 33

Page | 34

Page | 35
Page | 36
Two other aspects of Australia‘s manufacturing sector bear consideration – the level of
technology, and firm size.
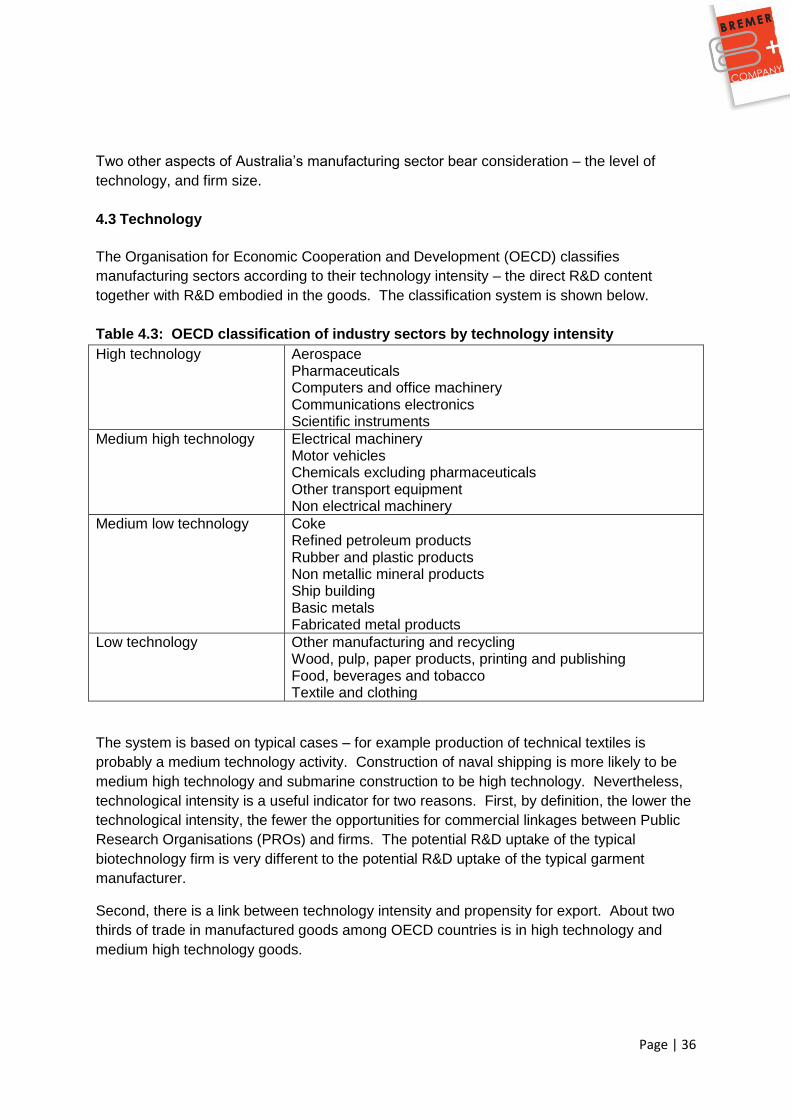
4.3 Technology
The Organisation for Economic Cooperation and Development (OECD) classifies
manufacturing sectors according to their technology intensity – the direct R&D content
together with R&D embodied in the goods. The classification system is shown below.
Table 4.3: OECD classification of industry sectors by technology intensity
High technology Aerospace Pharmaceuticals Computers and office machinery Communications electronics Scientific instruments
Medium high technology Electrical machinery Motor vehicles Chemicals excluding pharmaceuticals Other transport equipment Non electrical machinery
Medium low technology Coke Refined petroleum products Rubber and plastic products Non metallic mineral products Ship building Basic metals Fabricated metal products
Low technology Other manufacturing and recycling Wood, pulp, paper products, printing and publishing Food, beverages and tobacco Textile and clothing
The system is based on typical cases – for example production of technical textiles is
probably a medium technology activity. Construction of naval shipping is more likely to be
medium high technology and submarine construction to be high technology. Nevertheless,
technological intensity is a useful indicator for two reasons. First, by definition, the lower the
technological intensity, the fewer the opportunities for commercial linkages between Public
Research Organisations (PROs) and firms. The potential R&D uptake of the typical
biotechnology firm is very different to the potential R&D uptake of the typical garment
manufacturer.
Second, there is a link between technology intensity and propensity for export. About two
thirds of trade in manufactured goods among OECD countries is in high technology and
medium high technology goods.

Page | 37
4.4 Firm size
Australian firms generally, and manufacturing firms in particular, are small in comparison
with foreign counterparts. Fortune‘s Global 5007 ranks the world‘s largest corporations
based on revenue – admittedly an indicator of limited utility. The 2011 list includes nine
firms which are listed on the ASX. The largest – Rio Tinto (which is also listed in London
and New York) ranks at 140 by revenue. The list includes the other big miner – BHP (159),
the conglomerate Wesfarmers (183), retailer Woolworths (184), financial services
Commonwealth Bank of Australia (249), Westpac (254), National Australia Bank (266) and
Australia New Zealand Bank (338) and telecoms firm Telstra (441). Around one third of the
firms on the global list are manufacturers.
Another perspective can be obtained from company listings on the ASX. In the top 100 firms
there are 15 manufacturers (soon to be 14 with the takeover of Fosters Group), as shown in
Table 4.4 below. The largest manufacturer, ranking at 14th in terms of market capitalisation,
is CSL, with a market capitalisation of around $16b. None of these firms has its
headquarters in South East Melbourne and only Bluescope (presently) has a manufacturing
operation there.
Table 4.4: Manufacturing firms in ASX Top 100 by capitalisation, 4/10/2011
Ma
rket
cap
italizati
on
04/1
0/2
011
Ran
k
04/1
0/2
011
Secto
r
Reg
iste
red
off
ice
CSL $15.7b 14 Biotech / pharma Melbourne
Orica $8.7b 26 Chemicals / explosives Melbourne
Fosters Group $10.2b 20 Beverages Melbourne
Amcor $8.3b 27 Packaging Melbourne
Coca Cola Amatil $9.0b 25 Beverages Sydney
Resmed $4.6b 46 Therapeutic devices Sydney
Cochlear $2.7b 71 Therapeutic devices Sydney
Boral $2.4b 78 Building materials Sydney
Caltex $2.9b 66 Petrochemicals Sydney
Campbell Bros $2.7b 70 Chemicals (and services) Brisbane
OneSteel $1.7b o/s Materials - steel Sydney
UGL $1.9b 93 Transport equipment Sydney
James Hardie $2.4b 77 Building materials Sydney
Mesoblast $2.2b 83 Biotech / pharma Melbourne
Bluescope $1.4b o/s Materials - steel Melbourne
Treasury Wine $2.5b 75 Beverages Melbourne
Ansell $1.7b 99 Latex – health sector products Melbourne
In contrast, 39 of the top 100 stocks listed on the New York Stock Exchange are
manufacturers, or in some cases conglomerates with manufacturing operations. The

Page | 38
dominant sectors in the ASX 100 are services firms, particularly financials, resources and
retailers.
The composition of the two stock exchanges reflects the relative specialisations in both
economies.
There are, of course, many foreign owned manufacturing firms operating in Australia that are
not listed on the ASX, as well as some privately held companies.
The significance of firm size relates to capabilities and, from a policy perspective, what can
reasonably be expected of the firm. The positive competitive aspect of small firms is that
they can be nimble, opportunistic operators, quickly able to change course and capture new
opportunities as they emerge. The converse is that smaller firms have fewer specialised
resources. They are good at solving problems on an ad hoc basis, but their weakness is
they tend not to be strategic. Systematic approaches to enterprise development are not
typical. While small firms can innovate and improvise a fix to an immediate need, this
product or service will rarely be the best in class, able to be sold globally. And even if it is,
the small firm may not recognise the potential and is unlikely to have the internal expertise or
the global connections to capitalise on the opportunity.
In Section 5, our profile of manufacturing firms in South East Melbourne shows around 80
per cent of firms in the region have a turnover of less than $2m. Of the 6500 or so
manufacturing firms in the region, there are only around 160 firms with a turnover of more
than $20m.
4.5 Demand side issues
The dynamics of Australia‘s manufacturing sector are not driven solely by supply-side
issues. Potentially most important is income effects – as incomes rise, a lower proportion of
income is spent on clothing and food and more is spent on discretionary services. In other
words there has been a structural shift to services as incomes have risen.
4.6 Implications for manufacturers in South East Melbourne
In reviewing trends in Australia‘s manufacturing sector, perhaps two issues stand out.
First, and most importantly, is the legacy of the pattern of industrialisation in Australia. This
pattern is a smattering of world-class firms and a long tail of often family-owned businesses
which may have once been able to prosper in an environment which was sheltered from
intense competition – either by border protection or by the geographic proximity. In a
globalised world many of these firms do not have the strategies, innovative capacity or skills
to evolve and survive.
Second is the pattern of restructuring in manufacturing over the last twenty years. Output in
the Wood and Paper, Printing and Recorded Media, Chemicals and Plastics, Textiles,

Page | 39
Clothing and Other Manufacturing are on clear downward trajectories. Output in Metal
Production, Machinery and Equipment, Food and Beverage and Non-metallic Mineral
Production is on an upward trend. It is important to recognise that trends at a sector level
may point to issues in training and skills, supply chains etc. However a declining sector can
still have some thriving firms – for example in Textile and Clothing where there are examples
of manufacturers of technical textiles and branded clothing performing well. These
businesses are usually characterised by a high level of innovation. Similarly, although metal
production is growing, there are many metal fabrication businesses which appear to
struggle.
The point is that as part of Australia‘s manufacturing sector, firms in South East Melbourne
are caught up in the overall national and global trends. Understanding these will help in
devising strategies for firms in the region.
Page | 40
5: Manufacturing in South East Melbourne
In this section we turn to specific data and information on manufacturing firms in South East
Melbourne. It is based on a number of sources including analysis of ABS data, engagement
with local firms through interviews, survey and workshops and review of existing material on
manufacturing in the region.
5.1 Characteristics of manufacturing in South East Melbourne
The characteristics of manufacturing firms across South East Melbourne are described in
detail in the accompanying report Profile of Manufacturing in South East Melbourne. The
data in this section is drawn from that report.
5.1.1 Importance of manufacturing in South East Melbourne
Nearly 44 per cent of all manufacturers in the region are located in the LGAs of Kingston and
Greater Dandenong, with an even split in the numbers between those two LGAs. The
adjoining LGA of Casey accounted for a further 12 per cent of manufacturing businesses.
The bulk of the manufacturing businesses in South East Melbourne are very small. In 2009,
of the 6,613 manufacturing businesses in the LGAs of the Southern Melbourne RDA
(SMRDA), only 1,190 (or 18 per cent) had turnovers of $2 million or more. That is, the bulk
of the manufacturing businesses in South East Melbourne were very small. Only 162 (2.4
per cent) had turnovers of $20 million or more, and 33 (0.5 per cent) had turnovers of $50
million or more.
From a strategy perspective, the size of firms is an important consideration. Generally
smaller firms will be preoccupied with the issues of small business management and will
have limited management skills, and capability to innovate and deliver sustainable high
growth, although there will be exceptions. Understanding the distribution of firms by their
size is therefore an important aspect of this project.
Chart 5.1 below shows the proportion of manufacturing in each of the statistical divisions in
SMRDA (in some cases these aggregate the LGAs mentioned above, with ABS data not
being disaggregated to the LGA level). Intensity of total manufacturing refers to the
proportion of manufacturing firms among all firms in the areas identified. Manufacturing
intensity $2m+ refers to the proportion of manufacturing businesses with a turnover greater
than $2m pa, in both cases using 2009 data.
Across the region, the largest proportion of manufacturing businesses against all businesses
is in the City of Greater Dandenong with about 13 per cent, followed by the City of Frankston
with about 7 per cent. Inner Melbourne has the lowest proportion of manufacturing
businesses.

Page | 41
The areas with the highest proportions of larger manufacturing businesses (turnover greater
than $2m) are the City of Greater Dandenong (just over 30 per cent of all its manufacturing
businesses), followed by the City of Frankston (19 per cent) and Southern Melbourne
statistical division (Kingston, Bayside, Glen Eira and part of Stonnington), with about 17 per
cent.
Chart 5.1: Manufacturing intensity - % of Businesses in Manufacturing, 2009
Source: Australian Bureau of Statistics, Counts of Australian Businesses, [data available on request].
Chart 5.2 below shows the spatial distribution of the 1,190 manufacturing businesses with
turnovers of $2 million or more. Noting the logarithmic scale, the chart shows that these
businesses are markedly concentrated in Greater Dandenong (36.8 per cent) and Kingston
(26.9 per cent), with the remaining businesses being fairly evenly distributed among the
other eight LGAs. Glen Eira and Cardinia have the lowest proportion of manufacturing
businesses with turnover greater than $2m.
0%
5%
10%
15%
20%
25%
30%
35%
Intensity of Total Manufacturing
Manufacturing Intensity ($2m+)

Page | 42
Chart 5.2: Number of Manufacturing Businesses, 2009
(ABS Cat. No.: 8165)
Of the 6613 manufacturing businesses in the SMRDA in 2009, only 162 (or 2.4 per cent) had
turnovers of $20 million or more. The green bars of the chart present the spatial distribution
of these. Over 46 per cent of these larger manufacturing businesses were in Greater
Dandenong, with a further 20 per cent in Kingston. The next largest LGA in this category of
manufacturing businesses was Port Phillip, with 11 per cent.
Of the total manufacturing businesses, only 33 (or 0.5 per cent) had turnovers of $50 million
or more. Turning back to Chart 5.2, the purple bars show the LGAs in which those
businesses are located. The LGAs of Greater Dandenong and Kingston share 24 of those
businesses (73 per cent) between them, with Casey and Port Phillip accounting for 6 and 3
manufacturing businesses respectively. No other LGAs record firms in this category.
Diagram 5.1 below provides this data in map format, including the LGAs of Monash and
Knox.
1
10
100
1000
10000 Total
Turnover of $2m+
Turnover of $20m+
Turnover of $50m+
Log
scale

Page | 43
Diagram 5.1: LGAs in South East Melbourne with distributions by firm size measured by turnover
KEYLocal Gov Authority
No of manufacturing firmsRank among SE Melb LGAs
BAYSIDEAll firms 361 Rank 9
$2m+ 60 Rank 8
$20m+ 9 Rank =4
$50m+ 0 Rank n/a
PORT PHILLIPAll firms 405 Rank 8
$2m+ 63 Rank 8
$20m+ 18 Rank 3
$50m+ 3 Rank 4
STONNINGTONAll firms 408 Rank 7
$2m+ 63 Rank = 8
$20m+ 0 Rank n/a
$50m+ 0 Rank n/a
FRANKSTONAll firms 546 Rank 5
$2m+ 72 Rank 4
$20m+ 6 Rank =6
$50m+ 0 Rank n/a
GLEN EIRAAll firms 458 Rank 6
$2m+ 30 Rank 9
$20m+ 3 Rank = 8
$50m+ 0 Rank n/a
GREATER DANDENONGAll firms 1422 Rank 2
$2m+ 438 Rank 1
$20m+ 75 Rank 1
$50m+ 12 Rank =1
MORNINGTON PEN.All firms 553 Rank 4
$2m+ 36 Rank 8
$20m+ 3 Rank = 8
$50m+ 0 Rank n/a
CASEYAll firms 772 Rank 3
$2m+ 90 Rank 3
$20m+ 9 Rank =4
$50m+ 6 Rank 3
CARDINIAAll firms 264 Rank 10
$2m+ 18 Rank =5
$20m+ 6 Rank =6
$50m+ 0 Rank n/a
KINGSTONAll firms 1424 Rank 1
$2m+ 320 Rank 2
$20m+ 33 Rank 2
$50m+ 12 Rank =1
No manuf firms turnover > $2mNo manuf firms turnover >$20m
No manuf firms turnover > $50m
STONNINGTONAll firms 408 Rank 7
$2m+ 63 Rank = 8
$20m+ 0 Rank n/a
$50m+ 0 Rank n/a
KNOXAll firms 1190
$2m+ 228
$20m+ 21
$50m+ 3
MONASHAll firms 866
$2m+ 183
$20m+ 27
$50m+ 3

Page | 44
5.1.2 Industry profile
Across the region overall, the sub-sectoral profile is similar to that for manufacturing in
Victoria as a whole – which is not surprising given the large proportion of Victorian
manufacturing based there.
Chart 5.4 below shows the breakdown of the region‘s manufacturing businesses by the type
of manufacturing they are involved in. The industries with the largest number of businesses
are:
Fabricated Metal Products (13.0 per cent of the total number of manufacturing businesses),
Machinery and Equipment (13.0 per cent),
Textile, Leather, Clothing and Footwear (11.8 per cent), and
Food Products (10.5 per cent).
Chart 5.4: South East Melbourne, manufacturing businesses by sub-sector
Source: Australian Bureau of Statistics, Counts of Australian Businesses, [data available on request].
0
200
400
600
800
1000
1200

Page | 45
5.1.3 Sub-region characteristics Looking at the areas within South East Melbourne:
Greater Dandenong has a very significant position in the South East Melbourne region‘s manufacturing profile. While it is marginally pipped by Kingston in the total number of manufacturing businesses, it has a leading position in the number of larger manufacturing businesses. It is the location of around 37 per cent of manufacturers with turnovers of $2 million, and 46 per cent of manufacturing businesses with turnovers of $20 million or more. In the $50 million plus category, it ranks equally with Kingston (36.4 per cent). In terms of sub-sectoral distribution, the most notable features of Dandenong are its relatively higher concentration of firms concerned with metal fabrication and the much smaller presence of printing firms in comparison to the state distribution.
Southern Melbourne statistical division, including Kingston, Bayside, Glen Eira and parts of Stonnington. Kingston is the other significant location of manufacturing in the region. It adjoins Greater Dandenong and is part of a road and transport axis emanating from the centre of Melbourne. It holds a major position in terms of all manufacturing businesses in the region, and in relation to all of the turnover ranges. However, its relative position diminishes in the more that $20-50 million turnover range, but returns in the over $50 million turnover category. Bayside: has a remarkably uniform share of manufacturing businesses (5 to 5.6 per cent), irrespective of whether all manufacturing businesses, those with turnovers of $2 million or more, or with turnovers of $20 million or more are considered.
Glen Eira: has nearly 7 per cent of the region‘s manufacturing businesses, but most are very small, and its significance diminishes as larger turnover businesses are considered. Stonnington: has over 6 per cent of the region‘s manufacturing businesses, but none of those businesses has a turnover of $20 million or more. It is the first LGA to drop out of the analysis as the turnover of businesses considered increases. In terms of sub-sectoral distributions in Southern Melbourne statistical division, there is a slightly higher proportion of manufacturers involved in the production of machinery and equipment in this area compared to the SMRDA region overall.
South Eastern Outer Melbourne, which includes Cardinia and Casey. Cardinia: has the smallest proportion of businesses in manufacturing of any of the LGAs. However, its proportion at the $20 million plus turnover level is identical to Frankston‘s, that is, below the average for the region, but near the middle of the pack.
Casey: slips under the radar somewhat in terms of its representation in the region‘s manufacturing industry. While it accounts for nearly 12 per cent of all manufacturing

Page | 46
businesses in the region, its representation falls in the categories as turnover increases, until the $50 million plus category, when it jumps to over 18 per cent. In this largest category, it comes in third behind the major manufacturing centres of Greater Dandenong and Kingston. Geographically, it adjoins Greater Dandenong and is an extension of the transport axis beyond Kingston and Greater Dandenong. Manufacturing in the South Eastern Outer Melbourne area is notable for its relative strength in fabricated metal products.
Port Phillip: ranks third last, out of the ten LGAs, in terms of the total number of manufacturing businesses in the South East Melbourne region. However, it ranks third out of the ten LGAs in terms of manufacturing companies with turnovers of $20 million plus, and it is one of only four (of the ten) LGAs which have manufacturing businesses with turnovers of $50 million or more. Port Phillip has higher than average concentrations of Textiles, Clothing and Footwear (TCF) manufacturing, and a lower concentration of metal fabrication.
Frankston: adjoining Greater Dandenong, to the south, is Frankston. While it has over 8 per cent or all manufacturing businesses, its relative prominence diminishes as the turnover of the businesses increases. It accounts for less than 4 per cent of manufacturing businesses with turnover of $20 million plus, and has no businesses with turnover of $50 million or more. In terms of industry sub-sectors, Frankston also has a high concentration of fabricated metal manufacturers.
Mornington Peninsula: like Frankston, Mornington Peninsula has over 8 per cent of all manufacturing businesses, and like Frankston, its relative importance decreases as the turnovers of the manufacturing businesses increase.
The Mornington Peninsula is also the location of a higher than average concentration of beverage and tobacco manufacturers (probably wine making and specialty foods like preserves and confectionary) and a slightly higher concentration of wood ana paper products.
5.1.4 Evidence of change and restructuring
The region‘s manufacturing sector is undergoing considerable restructuring. In 2009, there
were 5.3 per cent fewer manufacturing businesses in the region than just two years
previously. However, in the same period, the number of businesses other than
manufacturing grew by nearly 1 per cent. The fall in manufacturing numbers was spread
across every manufacturing sub-sector, as shown in Chart 5.5 below. However within this
overall pattern, the number of larger manufacturing businesses (those with turnovers of $2
million or more) grew by 5.4 per cent. Among larger businesses only two subsectors
declined in number — Pulp, Paper and Paper Products and Furniture and Other

Page | 47
Manufacturing. The sub-sectors with the highest proportionate growth were Wood Product
Manufacturing and Non-Metallic Mineral Products.
Despite the significant growth in the number of larger manufacturing businesses,
manufacturing was still outstripped by growth in non-manufacturing counterparts. The
number of larger non-manufacturing businesses rose by 12.0 per cent. So in both cases,
that is, in all businesses and in the ‗larger‘ business category, the growth in the number of
non-manufacturing businesses exceeded the corresponding figure for manufacturing
businesses by six to seven percentage points. This trend is illustrated graphically in Chart
5.6 below.
In both cases, the number of manufacturing businesses is becoming a smaller share of the
total. This is a continuation of the pattern described in Section 4 where it is the difference in
growth rates which accounts for the relative decline in manufacturing‘s share of value added.
Chart 5.5: South East Melbourne, percentage change in number of manufacturing businesses, 2007-2009
Source: Australian Bureau of Statistics, Counts of Australian Businesses, [data available on request].
-18%
-16%
-14%
-12%
-10%
-8%
-6%
-4%
-2%
0%
2%

Page | 48
Chart 5.6: Percentage change in number of business by industry and turnover,
Southern Melbourne RDA region, 2007 - 2009
Source: Australian Bureau of Statistics, Counts of Australian Businesses, [data available on request].
Some of the documents reviewed in Stage 1 of the project note that an impediment to the
expansion of manufacturing is the relatively small population of ‗advanced business services‘
in South East Melbourne, and particularly in Dandenong. This may reduce the
attractiveness of the region as a location for manufacturers to the extent they require
proximity to these services.
5.2 Managers attitudes and firm strategy: Preparing for the future The information in this section is drawn from the project survey Attitudes of Leading Manufacturers in South East Melbourne which accompanies this report. Its purpose is to provide a degree of insight into how the managers of leading manufacturing companies are positioning their businesses for the future.
5.2.1 Competitive advantages
The most frequently mentioned areas of competitive advantage were:
-8%
-6%
-4%
-2%
0%
2%
4%
6%
8%
10%
12%
14%
All Manuf Businesses All Non-Manuf Businesses
Manuf >$2m Non-Manuf Businsess >$2m

Page | 49
Product quality, including aspects such as brand or firm reputation
Specific expertise, acknowledged skills or capabilities of staff
Customer service and particularly fast turnaround times
Product features including range, innovation and inventory
Less frequently mentioned were factors such as client focus and understanding of client
needs; unique capabilities derived from equipment and/or staff; ability to provide one stop
shop or turnkey solutions and willingness to do small runs.
Interestingly, although price received several mentions it did not rate as one of the most
frequently mentioned competitive advantages.
5.2.2 Factors driving change
Respondents were asked to identify up to five factors which would be the main drivers of
change in their sector over the next five years. The most frequently cited factors were:
Intensity of international competition: This included greater import penetration of the
Australian market and global restructuring
Government policies: While scoring highly, this factor incorporated a number of
Commonwealth and State Government issues including payroll tax, OHS matters,
carbon tax, tariffs and the rate of company tax
Technology, innovation and the need for investment in new capital equipment
Changing patterns of domestic demand which were being driven by a number of
issues such as demographics, changing preferences. The issue of changing
preferences was more common in food manufacturing where concerns about health
were seen to be impacting on the ingredients used
Changing domestic supply chains and particularly concerns about whether specialist
suppliers would survive, threatening the viability of others in the supply chain that
depended on their outputs. This could undermine confidence through a whole supply
chain.
Responses also reinforced the continuing concern about the supply of skilled labour and its
cost, the exchange rate – which is linked to the first point about the intensity of international
competition and a set of concerns around energy costs, carbon footprints and sustainability.
5.2.3 Risks
Respondents were asked to identify the three biggest risks their businesses would face over
the next five years.
There was some commonality with the risks identified and the drivers of change discussed
above. Easily the most frequently mentioned risk was to do with the exchange rate which
scored a quarter of all mentions. Both its absolute level and volatility were identified as

Page | 50
issues. The next most frequently cited risks included changing patterns of domestic demand,
government policy, intensified competition particularly through imports and general economic
conditions.
5.2.4 Firm responses to change
In order to gain some understanding of how firms are responding to the challenges they see
ahead, they were asked to identify the three main changes which they would need to
implement over the next five years. These are shown in Figure 5.7 below.
Around one quarter of responses mentioned sourcing offshore as a primary change – this
sometimes involved investing offshore or developing partnership arrangements with an
offshore firm rather than simply sourcing inputs in the market.
The next most commonly cited response was to focus on cost reduction or to increase
efficiencies, followed by identifying new opportunities and more sophisticated marketing
arrangements.
Upgrading of skills and/or equipment, introducing more automation and increasing the pace
of innovation ranked as the next most frequently mentioned strategies.
Around five per cent of firms indicated they would be implementing new organisational
arrangements – and a number of these involved implementing or concluding succession
plans. A smaller number of mentions related to improving the firm‘s offering, particularly
introducing new services; increasing export efforts and seeking greater workplace flexibility.

Page | 51
Figure 5.7: Main changes to be implemented over the next five years
5.2.5 Strategic intentions: Technology investment
Around thirty per cent of firms indicated they planned to invest in technologies and
equipment which was specific to their business needs – technologies such as laser cutting,
Computer Numerical Control (CNC) equipment and so on. Because the survey covered a
number of industry sectors these have all been grouped together, apart from robotics and/or
automation which is the next most often mentioned area for investment.
The third most commonly mentioned area was in developing or enhancing design or
engineering capabilities, or in specific expertise (as opposed to capabilities embedded in
equipment).
Other areas identified included acquisition of Information and Communication Technologies
(ICT) capabilities, including software development and control systems, investment in
unspecified new equipment, process improvement or capability in new product development.
0
5
10
15
20
25
30
%

Page | 52
5.2.6 Strategic intentions: Capability acquisition
Respondents were asked to identify new skills they would need to acquire for their firms to
capitalise on their investments in new technologies. The most common response indicated
acquisition of specific technical skills related to intended equipment acquisitions. However
(although at a much lower level) other skills were also identified – these were in ICT and
software, specific areas of general management (finance, operations, etc), supply chain
management, sales and marketing, and project management.
There were some observations regarding the ‗professionalisation‘ of manufacturing and the
movement towards staff with tertiary qualifications as becoming more commonplace.
5.2.7 Market development
Firms were asked which new markets they were intending to enter over the next five years.
Most firms defined their answer in terms of new market segments – mining, defence and
infrastructure were the sectors most frequently mentioned and sometimes aerospace
(although this was also accompanied with comments about the exacting standards required).
Around 30 per cent of mentions related to new export markets – sometimes a specific
market was mentioned, more commonly not. Just over 20 per cent of mentions related to
developing new product offerings and creating new or modifying current offerings to create
new product segments. Nearly 10 per cent of mentions related to developing new service
offerings, including e-business-based concepts.
5.2.8 Service offerings
As noted in Section 3, the line between product and service offering is becoming less distinct
with many manufacturers bundling services together with their products, or offering services
separately.
Firms were asked to nominate up to five services they provided, either bundled with their
products or separately. Figure 5.8 below shows the results.
The most commonly mentioned services related to product or process development, with
nearly 40 per cent of responses mentioning a service in this category which includes
services such as prototyping, research and development, design, consulting, prefeasibility
studies and technical assessments.
Just over 20 per cent of mentions related to after sales service, repair and technical support,
while another 20 per cent of mentions related to delivery and installation, fitting,
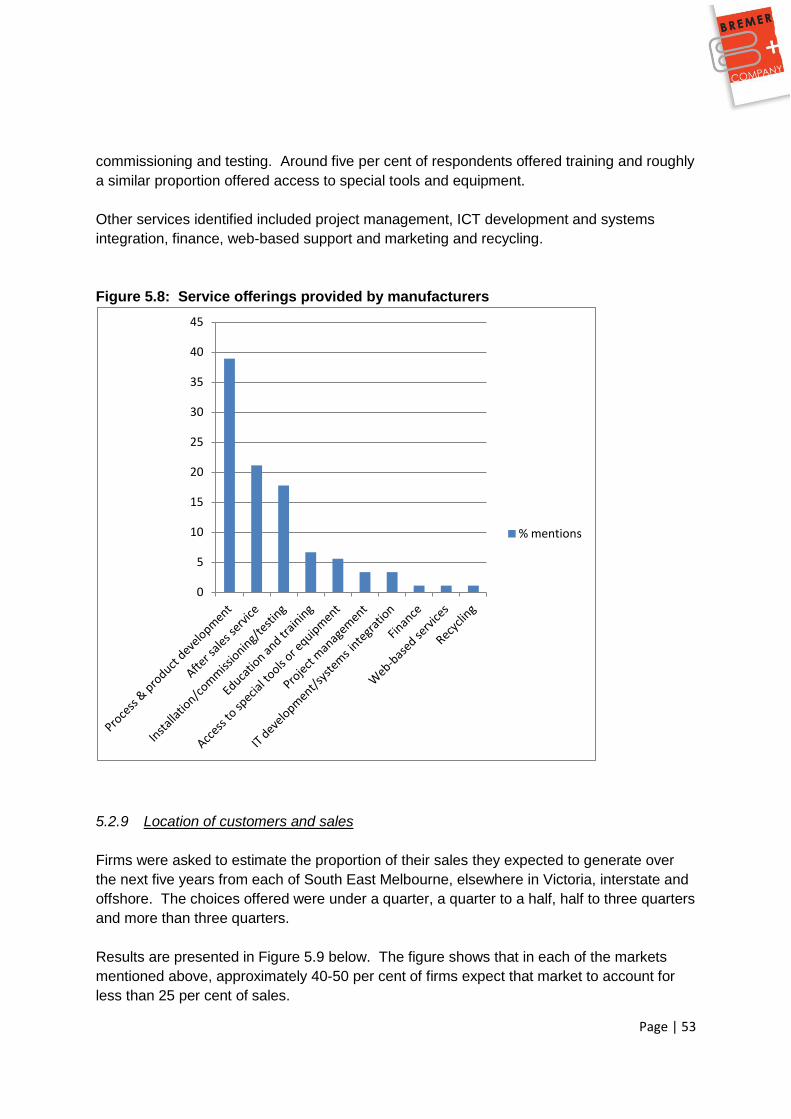
Page | 53
commissioning and testing. Around five per cent of respondents offered training and roughly
a similar proportion offered access to special tools and equipment.
Other services identified included project management, ICT development and systems
integration, finance, web-based support and marketing and recycling.
Figure 5.8: Service offerings provided by manufacturers
5.2.9 Location of customers and sales
Firms were asked to estimate the proportion of their sales they expected to generate over
the next five years from each of South East Melbourne, elsewhere in Victoria, interstate and
offshore. The choices offered were under a quarter, a quarter to a half, half to three quarters
and more than three quarters.
Results are presented in Figure 5.9 below. The figure shows that in each of the markets
mentioned above, approximately 40-50 per cent of firms expect that market to account for
less than 25 per cent of sales.
0
5
10
15
20
25
30
35
40
45
% mentions

Page | 54
Less than five per cent of firms expected their sales in South East Melbourne to account for
more than 75 per cent of their sales and just over ten per cent of firms involved in export
markets expected more than 75 per cent of sales to be in exports.
Where firms engaged with the broader Victorian market, just under 50 per cent estimated
that the Victorian market would account for a quarter or less of their sales. Practically none
envisaged the Victorian market would account for more than 75 per cent of sales. In other
words, there was little evidence of firms which were almost solely dependent on the Victorian
market.
Where firms were involved with interstate markets around five per cent expected more than
75 per cent of sales to be generated in these markets, while around 40 per cent expected
less than 25 per cent of sales from interstate.
Figure 5.9: Sales destinations and proportion of sales to each destination
5.2.10 Engagement with local suppliers
Around 15 per cent of firms indicated they did not source from other South East Melbourne
manufacturers, a little short of half indicated they sourced from other South East
manufacturers but that none of these was critical to the business, and around 40 per cent of
respondents indicated they had at least one south east manufacturing supplier which was
critical to their business. Separately the data was analysed to see whether this pattern was
evident across all sectors. In general there was no discernable difference between sectors
apart from food where these was only one case – around 10 per cent - reporting a south
east manufacturer providing a critical input. This is probably because the nature of the food
0
10
20
30
40
50
60
SE Melbourne Victoria Interstate Offshore
<25%
25-50%
50-75%
>75%

Page | 55
manufacturing process means firms source their critical inputs from growers rather than
other manufacturers.
5.2.11 Opportunities for local collaboration
In face to face interviews and in survey responses it was clear that a significant number of
firm managers felt that there were potential benefits from a stronger connection to other
businesses in the SE Melbourne region.
Firms were asked to indicate whether they thought that anything could be done to improve
the competitiveness of the respondent firm through closer linkages with other manufacturers
in south east Melbourne. Responses were roughly similar with a small minority (54 per cent)
indicating they thought their competitiveness could be improved in this way.
The firms that indicated there was scope to improve collaboration were invited to indicate
what initiatives would be appropriate. The most frequently mentioned issue (nearly 50 per
cent) was to improve knowledge of local capabilities. This was mentioned from both supply
and demand perspectives – if buyers were more aware of capabilities they might source
more locally and if sellers were more aware they might pick up more business.
Other initiatives which were mentioned included collaboration for a range of resource of
procurement issues – utility services, sharing staff and so on, the provision of market
intelligence, developing consortia to bid for projects based on local capabilities and lobbying
on infrastructure issues. Here the most commonly mentioned issues were roads, public
transport and education.
5.2.12 Regional manufacturing leaders
Respondents were asked to nominate other manufacturing firms which they admired as
leaders with strong growth prospects. Each firm could nominate up to five other
manufacturing firms. The purpose of this question was to identify firms which might be in a
position to lead any initiative to strengthen manufacturing in the region.
Easily the most admired firm in this survey was Jayco, a manufacturer of caravans, with
train manufacturer Bombardier, Hilton manufacturing, and Nissan casting each receiving
multiple mentions. Other firms mentioned included Corex, AW Bell, Mett, Volgren, Marand
and Toyota.
5.3 Labour force Within the regional labour market there are a number of issues which impede employment,
especially in Dandenong. In particular, there is a high level of unemployment in Dandenong
which is not explained by a lack of available jobs. Rather a very high proportion of the
Page | 56
population was not born in Australia and does not speak English at home. Hence basic
communication skills are a barrier to employment in many cases and tackling that issue is
seen as a key to improving socio-economic outcomes in the region.
Another issue concerns residential amenity. Parts of the South East are regarded as less
desirable from a residential perspective. About 80 per cent of the region‘s workforce lives
locally. Compared to other areas in the region, Dandenong has a lower level of local
employment for its residents. There is currently ‗migration‘ of occupants of more highly
skilled labour into manufacturing in South East Melbourne and Dandenong in particular. The
pattern is that lower income households are displaced to Dandenong from other regions
because it is relatively inexpensive as a housing location. The absence of housing and
associated facilities which would appeal to those on higher incomes inhibits higher paid
workers from locating in the region.
Upgrading of amenity including social infrastructure and the urban fabric has been identified
as necessary to create better, liveable environments in the South East and Dandenong in
particular. A large proportion of higher-income people commute to the South East because
of this perceived lack of amenity. Upgrading of the urban environment is a requirement to
attract those in higher income positions to become residents of the area.
There is a mismatch between skill requirements for the manufacturing sector and those of
the regional workforce. As outlined in Section 3, skill levels within manufacturing are
continuing to increase and there is a contracting requirement for low and unskilled labour, of
which there is a relatively strong supply.
5.4 Supporting infrastructure 5.4.1 Economic infrastructure
The South East Melbourne region has some excellent infrastructure. Indeed, consulting firm
SGS indicates that outside the CBD, the South East Melbourne region has the best
endowment of infrastructure in the metropolitan area. Recently completed major
infrastructure assets include:
Eastlink, which provides freeway-quality link between Frankston and Mitcham.
Dingley arterial
Upgrading of Dandenong rail station
Water recycling – eastern treatment plant
Various documents reviewed in Stage 1 catalogue priorities for future infrastructure
development. These include:
Upgrading of the Port of Hastings for container traffic. The Baillieu Government has established a separate authority for development of the Port of Hastings, which

Page | 57
presently deals with break bulk and steel merchandise. Any upgrading will involve sizeable investment not only in the port facilities, but also in transport infrastructure.
Broadband connections to areas of Casey, Cardinia and Mornington Peninsula
Extension of Eastlink to the Western Ring Road
Creation of radial transport corridors between Central Activity Districts (CADs)
Access to standard gauge rail links and intermodal freight facility
East west transport links
Upgrades of infrastructure to provide water and power security 5.4.2 Public Research Organisations
Proximity to a range of educational and research facilities is cited as an advantage for
manufacturers in a number of documents. These facilities include:
CSIRO Clayton facilities
Synchrotron
Monash University including the Monash Science Technology Research and Innovation Precinct (Monash STRIP), a $300 million development on the Monash Clayton campus for research into next-generation industries
5.4.3 Education and Training Chisholm Institute of TAFE is located in the region and offers a variety of courses relevant to the manufacturing sector including:
Electronics and Communications Engineering (at Berwick, Frankston and Dandenong)
Engineering Technology - Mechanical/Manufacturing (at Frankston and Dandenong)
Engineering Technology - Robotics and Mechatronics (at Frankston and Dandenong)
Carpentry
Engineering - Production Technology (at Frankston and Dandenong)
Electro-technology Electrician
Engineering - Fabrication Trade
Engineering - Mechanical Trade
Food Processing
Polymer Processing
Process Manufacturing
Engineering - Fabrication and Welding
Industry Engagement and Development A major development has been the initiation of a Bachelor of Engineering Technology, to
begin at Chisholm Institute in 2012. This program has been developed in conjunction with
Engineers Australia, SEMMA and SEBN and is designed to reflect the skills needed in the
manufacturing sector over the coming period. It has the potential to lift local skill levels and
address some of the issues discussed in Section 5.3 above. It is an excellent example of
engagement between industry bodies and the education sector to develop programs which
reflect market needs8.

Page | 58
Holmesglen Institute of TAFE also has campuses close to the region and has some courses
which are relevant to manufacturing.
5.4.4 Supporting organisations
South East Business Networks (SEBN) and South East Melbourne Manufacturers Alliance
(SEMMA) support the manufacturing sector in South East Melbourne.
SEBN is a business unit of the City of Greater Dandenong (CGD), although it offers its
services beyond CGD‘s boundaries. SEBN exists to facilitate exchange between
manufacturing companies across Melbourne‘s south east region. It is focused on
manufacturing firms, but some of its network activities extend beyond this. Its role is to
assist companies improve their competitiveness and profitability by facilitating sharing of
information and experience, often using site visits to regional exemplar companies, as well
as more formal expert presentations. The intention is that in addition to learning, by
introducing firms to each other over time opportunities for sourcing from within the region as
well as more sophisticated collaborative arrangements will emerge.
SEBN‘s networks cover Manufacturing, Quality, Women in Business, Occupational Health
and Safety and Exporting.
The format for networks is maximum of 25 members (to encourage contact and networking)
with 4-6 week cycle of meetings, which are usually held over breakfast.
Training programs and seminars are also offered in areas such as lean manufacturing, 5S
and value stream mapping. These are often supported with grant funding from the state
government.
SEMMA is membership based, with members paying fees according to turnover. Fees
range from $330pa for firms with a turnover of less than $5m, to $1100pa for firms with
turnover of greater than $10m. There are currently about 180 members, with around 75 per
cent of these being manufacturers, and 25 per cent being associate members, that are
suppliers to the manufacturing industry. SEMMA estimates that through its service delivery,
it engages with around 600 firms in the region.
SEMMA provides services to its members but is also involved in representational activities.
The main activities involve advocacy on Victorian Industry Participation Plans, links with the
Department of Defence and to other Commonwealth Departments. Contact with state
government is more to do with specific items of legislation.
SEMMA‘s direct services include activities to encourage:
Joint procurement to achieve economies of scale
Sharing experiences
Accessing regional suppliers
Page | 59
Sharing of capabilities and capacity
Exchange of information and technology
Interaction with government, suppliers and customers
Mutual export opportunities
Marketing through the SEMMA website, newsletter and events
SEBN and SEMMA are closely linked through shared office facilities. Staffing has been
stable over time and so has a deep tacit knowledge of local firms. It is notable that the
staffing resources are tight – one person for each organisation - relative to the ambition of
their respective missions. These organisations play significant roles among the region‘s
manufacturers and could be expected to play key roles in a regional manufacturing strategy.
The roles rely heavily on the tacit knowledge of the staff and the lack of back up staffing
support is a significant risk to the future of both organisations.
5.5 Policy issues
5.5.1 Context
Southern Melbourne RDA Committee has published a plan which provides an overview of the region, its prospects and challenges.9 The plan envisages that the regions current population of 1.3 million will grow to 1.5 million by 2021 and 1.6 million by 2026. The issues identified in this report include:
Infrastructure is not keeping pace with growth. Enhancing transport and freight infrastructure is a priority, including radial transport infrastructure.
The importance of retaining and expanding manufacturing and the development of Dandenong as a regional ‗capital‘.
Broadband infrastructure needs in Casey, Cardinia and Mornington Peninsula
Lack of standard gauge rail link
The plan notes that manufacturing remains the largest employer, followed by retail, health and community services, property and business services and construction. The plan notes the need to develop a profile of the region‘s manufacturing firms and to identify emerging and declining sectors. It also notes the impact of carbon pricing and the aging workforce, and the importance of strengthening the skills base. The update to Prosperity for the Next Generation: Regional Economic Strategy for Melbourne’s South East 2009-203010, published in 2009 identified the following as important trends affecting the regional economy over the preceding decade:
Completion of Eastlink
Development of Synchrotron
Forecasting land needs and setting aside of industrial land
Dandenong Creek Project and Livability (Living Links)
Heightened awareness of the impact of climate change
Growing importance of advanced business services
Page | 60
State Government commitment to Dandenong and the Transit Cities concept
5.5.2 State government planning policies
The previous Government‘s Melbourne 2030: Planning for Sustainable Growth envisaged a
more compact urban form. It foresaw a number of developments which affected the South
East. The Baillieu Government has not yet indicated how much it will be guided by this
document.
Principal among the developments of relevance to the South East are:
Dandenong and Frankston were identified as Principal Activity Centres (PACs). PACs are transport nodes intended for higher density commercial and residential development.
Dandenong South is recognised as a heavy industrial area with appropriate planning controls and buffers to allow long term continuation of heavy industrial uses
No commitments for intermodal freight facility or standard gauge rail link to SE Melbourne
Dandenong South identified as a heavy industry cluster
Monash area identified as an ‗international precinct for science, engineering, health and technology
The previous Government‘s policy regarding the Port of Hastings was that it would not be
developed for container traffic until the Ports of Melbourne and Geelong reached capacity.
The Baillieu Government has established the Port of Hastings Development Authority to
operate and develop the port so it is possible previous plans will be brought forward.
However the cost to develop the port to accept container traffic, and to construct the
associated road and rail links is substantial.
5.5.3 LGA support for manufacturing
Manufacturing is seen to have differing roles in the economic strategies of LGAs across the region:
Dandenong has a clear target on retaining and attracting industrial functions including manufacturing – reinforced by state government‘s intention to protect South Dandenong heavy industry zone. The Dandenong Economic Development Strategy11 demonstrates a good understanding of many of the issues facing manufacturers and the importance of manufacturing to the region. Understanding of labour market and related issues in Dandenong has been enhanced by various studies sponsored by the Dandenong Development Board (DDB).12
Kingston recognizes the continuing importance of manufacturing within its area, but perceives its future growth to be constrained because of lack of availability of greenfields site for industry use and business parks. It is concentrating on high tech manufacturing associated with Monash precinct, and the redevelopment of existing sites13.

Page | 61
Bayside City Council sees manufacturing employment in rapid decline. ‗(Bayside‘s) ….. time as a location for traditional manufacturing has passed‘
Mornington Peninsula Shire is focused on ‗new and innovative green investment‘
City of Casey is seeking to retain the existing 80 or so consumer goods, precision engineering and product and process design businesses located within its boundaries.
Frankston City is focused on creating more jobs in its region. It makes reference to attraction of advanced manufacturing but notes manufacturing is under represented in its profile against that of the state.
The first priority of LGAs is to understand manufacturing in terms of their land use policies.
SGS estimates there is a 25 year supply of manufacturing land in the region and LGAs
appear to have a good grasp on their zoning arrangements for manufacturing.
LGA sponsorship of networking activity between local firms is common although these
activities often target different groups – ie some target sectoral groups, others focus on
particular issues common across sectors. Some LGAs offer well developed
education/training programs for local firms, some of which target manufacturers.
LGAs have limited resources to support their economic development activities, with
personnel in these areas being spread across the broad range of sectors and economic
development activities. In general these organisations do not have strong, broadly-based
links with manufacturers in their area. The exception is City of Greater Dandenong Council
(CGD) which has a clear focus on engaging with its manufacturing base through SEBN and
associated support of SEMMA.
In terms of the level of insight available to LGAs, the various reports and strategies
examined for this project indicate there is uniformly a poor statistical base on manufacturing
firms across the region – the exception being the Cluster Identification Strategy14.
Understanding of the firms, supply chains and sectors, as opposed to the labour force, is
limited. Census-based data dealing with labour market, location of employment, travel,
qualifications and so on are well understood and readily available across LGAs. However
there was no data in evidence on the types of manufacturing firms within the region, sectors,
start ups, closures, age profiles of firms and owners (rather than through labour force data),
nature of new investment and businesses, participation of local vs foreign investment and so
on. Some of this data is available from ABS, albeit at varying degrees of aggregation. In
general the documents examined do not outline comprehensive strategies for attraction,
retention and growth of manufacturing firms in the region.
There is recognition of export as a desirable goal for manufacturing firms, and in some cases
‗import replacement‘ is also a goal. It is true that the ability to systematically export
represents a step upgrade for firms as it requires a set of capabilities not always present in a
traditional manufacturing firm. However there are many pathways to globalizing business
apart from export on the firm‘s own account. Indeed in many industries it is unlikely that
goods will ever be exported from Australia. That does not necessarily mean that a firm

Page | 62
cannot become global – for example surfwear manufacturers like Mambo and RipCurl do not
necessarily produce in Australia but have established very viable global businesses which
generate high income jobs in Australia. All activities which further integrate firms into the
global marketplace, whether they involve participation in supply chains, inwards or outwards
investment or import where this increases competitiveness should be viewed positively.
An underlying and not always clearly stated presumption is that a number of areas within the
region seek to attract and retain business on the price of labour, which is lower than
elsewhere in Melbourne. This is a very short run strategy. The evidence shows that
unskilled and low skilled labour is declining in importance in the manufacturing sector and
that the region is ‗importing‘ skilled labour from other regions already. Access to an
abundant supply of low or unskilled labour is not a sustainable basis on which to compete as
there are many other destinations with much cheaper labour and fewer regulatory
constraints.
5.6 Implications for manufacturing in South East Melbourne
Within the SMRDA region Dandenong and Kingston are clearly the primary locations for
manufacturing, and Dandenong emerges having the largest number of larger manufacturing
firms. Even when the broader South East region, including Monash and Knox, is
considered, Dandenong remains the locus for larger manufacturing firms in terms of
numbers.
State Government planning has anointed the Southern Dandenong Industrial Area as the
location for heavy industry and the region has about 25 years of land supply for
manufacturing on current rates. This bodes well for the continuing development of the
region as a manufacturing hub, noting that the number of manufacturing firms has declined
over the last few years, although the number of larger firms has increased. There is a good
deal of policy attention focused on labour market issues around Dandenong which may
increase the local supply of suitable labour over time. However the services sector has
taken over the role of the provider of jobs for unskilled labour and the supply of unskilled
labour is not a source of competitive advantage for modern manufacturing firms. It is not
clear this is well understood by all involved.
Morale in the manufacturing sector is presently not high. Many firms are worried about their
continuing viability. This largely reflects the difficulty many firms have in development and
executing new business models. Our survey work suggests that a large proportion of the
firms in the region have strategies which are a continuation of their old business models –
the core is the acquisition of new equipment and containment of cost. Firms which are
taking a genuinely progressive approach to evolving their businesses are quite rare,
although they do exist.

Page | 63
6: Findings
In this section we outline the findings of the project, considering in turn:
Forces shaping manufacturing
Firm readiness and capabilities
Infrastructure
Regional manufacturing leadership and morale
Interfirm linkages and connections
Support mechanisms
Education and training
Supply of land
6.1 Forces shaping manufacturing
6.1.1 Structural issues shaping Australian manufacturing
Australian manufacturing generally is characterised by small firms, often family-owned, with
few large indigenous manufacturers which would rank as primes in supply chains. This is
also true in South East Melbourne and this characteristic has important implications for
competitiveness. While more nimble than their larger counterparts, smaller firms generally
exhibit lower levels of performance than larger firms. They are less likely to operate at best
practice and do not have internal access to the spectrum of capabilities of their larger
international competitors which allow them to undertake systematic strategically-oriented
activity. And there is only limited evidence of collaboration or other activities to compensate
for this.
A second notable characteristic of Australian manufacturing in comparison to other OECD
countries is its relatively higher concentration in low technology and medium-low technology
sub-sectors. High technology sectors such as aerospace, pharmaceuticals, and
communication electronics are more likely to need to source innovation directly or indirectly
from the specialised capabilities of PROs and so there is a natural process of development
of connections of this type in high technology sectors. These are also the sectors with the
fastest growth in international merchandise trade.
Third, many multinational corporations established operations in Australia during the period
of high protection from the 1940s to the 1970s. The plants established under this regime
were intended to supply the domestic market only, were small by global standards and
relatively inefficient. As protection has been wound back and global production based on a
small number of larger plants has replaced the model of domestically-focused production
facilities, many Australian based MNCs have struggled to attract new investment from their

Page | 64
parents and remain relevant. In turn local suppliers without a diversified customer base
have been affected by changes in this model.
6.1.2 Global integration of manufacturing activity
Global integration means that firms are taking a global view of production operations,
focusing their activities on a limited number of operations located for proximity to markets,
sources of innovation or other sources of competitive advantage. Global integration means
that domestic product, and increasingly service, markets are internationally exposed. This
has driven change in all countries, but particularly in Australia with its history of high
protection for the manufacturing sector, sub-scale domestically-oriented plant and few large
indigenous manufacturers. In a global age Australia has had a limited manufacturing
structure on which to build a globally relevant manufacturing sector.
Policy approaches for suppliers, particularly in the motor vehicle sector, have aimed to
integrate Australian manufacturers into global supply chains for at least the last decade.
However many Australian manufacturers have found they lack the capabilities (production
to global standards, market knowledge, levels of product development and innovation and
cost competitiveness) to make the transition from a local supplier to participants in a global
supply chain. The transformation required of these firms to remain relevant is very large
and will be beyond many of them.
6.1.3 Organisation of production
For many decades manufacturing provided low-skilled jobs in routine process and assembly
operations. To the extent these activities are still undertaken manually, jobs of this kind are
now located in low-labour cost countries. The services sector has become the bulk provider
of low skilled jobs in Australia.
Manufacturing is continuing to evolve as a highly productive, often capital intensive and
highly skilled sector.
We detected a degree of misunderstanding of this trend. There is still some sense that a
large supply of low-skilled labour in South East Melbourne is a good thing for the
manufacturing sector. In fact in as much as there is a low average skill level in South East
Melbourne, there will be a continuing mismatch between the needs of the region‘s
manufacturing firms and the labour supply. Unskilled and low skilled labour is not a
competitive advantage for the manufacturing sector in the region into the long term.
The idea of ‗mass customisation‘ means that products are tailored to the needs of individual
customers, but at a price reflecting the benefits of mass production. This feature of modern
manufacturing also reduces the batch production model and reinforces the need for
individual workers to be sufficiently skilled to operate in a more sophisticated environment.

Page | 65
6.1.4 Technology
Advances in electronics, information and communication technologies, computing
capabilities, software programming and e-business are revolutionising manufacturing. They
provide the capabilities that make flexible, automated production systems, global supply
chains, and global customer reach possible. Other advanced technologies which will have
potentially revolutionary impacts on manufacturing include:
Biotechnology and genetics
Nano-technology
Micro-machining
Metrology
Mechatronics
New materials
Smart materials
Fuel cells and alternative energy
Integrated technologies.
It is not possible to foresee how advances in technology will impact on the circumstances of
each business. However it is reasonable to assume that just as ICT has required upskilling
in all businesses and the development of high-level capabilities in some, so too new
technologies will require the ability to change, adapt and upskill if benefits are to be realised.
New technologies will create some discontinuities, but these represent the downside that
accompanies new opportunities. The ability of business leaders to read trends and position
their businesses will determine whether technology has a positive or negative impact.
6.1.5 Sustainability
Manufacturers will be operating in a world of increasing resource and energy constraints.
They will be expected by the public, governments, and other stakeholders to exercise
responsibility for the way they interact with the environment. Environmental sustainability will
be a critical driver of costs and a key operating principle in product design, engineering, and
life-cycle management, the development and use of production and process technologies,
as well as in the management of energy and natural resources.
6.2 Firm readiness and capabilities
6.2.3 Firm leadership and management
Since the 1995 Karpin Report, businesses have been on notice that firm leadership in
Australia is not what it might be.
Page | 66
The 2009 Management Matters in Australia report showed that managers of manufacturing
enterprises in Australia were strong at operational management, but relatively weak at
leadership and personnel management. There is a strong body of evidence that smaller,
family owned businesses tend to be more poorly managed and less productive than larger
businesses which a broader ownership base. Poor performance in this area reduces the
productivity and potential of the business.
We believe that leadership and management capabilities lie at the heart of the opportunities
and challenges which manufacturers in South East Melbourne face. The responsibility to
create and continue to evolve a successful business is the responsibility of the firm‘s
leadership. The skill threshold to successfully lead a manufacturing business is lifting
quickly, at least as quickly as for the workforce on the shopfloor. Failure arising from an
inability to devise and execute strategy rests at the feet of business leadership. However we
found little evidence that firms interpreted their difficulties this way. They typically had quite
clear ideas about skill development needs on the shop floor but rarely articulated a need for
more management capabilities. The project survey showed that development of
management capability was identified as a need in only a very small proportion of the
businesses involved. This is a serious blindspot among the leaders of manufacturing firms
about their own capabilities.
A particular vulnerability is ‗second generation firms‘. There are clearly examples of
excellent, competitive and viable manufacturing firms which are managed by the second
generation in a family. However it is not uncommon to find firms in this category with a set of
attributes which militate against success. These include:
reluctance or inability to move from the business model that was successful for the
first generation and create a new model to meet changing circumstances
management with trade-based skills which often translates into operational
excellence at the expense of the development of other management functions in
strategy, marketing and innovation;
management with limited horizons, not able to foresee the global forces shaping their
business. Because they cannot anticipate the impact of change, the company is
often reacting when it is too late, rather than having moved while it still had a healthy
cash flow;
management practices that fail to bring an economic return to assets, particularly the
value in land and buildings, built up over time.
We observed examples of firms with owners in their fifties and where the strategic objective
seemed to be simply to preserve as much value as possible for a few more years, realise the
value in the land and buildings and close the business. Impending failure permeates the
business and seeps through to those on the shop floor.
In general our engagement with firms suggests that strategies for the future are a
continuation of the strategies that have worked in the past. They are production-focused
Page | 67
with the priorities being the acquisition of new equipment and the skills to operate it.
Evolution of the business model is something which occurs when it is no longer avoidable
rather than being led by insightful leaders who have anticipated shifts in the market.
6.2.2 Sources of value
A critical aspect concerns how manufacturing firms create value. In the past it was usual for
manufacturers to create value solely from production activities. In Section 3 we used the
Institute of Manufacturing model showing how bundling of services with manufacturing
outputs is becoming common. Firms are creating less value from their production activities
and providing new value to customers by providing services. These include ‗traditional‘
activities such as installation and testing, but also include design, finance, training, systems
integration and recycling.
This is a challenge for manufacturers because it can often mean extending their competence
beyond the traditional focus on production or by developing partnerships with other
businesses to expand capabilities.
The survey work undertaken for the project indicates manufacturers in that sample
commonly offered services, but they were much more likely to be of the ‗traditional‘ type.
There was not much evidence of business model innovation to expand the range of service
offerings.
6.3 Infrastructure
The documentation on South East Melbourne reviewed in Section 5 shows there is a
reasonably comprehensive understanding of the economic infrastructure in the region, how it
supports industry, how it can drive the immediate creation of jobs, and what the priorities for
future infrastructure development might be. There was also commitment at the state level,
under the previous Government, to the development of Dandenong and Frankston as Transit
Cities, accompanied by an upgrading of public transport infrastructure.
Infrastructure development is important, however the link between further infrastructure
development in the region, and the competitiveness of the manufacturing sector, should not
be overstated, at least in terms of its significance to manufacturers who are already located
in the South East. In our engagement with manufacturers, infrastructure was not frequently
identified as an important issue. When it was, it tended to relate to the specific
circumstances of individual firms – availability of high amp electricity, routing of buses and so
on. The development of container capability at the Port of Hastings could reduce transport
costs in the region. However this will be at the margin and again should not be overstressed
as a driver of manufacturing competitiveness.

Page | 68
Access to bandwidth is a constraint for business in some parts of the region - Casey,
Cardinia and Mornington Peninsula - and could be the most beneficial immediate priority in
the infrastructure area.
Development of new infrastructure is more important as a consideration for firms considering
locating in the South East than it is for those already located here.
6.4 Regional manufacturing leadership and morale
When each day brings new media coverage of the travails of the manufacturing sector it is
difficult to maintain morale in the sector. However it remains the case that there are some
excellent Australian manufacturing firms with global leadership in their field located in South
East Melbourne. There are other firms that have the potential to join that league. But it is
unquestionably the case that at present the mood within the sector in not buoyant.
We did not sense there was strong regional leadership or regional engagement by South
East Melbourne manufacturers. Many of the firms we engaged with were involved in
industry associations and technical organisations but generally these did not have a regional
focus. There is not a shared vision of the future of manufacturing in the region or what
priorities might be needed to strengthen the region‘s manufacturing base and secure it into
the future. Given the diversity of manufacturing activity in the region to some extent this is
not surprising. We gained the impression that many of the leading firms engaged with local
and regional mechanisms because they thought it was the right thing to do, but did not
expect to gain anything for their businesses as a result. There was an absence of passion
for the development of the region, possibly because many of the senior people do not have
residential or social ties here. The absence of affinity with the region is in contrast to areas
like Geelong, where manufacturing industry leaders are passionate about the city and its
future. It is possible that the notion of ‗South East Melbourne‘ is too large and amorphous to
be a meaningful construct for many manufacturers.
Another dimension affecting morale is the hollowing out of supply chains. A number of firms
cited examples where they could no longer source critical inputs for their production, or
where demand for specialist supplies had become so small that wholesalers no longer
carried them. This required direct sourcing offshore. All these developments add to a sense
of being ‗picked off‘ with increasing difficulty to manufacture.
The positive dimension is that firms in the project survey were able to identify other regional
manufacturing firms which they admire. The cohort of firms named in that question is a base
from which a leadership cohort could be drawn and developed. Especially when times are
thought to be tough, we believe it is important that there is a cohort of local manufacturing
leaders who are able to inspire positive self-belief among their peers and a mindset that it is
possible to see a way through. And an important aspect of self belief and strong regional
leadership is to dispel the notion that industry leadership should come from government with
the culture of dependence that creates.

Page | 69
6.5 Interfirm linkages
The project survey work indicates that of those that responded, nearly 40 per cent said that
they had at least one manufacturing supplier in the region that was critical to their business.
A similar proportion indicated they had at least one manufacturing supplier in the region who
was not critical.
There is a useful base on which to build, but our overall impression is that linkages between
manufacturing firms in the region, and between the leaders of those firms, are limited. In our
interviews and in the survey responses, a number of firms were unable to identify local firms
they admired and indicated they didn‘t know people from other firms.
This is potential with better linkages to increase sales, but poor linkages are potentially of
more consequence for leadership and learning. Without good connections, the identification
of shared interests does not occur and the actions to advance those interests are unlikely to
transpire. Similarly, peer learning and passing on of tacit knowledge will occur more
efficiently when there are good connections.
By way of example, the survey work showed the very diverse spread of export markets that
South East Melbourne manufacturers are involved in. The knowledge gained to establish
and maintain a presence in those markets is expensive to acquire, and the reality of the size
of the firms and the size of the sales involved implies that making these sales is expensive.
There must be opportunities to share knowledge and possibly other resources regarding
those markets to the benefit of all.
6.6 Support mechanisms
In comparison to other regions, South East Melbourne has a rich variety of institutional
mechanisms to support manufacturers from local, state and Commonwealth levels. These
include South East Business Networks (SEBN), South East Melbourne Manufacturer‘s
Alliance (SEMMA), the economic development units in each of the local government
authorities, Department of Business and Innovation, Australian Industry Group (including
Tradestart) and Enterprise Connect.
The region is proximate to the Monash/CSIRO facilities at Clayton, including the
Synchrotron.
We believe there is a disconnect between the Monash/CSIRO facilities and the regional
manufacturing sector. Part of this is structural – on the firm side, many of the firms are too
small and do not see science and technology as a pathway for innovation. On the science
side, the culture of research bureaucracies does not encourage small-scale engagement
with industry as a valuable pursuit. Nevertheless, we believe there are opportunities for
more engagement between manufacturing firms and the facilities.
Page | 70
We observe a low level of integration across the various organisations active in the region. It
is likely more could be achieved with genuine engagement and commitment to work together
in the interests of firms. This is rarely easy, but a starting point might be to invite
counterparts to be involved in meetings and training and to seek reciprocal engagement,
particularly with DBI central office.
6.7 Education and training
Responding to recent reforms to send strong market signals, the TAFE sector has become
focused on immediate needs at the expense of a longer term view. In the absence of
engagement with manufacturers there is a risk that the training infrastructure will not produce
the skills that are needed over the next decade with the consequence that the opportunity to
perform at a high level is lost.
6.8 Land supply
We found evidence of planning looking out over the next thirty years to provide an
appropriate supply of land to support manufacturing in Melbourne‘s South East. This is
reflected in planning documents at the state and local government levels.
There was also an appreciation, reflected in the zoning structure, of the changing pattern of
demand for land for industrial use. In particular, there is recognition that it is unlikely large
sites such as those required for the mass production of motor vehicles will be required.
Demand is shifting to relatively smaller scale production with a relatively smaller number of
highly specialised machines and with a much higher proportion of white collar workers
needing to be accommodated.

Page | 71
7: Shaping the strategy – strategic considerations
Strategy is formulated in a context. The purpose of this section is to consider six critical
contextual issues which will fundamentally shape the strategy, its feasibility and extent as
follows:
Strategic options – identifying possible actions based on a scan of initiatives by
bodies concerned with promoting manufacturing on a regional basis,
Environment - bringing together the analysis in this report into a SWOT framework
Focus of activity - where the strategy needs to take effect
Leadership of the strategy
Resource availability
Timeframes
7.1 Strategic options – possible elements of a strategy
Concern about the future of manufacturing industry is not unique to South East Melbourne,
or indeed to other parts of Australia. In Sections 2 and 3 we demonstrated that the place of
manufacturing in national economies has changed significantly over the last thirty years. In
particular, low skilled process work has all but disappeared from manufacturing in OECD
economies, the pace of innovation has increased and manufacturers are offering a range of
services together with their products.
To provide a context for the actions that might be undertaken in a strategy we have scanned
the approaches of various regional bodies both within Australia and overseas that have
sought to change the trajectory of manufacturing in their regions. Table 7.1 contains a guide
to the sorts of functions performed by regional bodies to strengthen manufacturing. Of
course the specific institutional environment is different in each place and in some cases will
not be relevant to the discussion here. And it is also true that many Australian
manufacturers are more distant, both geographically and in terms of practice, from firms at
the leading edge than their international peers. This means it is likely a strategy for
manufacturing in South East Melbourne will have different emphases to those devised for
other places.
It is notable that the actions listed are not unfamiliar in South East Melbourne – the strategy
will build on existing activity.

Page | 72
Table 7.1: Summary of actions undertaken by regional bodies to support manufacturing Leadership Linking regional industry leaders
Defining a vision and strategy for manufacturing in the region
Establishment of a body, or focus on an existing body as the driver of a strategy
Advocacy Influencing policy processes to draw government resources which support manufacturing into the region
Promotion of the region as a location of complementary manufacturing or services investment
Co-ordination Working with the various agencies and organisations to reduce search costs and improve integration of service delivery for manufacturing firms in the region
Talent Attracting talent to manufacturing by developing links with schools, organizing site visits and work experience and promoting manufacturing as an interesting career
Research Collecting data on firms in the region to gain insights into patterns of performance and need
Skills Influencing curricula in regional training institutions to meet existing and future industry needs
Providing training or co-ordinating provision of training where appropriate offerings are not forthcoming from training bodies
Peer learning Sponsorship of arrangements to bring firms together for peer learning
o Exchange of ideas and information o Demonstration of equipment and technology
Firm capability Identifying global best practices and raising awareness of them among regional manufacturers
Provision or facilitation of access to training for managers
Firm capacity Introduction to suppliers of complementary capabilities
Assistance and brokering in formation of consortia and joint ventures
Innovation Promoting the importance of product, process, marketing and business model innovation as the basis of competition
Facilitating connections between firms to improve knowledge flows, especially between globally connected firms and regional firms further down the supply chain
Advocating with PROs to build links with local firms
Procurement Identifying local capabilities
Capability directories, regional capability marketing
Providing assistance to regional firms in finding local suppliers
Keeping up morale – creating positive images/messages
Moving the locus on discuss from problems to success
Creation of a positive image manufacturing in the region
Identification of exemplar companies that can be used to generate an image of success and achievement
7.2 Overview of the strategic environment
In Sections 2 - 6 we have identified major trends shaping the manufacturing sector. Table
7.3 below distils the critical aspects from the earlier sections into a SWOT analysis.

Page | 73
Table 7.2: SWOT analysis of manufacturing in South East Melbourne
STRENGTHS WEAKNESSES
Firms
Agglomeration of manufacturing firms across many sectors – ‗home of Australia‘s supply chains‘
Strong operational competence among managers Infrastructure
Good road and rail infrastructure
Planning and development of transit cities
Early stage planning for Port of Hastings
Chisholm Institute of Technology, Holmesglen TAFE
o New Bachelor of Engineering Technology degree
Government and policy
State level recognition of South East Melbourne as a core manufacturing region
Presence of government agencies (DBI, Enterprise Connect) and supporting organisations (SEBN, SEMMA)
Commitment to manufacturing in Dandenong and Kingston LGAs
Land use planning to accommodate manufacturing needs
greenfields and brownfields
Regional focus
Weak affinity of firms and leaders with the region o Lack of regional advocacy o Under-developed influence channels
Regional specialisation o Lack of branding / manufacturing identity
Industry structure
Preponderance of small firms with limited capacity and capability
Weak connections into global value chains Firms
Quality of firm leadership o Limited management world view
Limited presence in global supply chains o Many firms lack products and capabilities
for global supply chains o Undifferentiated products
Links with PROs and absorptive capacity
Weak collaboration and linkages between firms Factors
Regional skill levels and availability
Workforce locational decisions affected by poor regional amenity
Government and policy
LGA manufacturing engagement Infrastructure
Poor broadband bandwidth in some regions
OPPORTUNITIES THREATS
Firms
Core of firms with leading edge practices on which to build
Collaboration for building capacity and capabilities
Sharing knowledge bases
Managed consolidation and exits Markets
Better knowledge of local capabilities to increase local sourcing
Sharing knowledge of export markets and contacts
Work with firms to help enter Infrastructure, Mining, Defence and Aerospace markets
Growing sectors
Non metallic mineral production
Metal products
Food and beverages
Machinery and equipment Factor conditions
Capturing more value from CSIRO/Monash infrastructure
Infrastructure
Development of Port of Hastings and associated infrastructure
Globalisation and Technology
Technical feasibility of global engagement for small firms (broadband enabled)
Economic environment
Economic uncertainty
Increased global competition in domestic markets
Exchange rate volatility
Probably structural shift in exchange rate Morale
Contagion from struggling firms builds lack of confidence across region and manufacturing sector reducing propensity to invest and plan for the future
Firms
Firm strategies which don‘t address market realities
Critical elements of supply chains disappear undermining viability of other firms – creation of domino effects
Skills
Lack of availability of skilled labour
Lack of availability of skilled management Government policy
Level of taxes (payroll, workcover)
Carbon tax

Page | 74
7.3 Focus of activity
7.3.1 Firms, sectors and other commonalities
The project brief envisaged that the strategy would be developed around the fastest growing
sectors. This is not the approach we recommend.
In Section 3 we noted the importance of cross cutting technologies which have the potential
to impact in a wider range of industry sectors. We identified the convergence of
technologies as a factor which will shift the frontier of possibilities in many product markets.
In Section 4 we also traced the change in value added and employment in manufacturing.
This showed that in Australia over the last twenty years output in the Wood and Paper,
Printing and Recorded Media, Chemicals and Plastics, Textiles, Clothing and Other
Manufacturing are on clear downward trajectories. The sectors which are trending upwards
are Metal Production, Machinery and Equipment, Food and Beverage and Non-metallic
Minerals. We noted in Section 5 that over the last two years the number of businesses in all
manufacturing sub-sectors in the Southern Melbourne RDA region has declined, but this has
been particularly pronounced in Petroleum and Coal products (down 16 per cent), TCF
(down 10 per cent), and furniture, printing and primary metal production, and transport
equipment and non-metallic mineral production each of which is down around 7 per cent.
We do not favour an approach which has sectors as its focus for a number of reasons:
Sectors are useful in high-level discussion but in reality firms are becoming less likely
to fit neatly into the ANZIC structure so the frame of analysis is far from complete. As
technologies become more specialised and services are increasingly bundled with
the offerings of manufacturers the traditional sectoral classification system has less
utility as the basis for understanding and building on commonalities between firms.
Firms need to be just as alert to the possibility of collaborating effectively with
counterpart firms outside their current industry structure as within. Much innovation
now occurs at the intersection of technologies which originate in different sectors.
As we showed in Section 5, one of the characteristics of manufacturing in South East
Melbourne is that on a sectoral basis, the profile is similar to that for Victoria and
Australia generally. If it was the case that there was a strong concentration of a
particularly type of manufacturers in South East Melbourne, a sector-based strategy
to improve the performance of firms in that group might make sense. This is not the
case.
Importantly, competition takes place at the level of the firm and the supply chain.
Because a sector is in decline does not mean that within the sector there are not
capable and competitive firms. Indeed, harsh economic circumstances can provide
the catalyst which unlocks innovation and spawns new approaches. This can be
seen in the TCF sector, which in aggregate has been in steep decline as assembly of

Page | 75
clothing as shifted offshore. Yet while this has happened, strong niche players have
emerged in technical textiles, branded surfwear and work footwear. At the same time,
although metal fabrication is growing, there are many companies in that sector
producing undifferentiated outputs and as a result are in difficulty. Within South East
Melbourne Jayco is one of the most admired and successful firms, yet it is in the
transport equipment ANZSIC segment, which is contracting in Australia.
Sectorally-based strategies are usually pursued because a particular sector has
strengths or prospects which, it is hoped, can be built upon. The reality in South East
Melbourne is that there is a diverse population of firms. Those world-class firms that
are located in the region are from many different sub-sectors. These firms will be the
main asset in strengthening manufacturing in the region and it would be a mistake to
arbitrarily exclude any of these firms from the strategy.
In developing business models and strategies firms need to consider their skills and
capabilities in relation to a wide range of product (and service) markets. Some firms
may need to diversify their product base or even switch markets entirely to remain
relevant. Working in a sectoral manner will alienate some firms as well as help to
reinforce a mindset in other firms which does not support an agile and dynamic
manufacturing capability in SE Melbourne.
Finally, sectoral-based strategies by their nature exclude firms which do not sit neatly
in a sector grouping. A producer of nanomaterials, for instance, may be a critical
supplier for the pharmaceutical and health products sector and for surface treatments
for the automotive industry, but not be included in either under a sectoral approach.
Given the diversity of manufacturing in South East Melbourne, a strategy that
focused on even the two or three largest sectors would still exclude around half the
region‘s manufacturing firms. This will not achieve ownership of a strategy at a
regional level.
The point is that the strategy should focus on the firm and in particular on actions which can
lift innovation and performance. This is not to say that identifying commonalities across
firms in the region – markets, technologies, supply chains, skills needs, and so on - and
delivering services to them on a group basis is inappropriate. On the contrary, activities that
bring firms together, create connections and reinforce the flow of information between firms
are at the core of the region‘s competitiveness and the directions we recommend.
7.3.2 Knowledge flows and segmentation of firms
Rather than focus on sectors, it may be useful to segment firms according to their
performance and for the strategy to support improvement in each segment. We suggest the
categorisation below in Table 7.2.
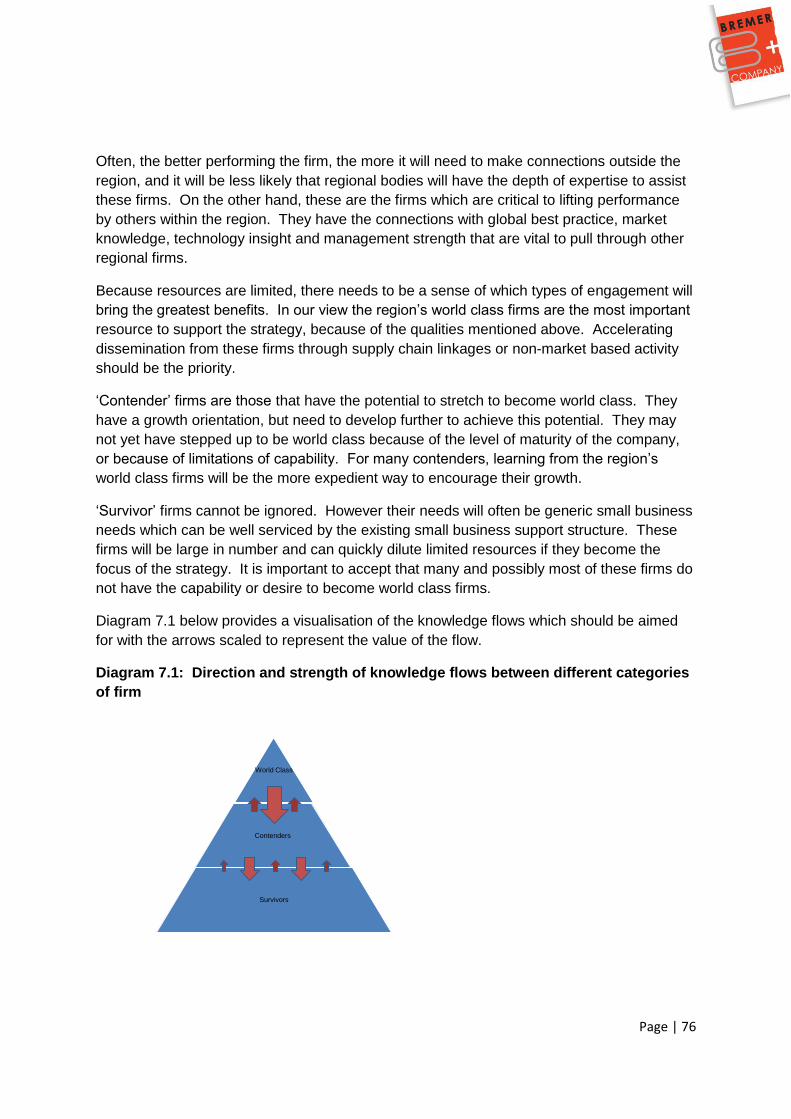
Page | 76
Often, the better performing the firm, the more it will need to make connections outside the
region, and it will be less likely that regional bodies will have the depth of expertise to assist
these firms. On the other hand, these are the firms which are critical to lifting performance
by others within the region. They have the connections with global best practice, market
knowledge, technology insight and management strength that are vital to pull through other
regional firms.
Because resources are limited, there needs to be a sense of which types of engagement will
bring the greatest benefits. In our view the region‘s world class firms are the most important
resource to support the strategy, because of the qualities mentioned above. Accelerating
dissemination from these firms through supply chain linkages or non-market based activity
should be the priority.
‗Contender‘ firms are those that have the potential to stretch to become world class. They
have a growth orientation, but need to develop further to achieve this potential. They may
not yet have stepped up to be world class because of the level of maturity of the company,
or because of limitations of capability. For many contenders, learning from the region‘s
world class firms will be the more expedient way to encourage their growth.
‗Survivor‘ firms cannot be ignored. However their needs will often be generic small business
needs which can be well serviced by the existing small business support structure. These
firms will be large in number and can quickly dilute limited resources if they become the
focus of the strategy. It is important to accept that many and possibly most of these firms do
not have the capability or desire to become world class firms.
Diagram 7.1 below provides a visualisation of the knowledge flows which should be aimed
for with the arrows scaled to represent the value of the flow.
Diagram 7.1: Direction and strength of knowledge flows between different categories
of firm
World Class
Contenders
Survivors

Page | 77
As an indication only, it might be expected that five to ten per cent of firms will be in the
world class category, perhaps another thirty to forty per cent will be contenders and the
balance will be survivors.
Using these proportions as a guide, with around 6500 manufacturers in South East
Melbourne, there could be 300 to 600 world class firms, 900 to 1200 contenders and 4700 to
5300 survivors.

Page | 78
Table 7.3: Indicative firm segmentation model
Type of firm Characterised by Needs Possible mechanisms
World class Professional management across a number of disciplines
Exporting
Innovation leaders
Strong understanding of customer requirements
High growth orientation
Recognised brand
Profitable
Equity held across a number of players
Likely to have strong position in domestic markets
Maintain world class standing by innovation and improvement
Links to globally best sources of innovation
Links to national and international sources of innovation
Supply chain development
Contenders Limited by vision, understanding of potential and how to manage risks
May not have highly qualified management
Good technical competence, may lack innovation insight
May not have real growth orientation
Exhibits some potential in products and / or processes
Profitable
Upgrade to world class
Management confidence building and horizon expansion
Needs likely to be around goal setting, people management
Peer mentoring from those who have faced similar problems likely to be valued
Development of local markets still an issue
Learning groups
Links to world class firms
Links to local sources of innovation
Development of supply chain
Functional relationships to develop capabilities in less strong areas
Links to develop export markets
Survivors Lower level of management skill
Lower growth orientation and performance
Price takers
Likely to have a closed management style or actual practice
Management progression from shop floor – may not have specialised white collar employees
Second generation problems
May have profitability issues
Survival, some may shift up to Contenders
Small business skills
Probably lack basic systems
Unlikely to export, lacks extensive connections and relationships
Need a strategy and capabilities to differentiate offering
Succession planning
Links to higher performing firms
Learning groups to expose to better practices

Page | 79
7.3.3 Attraction and retention of manufacturing firms
Evolution of firms is inherent in market forms of production. Firms are established, they
grow, restructure, merge and fail. As shown in Section 5.1.4, there is clear evidence of this
dynamic in the region. The strategy needs to recognise that firms have life cycles and that it
should be concerned not only with helping existing firms, but also with attracting new firms
and in some cases in orderly exits.
New firms have to decide where to locate. Factors such as the supply of land with
appropriate zoning, transport, supply of skills, and proximity to suppliers are all issues which
can influence these decisions. South East Melbourne has a good supply of industrial land,
good transport infrastructure and many suppliers to manufacturers. The supply of skills has
been identified as a critical issue in the project survey work. Initiatives such as Chisholm
Institute‘s Bachelor of Engineering Technology which will increase the supply of
manufacturing-specific skills are the type of forward-looking actions that will help to sustain
the region‘s attractiveness as a manufacturing hub. It is very important that an initiative such
as this succeeds. It should meet the needs of employers, provide an entree into
employment and aspire to be a world class offering. The task for regional bodies with
respect to new firms is to make sure that South East Melbourne is an attractive location,
taking into account the factors above.
Retaining existing capabilities will be the primary focus of the strategy. This involves both
supporting firms in their efforts to upgrade and in some cases assisting in the orderly exit of
businesses.
Working with firms to upgrade and remain competitive will involve myriad activities of the
type outlined in Section 7.7. However in some cases helping in orderly exits with the
objective of retaining capabilities in region may also be important. The project‘s engagement
with firms has revealed anxiety about the hollowing out of capabilities with examples cited
where critical capabilities have been lost as firms have closed down or ceased particular
services. In consequence other firms further down the supply chain have found they are no
longer able to compete. In some cases it may be possible to retain capabilities through
facilitation of acquisitions of equipment and staff, or a whole business as a going concern.
7.4 Organisational leadership
Aside from having a sound strategy, a critical element in achieving the desired goal is the
presence of an appropriate body to finalise, implement and monitor the strategy. Because
the strategy will involve working with a range of organisations it is important that this body is
recognised by key stakeholders and the role respected.
An appropriate body would have leadership with the following characteristics:

Page | 80
Belief in the importance of the goal and the energy to pursue it.
Authority within the South East Melbourne manufacturing community. The body
needs to be led by business people who are recognised and respected for leadership
in their own businesses. The broader manufacturing community needs to have
confidence in the people involved.
Scope and scale. The body needs to be large enough to attract attention, but
sufficiently focused that it is able to take positions on issues rather than have to avoid
strong positions in order to ensure membership sub-groups are not offended.
Diversity of representation such that the body is not thought to be captured by a
particular sector or interest group.
Respect of the organisations – government, PROs, local councils – which the body
will be seeking support from.
Inclusive approach that recognises there are many stakeholders who will need to be
engaged with and incorporated into the mission.
The focus should stay on regional issues and not stray into statewide or national issues
which are already covered by organisations such as AiG, ACCI, VECCI and BCA. A
regionally based grouping will not have the resources to compete with these players and is
likely to reduce the propensity to collaborate with regional bodies. If the strategy pushes into
territory that others perceive they own it will reduce their willingness to collaborate.
7.5 Resources
Strategy design needs to take into account not only the desired goals and the strategic
environment, but also the probable resources available.
There are many organisations with an interest in manufacturing in South East Melbourne, as
outlined in Table 7.2 below.

Page | 81
Table 7.2: Organisations and resources available to support a strategy in South East Melbourne
Regional State Commonwealth Firm capabilities
SEMMA, SEBN Victorian Business Centre
AusIndustry Enterprise Connect Tradestart
Linkages between firms and other bodies
SEMIP, SEMMA, SEBN Networking programs ICN Supply chain projects Innovation support
ICN CSIRO
Business environment
SEMIP, SEBN, LGA Economic Development Units
Education / skills Infrastructure Govt purchasing Taxation – payroll, land, s/d Industrial Relations Innovation support Economic management Trade development Investment facilitation
Innovation programs – grants, R&D tax concession, CRC program, R&D funding Govt purchasing CSIRO services Macroeconomic management – interest rates Taxation policy Environmental approval policy Infrastructure – transport and communications Investment attraction Trade policy – market access and development
Creating and promoting a shared vision of a viable manufacturing sector in South East Melbourne
RDA Southern Melbourne Committee, SEBN, SEMMA, LGAs
Planning – land, transport, Education / skills Minister involvement Regional Development
Education funding Minister involvement Regional Development
Expanding the global outlook for South East Melbourne manufacturers
SEMMA, SEBN Purchasing policy Investment facilitation
ICN / supplier advocates Austrade – inbound / outbound missions Invest Australia
Encouraging a culture of anticipatory change
SEBN Innovation funding Innovation programs Trade programs
Building on the strengths of existing bodies
SEMIP, SEBN, SEMMA VCAMM Univerisities
AusIndustry EC Austrade Supplier advocates CRCs
Leadership and management skills
SEBN, SEMMA Peer based learning - high performance groups
EC
.

Page | 82
It is not obvious that there is agreement as to which organization would ultimately ‗own‘ a
strategy. Southern Melbourne RDA Committee, Dandenong and Kingston LGAs, South East
Business Networks, South East Melbourne Manufacturers Alliance among others all have a
strong interest in the future of manufacturing and would need to have a degree of ownership
of it. It is critical that governance arrangements are agreed which allocate responsibility for
developing, implementing, monitoring and modifying the strategy. From an organisational
perspective, SEMMA is best positioned to take on this role. However it is critical that this
responsibility is agreed among a clear majority of stakeholders, not just assigned without
consultation and engagement.
Resources to support the strategy are likely to be modest and hence it is critical that existing
resources are well focused and coordinated. The most likely scenario is that organisations
that ‗sign on‘ to the strategy will do so because they already undertake activities which are
congruent with it, perhaps fine tuning them for more precise alignment. On the other hand
resources will become available over a decade long period and it is important that regional
bodies be ready to make full use of these as the opportunities arise. Focussing on a few
central themes and co-ordinating the strategy across a broad range of allied bodies will
make it easier to marshal resources as they become available and to direct these to the
strategic goals.
7.6 Timeframe The business of working with firms to help them lift their competitiveness is more analogous
to a journey than to a silver bullet. There are no interventions that could be reasonably
imagined that will rapidly raise the trajectory of manufacturing in South East Melbourne.
Rather a steady set of activities over time will build capabilities and create the greatest
likelihood of raising the level of growth in the sector.
This is an important point to understand as a strategy would involve a five to ten year
timeframe with a portfolio of activities. In embarking on a strategy, the proponents of this
project need to be confident that there is widespread interest and energy among
stakeholders and industry leaders to proceed. If this is not present, the risk is that the
venture will fail and any similar efforts in the future will struggle with a credibility problem.
Page | 83
8. Strategy and recommendations
A strategy is a plan to achieve a goal. In this project, SMRDAC and its partners SEMMA
and SEBN have sought the development of a strategy with the goal of encouraging the
growth of the region‘s manufacturing sector over the next ten to fifteen years. An unstated
objective is to maintain the region‘s employment in the manufacturing sector.
We believe the fundamental activity for the strategy is to assist firms upgrade and increase
their competitiveness in a global context with open markets. We suggest the most powerful
means by which this can be achieved is to increase the exposure of the best firms to other
firms in the region, strengthening both market and non-market linkages. We propose
focusing on the top performing firms – world class firms - and the cohort which have the
potential to become world class firms, which we have termed ‗contenders‘. World class firms
have the most valuable knowledge and insights, with the potential to lift the performance of
others. We have suggested a segmentation model in Section 7.3.2 to assist with this. In
proceeding with the strategy, we envisage a continuation of the many important and useful
activities now undertaken by regional bodies, but with some re-emphasis to engage more
strongly with the region‘s world class firms and ‗contenders‘.
For all the reasons we have outlined about the dynamic nature of markets and firms, we do
not believe the result of this project can be a set of actions that will rapidly achieve the
desired goal. The need is for an iterative and evolving approach which continues to lift
performance at the firm level by introducing new ideas and opportunities consistently, over
time. Our proposal is to identify a set of themes which will be enduring and provide ground
that can be re-tilled with a range of actions that can be adapted and expanded over the
years. The set of themes will be narrow to maintain focus and be consistent with resource
constraints. This does not mean that regional bodies should not be opportunistic and
become involved in activities as federal and state government initiatives are introduced. It
means however that regional bodies would aim to have a core base of objectives and work,
around a few key themes, that they will make a continuing focus of effort in the long term.
The themes chosen must be highly relevant to the future of viable manufacturing firms, that
is, they are necessary and capable of making a difference. The themes must also be clearly
linked to a vision that is shared by individual firms, with other actors in the region, and with
other levels of government. The themes must be relevant to the capabilities of regional
players and must not displace what would typically be the responsibility of others. It does
not mean that regional bodies must take sole responsibility for undertaking actions
performed under the strategy. But it is the regionally based organisations that will lead or
drive the initiatives and partner with others where it is appropriate.
Our analysis of global trends and drivers of change, matched against the results of our
survey of manufacturing firms in the South East Melbourne region, points to some areas
where a regionally focussed strategy would make a difference. Most of the elements of a
regionally based strategy are directed at supporting firms as they undertake change.

Page | 84
Some of the themes we propose have been the subject of previous attention. In the arena of
enterprise development there are no new initiatives, only new firms. Engaging firms and
stimulating them to invest in real change is a hard slog and can be discouraging for those
involved because there is often not a clear link between an initiative and an outcome. It may
be some years before upskilling or experience gained in one employment context is
productively applied, possibly elsewhere. It is important to continue to provide firms with
opportunities to expand knowledge and connections and accept it will not necessarily be
possible to measure the ultimate impact.
8.1 Theme 1: Shared vision of viable manufacturing of the future
The first step is to work towards and gain support for a vision of the manufacturing sector in
South East Melbourne in 2025. The vision would address the question: Why would
manufacturers want to be in South East Melbourne in 2025 rather than elsewhere in the
world?
This vision might be articulated as a growing, modern manufacturing sector that is globally
connected, resilient to cyclical change, and providing high value employment. The South
East Melbourne area contains a diverse portfolio of manufacturing activities and there is no
reason to identify particular industries such as food, transport equipment, information
technology and communications as being more desirable than others. Implicit in this vision
would be an understanding that all firms will need to evolve and change to be part of that
future and that many firms are currently poorly endowed to manage that.
A shared vision can only be created by manufacturing firms themselves, with facilitation and
support from regional bodies. Active participation from the senior managers of the best
regional manufacturing firms is critical in this regard. We would characterise the present
involvement of most senior managers of world class firms with regional bodies as ‗passive
engagement‘ rather than ‗active leadership‘. In Section 7.4 we have outlined the
characteristics that the body which takes responsibility for the strategy will need to exhibit.
One possible approach would be to seek an appropriate political leader – a Victorian
Minister or a Commonwealth Minister – to initiate a leadership group. Of the existing
regional bodies, SEMMA is best structured to be the vehicle for this activity because it is an
incorporated association, independent of government. Whichever body progresses the
strategy, it will involve a substantial body of additional work and resources will be needed to
bring the level of coordination and energy required. In the first instance it should be
SMRDAC‘s role to anchor the strategy within the South East Melbourne area by gaining
support from various stakeholder bodies, to promote it to the Victorian and Commonwealth
Governments, and to seek additional resources for its implementation.
Related to the vision is the possibility of branding for the region. The strength of South East
Melbourne might be as ‗home of Australia‘s supply chains‘, recognising the diverse spread of
industries resident there. Most regions which brand themselves around a manufacturing
capability have a strongly sectoral focus – hosiery, furniture, dental equipment, motor
Page | 85
vehicles aerospace and so on. The analysis of ABS data shows the profile of manufacturing
in South East Melbourne resembles that of Victoria as a whole, without major
specialisations. Our understanding is that effective regional branding needs to move beyond
general attributes which are common across regions and identify specific desirable features
which are uncommon, if not unique. This is an exercise beyond the scope of this project
which could be investigated and explored by SMRDAC in conjunction with other regional
bodies. If a branding initiative proceeded, the brand could also be applied to service delivery
within the region to create a sense of an integrated set of activities to achieve a specific goal.
The second step is to be able to answer the question: Who speaks for manufacturing firms
in Melbourne‘s South East? The present situation is that several bodies might be thought to
do this. This weakens messages from the region and makes it more difficult to influence
decision making processes. The body which is responsible for implementing the strategy
should be the body which is recognised as speaking for regional manufacturers. It is
important that the lead implementation body is agreed in consultation with key stakeholders
which will need to respect its role.
A third step is for regional bodies to acknowledge that there are numerous organisations
offering different types of support to firms. Individual firms often don‘t understand nor indeed
are interested in where the boundaries between agencies occur. One of the pre-conditions
for successful development and prosecution of a strategy will be for regional groups to
accept that effective actions will involve an approach in which they collaborate with other
actors. We observe there is a lack of conceptual and program integration between the local,
state and Commonwealth players in the field. Given the available resources, the chances of
delivering a better outcome for manufacturers in the region is small without shared outlooks,
goals and actions.
8.2 Theme 2: Global outlook
8.2.1 Global view
The majority of the key manufacturing firms in the South East Melbourne are SMEs which
have grown up in a relatively protected environment and/or in supply chains that have had a
strong focus on the domestic market. As a result the understanding of business leaders of
best-in-class manufacturing practice, of technological and business trends, and of markets
tends to be more limited than competitors in Europe, North America and parts of Asia. While
this is often addressed in activities conducted by bodies such as SEMMA / SEBN, AiG,
Enterprise Connect, and DBI its delivery to firms in a region like South East Melbourne tends
to be uncoordinated instead of part of an integrated medium to longer term strategy. By
adopting this as a strategic theme regional bodies can help to play a part in establishing a
vibrant, challenging culture on the development of manufacturing. Establishing a global view
helps to set the tone for business leaders to think about manufacturing issues and
possibilities in a more open and expansive way.

Page | 86
A global view would recognise the increasing importance of added value services in markets
served by manufacturers, the limited potential for firms in South East Melbourne to rely on
price/cost as the source of competitive advantage, and the need for some faster growing
SMEs to overcome the constraints of second generation ownership and management to
achieve their potential.
Actions that would be used in pursuit of this theme include providing platforms and forums
for discussing future manufacturing issues which are pushing the frontiers of knowledge
among the leaders of local firms. This might involve conducting and supporting local events
with guest speakers with a global view (manufacturing leaders from outside the region,
academics and other experts).
A global view would also recognise that geographic boundaries do not always provide the
most appropriate basis for analysis and strategy development. Manufacturers in the Monash
and Knox local government areas in particular, although not formally part of the Southern
Melbourne RDA region, are an essential part of the manufacturing centre of gravity in South
East Melbourne. These firms share many of the same characteristics and experiences, and
are confronting similar challenges. It would be desirable for the key bodies in the Southern
Melbourne RDA area to involve Knox and Monash in strategy development and
implementation.
8.2.2 Global connections
Part of establishing and sustaining a global view involves business level contact with
international businesses. Regional bodies can help SMEs in South East Melbourne to build
connections with international businesses and reinforce a mentality of upgrading capabilities
as part of gaining a stronger position in global supply chains. Connecting with leading
international businesses is important for SME manufacturers in understanding the drivers of
change in technologies and business models. Manufacturing firms in South East Melbourne
have limited opportunities to make connections to international businesses. Regional bodies
can provide venues and forums for Austrade and Victorian Government agencies to bring
international business groups to South East Melbourne, as well as working up initiatives
involving the locally based arms of leading international businesses (eg pharma, transport,
electronics, ICT).
8.3 Theme 3: Encouraging a culture of change
As noted throughout this report change has been a prevailing feature of the manufacturing
sector in Australia, Victoria and South East Melbourne over the past twenty years. Looking
ahead over the next fifteen years we have identified significant drivers of change to come.
Naturally, industries experiencing pressure to change will seek to resist those forces, to
prolong employment and current business operations. Regional bodies often get called on
by stakeholders to support firms when they encounter forces of change. While change is
uncomfortable and does have visible and immediate costs it makes more sense for regional

Page | 87
bodies to project a mindset that embraces change and helps labour and capital resources to
respond as quickly as possible to market signals. To remain competitive, to innovate and
grow in a dynamic global economy, manufacturers in South East Melbourne will be required
to undertake change. It is important that regional bodies and their leaders adopt this
standpoint in strategy development and implementation, and communications.
One of the biggest changes confronting South East Melbourne manufacturers competing in
the global economy is the question of scale. To improve their viability many firms will need
to find ways to move beyond the capital and leadership constraints of second generation
businesses. This will involve finding ways to add capacity and / or capability to existing
businesses, through co-operative arrangements, joint ventures, mergers and takeovers.
Ultimately this will be determined by market mechanisms but actions at the regional level
may help to introduce business owners to a wider range of possibilities. Regional bodies
should be alert to the need for SMEs to grow through co-operative and merged business
activities and provide networking opportunities to encourage the formation of alliances.
Models derived from Rodin Genoff‘s work in North Adelaide might be useful in this regard.
8.4 Theme 4: Building on the strength of existing bodies
South East Melbourne already has robust institutions at the local level to support
manufacturing. Notable among these are SEBN, SEMMA and, more recently, SEMIP.
These bodies, particularly SEBN and SEMMA, have achieved a strong brand identity, and
are associated with the ―heartbeat‖ of manufacturing in the region. This gives them great
advantage in leading and supporting change among local manufacturers. To advance the
strategy it will be essential for these groups to embrace it fully.
As mentioned above, the region also has some excellent manufacturing firms and some
inspirational manufacturing leaders – the project survey work has produced an initial listing
of admired firms as a starting point.
Regional bodies could make a greater contribution in strengthening the leadership skills
among manufacturers in the region. This could be achieved by offering networking and
other business improvement services in ways which draws in more of the eminent business
leaders in the region. Under the current approach the full potential of this leadership cohort
is not captured and this is a loss to the region. The scarce time of these business leaders
tends to be directed towards activities where there is a benefit from participation. If more
events were grouped according to relative capabilities there is more chance there will be a
flow of networking benefits to leaders who participate and participation levels will increase.
A dynamic version of this model would involve a form of graduation so that as business
leaders extended their capabilities they would advance to the next group.
There are multiple benefits from this approach. Firstly the leadership skills of more
successful manufacturers are being harnessed for the good of the region. Secondly, there is

Page | 88
more probability of leadership skills being upgraded through peer based learning and contact
than in an unstructured group situation.
The services offered by groups like SEBN and SEMMA should be directed at building the
leadership and management capabilities of manufacturers in the regions and helping to
create supplier networks. The focus on leadership skills should be in the core areas of
corporate strategy, business models, planning and development, global value and supply
chains, and business innovation. Wherever practicable, SEBN, SEMMA and the economic
development units in nearby LGAs should partner with government and non-government
bodies to bring these services to regional manufacturers. Interaction with the Victorian
Government and its agencies is an important part of building wider ownership of and
commitment to the strategy.
On supply chains the aim should be to deepen the understanding of local manufacturers of
global value chains. Value chains are already changing in character in response to further
globalisation pressures. Regional bodies like SEBN and SEMMA can extend the work they
already do in this area by conducting case studies, helping to develop supplier networks by
extending information on local capability, working with primes, systems integrators and tier 1
suppliers to maintain a contemporary flow of intelligence on global supply chains, and
establishing and working with existing learning groups to transfer knowledge from local arms
of global firms to regional suppliers. Other activities could include industry days hosted by
locally based primes and tier 1s, encouraging the development of a local chapter of the
Association for Manufacturing Excellence, operating a sub-group similar to the Engineering
Network Geelong to encourage collaboration on major project work, and forming closer links
with ICN to expose opportunities around Australia. Our survey results showed that many
South East Melbourne manufacturers have aspirations to diversify into new products and
markets but this is not often backed by specific plans.
SEMIP has great potential as a means for some local manufacturers to harness the
technological and innovative power located around the Monash University and CSIRO
campus in Clayton. SEMIP is a relatively new body. Activities to date include an innovation
showcase and the operation of a knowledge club. SEMIP will however need to maintain a
proactive stance to extend and deepen its reach across the South East Melbourne
manufacturing sector. Within the South East Melbourne region there are differences in the
culture of manufacturing firms and their absorptive capacity. SEMIP has a comfort zone with
firms in the precinct around the Monash / CSIRO campus. It needs to extend its showcase
activities into Dandenong, Casey and Frankston areas to cultivate relationships with the
sorts of manufacturers in these areas. An industry-led approach to SEMIP which included
organisations with an appropriate absorptive capacity could be a good way to start this type
of engagement.
Page | 89
8.5 Theme 5: Leadership and management skills
Leadership and management of SMEs is probably the most significant determinant of the
viability of firms. Management and leadership flows across all functional areas of the
business – planning and strategy, business development, marketing, supply chain
management, production and operations. We would rate it as the single most important area
for improvement and upskilling, yet the survey work indicates that senior managers are likely
to be less aware of their own needs in this area. They are good at identifying specific trade
level skills needed in production but often blind to their own limitations. It is vital that local
business leaders maintain currency with leading edge manufacturing trends and business
models or there is a serious risk that the capabilities needed to compete will be lost.
This is an area where actions at regional level can be particularly influential. Because of
time pressures leaders of SMEs are more likely to attend events which are held locally so
there is a greater opportunity for regional bodies to build a long term agenda in this field.
Peer learning models have proven to be particularly powerful as a path to improving
leadership and management skills. Once again logistics suggests that operating peer
learning models at a local level will increase the likelihood of participation and help to
reinforce a culture of improvement. Actions to support development of leadership and
management skills can be implemented both as standalone events by SEMMA and SEBN,
and in collaboration with other a range of other organisations such as DBI, Enterprise
Connect, Austrade, AusIndustry, Innovation Insights, tertiary education bodies, professional
bodies, and high performance consortia. The models of High Performance Consortium
(HPC) and by the Business Improvement Groups (BIG) sponsored originally by RMIT may
provide some models to work with. In the former case, the model shows a long term
facilitated engagement which has built trust between the firms to the point where they
collectively assist in problem solving. The latter model is a lighter-touch example in which
firms sign up for an eight week commitment around a specified set of issues. Our survey
results suggest that using peer based learning models to build a stronger skills base in
exporting has potential to yield results.
Over a ten to fifteen year period the leadership cohort in South East Melbourne will turnover
and refresh. To be effective strategies to build leadership skills also need to target future
generations of business leaders. Actions that promote skills development and experience of
young managers need to be incorporated into the strategy. This might include setting up
young leader forums, mentoring arrangements, and a manufacturing mobility pool that would
allow younger employees with leadership potential to undertake rotations / placements in
workplaces other than their own.

Page | 90
8.6 Recommended Actions
Organisation Action References
1 SMRDAC Determine whether to proceed with a strategy taking into account the level of commitment from industry and other resources that will be required for implementation
6.4, 8.1
2 SMDRAC Promote strategy to regional stakeholders including Southern Melbourne LGAs, SEMIP, SEMMA, SEBN, Cities of Knox and Monash and other stakeholder
3 SMRDAC Advocate the strategy to State and Commonwealth Governments including offering briefings to relevant Ministers
4 SMRDAC Agree with stakeholders which body is responsible for the strategy
7.4, 7.5, 8.1
5 SMRDAC Seek funding from Commonwealth and Victorian Governments to assist in implementing the strategy
6 SMRDAC Establish a coordination mechanism to improve integration of service delivery to manufacturing firms. The minimum position should be regular meetings of DBI, Austrade, SEMMA, SEBN, SEMIP, AiG and Enterprise Connect.
7.5, 8.4
7 SMRDAC Build links for SEBN to similar bodies/LGAs in manufacturing areas such as South West Sydney, North Adelaide to exchange experience and ideas
8 SMRDAC Build links for SEMMA to similar bodies eg Geelong Manufacturing Council (GMC), HunterNet to exchange experience and ideas
9 Lead implementation body
Harness senior personnel from world class firms 6.4, 7.4
10 Lead implementation body
Facilitate 2025 vision for manufacturing in the region articulating clear competitive advantages
7.1
11 Lead implementation body
Avoid sector based strategy; focus on firm capability and building linkages to world class firms in the region
7.3.1
12 Lead implementation body in conjunction with SMRDAC and LGAs
Flowing from the establishment of a vision for manufacturing in the region, consider whether a branding exercise is appropriate
8.1
13 Lead implementation body
Approach SEMIP/CSIRO/Monash to run industry showcases in Dandenong and other parts of the region
14 Lead implementation
Identify world class firms in South East Melbourne and seek to engage and brief at least the top 50
7.3.2
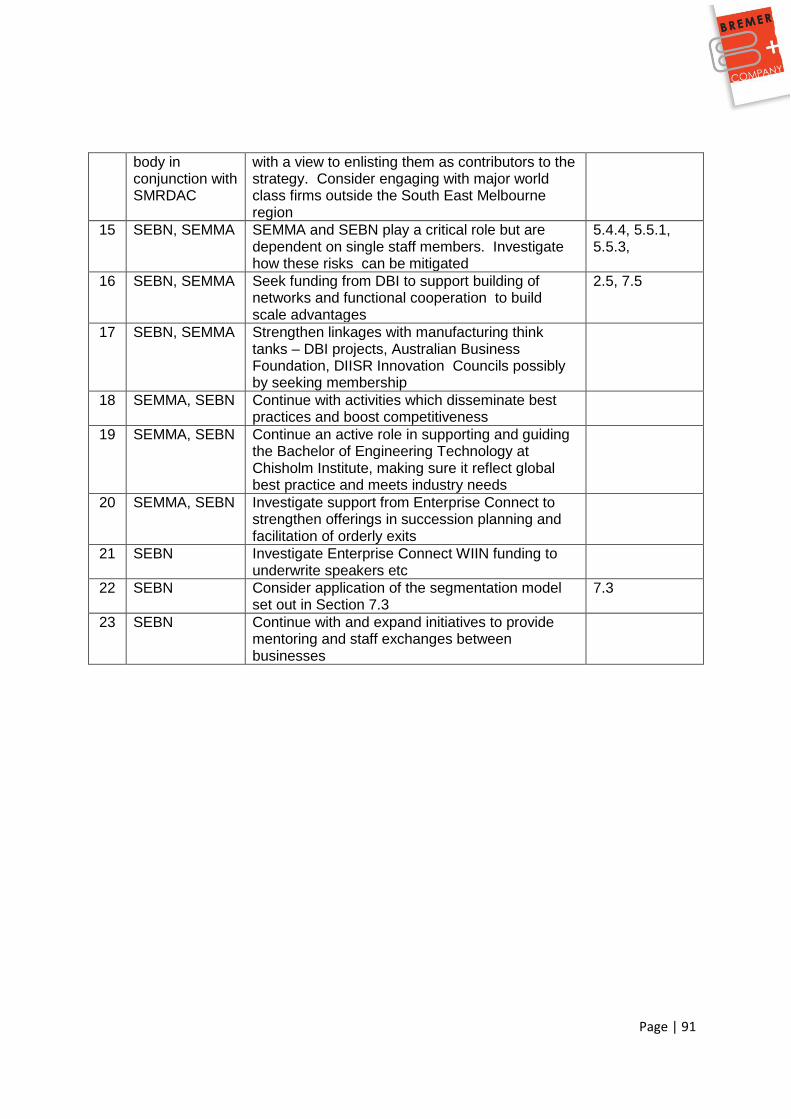
Page | 91
body in conjunction with SMRDAC
with a view to enlisting them as contributors to the strategy. Consider engaging with major world class firms outside the South East Melbourne region
15 SEBN, SEMMA SEMMA and SEBN play a critical role but are dependent on single staff members. Investigate how these risks can be mitigated
5.4.4, 5.5.1, 5.5.3,
16 SEBN, SEMMA Seek funding from DBI to support building of networks and functional cooperation to build scale advantages
2.5, 7.5
17 SEBN, SEMMA Strengthen linkages with manufacturing think tanks – DBI projects, Australian Business Foundation, DIISR Innovation Councils possibly by seeking membership
18 SEMMA, SEBN Continue with activities which disseminate best practices and boost competitiveness
19 SEMMA, SEBN Continue an active role in supporting and guiding the Bachelor of Engineering Technology at Chisholm Institute, making sure it reflect global best practice and meets industry needs
20 SEMMA, SEBN Investigate support from Enterprise Connect to strengthen offerings in succession planning and facilitation of orderly exits
21 SEBN Investigate Enterprise Connect WIIN funding to underwrite speakers etc
22 SEBN Consider application of the segmentation model set out in Section 7.3
7.3
23 SEBN Continue with and expand initiatives to provide mentoring and staff exchanges between businesses

Page | 92
APPENDIX A: STAGE 1: Document scan
Bayside City Council Economic Development Best Value Service Review. September 2005
Bayside City Council Economic Development Strategy November 2010
City of Casey Business Attraction Policy. Version 1.3, 2005
City of Greater Dandenong Economic Development Strategy, September 2005
City of Kingston Industrial Strategy – November 2007
City of Monash Economic Development Strategy 2008 – 2012
Dandenong Industrial Change and Demand Study
Dandenong Development Board: Dandenong Industry and Labour Market – 2006 Census
and Indicators Update Project. NIEIR February 2009
Dandenong Development Board, City of Greater Dandenong, Department of Innovation,
Industry and Regional Development. Report on the Greater Dandenong Planning Scheme.
December 2007
Department of Business and Innovation: Labour market study of Dandenong
Frankston City Economic Development Strategy. Frankston City Council. February 2011
Glen Eira Business Support Strategy
Knox City Council: Knox Economic Development Strategy 2008-2018
Mornington Peninsula Shire – Economic Sustainability Strategy 2008-2013
South East Development. Cluster Identification Strategy – South East Region. August
2000.
South East Melbourne Manufacturers Alliance: Submission to the VCEC Manufacturing
Review, 2011
Victorian Competition and Efficiency Commission. Victoria‘s productivity, competitiveness
and participation: Interstate and international comparisons. ACIL Tasman, June 2011
Victoria, Department of Sustainability and Environment: Melbourne 2030: Planning for
Sustainable Growth
Prosperity for the Next Generation: Regional Economic Strategy for Melbourne‘s South East
2003-2030. Ratio Consultants, SGS Economics and Planning, National Economics

Page | 93
Prosperity for the Next Generation: Regional Economic Strategy for Melbourne‘s South East
2009-2030. SGS Economics and Planning, Compelling Economics, January 2009

Page | 94
REFERENCES
Ammirato, Piero, Anand Kulkami and David Latina. Clusters: Victorian Businesses
Working Together in a Global Economy. Victoria. Department of Innovation, Industry and
Regional Development Melbourne. 2003
Australia. Department of Innovation, Industry, Science and Research. Global
Integration Research Papers, Canberra, 2007
Australia. Department of Innovation, Industry, Science and Research. Future
Manufacturing Council Strategic Roadmap, Canberra,
Australia. Department of Innovation, Industry, Science and Research. Collaboration
and Other Factors Influencing Novelty in Australian Business, Canberra 2006
Australia. Department of Innovation, Industry, Science and Research. Australian
Facilities, Capability and Infrastructure: Manufacturing Industry, Canberra, July 2008
Australia. Department of Innovation, Industry, Science and Research. Industry
Innovation Councils, Canberra, 2010.
Australia. Department of Innovation, Industry, Science and Research. Australian
Innovation System Report, 2011. Canberra, 2011.
Australian Chamber of Commerce and Industry. The Future of Australia‘s Manufacturing
Sector: A Blueprint for Success, Canberra, 2007.
Australian Business Foundation. Selling Solutions: Emerging Patterns of Product-Service
Linkage in the Australian Economy. Australian Expert Group in Industry Studies, Sydney,
2002.
Australian Business Foundation. Alternative Futures: Scenarios for Business in Australia
to the Year 2015, Sydney 1999
Australian Business Foundation. Manufacturing Futures – A Paper for the NSW Business
Chamber, April 2011.
Australian Industry Group. Innovation: New Thinking, New Directions. 2010
http://www.aigroup.com.au/portal/binary/com.epicentric.contentmanagement.servlet.Content
DeliveryServlet/LIVE_CONTENT/Publications/Reports/2010/9256_innovation_review_report
_web.pdf
East of England Development Agency. Manufacturing Strategy
www.eeda.org.uk/files/executive_summary.pdf
Formica, Piero. Industry and Knowledge Clusters: Principles, Practices, Policy. Tartu
University Press. 2002

Page | 95
Gann, D & Dodgson, M. Innovation technology – How new technologies are changing the
way we innovate, NESTA Provocation 05: September 2007
Genoff, Rodin and Graeme Sheather, Engineering the Future, Central Denmark Region,
2010
Genoff. Rodin. Northern Denmark, Northern Connections for the ICT and Engineering
Clusters, (Aalborg Cooperation, Denmark, 2010).
Genoff, Rodin. Clusters and the Dynamics of Growth, (2012 forthcoming).
Green, Roy., Renu Argawal. Management Matters in Australia: Just how productive are we? Australia Department of Innovation, Industry Science and Research. Canberra. 2009
Liesch, P., Steen, M., Middleton, S.,Weerawardena, J. Born to be Global: a closer look at
the international venturing of Australian born global firms. Australian Business Foundation,
2007
OECD. Competitive Regional Clusters: National Policy Approaches. Paris. 2007.
OECD. Revised Field of Science and Technology (FOS) Classifications in the Frascati
Manual. Paris. 2007.
Parliament of Victoria. Economic Development and Infrastructure Committee. Inquiry into
Manufacturing in Victoria. 2010
Porter, Michael E. The Competitive Advantage of Nations. Palgrave. Basingstoke. 1998.
Roos, Goran. Manufacturing into the Future 2011
http://www.thinkers.sa.gov.au/lib/pdf/Roos/PresentationFullv5wip.pdf
Rosenfeld, Stuart. Creating Local Wealth, Opportunity and Sustainability through Local
Clusters. Regional Technology Strategies. Carrboro, NC. 2009.
Scott Kemmis, Don. Business Model Innovation. Unpublished draft report prepared for
Australian Business Foundation, 2011
Victoria, Department of Innovation, Industry and Regional Development. Victorian
Action Plan for Small Technologies: Bringing big benefits to industry and the community.
Melbourne, April 2010.
Victoria, Department of Business and Innovation. Unpublished technology roadmaps for
o Medical, scientific, industrial and medical instruments
o Fine chemical-based manufacturing
o Health and care
o Transportation and supporting systems
o Education services
o Food processing and beverages
o Packaging, pulp, paper and recycling
o Green building and construction

Page | 96
Victorian Competition and Efficiency Commission. Victorian Manufacturing: Meeting
the Challenges. Draft report of the inquiry in Victoria‘s manufacturing industry, June 2011
Victorian Competition and Efficiency Commission. Victoria‘s productivity,
competitiveness and participation: Interstate and international comparisons. ACIL Tasman,
June 2011

Page | 97
ENDNOTES
1 Victorian manufacturing: Meeting the challenges. Inquiry into a more competitive Victorian manufacturing industry. Victorian Competition and Efficiency Commission, June 2011 2 Curtis D. Spencer and Steve Schellenberg, Trends in Global Manufacturing, Goods
Movement and Consumption, and Their Effect on the Growth of United States Ports and Distribution. Prepared for and Funded by the NAIOP Research Foundation September 2010. IMS Worldwide, Inc., Webster, Texas 3 Additive Manufacturing is a digital manufacturing process that can be used to ―print‖ fully
functional parts direct from virtual 3D data that can be generated with most CAD software packages or any 3D scanner. See: website for the Pacific Additive Manufacturing Forum, http://www.pamf.org.au/what-additive-manufacturing 4 Gann, D & Dodgson, M, Innovation technology – How new technologies are changing the
way we innovate, NESTA Provocation 05: September 2007, pp. 4-5. 5 Reproduced in Australian Business Foundation, Manufacturing futures – A paper for the
NSW Business Chamber, April 2011, p. 15. 6 ABS Cat No. 8165
7 http://money.cnn.com/magazines/fortune/global500/2011/
8 www.chishol.edu.au/engineering
9 Regional Plan: A framework for supporting growth and sustainability in Melbourne‘s South. Southern Melbourne RDA, August 2010. 10 Prosperity for the Next Generation: Regional Economic Strategy for Melbourne‘s South East 2009-2030. SGS Economics and Planning, Compelling Economics, January 2009 11 City of Greater Dandenong Economic Development Strategy, September 2005 12 Dandenong Development Board, City of Greater Dandenong, Department of Innovation, Industry and Regional Development. Report on the Greater Dandenong Planning Scheme. December 2007 13
City of Kingston Industrial Strategy – November 2007 14
South East Development Cluster Identification Strategy – South East Region. Final Report, August 2000. SGS Urban Economics and Planning.