funds’ use of options and volatility instruments new studies and ... · funds’ use of options...
TRANSCRIPT
Funds’ Use of Options and Volatility
Instruments
New Studies and Benchmark Indexes
Jan
By Matt Moran , VP, CBOE 1-312-786-7249

CBOE 2
Funds and Use of Options or Volatility
1. Goldman Sachs - Mutual Fund Use of Options (2012 and
2014)
2. Univ. of Augsburg - The Benefits of Option Use by Mutual
Funds (2015)
3. Keith Black and Edward Szado. Performance Analysis of
Options-Based Equity Mutual Funds, CEFs, and ETFs
(2015) www.cboe.com/funds
4. Four New CBOE Eurekahedge Volatility Indexes that
measure the performance of hedge funds that employ
volatility-based investment strategies (2015).
www.cboe.com/EH

CBOE 3
Goldman Sachs - Papers on Mutual Fund Use of Options (2012 and 2014) – Below are highlights from 2014 paper by John Marshall
FUND FAMILIES. Five of the top 15 fund families now have funds that use options.
FUNDS. At least 196 funds use options, and these 196 funds had more than $480 billion in
assets under management at the end of 2013.
STRATEGIES. The % of positions held by mutual funds in each options strategy – 64% in
short calls, 22% in short puts, 8% in long puts, and 6% in long calls.
MATURITIES. About 47% of short-options positions had a maturity of 30 days or less, while
about 40% of long-options positions had a maturity of 30 days or less.
TYPES OF OPTIONS. Over the past two years, fund usage of both single-stock options and
index options has grown, while fund usage of ETF options has decreased.
GROWTH IN ASSETS. Over the past 5 years, assets under management for the option-using
funds have grown 160%, versus 110% growth for their peer funds that do not use options.
STRONGER PERFORMANCE. Over the 5-year period ending March 4, 2014, the funds that
used options had higher returns, lower volatility, and higher risk-adjusted returns than their
peer funds that do not use options.
Past performance is not predictive of future returns.
Please see the last slide for important disclosures.

CBOE 4
Univ. of Augsburg – Paper on The Benefits of Option Use by Mutual Funds (2015)
Use of options by mutual funds yields higher risk-adjusted
performance compared with nonuser funds.
Option user funds show significantly lower systematic risk because
they use options mainly for hedging strategies and not for speculation.
We base our analysis on a large, comprehensive and previously
unused sample of the SEC’s mandatory N-SAR filings.
Consistent with covered call strategies for income generation, we
show that mutual funds’ short positions are the main drivers of the
performance-enhancing effect.
On the other hand, consistent with protective put strategies for
hedging, long option positions are the predominant contributors to the
risk-reducing effect of options.
Authors - Markus Natter, Martin Rohleder, Dominik Schulte, and
Marco Wilkens
http://bit.ly/Augs-MutFd-Opt Past performance is not predictive of future returns.
Please see the last slide for important disclosures.
CBOE 5
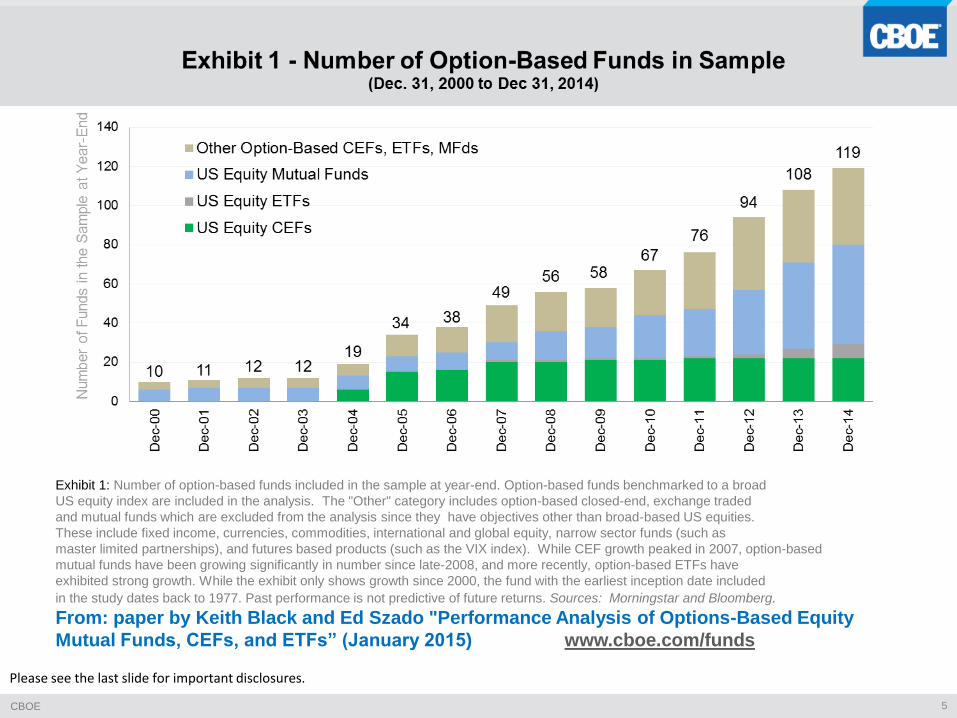
Exhibit 1: Number of option-based funds included in the sample at year-end. Option-based funds benchmarked to a broad
US equity index are included in the analysis. The "Other" category includes option-based closed-end, exchange traded
and mutual funds which are excluded from the analysis since they have objectives other than broad-based US equities.
These include fixed income, currencies, commodities, international and global equity, narrow sector funds (such as
master limited partnerships), and futures based products (such as the VIX index). While CEF growth peaked in 2007, option-based
mutual funds have been growing significantly in number since late-2008, and more recently, option-based ETFs have
exhibited strong growth. While the exhibit only shows growth since 2000, the fund with the earliest inception date included
in the study dates back to 1977. Past performance is not predictive of future returns. Sources: Morningstar and Bloomberg.
From: paper by Keith Black and Ed Szado "Performance Analysis of Options-Based Equity
Mutual Funds, CEFs, and ETFs” (January 2015) www.cboe.com/funds
Please see the last slide for important disclosures.

CBOE 6
Exhibit 2: Cumulative monthly total return since January 1, 2000 for a monthly rebalanced equally weighted portfolio of Options-Based Funds,
the BXM index and various traditional indices. Performance is scaled to represent a starting value of $100 at the market close on December 31, 1999
for all indices. Performance of the Equally Weighted Option-Based Fund Portfolio closely tracks the BXM index. The Equally Weighted Option-Based
Fund Portfolio returns are calculated by averaging the returns across all constituents in the sample available at each month-end. The number of funds
included in the calculation grows monthly as new funds enter the sample. Past performance is not predictive of future returns. www.cboe.com/funds
Sources: Bloomberg and Morningstar
"Performance Analysis of Options-Based Equity Mutual Funds, CEFs, and ETFs” (January 2015) Please see the last slide for important disclosures.
Options-Based Funds and Stock Indices –
Cumulative Growth of $100 (Jan. 1, 2000 to Dec. 31, 2014)

CBOE 7
• Exhibit 4: In addition, Options-Based Funds had a lower standard deviation than the S&P 500 Index
• Sources: Morningstar and Bloomberg. Past performance is not predictive of future returns. www.cboe.com/funds
"Performance Analysis of Options-Based Equity Mutual Funds, CEFs, and ETFs” (January 2015) Please see the last slide for important disclosures.
CBOE 8
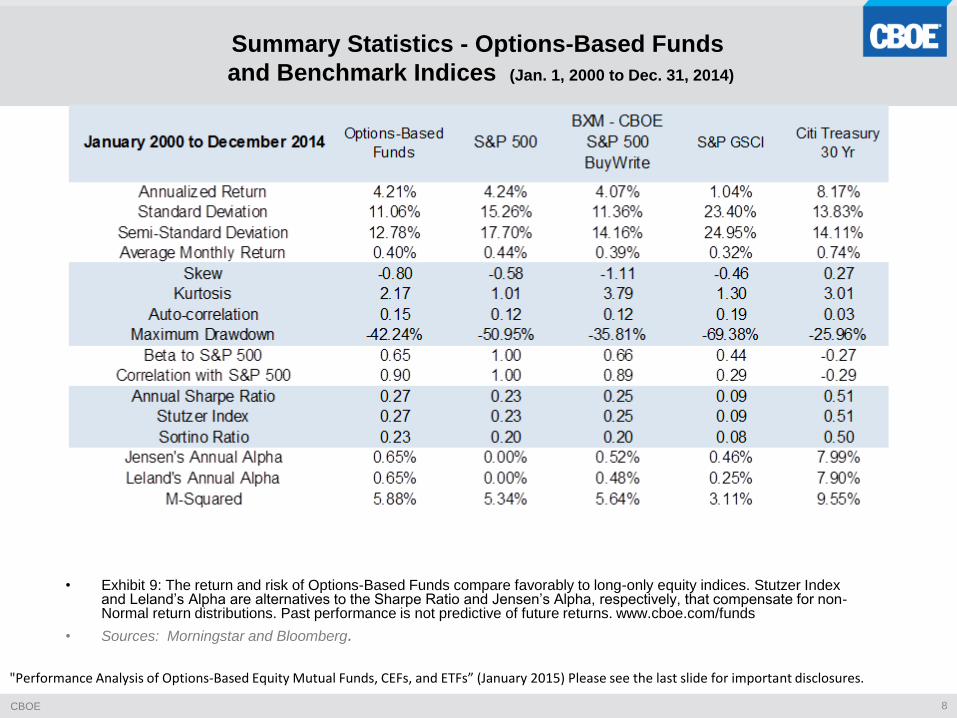
Summary Statistics - Options-Based Funds
and Benchmark Indices (Jan. 1, 2000 to Dec. 31, 2014)
• Exhibit 9: The return and risk of Options-Based Funds compare favorably to long-only equity indices. Stutzer Index and Leland’s Alpha are alternatives to the Sharpe Ratio and Jensen’s Alpha, respectively, that compensate for non-Normal return distributions. Past performance is not predictive of future returns. www.cboe.com/funds
• Sources: Morningstar and Bloomberg.
"Performance Analysis of Options-Based Equity Mutual Funds, CEFs, and ETFs” (January 2015) Please see the last slide for important disclosures.

CBOE 9
• Exhibit 12: The exhibit provides the annual average distribution yield calculated as the total distributions for each fund over a
calendar year divided by the ending price of the fund for the previous year, and averaged across all funds in the Options-Based
Funds index. Past performance is not predictive of future returns. www.cboe.com/funds
• Sources: Morningstar and Bloomberg.
"Performance Analysis of Options-Based Equity Mutual Funds, CEFs, and ETFs” (January 2015) Please see the last slide for important disclosures.

CBOE 10
Exhibit 14: Cumulative monthly total return since July 1, 1988 for the BXM index and various traditional indices. Performance is scaled
to represent a starting value of $100 on June 30, 1988 for all indices. Past performance is not predictive of future returns.
www.cboe.com/funds Sources: Bloomberg and Morningstar.
"Performance Analysis of Options-Based Equity Mutual Funds, CEFs, and ETFs” (January 2015) Please see the last slide for important disclosures.
Index Cumulative Growth of $100
Since Mid-1988 – Benchmark Indices (Jul. 1, 1988 to Dec. 31, 2014)

CBOE 11
Summary Statistics Table Since Mid-1988 –
Benchmark Indices (Jul. 1, 1988 - Dec. 31, 2014)
• Exhibit 18: BXM, PUT, and BXY had a positive alpha and a lower standard deviation of returns than the S&P 500 Index.
• Sources: Morningstar and Bloomberg. Past performance is not predictive of future returns. www.cboe.com/funds
"Performance Analysis of Options-Based Equity Mutual Funds, CEFs, and ETFs” (January 2015) Please see the last slide for important disclosures.
CBOE 12
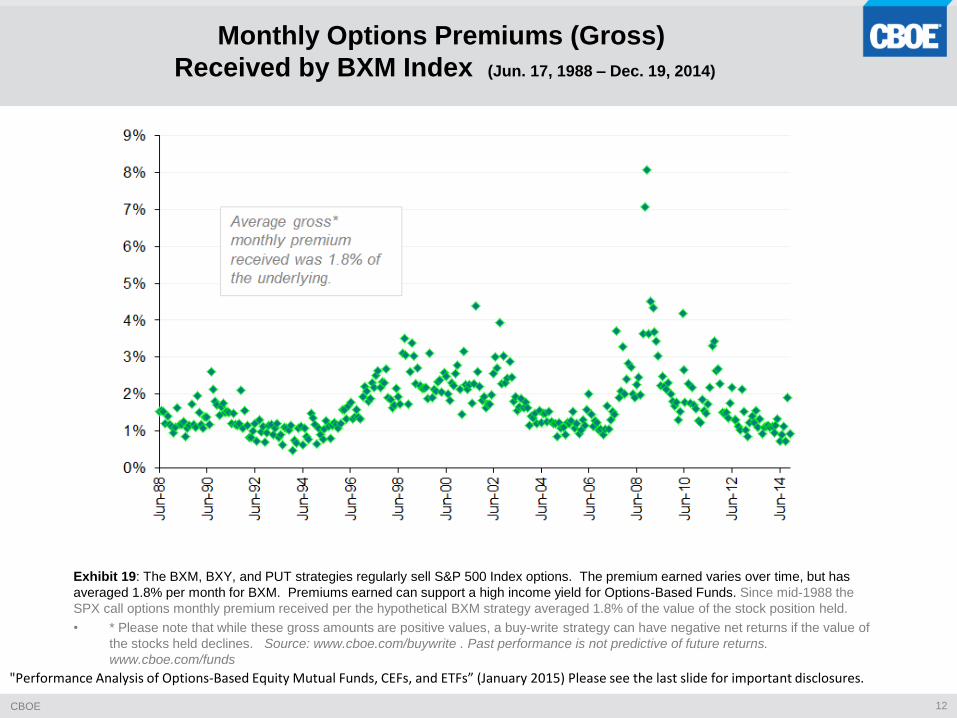
Exhibit 19: The BXM, BXY, and PUT strategies regularly sell S&P 500 Index options. The premium earned varies over time, but has
averaged 1.8% per month for BXM. Premiums earned can support a high income yield for Options-Based Funds. Since mid-1988 the
SPX call options monthly premium received per the hypothetical BXM strategy averaged 1.8% of the value of the stock position held.
• * Please note that while these gross amounts are positive values, a buy-write strategy can have negative net returns if the value of
the stocks held declines. Source: www.cboe.com/buywrite . Past performance is not predictive of future returns.
www.cboe.com/funds
"Performance Analysis of Options-Based Equity Mutual Funds, CEFs, and ETFs” (January 2015) Please see the last slide for important disclosures.
Monthly Options Premiums (Gross)
Received by BXM Index (Jun. 17, 1988 – Dec. 19, 2014)

CBOE 13
Exhibit 21: Fund managers examine trading liquidity and capacity when considering investment vehicles. The approximate daily
notional value of trading in SPX options in 2014 can be estimated by multiplying the average daily volume (888,089 contracts) times
the value of the S&P 500 Index (average of 1931) times the $100 options contract multiplier, for a value of more than $170 billion per
day. Some investors use a delta-weighting multiplier to develop a more conservative estimate for notional value of options trading.
Sources: Bloomberg and CBOE. . www.cboe.com/funds
"Performance Analysis of Options-Based Equity Mutual Funds, CEFs, and ETFs” (January 2015) Please see the last slide for important disclosures.
Notional Value of Average Daily Volume
in S&P 500 (SPX) Options (in $ Billions) (2000-2014)

CBOE 14
Annual Returns - Options-Based Funds and
Benchmark Indices (1987 - 2014)
• Exhibit 22: Annual Returns for each year since 1987 of Options-Based Funds, options-based indices and traditional indices. Past performance is not predictive of future returns. www.cboe.com/funds
• Sources: Morningstar and Bloomberg. "Performance Analysis of Options-Based Equity Mutual Funds, CEFs, and ETFs” (January 2015) Please see the last slide for important disclosures.
CBOE 15
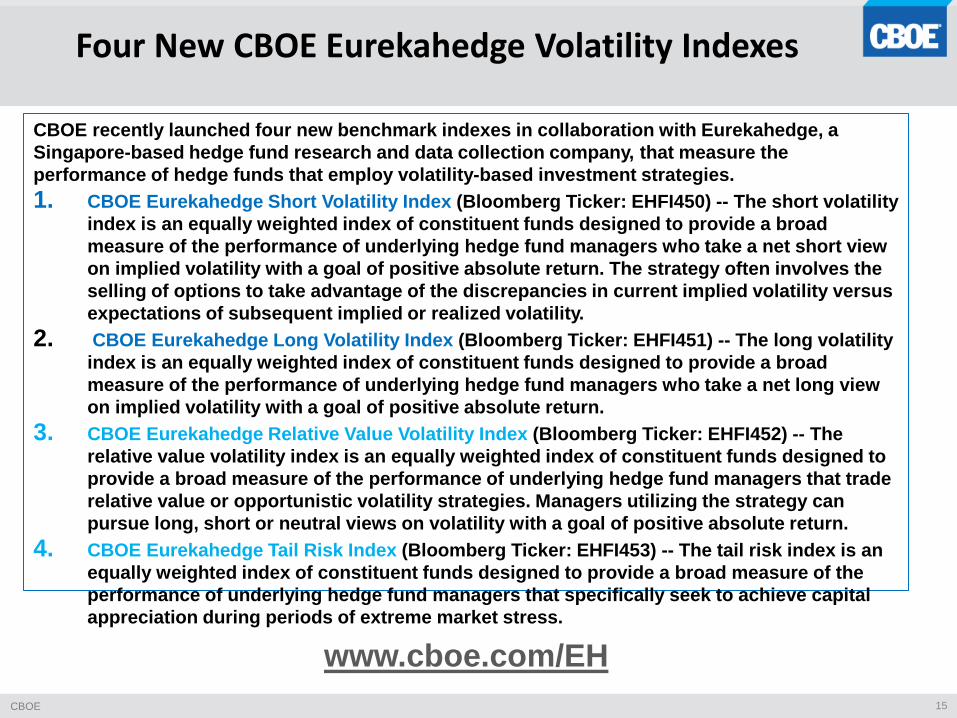
Four New CBOE Eurekahedge Volatility Indexes
CBOE recently launched four new benchmark indexes in collaboration with Eurekahedge, a
Singapore-based hedge fund research and data collection company, that measure the
performance of hedge funds that employ volatility-based investment strategies.
1. CBOE Eurekahedge Short Volatility Index (Bloomberg Ticker: EHFI450) -- The short volatility
index is an equally weighted index of constituent funds designed to provide a broad
measure of the performance of underlying hedge fund managers who take a net short view
on implied volatility with a goal of positive absolute return. The strategy often involves the
selling of options to take advantage of the discrepancies in current implied volatility versus
expectations of subsequent implied or realized volatility.
2. CBOE Eurekahedge Long Volatility Index (Bloomberg Ticker: EHFI451) -- The long volatility
index is an equally weighted index of constituent funds designed to provide a broad
measure of the performance of underlying hedge fund managers who take a net long view
on implied volatility with a goal of positive absolute return.
3. CBOE Eurekahedge Relative Value Volatility Index (Bloomberg Ticker: EHFI452) -- The
relative value volatility index is an equally weighted index of constituent funds designed to
provide a broad measure of the performance of underlying hedge fund managers that trade
relative value or opportunistic volatility strategies. Managers utilizing the strategy can
pursue long, short or neutral views on volatility with a goal of positive absolute return.
4. CBOE Eurekahedge Tail Risk Index (Bloomberg Ticker: EHFI453) -- The tail risk index is an
equally weighted index of constituent funds designed to provide a broad measure of the
performance of underlying hedge fund managers that specifically seek to achieve capital
appreciation during periods of extreme market stress.
www.cboe.com/EH
CBOE 16
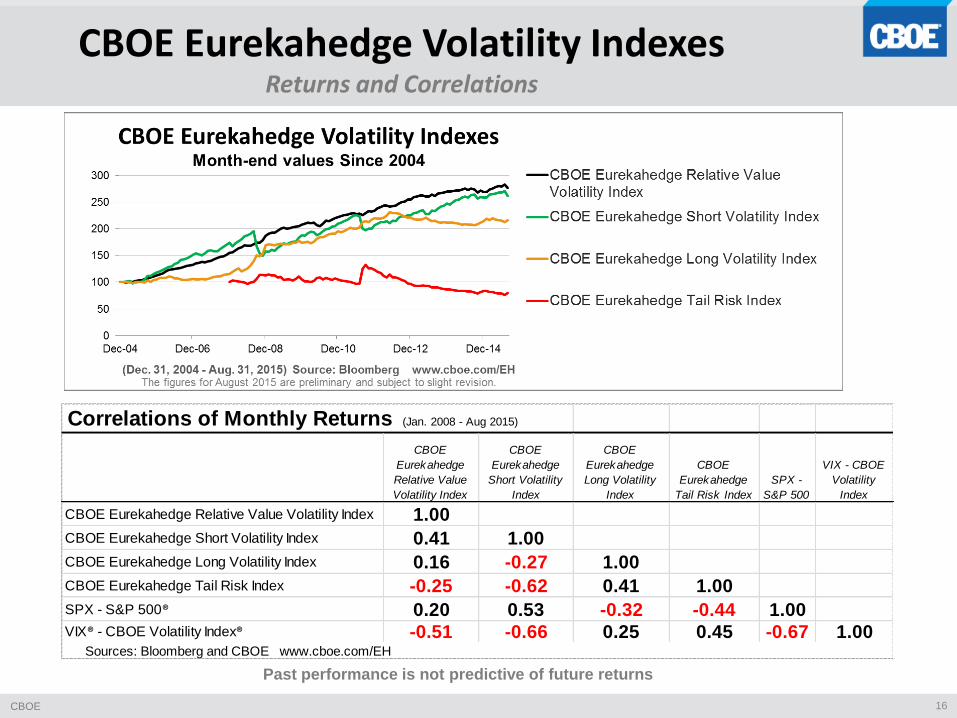
CBOE Eurekahedge Volatility Indexes Returns and Correlations
Correlations of Monthly Returns (Jan. 2008 - Aug 2015)
CBOE
Eurekahedge
Relative Value
Volatility Index
CBOE
Eurekahedge
Short Volatility
Index
CBOE
Eurekahedge
Long Volatility
Index
CBOE
Eurekahedge
Tail Risk Index
SPX -
S&P 500
VIX - CBOE
Volatility
Index
CBOE Eurekahedge Relative Value Volatility Index 1.00
CBOE Eurekahedge Short Volatility Index 0.41 1.00
CBOE Eurekahedge Long Volatility Index 0.16 -0.27 1.00
CBOE Eurekahedge Tail Risk Index -0.25 -0.62 0.41 1.00
SPX - S&P 500® 0.20 0.53 -0.32 -0.44 1.00VIX® - CBOE Volatility Index® -0.51 -0.66 0.25 0.45 -0.67 1.00 Sources: Bloomberg and CBOE www.cboe.com/EH
Past performance is not predictive of future returns

CBOE 17
Excerpts from Press Release by Eurekahedge (18 August 2015, with emphasis added)
In 2008 the global stock market went down 43% but long volatility funds
were up 46%.
After 7 years without a major correction in developed markets, investors
are increasingly looking at volatility and downside protection, so to that
end Eurekahedge are delighted to have teamed up with Chicago Board
Options Exchange to offer this new suite of indices to address investors’
demands.
The CBOE Eurekahedge Long Volatility and Tail Risk Indices were up
45.81% and 12.58% respectively in 2008, while underlying markets
floundered with the average hedge fund losing 9.77% during the year.
• A similar result was evident in 2011 when the Eurozone debt crisis
came to the fore over fears that a Greek exit was imminent, with the
average hedge fund declining 1.88% during the year. In contrast, long
volatility and tail risk funds were up 12.83% and 7.50% respectively.
Past performance is not predictive of future returns. Please see the last slide for important disclosures.

CBOE 18
Excerpts from Press Release by Eurekahedge (cont.) (18 August 2015, with emphasis added)
In the relative calm that has since ensured in the markets on the back of
active and coordinated intervention by various central banks, one
volatility strategy in particular has been quite profitable. The CBOE Short
Volatility Hedge Fund Index has consistently posted positive returns
since 2012 and has outperformed the main Eurekahedge Hedge Fund
Index consistently over this period.
However, one volatility strategy has produced results that have largely
been agnostic to the overall direction of volatility. With the exception of
2014, the CBOE Eurekahedge Relative Value Volatility Index has
consistently generated positive returns since 2005 with an annualised
return of 10.33% afforded at an annualised volatility of only 3.75%.
Among the funds listed in each index are funds offered by well-known
firms: 36 South Capital Advisors, Argentiere Capital, Artemis Capital
Management, Assenagon Asset Management, BlueMountain Capital
Management, Capstone Investment Advisors, Dominice & Co Asset
Management, Fortress Investment Group, Harvest Volatility Management,
JD Capital Management, Man Investments, Mariner Investment Group,
Parallax Volatility Advisers and Picton Mahoney Asset Management.
Past performance is not predictive of future returns. Please see the last slide for important disclosures.
CBOE 19
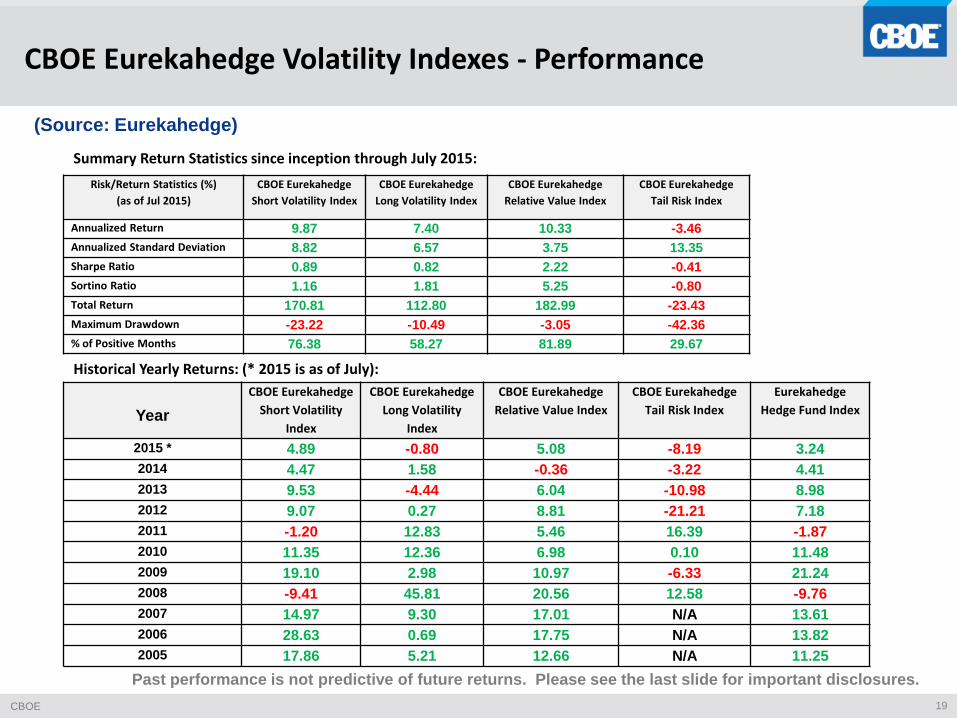
CBOE Eurekahedge Volatility Indexes - Performance
(Source: Eurekahedge)
Risk/Return Statistics (%)
(as of Jul 2015)
CBOE Eurekahedge
Short Volatility Index
CBOE Eurekahedge
Long Volatility Index
CBOE Eurekahedge
Relative Value Index
CBOE Eurekahedge
Tail Risk Index
Annualized Return 9.87 7.40 10.33 -3.46
Annualized Standard Deviation 8.82 6.57 3.75 13.35
Sharpe Ratio 0.89 0.82 2.22 -0.41
Sortino Ratio 1.16 1.81 5.25 -0.80
Total Return 170.81 112.80 182.99 -23.43
Maximum Drawdown -23.22 -10.49 -3.05 -42.36
% of Positive Months 76.38 58.27 81.89 29.67
Summary Return Statistics since inception through July 2015:
Year
CBOE Eurekahedge
Short Volatility
Index
CBOE Eurekahedge
Long Volatility
Index
CBOE Eurekahedge
Relative Value Index
CBOE Eurekahedge
Tail Risk Index
Eurekahedge
Hedge Fund Index
2015 * 4.89 -0.80 5.08 -8.19 3.24
2014 4.47 1.58 -0.36 -3.22 4.41
2013 9.53 -4.44 6.04 -10.98 8.98
2012 9.07 0.27 8.81 -21.21 7.18
2011 -1.20 12.83 5.46 16.39 -1.87
2010 11.35 12.36 6.98 0.10 11.48
2009 19.10 2.98 10.97 -6.33 21.24
2008 -9.41 45.81 20.56 12.58 -9.76
2007 14.97 9.30 17.01 N/A 13.61
2006 28.63 0.69 17.75 N/A 13.82
2005 17.86 5.21 12.66 N/A 11.25
Historical Yearly Returns: (* 2015 is as of July):
Past performance is not predictive of future returns. Please see the last slide for important disclosures.

CBOE 20
No. American Pension Funds
In July 2013 CalSTRS (California State Teachers Retirement System, with $140
billion in AUM) issued a request to investment managers for -- "Risk-Managed
Equity - Low Volatility Equity and Covered Call Strategies. … CalSTRS will consider
both active and passive covered call strategies benchmarked to the CBOE S&P 500
BuyWrite Index (BXM).”
“CalSTRS Putting in Place Low Vol Covered Call Program”, EQ Deriv., March 25,
2015.
In addition, The Santa Barbara County Employees Retirement System, the Hawaii
Employees Retirement System, the Los Angeles Department of Water and
Power Employees Retirement Plan, the Seattle City Employee Retirement System
and the Alaska Retirement Management Board are all in various stages of
adopting buy-write strategies benchmarked against the Chicago Board Options
Exchange's BXM index.
Large public pension funds in Texas, Wisconsin and Canada also are reported to
use options-based strategies.

CBOE 21
Important Disclosures
Options involve risk and are not suitable for all investors. Prior to buying or selling an option, a person must receive
a copy of Characteristics and Risks of Standardized Options. Copies are available from your broker, by calling 1-888-
OPTIONS or from the Options Clearing Corporation at www.theocc.com. The information in this presentation is
provided solely for general education and information purposes. No statement within this presentation should be
construed as a recommendation to buy or sell a security or to provide investment advice. The CBOE S&P 500
BuyWrite Index (BXMSM), CBOE S&P 500 2% OTM BuyWrite Index (BXYSM), CBOE Russell 2000 BuyWrite Index
(BXRSM), CBOE S&P 500 95-110 Collar Index (CLLSM) and CBOE S&P 500 PutWrite Index (PUTSM) (the “Indexes”)
are designed to represent proposed hypothetical buy-write strategies. Like many passive benchmarks, the Indexes
do not take into account significant factors such as transaction costs and taxes. Transaction costs and taxes for a
buy-write strategy could be significantly higher than transaction costs for a passive strategy of buying-and-holding
stocks. Investors attempting to replicate the Indexes should discuss with their brokers possible timing and liquidity
issues. Past performance does not guarantee future results. These materials contain comparisons, assertions, and
conclusions regarding the performance of indexes based on backtesting, i.e., calculations of how the indexes might
have performed in the past if they had existed. Backtested performance information is purely hypothetical and is
provided in this document solely for informational purposes. Back-tested performance does not represent actual
performance and should not be interpreted as an indication of actual performance. The methodology of the Indexes
is owned by Chicago Board Options Exchange, Incorporated (CBOE). This presentation should not be construed as
an endorsement or an indication by CBOE of the value of any non-CBOE product or service described in this
presentation. CBOE®, Chicago Board Options Exchange®, CBOE Volatility Index® Execute Success® and VIX® are
registered trademarks and BXM, BXR, BXY, CLL, LOVOL, PUT and VXTH are servicemarks of CBOE. Standard &
Poor's®, S&P®, and S&P 500® are registered trademarks of Standard & Poor’s Financial Services, LLC and are
licensed for use by CBOE. Financial products based on S&P indices are not sponsored, endorsed, sold or promoted
by Standard & Poor’s, and Standard & Poor’s makes no representation regarding the advisability of investing in
such products. MSCI, and the MSCI index names are service marks of MSCI Inc. ("MSCI") or its affiliates and have
been licensed for use by CBOE. Option contracts on any MSCI index (“Index Contracts”) are not sponsored,
guaranteed or endorsed by MSCI, its affiliates or other parties involved in, or related to, making or compiling such
MSCI index. Russell®, Russell 1000®, Russell 2000®, Russell 3000® and Russell MidCap® are registered trademarks
of the Frank Russell Company, used under license. FTSE® and the FTSE indexes are trademarks and service marks
of FTSE International Limited, used under license. Copyright © 2015 CBOE. All Rights Reserved.