fund manager’s report february 2017 - hblasset.com · liability to the tune ofpkr 6,109,583mn if...
TRANSCRIPT
AMC Rating : AM2 by JCR-VIS
FUND MANAGER’S REPORTFebruary 2017
Risk Disclaimer: This publication is for informational purposes only and nothing herein should be construed as asolicitation, recommendation or an offer to buy or sell any fund. All investments in mutual funds are subject to marketrisks. Past performance is not necessarily indicative of future results. Please read the Offering document to understandthe investment policies and risk involved.
Risk Disclaimer: This publication is for informational purposes only and nothing herein should be construed as a solicitation, recommendation or an offer to buy or sell any fund.All investments in mutual funds are subject to market risks. Past performance is not necessarily indicative of future results. Please read the Offering Document to understand theinvestment policies and risks involved.
EQUITY MARKET REIVEW
Capital Markets Review February 2017
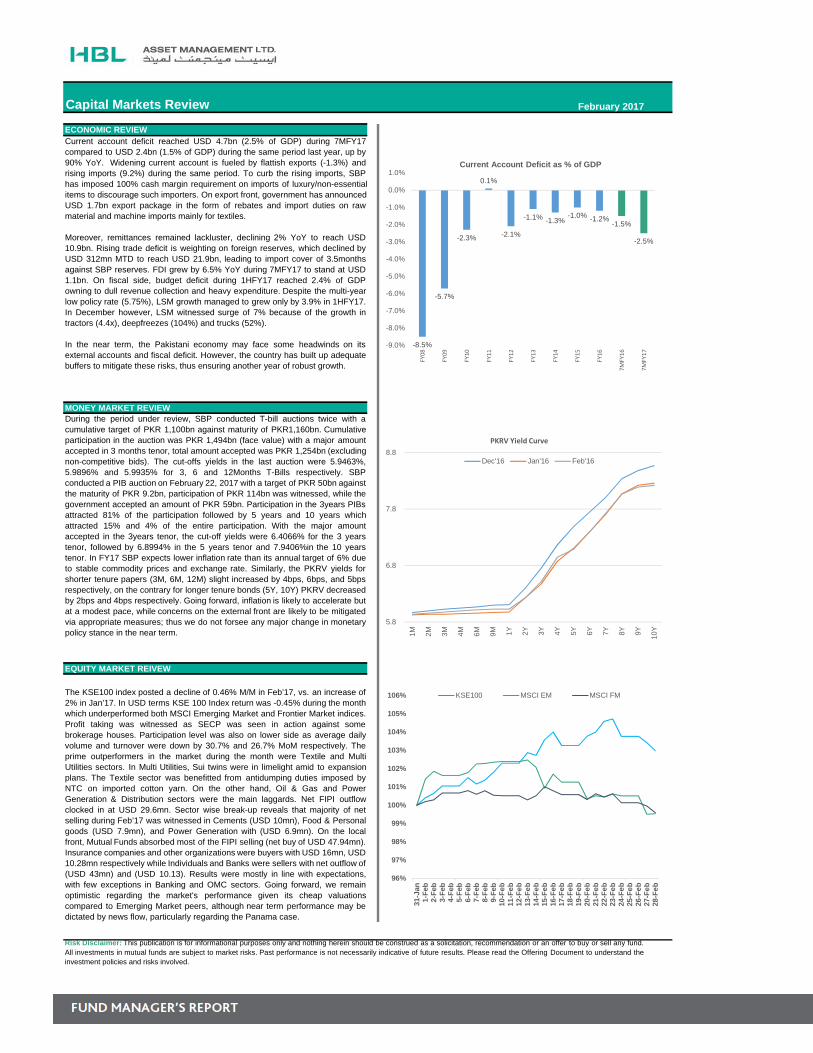
ECONOMIC REVIEWCurrent account deficit reached USD 4.7bn (2.5% of GDP) during 7MFY17compared to USD 2.4bn (1.5% of GDP) during the same period last year, up by90% YoY. Widening current account is fueled by flattish exports (-1.3%) andrising imports (9.2%) during the same period. To curb the rising imports, SBPhas imposed 100% cash margin requirement on imports of luxury/non-essentialitems to discourage such importers. On export front, government has announcedUSD 1.7bn export package in the form of rebates and import duties on rawmaterial and machine imports mainly for textiles. Moreover, remittances remained lackluster, declining 2% YoY to reach USD10.9bn. Rising trade deficit is weighting on foreign reserves, which declined byUSD 312mn MTD to reach USD 21.9bn, leading to import cover of 3.5monthsagainst SBP reserves. FDI grew by 6.5% YoY during 7MFY17 to stand at USD1.1bn. On fiscal side, budget deficit during 1HFY17 reached 2.4% of GDPowning to dull revenue collection and heavy expenditure. Despite the multi-yearlow policy rate (5.75%), LSM growth managed to grew only by 3.9% in 1HFY17.In December however, LSM witnessed surge of 7% because of the growth intractors (4.4x), deepfreezes (104%) and trucks (52%).
In the near term, the Pakistani economy may face some headwinds on itsexternal accounts and fiscal deficit. However, the country has built up adequatebuffers to mitigate these risks, thus ensuring another year of robust growth.
MONEY MARKET REVIEWDuring the period under review, SBP conducted T-bill auctions twice with acumulative target of PKR 1,100bn against maturity of PKR1,160bn. Cumulativeparticipation in the auction was PKR 1,494bn (face value) with a major amountaccepted in 3 months tenor, total amount accepted was PKR 1,254bn (excludingnon-competitive bids). The cut-offs yields in the last auction were 5.9463%,5.9896% and 5.9935% for 3, 6 and 12Months T-Bills respectively. SBPconducted a PIB auction on February 22, 2017 with a target of PKR 50bn againstthe maturity of PKR 9.2bn, participation of PKR 114bn was witnessed, while thegovernment accepted an amount of PKR 59bn. Participation in the 3years PIBsattracted 81% of the participation followed by 5 years and 10 years whichattracted 15% and 4% of the entire participation. With the major amountaccepted in the 3years tenor, the cut-off yields were 6.4066% for the 3 yearstenor, followed by 6.8994% in the 5 years tenor and 7.9406%in the 10 yearstenor. In FY17 SBP expects lower inflation rate than its annual target of 6% dueto stable commodity prices and exchange rate. Similarly, the PKRV yields forshorter tenure papers (3M, 6M, 12M) slight increased by 4bps, 6bps, and 5bpsrespectively, on the contrary for longer tenure bonds (5Y, 10Y) PKRV decreasedby 2bps and 4bps respectively. Going forward, inflation is likely to accelerate butat a modest pace, while concerns on the external front are likely to be mitigatedvia appropriate measures; thus we do not forsee any major change in monetarypolicy stance in the near term.
The KSE100 index posted a decline of 0.46% M/M in Feb’17, vs. an increase of2% in Jan’17. In USD terms KSE 100 Index return was -0.45% during the monthwhich underperformed both MSCI Emerging Market and Frontier Market indices.Profit taking was witnessed as SECP was seen in action against somebrokerage houses. Participation level was also on lower side as average dailyvolume and turnover were down by 30.7% and 26.7% MoM respectively. Theprime outperformers in the market during the month were Textile and MultiUtilities sectors. In Multi Utilities, Sui twins were in limelight amid to expansionplans. The Textile sector was benefitted from antidumping duties imposed byNTC on imported cotton yarn. On the other hand, Oil & Gas and PowerGeneration & Distribution sectors were the main laggards. Net FIPI outflowclocked in at USD 29.6mn. Sector wise break-up reveals that majority of netselling during Feb’17 was witnessed in Cements (USD 10mn), Food & Personalgoods (USD 7.9mn), and Power Generation with (USD 6.9mn). On the localfront, Mutual Funds absorbed most of the FIPI selling (net buy of USD 47.94mn).Insurance companies and other organizations were buyers with USD 16mn, USD10.28mn respectively while Individuals and Banks were sellers with net outflow of(USD 43mn) and (USD 10.13). Results were mostly in line with expectations,with few exceptions in Banking and OMC sectors. Going forward, we remainoptimistic regarding the market's performance given its cheap valuationscompared to Emerging Market peers, although near term performance may bedictated by news flow, particularly regarding the Panama case.
-8.5%
-5.7%
-2.3%
0.1%
-2.1%
-1.1% -1.3%-1.0% -1.2%
-1.5%
-2.5%
-9.0%
-8.0%
-7.0%
-6.0%
-5.0%
-4.0%
-3.0%
-2.0%
-1.0%
0.0%
1.0%
FY08
FY09
FY10
FY11
FY12
FY13
FY14
FY15
FY16
7MFY16
7MFY17
Current Account Deficit as % of GDP
96%
97%
98%
99%
100%
101%
102%
103%
104%
105%
106%
31-J
an1-
Feb
2-F
eb3-
Feb
4-F
eb5-
Feb
6-F
eb7-
Feb
8-F
eb9-
Feb
10-F
eb
11-F
eb
12-F
eb
13-F
eb
14-F
eb
15-F
eb
16-F
eb
17-F
eb
18-F
eb
19-F
eb
20-F
eb
21-F
eb
22-F
eb
23-F
eb
24-F
eb
25-F
eb
26-F
eb
27-F
eb
28-F
eb
KSE100 MSCI EM MSCI FM
5.8
6.8
7.8
8.8
1M 2M 3M 4M 6M 9M 1Y 2Y 3Y 4Y 5Y 6Y 7Y 8Y 9Y 10Y
PKRV Yield Curve
Dec'16 Jan'16 Feb'16

Conventional Funds

FEBRUARY 2017
Net Assets PKR 3,877 mn Feb-17 Jan-17NAV PKR 106.0253 Cash 48.46% 39.76%Launch Date 12-Jul-10 Placements with Banks & DFIs 17.51% 20.83%Management Fee 1.00% p.a T-Bills 33.46% 36.21%
Expense Ratio without ST 0.81% PIB 0.00% 0.00%
Expense Ratio with ST 1.00% Others Including receivables 0.56% 3.19%Listing Pakistan Stock ExchangeTrustee Central Depository Co. of Pakistan
Auditor Deloitte Yousuf Adil Pakistan FUND RETURNS (%)* HBL MMF* BENCHMARKBenchmark 70% 3M PKRV & 30% 3M Deposits Annualized Return Since Inception 11.35% 7.92%
Rate of 3 AA and above rated Banks Year to Date Annualized Return 6.62% 5.26%Type Open End Calendar Year to Date Annualized Return 12.13% 5.26%Category Money Market Scheme 1 Month Annualized Return 4.70% 5.27%Front end Load Nill 3 Month Annualized Return 9.69% 5.27%Back end Load Nil 6 Month Annualized Return 7.27% 5.21%AMC Rating AM2 ( JCRVIS) 30-Dec-16 1 Year Annualized Return 6.03% 5.35%Dealing Days Monday-Friday * Return have been calculate as par MUFAP,s formula
Cut off time 9:00 AM-3:00 PMPrice Mechanism Forward PricingFund Stability Rating AA(f) (JCR VIS) 5-Jan-17Leverage Nil
Risk Low
Weighted Average Maturity (Days) 48
Farid Ahmed Khan, CFA Chief Executive OfficerMuhammad Imran Chief Investment OfficerColin Miranda Acting Head of ResearchTauqir Shamshad Head of Fixed IncomeNoman Ameer Manager Risk
Nil
**Calculated on 12Month trailing data
INVESTMENT OBJECTIVEThe objective of the Fund is to seek high liquidity and comparative return for investors by investing in low risk securities of shorter duration and maturity.
FUND MANAGER'S COMMENTSDuring the month of February17, the Fund size decreased to PKR 3,877 mn from PKR 4,579mn in Jan'17. The Fund earned an annualized return of 4.70% forthe month. The overall weighted average time to maturity stood at 48 days compared to 54 days in Jan17.The Fund Manager is looking out for opportunities toaugment the Fund's return.
FUND INFORMATION ASSET ALLOCATION (% of Total Assets)
The scheme has maintained provisions against Worker Welfare Fund'sliability to the tune of PKR 6,109,583mn if the same were not made, theNAV per unit would be higher by Rs. 0.17/0.16%. For details, investorsare advised to read the Note 5.3 of the latest financial statements of thescheme.
Risk Disclaimer: This publication is for informational purposes only and nothing herein should be construed as a solicitation, recommendation or an offer to buy or sell any fund. All investments inmutual funds are subject to market risks. Past performance is not necessarily indicative of future results. Please read the Offering Document to understand the investment policies and risks involved.
ASSET QUALITY (% Total Assets)
INVESTMENT COMMITTEE
HBL MONEY MARKET FUND vs BENCHMARK (MoM Returns) WEIGHTED AVERAGE MATURITY
NON-COMPLIANT INVESTMENTS PROVISION AGAISNT WWF
Mutual Fund Association of Pakistan (MUFAP) Recommended Format*Returns have been calculated as per MUFAP's formula
AA5%
AA+5%
AAA56%
Non Rated1%
Government Securities
33%
47
109
Placements with Banks & DFIs
T‐Bills
0.0%
2.0%
4.0%
6.0%
8.0%
10.0%
12.0%
14.0%
16.0%
18.0%
20.0%
Ma
r-1
6
Apr
-16
Ma
y-1
6
Jun-
16
Jul-1
6
Aug
-16
Sep
-16
Oct
-16
Nov
-16
Dec
-16
Jan-
17
Fe
b-17
HBL MMF Benchmark
FEBRUARY 2017
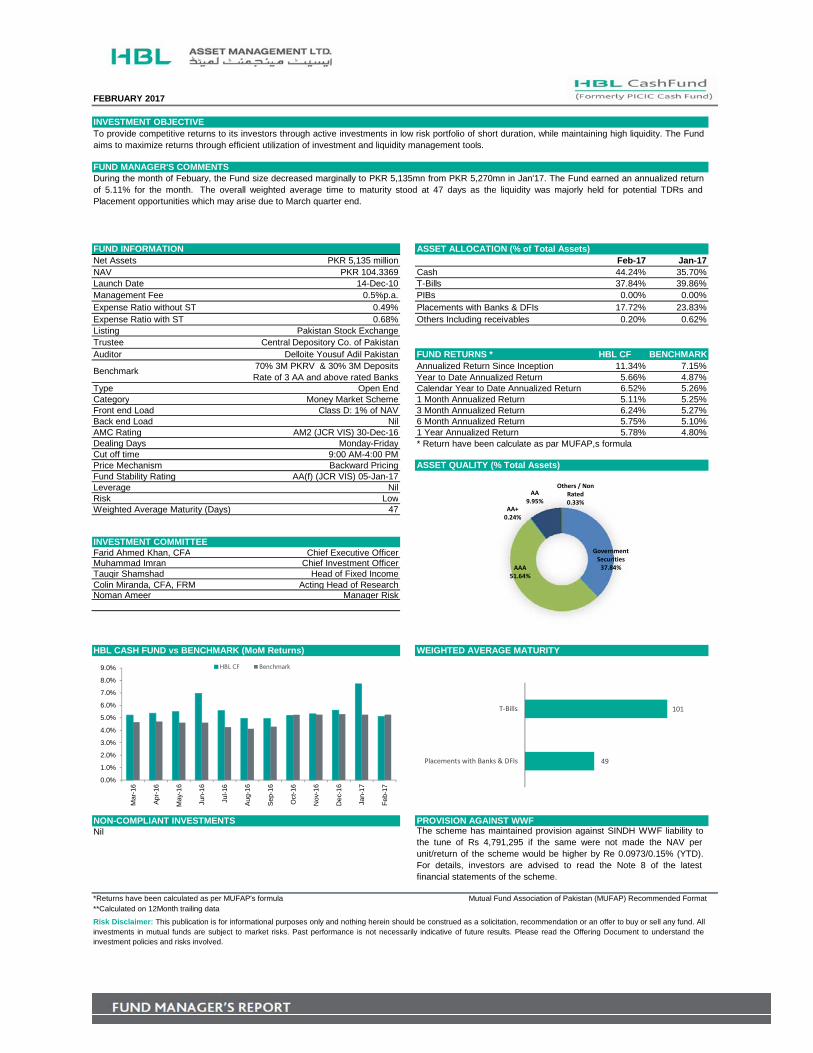
Net Assets PKR 5,135 million Feb-17 Jan-17NAV PKR 104.3369 Cash 44.24% 35.70%Launch Date 14-Dec-10 T-Bills 37.84% 39.86%Management Fee 0.5%p.a. PIBs 0.00% 0.00%Expense Ratio without ST 0.49% Placements with Banks & DFIs 17.72% 23.83%Expense Ratio with ST 0.68% Others Including receivables 0.20% 0.62%Listing Pakistan Stock ExchangeTrustee Central Depository Co. of PakistanAuditor Delloite Yousuf Adil Pakistan FUND RETURNS * HBL CF BENCHMARK
70% 3M PKRV & 30% 3M Deposits Annualized Return Since Inception 11.34% 7.15%Rate of 3 AA and above rated Banks Year to Date Annualized Return 5.66% 4.87%
Type Open End Calendar Year to Date Annualized Return 6.52% 5.26%Category Money Market Scheme 1 Month Annualized Return 5.11% 5.25%Front end Load Class D: 1% of NAV 3 Month Annualized Return 6.24% 5.27%Back end Load Nil 6 Month Annualized Return 5.75% 5.10%AMC Rating AM2 (JCR VIS) 30-Dec-16 1 Year Annualized Return 5.78% 4.80%Dealing Days Monday-Friday * Return have been calculate as par MUFAP,s formula Cut off time 9:00 AM-4:00 PMPrice Mechanism Backward PricingFund Stability Rating AA(f) (JCR VIS) 05-Jan-17Leverage NilRisk LowWeighted Average Maturity (Days) 47
Farid Ahmed Khan, CFA Chief Executive OfficerMuhammad Imran Chief Investment OfficerTauqir Shamshad Head of Fixed IncomeColin Miranda, CFA, FRM Acting Head of ResearchNoman Ameer Manager Risk
Nil
INVESTMENT OBJECTIVETo provide competitive returns to its investors through active investments in low risk portfolio of short duration, while maintaining high liquidity. The Fundaims to maximize returns through efficient utilization of investment and liquidity management tools.
FUND MANAGER'S COMMENTSDuring the month of Febuary, the Fund size decreased marginally to PKR 5,135mn from PKR 5,270mn in Jan'17. The Fund earned an annualized returnof 5.11% for the month. The overall weighted average time to maturity stood at 47 days as the liquidity was majorly held for potential TDRs andPlacement opportunities which may arise due to March quarter end.
FUND INFORMATION ASSET ALLOCATION (% of Total Assets)
Benchmark
The scheme has maintained provision against SINDH WWF liability tothe tune of Rs 4,791,295 if the same were not made the NAV perunit/return of the scheme would be higher by Re 0.0973/0.15% (YTD).For details, investors are advised to read the Note 8 of the latestfinancial statements of the scheme.
**Calculated on 12Month trailing data
Risk Disclaimer: This publication is for informational purposes only and nothing herein should be construed as a solicitation, recommendation or an offer to buy or sell any fund. Allinvestments in mutual funds are subject to market risks. Past performance is not necessarily indicative of future results. Please read the Offering Document to understand theinvestment policies and risks involved.
ASSET QUALITY (% Total Assets)
INVESTMENT COMMITTEE
HBL CASH FUND vs BENCHMARK (MoM Returns) WEIGHTED AVERAGE MATURITY
NON-COMPLIANT INVESTMENTS PROVISION AGAINST WWF
*Returns have been calculated as per MUFAP's formula Mutual Fund Association of Pakistan (MUFAP) Recommended Format
49
101
Placements with Banks & DFIs
T‐Bills
0.0%
1.0%
2.0%
3.0%
4.0%
5.0%
6.0%
7.0%
8.0%
9.0%
Mar
-16
Apr
-16
May
-16
Jun-
16
Jul-1
6
Aug
-16
Sep
-16
Oct
-16
Nov
-16
Dec
-16
Jan-
17
Feb
-17
HBL CF Benchmark
Government Securities37.84%AAA
51.64%
AA+0.24%
AA9.95%
Others / Non Rated0.33%

FEBRUARY 2017
Net Assets PKR 4,698 mn Feb-17 Jan-17NAV PKR 109.2754 Cash 51.43% 18.94%Launch Date 15-Mar-07 Placement with Banks & DFI 14.24% 22.92%Management Fee 1.5% p.a TFCs 27.02% 27.22%Expense Ratio without ST 1.14% PIBs 0.00% 11.94%Expense Ratio with ST 1.38% T-Bills 1.03% 9.56%Listing Pakistan Stock Exchange Spread Transaction 1.10% 8.06%Trustee Central Depository Co. of Pakistan Commercial Paper 0.79% 0.73%Auditor Deloitte Yousuf Adil Pakistan Others Including receivables 4.39% 0.64%Benchmark 6 Month KIBORType Open End FUND RETURNS * HBL IF* BENCHMARKCategory Income Scheme Annualized Return Since Inception 14.72% 10.56%Front end Load 1.50% Year to Date Annualized Return 4.50% 6.08%Back end Load Nil Calendar Year to Date Annualized Return 6.32% 6.13%AMC Rating AM2 ( JCRVIS) 12/30/2016 1 Month Annualized Return 5.90% 6.13%Dealing Days Monday-Friday 3 Month Annualized Return 5.66% 6.13%Cut off time 9:00 AM-3:00 PM 6 Month Annualized Return 5.03% 6.10%Price Mechanism Forward Pricing 1 Year Annualized Return 4.67% 6.15%Fund Stability Rating A(f) (JCR VIS) 1/11/2017Leverage NilWeighted Average Maturity (Days) 704Risk Moderate
Farid Ahmed Khan, CFA Chief Executive OfficerMuhammad Imran Chief Investment OfficerColin Miranda, CFA, FRM Acting Head of ResearchTauqir Shamshad Head of Fixed IncomeNoman Ameer Manager Risk
**Calculated on 12Month trailing data
INVESTMENT OBJECTIVEThe objective of the Fund is to provide a stable stream of income with moderate level of risk by investing in fixed income securities.
FUND MANAGER'S COMMENTSDuring the Month of Feb'17, the fund reduced marginally to Rs. 4,698 mn from 4,980 mn in Jan'17.The Fund earned an annualized return of 5.90% againstthe benchmark return of 6.13%. During the month the Fund reduced its exposure in PIBs and Placements. The overall weighted average time to maturitystood at 704days against 829 days in Jan17.
FUND INFORMATION ASSET ALLOCATION (% of Total Assets)
The scheme has maintained provisions against Sindh WWF liability tothe tune of PKR 16,232,357mn if the same were not made, the NAV perunit would be higher by Rs. 38/35%. For details, investors are advised toread the Note 8.2of the latest financial statements of the scheme.
The scheme holds certain non-compliant investments. Before making any investment decision, investors should review this document and latest financial statements.
Risk Disclaimer: This publication is for informational purposes only and nothing herein should be construed as a solicitation, recommendation or an offer to buy or sell any fund. All investments inmutual funds are subject to market risks. Past performance is not necessarily indicative of future results. Please read the Offering Document to understand the investment policies and risks involved.
ASSET QUALITY (% Total Assets)
INVESTMENT COMMITTEE
HBL INCOME FUND vs BENCHMARK (MoM Returns) TOP TEN HOLDINGS (% of Total Assets)
NON-COMPLIANT INVESTMENTS PROVISION AGAINST WWF
Mutual Fund Association of Pakistan (MUFAP) Recommended Format*Returns have been calculated as per MUFAP's formula
1.70%
0.75%
5.73%
1.87%
2.61%
4.78%
4.99%
2.10%
2.49%
NIB Bank Ltd.
Bank Alfalah Ltd.
Habib Bank Ltd.
SCB (Pak) Ltd.
Fatima Fertilizer Co. Ltd.
JS Bank Ltd.
The Bank of Punjab
Bank Al Habib
Ghani Gases Limited
others , 5.50%Government Securities, 1.03%
AA+, 0.04%
AA, 4.72%
AAA, 19.02%
AA‐, 59.94%
A+, 9.75%
0.0%
1.0%
2.0%
3.0%
4.0%
5.0%
6.0%
7.0%
8.0%
Mar
-16
Apr-1
6
May
-16
Jun-
16
Jul-1
6
Aug-
16
Sep-
16
Oct
-16
Nov-
16
Dec-
16
Jan-
17
Feb-
17
HBL IF BENCHMARK
Non-Compliant Investment Type of Investment
Value before Provision (PKR mn)
Provision Held (PKR mn)
Value of Investment after Provision (PKR mn)
% of Net Assets
% of Gross Assets
New Allied Electronics TFC 19.02 19.02 - - -
New Allied Electronics Sukuk 44.15 44.15 - - -
Agri Tech Limited TFC 9.99 9.99 - - -
Saudi Pak Leasing Co. Ltd TFC 5.55 5.55 - - -
Worldcall Telecom Limited TFC 47.77 47.77 - - -
Zarai Taraqiati Bank Ltd TDR - 10.64% 10.39%
FEBRUARY 2017
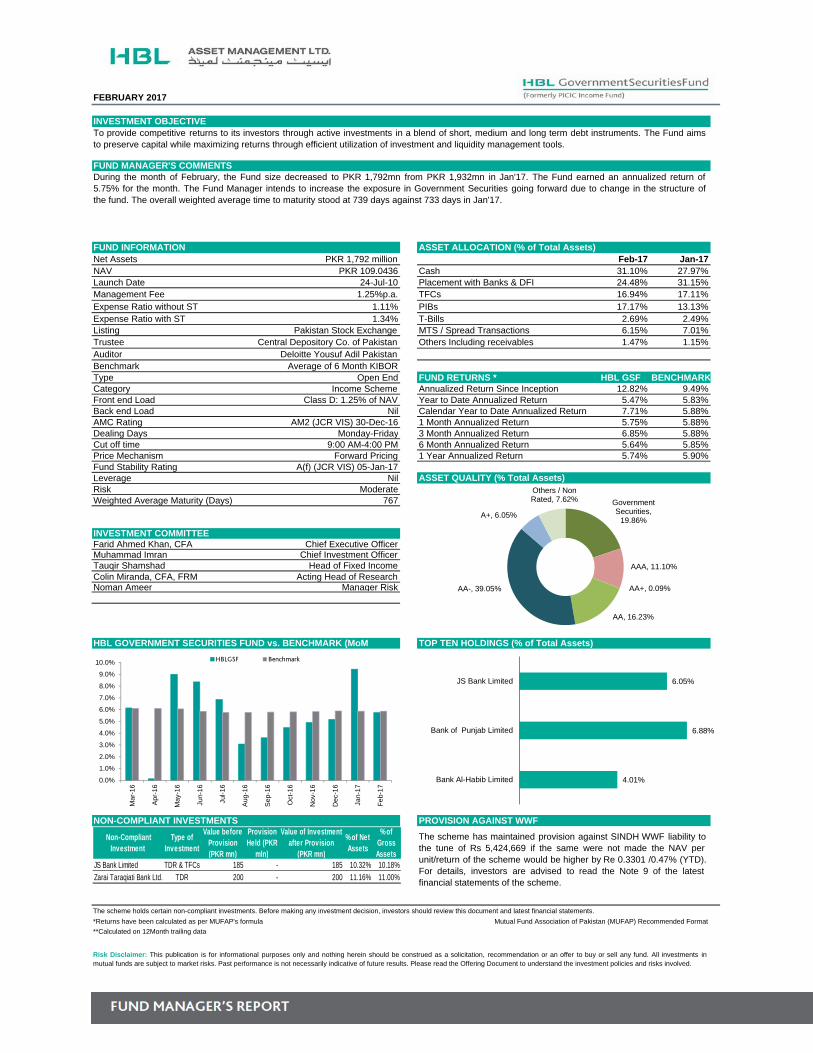
Net Assets PKR 1,792 million Feb-17 Jan-17NAV PKR 109.0436 Cash 31.10% 27.97%Launch Date 24-Jul-10 Placement with Banks & DFI 24.48% 31.15%Management Fee 1.25%p.a. TFCs 16.94% 17.11%Expense Ratio without ST 1.11% PIBs 17.17% 13.13%Expense Ratio with ST 1.34% T-Bills 2.69% 2.49%Listing Pakistan Stock Exchange MTS / Spread Transactions 6.15% 7.01%Trustee Central Depository Co. of Pakistan Others Including receivables 1.47% 1.15%Auditor Deloitte Yousuf Adil PakistanBenchmark Average of 6 Month KIBORType Open End FUND RETURNS * HBL GSF BENCHMARKCategory Income Scheme Annualized Return Since Inception 12.82% 9.49%Front end Load Class D: 1.25% of NAV Year to Date Annualized Return 5.47% 5.83%Back end Load Nil Calendar Year to Date Annualized Return 7.71% 5.88%AMC Rating AM2 (JCR VIS) 30-Dec-16 1 Month Annualized Return 5.75% 5.88%Dealing Days Monday-Friday 3 Month Annualized Return 6.85% 5.88%Cut off time 9:00 AM-4:00 PM 6 Month Annualized Return 5.64% 5.85%Price Mechanism Forward Pricing 1 Year Annualized Return 5.74% 5.90%Fund Stability Rating A(f) (JCR VIS) 05-Jan-17Leverage NilRisk ModerateWeighted Average Maturity (Days) 767
Farid Ahmed Khan, CFA Chief Executive OfficerMuhammad Imran Chief Investment OfficerTauqir Shamshad Head of Fixed IncomeColin Miranda, CFA, FRM Acting Head of ResearchNoman Ameer Manager Risk
**Calculated on 12Month trailing data
The scheme has maintained provision against SINDH WWF liability tothe tune of Rs 5,424,669 if the same were not made the NAV perunit/return of the scheme would be higher by Re 0.3301 /0.47% (YTD).For details, investors are advised to read the Note 9 of the latestfinancial statements of the scheme.
The scheme holds certain non-compliant investments. Before making any investment decision, investors should review this document and latest financial statements.
INVESTMENT OBJECTIVETo provide competitive returns to its investors through active investments in a blend of short, medium and long term debt instruments. The Fund aimsto preserve capital while maximizing returns through efficient utilization of investment and liquidity management tools.
FUND MANAGER'S COMMENTSDuring the month of February, the Fund size decreased to PKR 1,792mn from PKR 1,932mn in Jan'17. The Fund earned an annualized return of5.75% for the month. The Fund Manager intends to increase the exposure in Government Securities going forward due to change in the structure ofthe fund. The overall weighted average time to maturity stood at 739 days against 733 days in Jan'17.
FUND INFORMATION ASSET ALLOCATION (% of Total Assets)
Risk Disclaimer: This publication is for informational purposes only and nothing herein should be construed as a solicitation, recommendation or an offer to buy or sell any fund. All investments inmutual funds are subject to market risks. Past performance is not necessarily indicative of future results. Please read the Offering Document to understand the investment policies and risks involved.
ASSET QUALITY (% Total Assets)
INVESTMENT COMMITTEE
HBL GOVERNMENT SECURITIES FUND vs. BENCHMARK (MoM TOP TEN HOLDINGS (% of Total Assets)
NON-COMPLIANT INVESTMENTS PROVISION AGAINST WWF
*Returns have been calculated as per MUFAP's formula Mutual Fund Association of Pakistan (MUFAP) Recommended Format
4.01%
6.88%
6.05%
Bank Al-Habib Limited
Bank of Punjab Limited
JS Bank Limited
Government Securities,
19.86%
AAA, 11.10%
AA+, 0.09%
AA, 16.23%
AA-, 39.05%
A+, 6.05%
Others / Non Rated, 7.62%
0.0%
1.0%
2.0%
3.0%
4.0%
5.0%
6.0%
7.0%
8.0%
9.0%
10.0%
Ma
r-1
6
Ap
r-1
6
Ma
y-1
6
Jun-
16
Jul-1
6
Aug
-16
Sep
-16
Oct
-16
Nov
-16
Dec
-16
Jan-
17
Fe
b-17
HBLGSF Benchmark
JS Bank Limited TDR & TFCs 185 - 185 10.32% 10.18%
Zarai Taraqiati Bank Ltd. TDR 200 - 200 11.16% 11.00%
% of Net Assets
% of Gross Assets
Non-Compliant Investment
Type of Investment
Value before Provision (PKR mn)
Provision Held (PKR
mln)
Value of Investment after Provision
(PKR mn)
FEBRUARY 2017
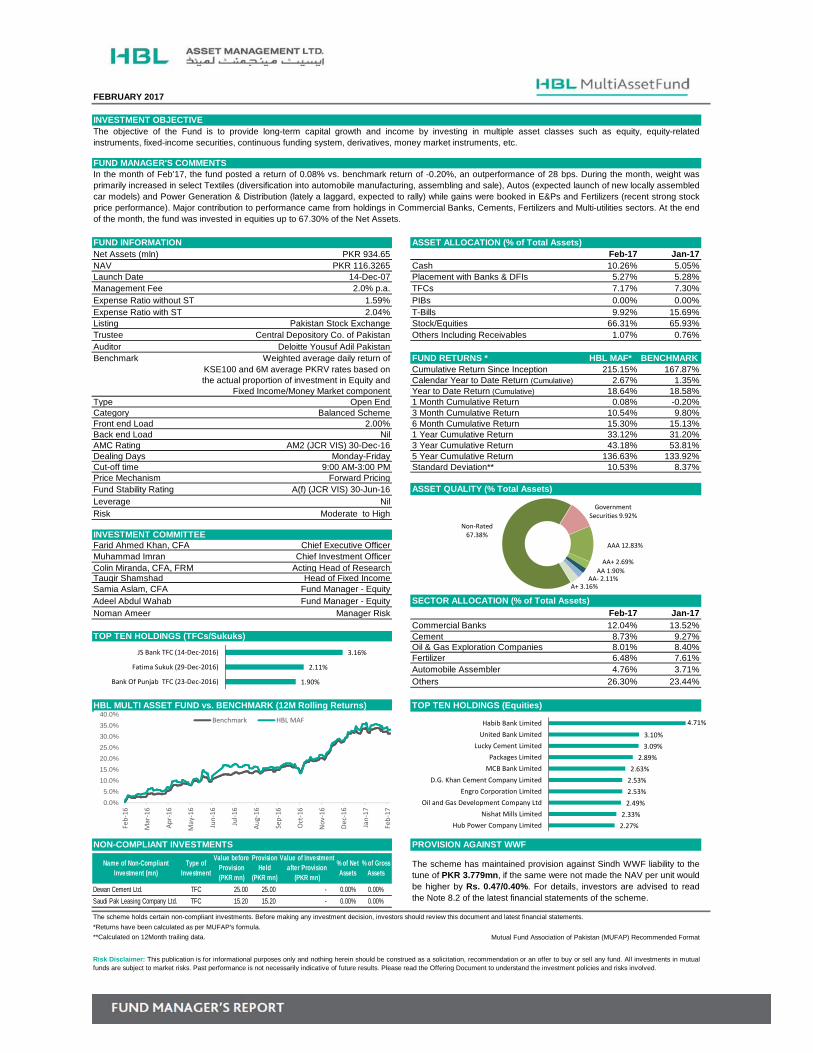
Net Assets (mln) PKR 934.65 Feb-17 Jan-17NAV PKR 116.3265 Cash 10.26% 5.05%Launch Date 14-Dec-07 Placement with Banks & DFIs 5.27% 5.28%Management Fee 2.0% p.a. TFCs 7.17% 7.30%Expense Ratio without ST 1.59% PIBs 0.00% 0.00%Expense Ratio with ST 2.04% T-Bills 9.92% 15.69%Listing Pakistan Stock Exchange Stock/Equities 66.31% 65.93%Trustee Central Depository Co. of Pakistan Others Including Receivables 1.07% 0.76%Auditor Deloitte Yousuf Adil PakistanBenchmark Weighted average daily return of FUND RETURNS * HBL MAF* BENCHMARK
KSE100 and 6M average PKRV rates based on Cumulative Return Since Inception 215.15% 167.87%the actual proportion of investment in Equity and Calendar Year to Date Return (Cumulative) 2.67% 1.35%
Fixed Income/Money Market component Year to Date Return (Cumulative) 18.64% 18.58%Type Open End 1 Month Cumulative Return 0.08% -0.20%Category Balanced Scheme 3 Month Cumulative Return 10.54% 9.80%Front end Load 2.00% 6 Month Cumulative Return 15.30% 15.13%Back end Load Nil 1 Year Cumulative Return 33.12% 31.20%AMC Rating AM2 (JCR VIS) 30-Dec-16 3 Year Cumulative Return 43.18% 53.81%Dealing Days Monday-Friday 5 Year Cumulative Return 136.63% 133.92%Cut-off time 9:00 AM-3:00 PM Standard Deviation** 10.53% 8.37%Price Mechanism Forward PricingFund Stability Rating A(f) (JCR VIS) 30-Jun-16Leverage NilRisk Moderate to High
Farid Ahmed Khan, CFA Chief Executive OfficerMuhammad Imran Chief Investment OfficerColin Miranda, CFA, FRM Acting Head of Research Tauqir Shamshad Head of Fixed IncomeSamia Aslam, CFA Fund Manager - EquityAdeel Abdul Wahab Fund Manager - EquityNoman Ameer Manager Risk Feb-17 Jan-17
Commercial Banks 12.04% 13.52%Cement 8.73% 9.27%Oil & Gas Exploration Companies 8.01% 8.40%Fertilizer 6.48% 7.61%Automobile Assembler 4.76% 3.71%Others 26.30% 23.44%
**Calculated on 12Month trailing data.
NON-COMPLIANT INVESTMENTS PROVISION AGAINST WWF
INVESTMENT OBJECTIVEThe objective of the Fund is to provide long-term capital growth and income by investing in multiple asset classes such as equity, equity-relatedinstruments, fixed-income securities, continuous funding system, derivatives, money market instruments, etc.
FUND MANAGER'S COMMENTSIn the month of Feb’17, the fund posted a return of 0.08% vs. benchmark return of -0.20%, an outperformance of 28 bps. During the month, weight wasprimarily increased in select Textiles (diversification into automobile manufacturing, assembling and sale), Autos (expected launch of new locally assembledcar models) and Power Generation & Distribution (lately a laggard, expected to rally) while gains were booked in E&Ps and Fertilizers (recent strong stockprice performance). Major contribution to performance came from holdings in Commercial Banks, Cements, Fertilizers and Multi-utilities sectors. At the endof the month, the fund was invested in equities up to 67.30% of the Net Assets.
FUND INFORMATION ASSET ALLOCATION (% of Total Assets)
ASSET QUALITY (% Total Assets)
INVESTMENT COMMITTEE
HBL MULTI ASSET FUND vs. BENCHMARK (12M Rolling Returns) TOP TEN HOLDINGS (Equities)
SECTOR ALLOCATION (% of Total Assets)
TOP TEN HOLDINGS (TFCs/Sukuks)
The scheme has maintained provision against Sindh WWF liability to thetune of PKR 3.779mn, if the same were not made the NAV per unit wouldbe higher by Rs. 0.47/0.40%. For details, investors are advised to readthe Note 8.2 of the latest financial statements of the scheme.
The scheme holds certain non-compliant investments. Before making any investment decision, investors should review this document and latest financial statements.
*Returns have been calculated as per MUFAP's formula.
Risk Disclaimer: This publication is for informational purposes only and nothing herein should be construed as a solicitation, recommendation or an offer to buy or sell any fund. All investments in mutualfunds are subject to market risks. Past performance is not necessarily indicative of future results. Please read the Offering Document to understand the investment policies and risks involved.
Mutual Fund Association of Pakistan (MUFAP) Recommended Format
2.27%
2.33%
2.49%
2.53%
2.53%
2.63%
2.89%
3.09%
3.10%
4.71%
Hub Power Company Limited
Nishat Mills Limited
Oil and Gas Development Company Ltd
Engro Corporation Limited
D.G. Khan Cement Company Limited
MCB Bank Limited
Packages Limited
Lucky Cement Limited
United Bank Limited
Habib Bank Limited
Non‐Rated 67.38%
Government Securities 9.92%
AAA 12.83%
AA+ 2.69%AA 1.90%
AA‐ 2.11%A+ 3.16%
1.90%
2.11%
3.16%
Bank Of Punjab TFC (23‐Dec‐2016)
Fatima Sukuk (29‐Dec‐2016)
JS Bank TFC (14‐Dec‐2016)
Dewan Cement Ltd. TFC 25.00 25.00 - 0.00% 0.00%
Saudi Pak Leasing Company Ltd. TFC 15.20 15.20 - 0.00% 0.00%
% of Gross Assets
Name of Non-Compliant Investment (mn)
Type of Investment
Value before Provision (PKR mn)
Provision Held
(PKR mn)
Value of Investment after Provision
(PKR mn)
% of Net Assets
0.0%
5.0%
10.0%
15.0%
20.0%
25.0%
30.0%
35.0%
40.0%
Feb‐16
Mar‐16
Apr‐16
May‐16
Jun‐16
Jul‐16
Aug‐16
Sep‐16
Oct‐16
Nov‐16
Dec‐16
Jan‐17
Feb‐17
Benchmark HBL MAF

FEBRUARY 2017
Net Assets (mln) PKR 1997.423 Feb-17 Jan-17NAV PKR 107.6714 Cash 1.41% 0.53%Launch Date 27-Mar-15 Placements with Banks and DFIs 84.42% 84.26%Management Fee 1.00% p.a Stock / Equities 9.29% 10.83%Expense Ratio with ST 1.26% Others Including Receivables 4.88% 4.38%Expense Ratio without ST 0.84%Listing Pakistan Stock Exchange SECTOR ALLOCATION (% of Total Assets)Trustee Central Depository Co. of Pakistan Feb-17 Jan-17Auditor Deloitte Yousuf Adil Pakistan Commercial Banks 1.50% 1.45%Benchmark MSF 1* Cement 1.46% 0.93%Type Open End Oil & Gas Exploration Companies 1.05% 1.48%Category Capital Protected Scheme Oil & Gas Marketing Companies 0.83% 1.07%Front end Load 2.00% Fertilizer 0.69% 0.90%Back end Load 3.00% Others 3.76% 5.01%AMC Rating AM2 (JCRVIS) 30/12/2016Dealing Days Monday-Friday ASSET QUALITYCut off time 9:00 AM-3:00 PM Feb-17Price Mechanism Forward Pricing AAA 84.42%Leverage Nil AA+ 0.37%Risk Low Not rated 3.76%
INVESTMENT COMMITTEE FUND RETURNS * HBLMSF1 BENCHMARKFarid Ahmed Khan, CFA Chief Executive Officer Cumulative Return Since Inception 14.26% 9.07%Muhammad Imran Chief Investment Officer Calendar Year to Date Return (Cumulative) 1.30% 0.59%Colin Miranda, CFA, FRM Acting Head of Research Year to Date Return (Cumulative) 6.52% 4.05%Samia Aslam, CFA Fund Manager- Equity 1 Month Cumulative Return 0.48% 0.17%Adeel Abdul Wahab Fund Manager- Equity 3 Month Cumulative Return 2.33% 1.95%Tauqir Shamshad Head of Fixed Income 6 Month Cumulative Return 4.92% 3.21%Noman Ameer Manager Risk 1 Year Cumulative Return 9.38% 6.17%
Standard Deviation** 1.20% 1.14%
**Calculated on 12Month trailing data
Provision against WWF: The scheme has maintained provisions againstSINDH WWF liability to the tune of PKR 4.473mn if the same were notmade, the NAV per unit would be higher by Rs. 0.24/0.22%. For details,investors are advised to read the Note 5.3 of the latest financialstatements of the scheme.
Risk Disclaimer: This publication is for informational purposes only and nothing herein should be construed as a solicitation, recommendation or an offer to buy or sell any fund. All investments inmutual funds are subject to market risks. Past performance is not necessarily indicative of future results. Please read the Offering Document to understand the investment policies and risks involved.
Mutual Fund Association of Pakistan (MUFAP) Recommended Format*Returns have been calculated as per MUFAP's formula
MSF1* = Weighted Average Daily Return of KSE-100 Index and Three (3) Months Deposit Rate of Double A minus (AA-) or above rated Banks based on the Fund’s actual Proportion in the Equity &Money Market Component.
HBL MSF1 vs BENCHMARK (12M Rolling Returns) TOP TEN HOLDINGS
NON-COMPLIANT INVESTMENTS PROVISION AGAISNT WWF
INVESTMENT OBJECTIVEThe primary objective of HBL - MSF 1 is to protect the Initial Investment Value of investors at maturity with secondary objective of providing growthover the period.
FUND MANAGER'S COMMENTS
FUND INFORMATION ASSET ALLOCATION (% of Total Assets)
The fund posted a return of 0.48% during the month vs. benchmark return of 0.17%. During the month equity exposure was decreased to 9.29%, asthe fund is about to dissolve in next month. TDR investment at the end of the month stood at 84.42%. During the month of Feb 17 KSE 100 Indexdecreased by -0.46%.
0.39%
0.42%
0.43%
0.45%
0.49%
0.51%
0.52%
0.53%
0.58%
0.59%
Pakistan Oilfields Limited
Pakistan State Oil Company Limited
Gul Ahmed Textile Mills Limited
Fauji Cement Company Limited
D.G. Khan Cement Company Limited
Habib Bank Limited
Lucky Cement Limited
Packages Limited
Adamjee Insurance Company Limited
MCB Bank Limited
0.00%
1.00%
2.00%
3.00%
4.00%
5.00%
6.00%
7.00%
8.00%
9.00%
10.00%
Fe
b-16
Ma
r-1
6
Apr
-16
Ma
y-1
6
Jun-
16
Jul-1
6
Aug
-16
Sep
-16
Oct
-16
Nov
-16
Dec
-16
Jan-
17
Fe
b-17
HBL MSF1 Benchmark

FEBRUARY 2017
Net Assets (mln) PKR 6,450.70 Feb-17 Jan-17NAV PKR 131.0855 Cash 6.52% 4.79%Launch Date 29-Aug-07 Stock / Equities 91.57% 93.99%Management Fee 2.0% p.a. T-Bills 0.00% 0.00%Expense Ratio with ST 1.95% Others Including Receivables 1.91% 1.22%Expense Ratio without ST 1.49%Listing Pakistan Stock ExchangeTrustee Central Depository Co. of PakistanAuditor Deloitte Yousuf Adil Pakistan Feb-17 Jan-17Benchmark KSE30 (Total Return) Index Commercial Banks 18.72% 19.29%Type Open End Oil & Gas Exploration Companies 14.49% 14.92%Category Equity Scheme Cement 14.10% 14.00%Front end Load 2.50% Fertilizer 11.77% 14.08%Back end Load Nil Power Generation & Distribution 7.39% 6.92%AMC Rating AM2 (JCR VIS) 30-Dec-16 Others 25.09% 24.79%Dealing Days Monday-FridayCut-off time 9:00 AM-3:00 PMPrice Mechanism Forward Pricing FUND RETURNS * HBL SF BENCHMARKLeverage Nil Cumulative Return Since Inception 256.25% 305.52%Risk High Calendar Year to Date Return (Cumulative) 2.74% 2.02%
Year to Date Return (Cumulative) 26.44% 28.34%1 Month Cumulative Return 0.47% 0.27%3 Month Cumulative Return 14.18% 16.28%
Farid Ahmed Khan, CFA Chief Executive Officer 6 Month Cumulative Return 18.72% 21.81%Muhammad Imran Chief Investment Officer 1 Year Cumulative Return 44.79% 54.58%Colin Miranda, CFA, FRM Acting Head of Research 3 Year Cumulative Return 56.42% 88.08%Samia Aslam, CFA Fund Manager - Equity 5 Year Cumulative Return 167.42% 276.55%Adeel Abdul Wahab Fund Manager - Equity Standard Deviation** 13.34% 13.74%Noman Ameer Manager Risk
Name of Non-Compliant Investment Dewan Cement LimitedType of Investment TFCValue before provision 25.00Provision Held 25.00% of Net Assets 0.00
**Calculated on 12Month trailing data
The scheme has maintained provision against Sindh WWF liability to thetune of PKR 24.904mn, if the same were not made the NAV per unitwould be higher by Rs. 0.51/0.39%. For details, investors are advised toread the Note 9 of the latest financial statements of the scheme.
The equity scheme holds certain non-compliant investments. Before making any investment decision, investors should review this document and latest financial statements.
Risk Disclaimer: This publication is for informational purposes only and nothing herein should be construed as a solicitation, recommendation or an offer to buy or sell any fund. All investments in mutualfunds are subject to market risks. Past performance is not necessarily indicative of future results. Please read the Offering Document to understand the investment policies and risks involved.
*Returns have been calculated as per MUFAP's formula Mutual Fund Association of Pakistan (MUFAP) Recommended Format
SECTOR ALLOCATION (% of Total Assets)
INVESTMENT COMMITTEE
HBL STOCK FUND vs. BENCHMARK (12M Rolling Returns) TOP TEN HOLDINGS (% of Total Assets)
NON-COMPLIANT INVESTMENTS PROVISION AGAINST WWF
INVESTMENT OBJECTIVEThe objective of the Fund is to provide long-term capital growth by investing primarily in a diversified pool of equities and equity-related instruments.
FUND MANAGER'S COMMENTSIn the month of Feb’17, the fund posted a return of 0.47% vs. benchmark return of 0.27%, an outperformance of 20 bps. During the month, weight wasprimarily increased in select Textiles (diversification into automobile manufacturing, assembling and sale), Power Generation & Distribution (lately a laggard,expected to rally) and Multi-utilities (proposal by KPMG to OGRA regarding relaxation in UFG allowance + government plan to import additional 1200mmcfdof LNG by 2018) while gains were booked in Auto Parts and Fertilizers (recent strong stock price performance). Major contribution to performance camefrom holdings in Commercial Banks, Cements, Fertilizers and Multi-utilities sectors. At the end of the month, the fund was invested in equities up to 93.17%of the Net Assets.
FUND INFORMATION ASSET ALLOCATION (% of Total Assets)
3.56%
3.63%
3.72%
4.99%
5.12%
5.15%
5.29%
5.84%
6.21%
7.60%
Packages Limited
Mari Petroleum Company Limited
D.G. Khan Cement Company Limited
Oil and Gas Development Company Ltd
MCB Bank Limited
Hub Power Company Limited
Engro Corporation Limited
United Bank Limited
Lucky Cement Limited
Habib Bank Limited
0.00%
10.00%
20.00%
30.00%
40.00%
50.00%
60.00%
Feb
-16
Mar
-16
Apr
-16
May
-16
Jun-
16
Jul-1
6
Aug
-16
Sep
-16
Oct
-16
Nov
-16
Dec
-16
Jan-
17
Feb
-17
Benchmark HBL SF
FEBRUARY 2017
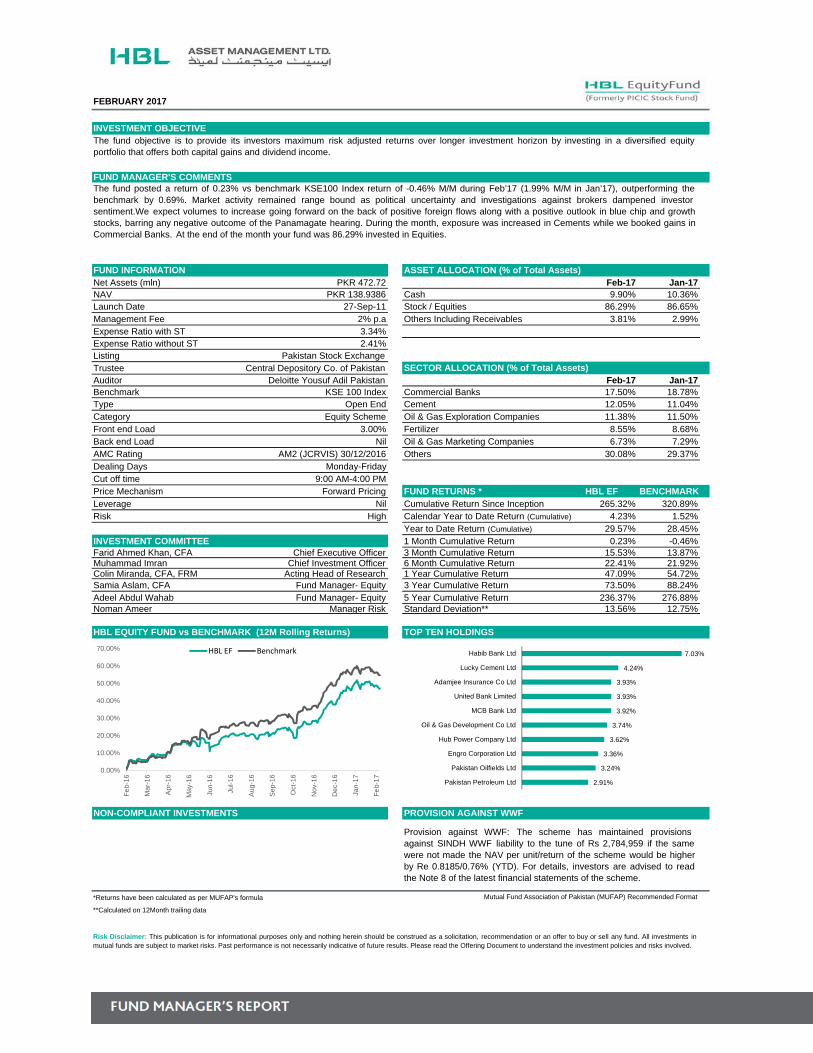
Net Assets (mln) PKR 472.72 Feb-17 Jan-17NAV PKR 138.9386 Cash 9.90% 10.36%Launch Date 27-Sep-11 Stock / Equities 86.29% 86.65%Management Fee 2% p.a Others Including Receivables 3.81% 2.99%Expense Ratio with ST 3.34%Expense Ratio without ST 2.41%Listing Pakistan Stock ExchangeTrustee Central Depository Co. of PakistanAuditor Deloitte Yousuf Adil Pakistan Feb-17 Jan-17Benchmark KSE 100 Index Commercial Banks 17.50% 18.78%Type Open End Cement 12.05% 11.04%Category Equity Scheme Oil & Gas Exploration Companies 11.38% 11.50%Front end Load 3.00% Fertilizer 8.55% 8.68%Back end Load Nil Oil & Gas Marketing Companies 6.73% 7.29%AMC Rating AM2 (JCRVIS) 30/12/2016 Others 30.08% 29.37%Dealing Days Monday-FridayCut off time 9:00 AM-4:00 PMPrice Mechanism Forward Pricing FUND RETURNS * HBL EF BENCHMARKLeverage Nil Cumulative Return Since Inception 265.32% 320.89%Risk High Calendar Year to Date Return (Cumulative) 4.23% 1.52%
Year to Date Return (Cumulative) 29.57% 28.45%INVESTMENT COMMITTEE 1 Month Cumulative Return 0.23% -0.46%Farid Ahmed Khan, CFA Chief Executive Officer 3 Month Cumulative Return 15.53% 13.87%Muhammad Imran Chief Investment Officer 6 Month Cumulative Return 22.41% 21.92%Colin Miranda, CFA, FRM Acting Head of Research 1 Year Cumulative Return 47.09% 54.72%Samia Aslam, CFA Fund Manager- Equity 3 Year Cumulative Return 73.50% 88.24%Adeel Abdul Wahab Fund Manager- Equity 5 Year Cumulative Return 236.37% 276.88%Noman Ameer Manager Risk Standard Deviation** 13.56% 12.75%
Provision against WWF: The scheme has maintained provisionsagainst SINDH WWF liability to the tune of Rs 2,784,959 if the samewere not made the NAV per unit/return of the scheme would be higherby Re 0.8185/0.76% (YTD). For details, investors are advised to readthe Note 8 of the latest financial statements of the scheme.
**Calculated on 12Month trailing data
Risk Disclaimer: This publication is for informational purposes only and nothing herein should be construed as a solicitation, recommendation or an offer to buy or sell any fund. All investments inmutual funds are subject to market risks. Past performance is not necessarily indicative of future results. Please read the Offering Document to understand the investment policies and risks involved.
SECTOR ALLOCATION (% of Total Assets)
HBL EQUITY FUND vs BENCHMARK (12M Rolling Returns) TOP TEN HOLDINGS
NON-COMPLIANT INVESTMENTS PROVISION AGAINST WWF
*Returns have been calculated as per MUFAP's formula Mutual Fund Association of Pakistan (MUFAP) Recommended Format
INVESTMENT OBJECTIVEThe fund objective is to provide its investors maximum risk adjusted returns over longer investment horizon by investing in a diversified equityportfolio that offers both capital gains and dividend income.
FUND MANAGER'S COMMENTSThe fund posted a return of 0.23% vs benchmark KSE100 Index return of -0.46% M/M during Feb’17 (1.99% M/M in Jan’17), outperforming thebenchmark by 0.69%. Market activity remained range bound as political uncertainty and investigations against brokers dampened investorsentiment.We expect volumes to increase going forward on the back of positive foreign flows along with a positive outlook in blue chip and growthstocks, barring any negative outcome of the Panamagate hearing. During the month, exposure was increased in Cements while we booked gains inCommercial Banks. At the end of the month your fund was 86.29% invested in Equities.
FUND INFORMATION ASSET ALLOCATION (% of Total Assets)
2.91%
3.24%
3.36%
3.62%
3.74%
3.92%
3.93%
3.93%
4.24%
7.03%
Pakistan Petroleum Ltd
Pakistan Oilfields Ltd
Engro Corporation Ltd
Hub Power Company Ltd
Oil & Gas Development Co Ltd
MCB Bank Ltd
United Bank Limited
Adamjee Insurance Co Ltd
Lucky Cement Ltd
Habib Bank Ltd
0.00%
10.00%
20.00%
30.00%
40.00%
50.00%
60.00%
70.00%
Fe
b-16
Ma
r-1
6
Ap
r-16
Ma
y-1
6
Jun-
16
Jul-1
6
Aug
-16
Sep
-16
Oct
-16
Nov
-16
Dec
-16
Jan-
17
Fe
b-17
HBL EF Benchmark

FEBRUARY 2017
Net Assets (mln) PKR 892.5 Feb-17 Jan-17NAV PKR 16.1834 Cash 7.68% 7.04%Launch Date *** 25-Jun-13 Stock / Equities 90.12% 90.49%Management Fee 2% p.a Others Including Receivables 2.20% 2.47%Expense Ratio with ST 2.63%Expense Ratio without ST 1.84%Listing Pakistan Stock Exchange Trustee Central Depository Co. of PakistanAuditor Deloitte Yousuf Adil Pakistan Feb-17 Jan-17Benchmark KSE 30 (Total Return) Oil & Gas Exploration Companies 31.96% 31.31%Type Open End Oil & Gas Marketing Companies 28.83% 25.73%Category Equity Scheme Power Generation & Distribution 25.24% 29.08%Front end Load 3.00% Refinery 4.09% 4.37%Back end Load NilAMC Rating AM2 (JCRVIS) 30/12/2016Dealing Days Monday-FridayCut off time 9:00 AM-4:00 PMPrice Mechanism Forward Pricing FUND RETURNS * HBL EF BENCHMARKLeverage Nil Cumulative Return Since Inception 76.42% 129.71%Risk High Calendar Year to Date Return (Cumulative) 3.29% 2.02%
Year to Date Return (Cumulative) 34.72% 28.34%INVESTMENT COMMITTEE 1 Month Cumulative Return -0.88% 0.27%Farid Ahmed Khan, CFA Chief Executive Officer 3 Month Cumulative Return 15.28% 16.28%Muhammad Imran Chief Investment Officer 6 Month Cumulative Return 25.00% 21.81%Colin Miranda, CFA, FRM Acting Head of Research 1 Year Cumulative Return 49.44% 54.58%Samia Aslam, CFA Fund Manager- Equity 3 Year Cumulative Return 53.72% 88.08%Adeel Abdul Wahab Fund Manager- Equity Standard Deviation** 10.98% 13.74%Noman Ameer Manager Risk
**Calculated on 12Month trailing data
***Conversion from Closed-end to open end fund
Provision against WWF: The scheme has maintained provisions againstSINDH WWF liability to the tune of Re 5,790,759 if the same were notmade the NAV per unit/return of the scheme would be higher by Re0.1050 /0.87% (YTD). For details, investors are advised to read the Note 9of the latest financial statements of the scheme.
Risk Disclaimer: This publication is for informational purposes only and nothing herein should be construed as a solicitation, recommendation or an offer to buy or sell any fund. All investments in mutualfunds are subject to market risks. Past performance is not necessarily indicative of future results. Please read the Offering Document to understand the investment policies and risks involved.
SECTOR ALLOCATION (% of Total Assets)
HBL ENERGY FUND vs BENCHMARK (12M Rolling Returns) TOP TEN HOLDINGS
NON-COMPLIANT INVESTMENTS PROVISION AGAINST WWF
*Returns have been calculated as per MUFAP's formula Mutual Fund Association of Pakistan (MUFAP) Recommended Format
INVESTMENT OBJECTIVEThe objective is to invest in securities defined in the energy sector to provide investors access to high quality blue chip stocks in the Energy sector.
FUND MANAGER'S COMMENTSThe fund posted a return of -0.88% vs benchmark KSE-30 (Total Return) Index return of 0.27% M/M during Feb’17 (1.75% M/M in Jan’17),underperforming the benchmark by 1.15%. Market activity remained range bound as political uncertainty and investigations against brokers dampenedinvestor sentiment. The primary drag on our fund returns was from our investments in the Oil and Gas exploration and Power Generation sectors. Weexpect volumes in the energy chain to increase going forward barring any negative outcome of the Panamagate hearing. During the month, exposurewas increased in Oil & Gas Marketing Companies while booking gains in Power Generation & Distribution companies. At the end of the month your fundwas 90.12% invested in Equities.
FUND INFORMATION ASSET ALLOCATION (% of Total Assets)
5.32%
5.78%
6.63%
6.72%
7.21%
7.84%
8.00%
8.10%
8.62%
9.41%
Attock Petroleum Limited
Kot Addu Power Company Limited
Shell Pakistan Limited
Pakistan Petroleum Limited
Pakistan State Oil Company Limited
Mari Petroleum Company Limited
Pakistan Oilfields Limited
Sui Northern Gas Pipeline Limited
Hub Power Company Limited
Oil & Gas Development Co Limited
0.0%
10.0%
20.0%
30.0%
40.0%
50.0%
60.0%
Feb
-16
Mar
-16
Ap
r-1
6
May
-16
Jun
-16
Jul-
16
Au
g-16
Se
p-16
Oct
-16
Nov
-16
Dec
-16
Jan
-17
Feb
-17
HBL EF Benchmark
FEBRUARY 2017
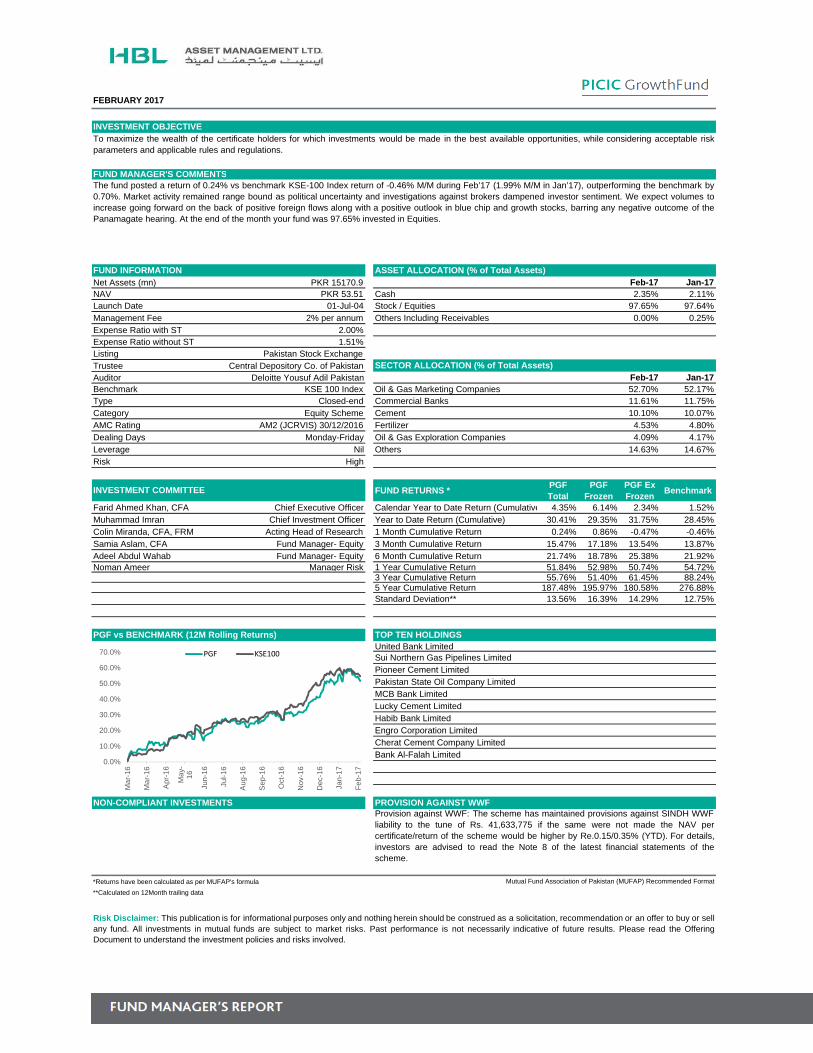
Net Assets (mn) PKR 15170.9 Feb-17 Jan-17NAV PKR 53.51 Cash 2.35% 2.11%Launch Date 01-Jul-04 Stock / Equities 97.65% 97.64%Management Fee 2% per annum Others Including Receivables 0.00% 0.25%Expense Ratio with ST 2.00%Expense Ratio without ST 1.51%Listing Pakistan Stock ExchangeTrustee Central Depository Co. of PakistanAuditor Deloitte Yousuf Adil Pakistan Feb-17 Jan-17Benchmark KSE 100 Index Oil & Gas Marketing Companies 52.70% 52.17%Type Closed-end Commercial Banks 11.61% 11.75%Category Equity Scheme Cement 10.10% 10.07%AMC Rating AM2 (JCRVIS) 30/12/2016 Fertilizer 4.53% 4.80%Dealing Days Monday-Friday Oil & Gas Exploration Companies 4.09% 4.17%Leverage Nil Others 14.63% 14.67%Risk High
FUND RETURNS *PGF Total
PGF Frozen
PGF Ex Frozen
Benchmark
Farid Ahmed Khan, CFA Chief Executive Officer Calendar Year to Date Return (Cumulative 4.35% 6.14% 2.34% 1.52%Muhammad Imran Chief Investment Officer Year to Date Return (Cumulative) 30.41% 29.35% 31.75% 28.45%Colin Miranda, CFA, FRM Acting Head of Research 1 Month Cumulative Return 0.24% 0.86% -0.47% -0.46%Samia Aslam, CFA Fund Manager- Equity 3 Month Cumulative Return 15.47% 17.18% 13.54% 13.87%Adeel Abdul Wahab Fund Manager- Equity 6 Month Cumulative Return 21.74% 18.78% 25.38% 21.92%Noman Ameer Manager Risk 1 Year Cumulative Return 51.84% 52.98% 50.74% 54.72%
3 Year Cumulative Return 55.76% 51.40% 61.45% 88.24%5 Year Cumulative Return 187.48% 195.97% 180.58% 276.88%Standard Deviation** 13.56% 16.39% 14.29% 12.75%
United Bank LimitedSui Northern Gas Pipelines LimitedPioneer Cement LimitedPakistan State Oil Company LimitedMCB Bank LimitedLucky Cement LimitedHabib Bank LimitedEngro Corporation LimitedCherat Cement Company LimitedBank Al-Falah Limited
Risk Disclaimer: This publication is for informational purposes only and nothing herein should be construed as a solicitation, recommendation or an offer to buy or sellany fund. All investments in mutual funds are subject to market risks. Past performance is not necessarily indicative of future results. Please read the OfferingDocument to understand the investment policies and risks involved.
FUND INFORMATION
TOP TEN HOLDINGS
*Returns have been calculated as per MUFAP's formula Mutual Fund Association of Pakistan (MUFAP) Recommended Format
**Calculated on 12Month trailing data
Provision against WWF: The scheme has maintained provisions against SINDH WWFliability to the tune of Rs. 41,633,775 if the same were not made the NAV percertificate/return of the scheme would be higher by Re.0.15/0.35% (YTD). For details,investors are advised to read the Note 8 of the latest financial statements of thescheme.
INVESTMENT OBJECTIVE
The fund posted a return of 0.24% vs benchmark KSE-100 Index return of -0.46% M/M during Feb’17 (1.99% M/M in Jan’17), outperforming the benchmark by0.70%. Market activity remained range bound as political uncertainty and investigations against brokers dampened investor sentiment. We expect volumes toincrease going forward on the back of positive foreign flows along with a positive outlook in blue chip and growth stocks, barring any negative outcome of thePanamagate hearing. At the end of the month your fund was 97.65% invested in Equities.
To maximize the wealth of the certificate holders for which investments would be made in the best available opportunities, while considering acceptable riskparameters and applicable rules and regulations.
NON-COMPLIANT INVESTMENTS PROVISION AGAINST WWF
FUND MANAGER'S COMMENTS
PGF vs BENCHMARK (12M Rolling Returns)
ASSET ALLOCATION (% of Total Assets)
SECTOR ALLOCATION (% of Total Assets)
INVESTMENT COMMITTEE
0.0%
10.0%
20.0%
30.0%
40.0%
50.0%
60.0%
70.0%
Ma
r-16
Ma
r-16
Apr
-16
Ma
y-16
Jun-
16
Jul-1
6
Aug
-16
Sep
-16
Oct
-16
Nov
-16
Dec
-16
Jan-
17
Feb
-17
PGF KSE100

FEBRUARY 2017
Net Assets (mn) PKR 6616.18 Feb-17 Jan-17NAV PKR 23.29 Cash 3.18% 2.88%Launch Date 01-Apr-04 Stock / Equities 96.60% 96.81%Management Fee 2% per annum Others Including Receivables 0.21% 0.31%Expense Ratio with ST 2.08%Expense Ratio without ST 1.54%Listing Pakistan Stock ExchangeTrustee Central Depository Co. of PakistanAuditor Deloitte Yousuf Adil Pakistan Feb-17 Jan-17Benchmark KSE 100 Index Oil & Gas Marketing Companies 42.71% 42.54%Type Closed-end Commercial Banks 13.24% 13.32%Category Equity Scheme Cement 11.94% 12.00%AMC Rating AM2 (JCRVIS) 30/12/2016 Fertilizer 5.57% 5.84%Dealing Days Monday-Friday Pharmaceuticals 5.30% 5.52%Leverage Nil Others 17.85% 17.58%Risk High
FUND RETURNS * PIF TotalPIF
FrozenPIF Ex Frozen
Benchmark
Farid Ahmed Khan, CFA Chief Executive Officer Calendar Year to Date Return (Cumulative) 3.28% 4.69% 2.21% 1.52%Muhammad Imran Chief Investment Officer Year to Date Return (Cumulative) 28.77% 25.53% 31.50% 28.45%Colin Miranda, CFA, FRM Acting Head of Research 1 Month Cumulative Return -0.13% 0.04% -0.26% -0.46%Samia Aslam, CFA Fund Manager- Equity 3 Month Cumulative Return 14.28% 15.10% 13.65% 13.87%Adeel Abdul Wahab Fund Manager- Equity 6 Month Cumulative Return 20.98% 15.77% 25.39% 21.92%Noman Ameer Manager Risk 1 Year Cumulative Return 49.01% 47.84% 50.10% 54.72%
3 Year Cumulative Return 52.85% 45.93% 59.16% 88.24%5 Year Cumulative Return 180.04% 187.38% 177.18% 276.88%Standard Deviation** 13.41% 16.59% 14.35% 12.75%
United Bank LimitedSui Northern Gas Pipeline LimitedPioneer Cement LimitedPakistan State Oil Company LimitedOil & Gas Development Co LimitedLucky Cement LimitedHabib Bank LimitedEngro Corporation LimitedCherat Cement Company LimitedBank Al-Falah Limited
INVESTMENT OBJECTIVETo maximize the wealth of the certificate holders for which investments would be made in the best available opportunities, while considering acceptable riskparameters and applicable rules and regulations.
FUND MANAGER'S COMMENTSThe fund posted a return of -0.13% vs benchmark KSE-100 Index return of -0.46% M/M during Feb’17 (1.99% M/M in Jan’17), outperforming the benchmark by0.33%. Market activity remained range bound as political uncertainty and investigations against brokers dampened investor sentiment. We expect volumes toincrease going forward on the back of positive foreign flows along with a positive outlook in blue chip and growth stocks, barring any negative outcome of thePanamagate hearing. At the end of the month your fund was 97.65% invested in Equities.
FUND INFORMATION ASSET ALLOCATION (% of Total Assets)
Provision against WWF: The scheme has maintained provisions against SINDH WWFliability to the tune of Rs. 21,996,848 if the same were not made the NAV percertificate/return of the scheme would be higher by Re. 0.08/0.42% (YTD). For details,investors are advised to read the Note 8 of the latest financial statements of the scheme.
Risk Disclaimer: This publication is for informational purposes only and nothing herein should be construed as a solicitation, recommendation or an offer to buy or sell anyfund. All investments in mutual funds are subject to market risks. Past performance is not necessarily indicative of future results. Please read the Offering Document tounderstand the investment policies and risks involved.
SECTOR ALLOCATION (% of Total Assets)
INVESTMENT COMMITTEE
PIF vs BENCHMARK (12M Rolling Returns) TOP TEN HOLDINGS
NON-COMPLIANT INVESTMENTS PROVISION AGAINST WWF
*Returns have been calculated as per MUFAP's formula Mutual Fund Association of Pakistan (MUFAP) Recommended Format
**Calculated on 12Month trailing data
0.0%
10.0%
20.0%
30.0%
40.0%
50.0%
60.0%
70.0%
Ma
r-1
6
Ma
r-1
6
Ap
r-1
6
Ma
y-1
6
Jun
-16
Jul-
16
Au
g-1
6
Se
p-1
6
Oct
-16
No
v-1
6
De
c-1
6
Jan
-17
Fe
b-1
7
PIF Benchmark
FUND INFORMATION ASSET ALLOCATION (% of Total Assets)Launch Date Money Market Sub Fund Feb-17 Jan-17Management Fee 1.5% p.a Tbill 69.13% 67.05%Trustee Central Depository Co. of Pakistan Cash 0.80% 2.91%Auditor Deloitte Yousuf Adil Pakistan Placement With Banks and DFI 29.36% 29.41%Type Open End Sukuk 0.00% 0.00%Category Pensions Scheme Others & receivables 0.71% 0.63%Front end Load Max 3%Back end Load Nil Debt Sub Fund Feb-17 Jan-17AMC Rating AM2 (JCRVIS) 30/12/2016 Placement With Banks and DFI 11.48% 11.52%Dealing Days Monday-Friday Tbill 3.41% 12.67%Cut off time 9:00 AM-3:00 PM PIB 67.06% 58.53%Price Mechanism Forward Pricing TFCs 14.58% 13.01%Risk Profile Cash 1.25% 2.47%
Others & receivables 2.23% 1.80%Money Market Debt Equity
AUM Million 151.4532 172.5161 199.0621 Equity Sub Fund Feb-17 Jan-17NAV(PKR) 139.1809 150.9875 409.0085 Equities 86.07% 92.75%WAM (Days) 62 859 Cash 13.49% 6.92%Leverage Others & receivables 0.44% 0.33%
INVESTMENT COMMITTEE SECTOR ALLOCATION EQUITY Feb-17 Jan-17Farid Ahmed Khan, CFA Chief Executive Officer Cement 13.93% 13.86%Muhammad Imran Chief Investment Officer Oil & Gas Exploration Companies 13.74% 14.31%Colin Miranda, CFA, FRM Acting Head of Research Commercial Banks 12.16% 13.38%Tauqir Shamshad Head of Fixed Income Power Generation & Distribution 8.28% 5.69%Samia Aslam, CFA Fund Manager- Equity Fertilizer 5.87% 10.05%Adeel Abdul Wahab Fund Manager- Equity Others 32.08% 35.46%Noman Ameer Manager Risk
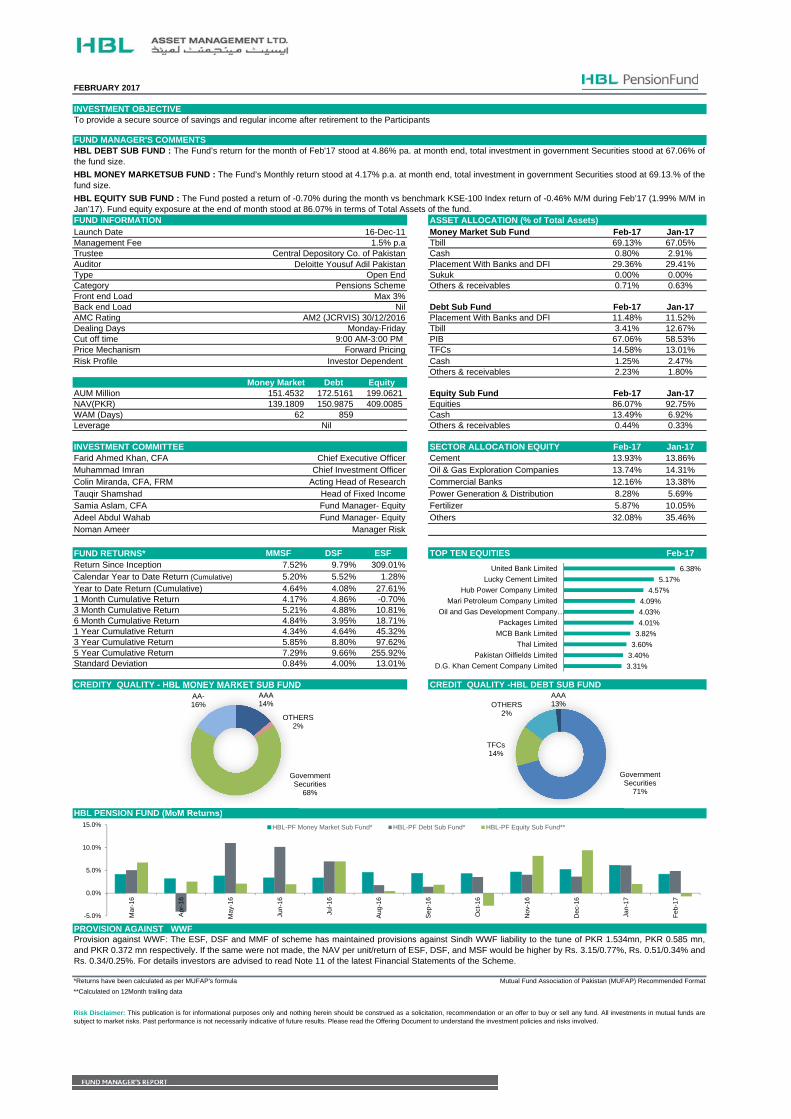
FUND RETURNS* MMSF DSF ESF TOP TEN EQUITIES Feb-17Return Since Inception 7.52% 9.79% 309.01%Calendar Year to Date Return (Cumulative) 5.20% 5.52% 1.28%Year to Date Return (Cumulative) 4.64% 4.08% 27.61%1 Month Cumulative Return 4.17% 4.86% -0.70%3 Month Cumulative Return 5.21% 4.88% 10.81%6 Month Cumulative Return 4.84% 3.95% 18.71%1 Year Cumulative Return 4.34% 4.64% 45.32%3 Year Cumulative Return 5.85% 8.80% 97.62%5 Year Cumulative Return 7.29% 9.66% 255.92%Standard Deviation 0.84% 4.00% 13.01%
CREDITY QUALITY - HBL MONEY MARKET SUB FUND CREDIT QUALITY -HBL DEBT SUB FUND
PROVISION AGAINST WWF
**Calculated on 12Month trailing data
Provision against WWF: The ESF, DSF and MMF of scheme has maintained provisions against Sindh WWF liability to the tune of PKR 1.534mn, PKR 0.585 mn,and PKR 0.372 mn respectively. If the same were not made, the NAV per unit/return of ESF, DSF, and MSF would be higher by Rs. 3.15/0.77%, Rs. 0.51/0.34% andRs. 0.34/0.25%. For details investors are advised to read Note 11 of the latest Financial Statements of the Scheme.
Risk Disclaimer: This publication is for informational purposes only and nothing herein should be construed as a solicitation, recommendation or an offer to buy or sell any fund. All investments in mutual funds aresubject to market risks. Past performance is not necessarily indicative of future results. Please read the Offering Document to understand the investment policies and risks involved.
HBL PENSION FUND (MoM Returns)
*Returns have been calculated as per MUFAP's formula Mutual Fund Association of Pakistan (MUFAP) Recommended Format
FEBRUARY 2017
To provide a secure source of savings and regular income after retirement to the Participants
HBL DEBT SUB FUND : The Fund’s return for the month of Feb'17 stood at 4.86% pa. at month end, total investment in government Securities stood at 67.06% ofthe fund size.
HBL MONEY MARKETSUB FUND : The Fund’s Monthly return stood at 4.17% p.a. at month end, total investment in government Securities stood at 69.13.% of thefund size.
HBL EQUITY SUB FUND : The Fund posted a return of -0.70% during the month vs benchmark KSE-100 Index return of -0.46% M/M during Feb’17 (1.99% M/M inJan’17). Fund equity exposure at the end of month stood at 86.07% in terms of Total Assets of the fund.
INVESTMENT OBJECTIVE
FUND MANAGER'S COMMENTS
16-Dec-11
Investor Dependent
Nil
AAA14%
OTHERS 2%
Government Securities
68%
AA-16%
Government Securities
71%
TFCs14%
AAA13%OTHERS
2%
-5.0%
0.0%
5.0%
10.0%
15.0%
Mar
-16
Apr
-16
May
-16
Jun-
16
Jul-1
6
Aug
-16
Sep
-16
Oct
-16
Nov
-16
Dec
-16
Jan-
17
Feb
-17
HBL-PF Money Market Sub Fund* HBL-PF Debt Sub Fund* HBL-PF Equity Sub Fund**
3.31%
3.40%
3.60%
3.82%
4.01%
4.03%
4.09%
4.57%
5.17%
6.38%
D.G. Khan Cement Company Limited
Pakistan Oilfields Limited
Thal Limited
MCB Bank Limited
Packages Limited
Oil and Gas Development Company…
Mari Petroleum Company Limited
Hub Power Company Limited
Lucky Cement Limited
United Bank Limited

Islamic Funds

FEBRUARY 2017
Net Assets PKR. 647 million Feb-17 Jan-17NAV PKR. 103.5514 Cash 99.27% 99.48%Launch Date 10-May-11 Placement With Banks and DFIs 0.00% 0.00%Management Fee 1% p.a GoP Ijara Sukuks 0.00% 0.00%
Expense Ratio without ST 0.93% Others Including receivables 0.73% 0.52%
Expense Ratio with ST 1.12%Listing Pakistan Stock ExchangeTrustee Central Depository Co. of Pakistan
Auditor Deloitte Yousuf Adil Pakistan FUND RETURNS (%)* HBL IMMF* BenchmarkBenchmark Three months average deposit rates Annualized Return Since Inception 8.36% 6.32%
of three (3) AA rated Islamic Banks Year to Date Annualized Return 4.39% 3.56%or Islamic windows of Conventional Calendar YTD Annualized Return 4.90% 2.68%
Banks as selected by MUFAP. 1 Month Annualized Return 3.60% 2.67%Type Open End 3 Month Annualized Return 4.45% 2.70%Category Islamic Money Market Scheme 6 Month Annualized Return 4.40% 3.07%Front end Load Nil 12 Month Annualized Return 4.16% 4.09%Back end Load NilAMC Rating AM2 ( JCRVIS) 30/12/2016Dealing Days Monday-Friday * Return have been calculate as par MUFAP,s formula
Cut off time 9:00 AM-3:00 PMPrice Mechanism Forward PricingFund Stability Rating AA(f) (JCR VIS) 01/05/2017Leverage NilRisk LowWeighted Average Maturity 01 Day
Farid Ahmed Khan, CFA Chief Executive OfficerMuhammad Imran Chief Investment OfficerColin Miranda Acting Head of ResearchTauqir Shamshad Head of Fixed IncomeNoman Ameer Manager Risk
Nil
**Calculated on 12Month trailing data
INVESTMENT OBJECTIVEThe objective of HBL Islamic Money Market Fund is to seek high liquidity, competitive return and maximum possible preservation of capital for investors byinvestment in low risk Shariah Compliant securities
FUND MANAGER'S COMMENTSDuring the Month the fund size increased to PKR. 647 mn from PKR. 633 mn in Jan 17. HBL Islamic Money Market Fund posted a return of 3.60% against thebenchmark return of 2.67%. The fund maintained its cash position at 99.27%, going forward the fund will work towards increasing the net return by diversifyingthe portfolio for better profit rates.
FUND INFORMATION ASSET ALLOCATION (% of Total Assets)
The scheme has maintained provisions against Sindh WWF liability tothe tune of Rs 1,291,479/- if the same were not made the NAV perunit/return of the scheme would be higher by Rs 0.21 /0.20% (YTD). Fordetails, investors are advised to read the Note 6.2 of the latest financialstatements of the scheme.”
Risk Disclaimer: This publication is for informational purposes only and nothing herein should be construed as a solicitation, recommendation or an offer to buy or sell any fund. All investments inmutual funds are subject to market risks. Past performance is not necessarily indicative of future results. Please read the Offering Document to understand the investment policies and risks involved.
ASSET QUALITY (% Total Assets)
INVESTMENT COMMITTEE
HBL ISLAMIC MONEY MARKET FUND vs BENCHMARK (MoM Returns) WEIGHTED AVERAGE MATURITY
NON-COMPLIANT INVESTMENTS PROVISION AGAINST WWF
*Returns have been calculated as per MUFAP's formula Mutual Fund Association of Pakistan (MUFAP) Recommended Format
AAA1.51%
AA+98.46%
AA0.03%
‐
‐
1
Term Deposits with Banks
GoP Ijara Sukuks
Cash
0.0%
1.0%
2.0%
3.0%
4.0%
5.0%
6.0%
7.0%
Ma
r-1
6
Ap
r-1
6
Ma
y-1
6
Jun-
16
Jul-1
6
Aug
-16
Sep
-16
Oct
-16
Nov
-16
Dec
-16
Jan-
17
Fe
b-17
IMMF Benchmark

FEBRUARY 2017
Net Assets PKR 411 million Feb-17 Jan-17NAV PKR 103.9494 Cash 54.39% 70.28%Launch Date 29-May-14 Placement with Banks & DFI 0.00% 0.00%Management Fee 10% of gross earnings subject to a TFCs / Corporate Sukuks 44.30% 28.48%
minimum fee of 0.50% and a maximum GOP Ijara Sukuk 0.00% 0.00% fee of 1.50% of average daily net assets Others Including receivables 1.31% 1.24%
Expense Ratio without ST 0.94%Expense Ratio with ST 1.14%Listing Pakistan Stock ExchangeTrustee Central Depository Co. of PakistanAuditor Deloitte Yousuf Adil Pakistan FUND RETURNS * HBL IIF BENCHMARKBenchmark Avg. of 6M profit rate of 3 Islamic Banks Annualized Return Since Inception 6.59% 5.42%
or Islamic Windows Conventional Bank rated A and above Year to Date Annualized Return 4.78% 3.76%Type Open End Calendar Year to Date Annualized Return 5.61% 2.80%Category Islamic Income Scheme 1 Month Annualized Return 7.07% 2.84%Front end Load Class B: 0% to 1.50% 3 Month Annualized Return 5.18% 2.80%Back end Load Nil 6 Month Annualized Return 4.76% 3.22%AMC Rating AM2 (JCR VIS) 30-Dec-16 1 Year Annualized Return 4.82% 4.35%Dealing Days Monday-FridayCut off time 9:00 AM-4:00 PMPrice Mechanism Forward PricingFund Stability Rating A+(f) (JCR VIS) 05-Jan-17Leverage NilRisk LowWeighted Average Maturity 891
Farid Ahmed Khan, CFA Chief Executive OfficerMuhammad Imran Chief Investment OfficerTauqir Shamshad Head of Fixed IncomeColin Miranda, CFA, FRM Acting Head of ResearchNoman Ameer Manager Risk
**Calculated on 12Month trailing data
Risk Disclaimer: This publication is for informational purposes only and nothing herein should be construed as a solicitation, recommendation or an offer to buy or sell any fund. All investments inmutual funds are subject to market risks. Past performance is not necessarily indicative of future results. Please read the Offering Document to understand the investment policies and risks involved.
ASSET QUALITY (% of Total Assets)
INVESTMENT COMMITTEE
HBL ISLAMIC INCOME FUND vs BENCHMARK (MoM Returns) TOP TEN HOLDINGS (% of Total Asset)
NON-COMPLIANT INVESTMENTS PROVISION AGAINST WWF
INVESTMENT OBJECTIVETo provide competitive risk adjusted returns to its investors by investing in a diversified portfolio of long, medium and short term Shariah compliantdebt instruments while taking into account liquidity considerations.
The scheme has maintained provision against SINDH WWF liabilityto the tune of Re 548,874 if the same were not made the NAV perunit/return of the scheme would be higher by Re 0.1387/0.21%(YTD). For details, investors are advised to read the Note 10 of thelatest financial statements of the scheme
*Returns have been calculated as per MUFAP's formula Mutual Fund Association of Pakistan (MUFAP) Recommended Format
The scheme holds certain non-compliant investments. Before making any investment decision, investors should review this document and latest financial statements.
FUND MANAGER'S COMMENTSDuring the month of February, the Fund size decreased to PKR 411mn from PKR 453mn in Jan'17. The Fund earned an annualized return of 7.07%for the month. The overall weighted average time to maturity stood at 601 days against 569 days in the previous month. The Fund Manager increasedthe exposure in high rated credit corporate sukuks to augment the returns.
FUND INFORMATION ASSET ALLOCATION (% of Total Assets)
7.98%
15.98%
12.77%
7.57%
ENGRO FERTILIZER LTD
FATIMA FERTILIZER COMPANY LTD
GHANI GASSES LTD
MEEZAN BANK LTD
AAA0.67%
AA‐82.49%
A+15.51%
A0.01%
Others1.31%
0.0%
1.0%
2.0%
3.0%
4.0%
5.0%
6.0%
7.0%
8.0%
Ma
r-1
6
Apr
-16
Ma
y-16
Jun-
16
Jul-1
6
Aug
-16
Sep
-16
Oct
-16
Nov
-16
Dec
-16
Jan-
17
Fe
b-17
HBL IIF Benchmark
FEBRUARY 2017
Net Assets (mln) PKR 1,384.33 Feb-17 Jan-17NAV PKR 112.5761 Cash 53.34% 51.81%Launch Date 11-Jan-16 Government of Pakistan Ijarah Sukuk 15.16% 15.62%Management Fee 1.5% p.a. Sukuks 2.92% 2.97%Expense Ratio without ST 1.25% Stock/Equities 27.53% 28.65%Expense Ratio with ST 1.73% Others Including Receivables 1.06% 0.96%Listing Pakistan Stock ExchangeTrustee Central Depository Co. of Pakistan FUND RETURNS* HBL IAAF* BENCHMARKAuditor Deloitte Yousuf Adil Pakistan Cumulative Return Since Inception 13.45% 15.98%Benchmark Weighted average daily return of Calendar Year to Date Return (Cumulative) 1.35% 0.96%
KMI30 and 6M deposit rate of A rated (and above) Islamic Year to Date Return (Cumulative) 9.79% 8.69%Banks or Islamic Banking windows of scheduled commercial 1 Month Cumulative Return 0.28% 0.05%
banks, based on the actual proportion held by the scheme 3 Month Cumulative Return 4.79% 5.25%Type Open End 6 Month Cumulative Return 8.02% 6.73%Category Shariah Compliant Asset Allocation 1 Year Cumulative Return 13.17% 16.71%Front end Load Up to 2.00% Standard Deviation** 4.38% 4.85%Back end Load NilAMC Rating AM2 (JCR VIS) 30-Dec-16Dealing Days Monday-FridayCut-off time 9:00 AM-3:00 PMPrice Mechanism Forward PricingFund Stability Rating Not RatedLeverage NilRisk Moderate to High
INVESTMENT COMMITTEEFarid Ahmed Khan, CFA Chief Executive OfficerMuhammad Imran Chief Investment OfficerColin Miranda, CFA, FRM Acting Head of ResearchTauqir Shamshad Head of Fixed IncomeSamia Aslam, CFA Fund Manager - Equity Feb-17 Jan-17Adeel Abdul Wahab Fund Manager - Equity Cement 6.67% 6.76%Noman Ameer Manager Risk Oil & Gas Exploration Companies 5.73% 6.91%
Fertilizer 3.90% 5.01%TOP TEN HOLDINGS (Sukuks) Power Generation & Distribution 3.33% 3.10%
Oil & Gas Marketing Companies 1.56% 1.08%Others 6.32% 5.79%
Nil
**Calculated on 12Month trailing data.
ASSET QUALITY (% Total Assets)
SECTOR ALLOCATION (% of Total Assets)
HBL IAAF vs. BENCHMARK (12M Rolling Returns) TOP TEN HOLDINGS (Equities)
NON-COMPLIANT INVESTMENTS PROVISION AGAINST WWF
The scheme has maintained provision against Sindh WWF liability to thetune of PKR 1.977mn, if the same were not made the NAV per unitwould be higher by Rs. 0.16/0.14%. For details, investors are advised toread the Note 8.3 of the latest financial statements of the scheme.
Mutual Fund Association of Pakistan (MUFAP) Recommended Format
Risk Disclaimer: This publication is for informational purposes only and nothing herein should be construed as a solicitation, recommendation or an offer to buy or sell any fund. All investments inmutual funds are subject to market risks. Past performance is not necessarily indicative of future results. Please read the Offering Document to understand the investment policies and risks involved.
*Returns have been calculated as per MUFAP's formula.
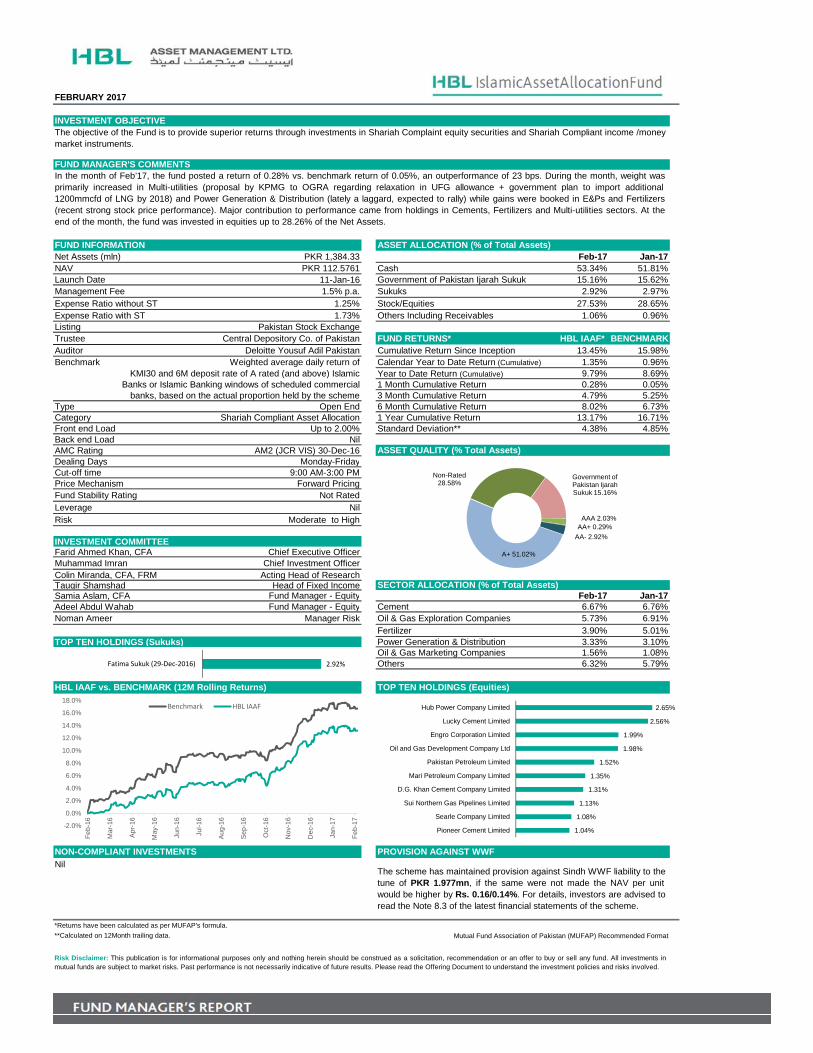
INVESTMENT OBJECTIVEThe objective of the Fund is to provide superior returns through investments in Shariah Complaint equity securities and Shariah Compliant income /moneymarket instruments.
FUND MANAGER'S COMMENTSIn the month of Feb’17, the fund posted a return of 0.28% vs. benchmark return of 0.05%, an outperformance of 23 bps. During the month, weight wasprimarily increased in Multi-utilities (proposal by KPMG to OGRA regarding relaxation in UFG allowance + government plan to import additional1200mmcfd of LNG by 2018) and Power Generation & Distribution (lately a laggard, expected to rally) while gains were booked in E&Ps and Fertilizers(recent strong stock price performance). Major contribution to performance came from holdings in Cements, Fertilizers and Multi-utilities sectors. At theend of the month, the fund was invested in equities up to 28.26% of the Net Assets.
FUND INFORMATION ASSET ALLOCATION (% of Total Assets)
1.04%
1.08%
1.13%
1.31%
1.35%
1.52%
1.98%
1.99%
2.56%
2.65%
Pioneer Cement Limited
Searle Company Limited
Sui Northern Gas Pipelines Limited
D.G. Khan Cement Company Limited
Mari Petroleum Company Limited
Pakistan Petroleum Limited
Oil and Gas Development Company Ltd
Engro Corporation Limited
Lucky Cement Limited
Hub Power Company Limited
Non-Rated 28.58%
Government of Pakistan Ijarah Sukuk 15.16%
AAA 2.03%AA+ 0.29%
AA- 2.92%
A+ 51.02%
2.92%Fatima Sukuk (29‐Dec‐2016)
-2.0%
0.0%
2.0%
4.0%
6.0%
8.0%
10.0%
12.0%
14.0%
16.0%
18.0%
Feb
-16
Mar
-16
Apr
-16
May
-16
Jun-
16
Jul-1
6
Aug
-16
Sep
-16
Oct
-16
Nov
-16
Dec
-16
Jan-
17
Feb
-17
Benchmark HBL IAAF
FEBRUARY 2017
Net Assets (mln) PKR 974.22 Feb-17 Jan-17NAV PKR 164.3192 Cash 6.62% 7.51%Launch Date 10-May-11 Stock / Equities 91.92% 86.56%Management Fee 2.0% p.a. Others Including Receivables 1.45% 5.92%Expense Ratio with ST 2.19%Expense Ratio without ST 1.61%Listing Pakistan Stock ExchangeTrustee Central Depository Co. of PakistanAuditor Deloitte Yousuf Adil Pakistan Feb-17 Jan-17Benchmark KMI30 Index Oil & Gas Exploration Companies 19.60% 20.12%Type Open End Cement 19.55% 18.20%Category Equity Scheme Fertilizer 14.38% 15.62%Front end Load 2.00% Power Generation & Distribution 9.72% 8.09%Back end Load Nil Pharmaceuticals 4.79% 4.61%AMC Rating AM2 (JCR VIS) 30-Dec-16 Others Including Receivables 23.88% 19.92%Dealing Days Monday-FridayCut-off time 9:00 AM-3:00 PMPrice Mechanism Forward Pricing FUND RETURNS * HBL ISF BENCHMARKLeverage Nil Cumulative Return Since Inception 227.73% 312.37%Risk High Calendar Year to Date Return (Cumulative) 2.47% 2.17%
Year to Date Return (Cumulative) 28.36% 26.31%1 Month Cumulative Return 0.18% -0.29%3 Month Cumulative Return 14.59% 16.99%
Farid Ahmed Khan, CFA Chief Executive Officer 6 Month Cumulative Return 19.98% 20.41%Muhammad Imran Chief Investment Officer 1 Year Cumulative Return 48.40% 55.46%Colin Miranda, CFA, FRM Acting Head of Research 3 Year Cumulative Return 59.33% 94.86%Samia Aslam, CFA Fund Manager - Equity 5 Year Cumulative Return 180.56% 265.16%Adeel Abdul Wahab Fund Manager - Equity Standard Deviation** 14.96% 16.99%Noman Ameer Manager Risk
Nil
**Calculated on 12Month trailing data
The scheme has maintained provision against Sindh WWF liability to thetune of PKR 5.234mn, if the same were not made the NAV per unitwould be higher by Rs. 0.88/0.54%. For details, investors are advised toread the Note 7.2 of the latest financial statements of the scheme.
Risk Disclaimer: This publication is for informational purposes only and nothing herein should be construed as a solicitation, recommendation or an offer to buy or sell any fund. All investmentsin mutual funds are subject to market risks. Past performance is not necessarily indicative of future results. Please read the Offering Document to understand the investment policies and risksinvolved.
*Returns have been calculated as per MUFAP's formula Mutual Fund Association of Pakistan (MUFAP) Recommended Format
SECTOR ALLOCATION (% of Total Assets)
INVESTMENT COMMITTEE
HBL ISLAMIC STOCK FUND vs. BENCHMARK (12M Rolling TOP TEN HOLDINGS (% of Total Assets)
NON-COMPLIANT INVESTMENTS PROVISION AGAINST WWF
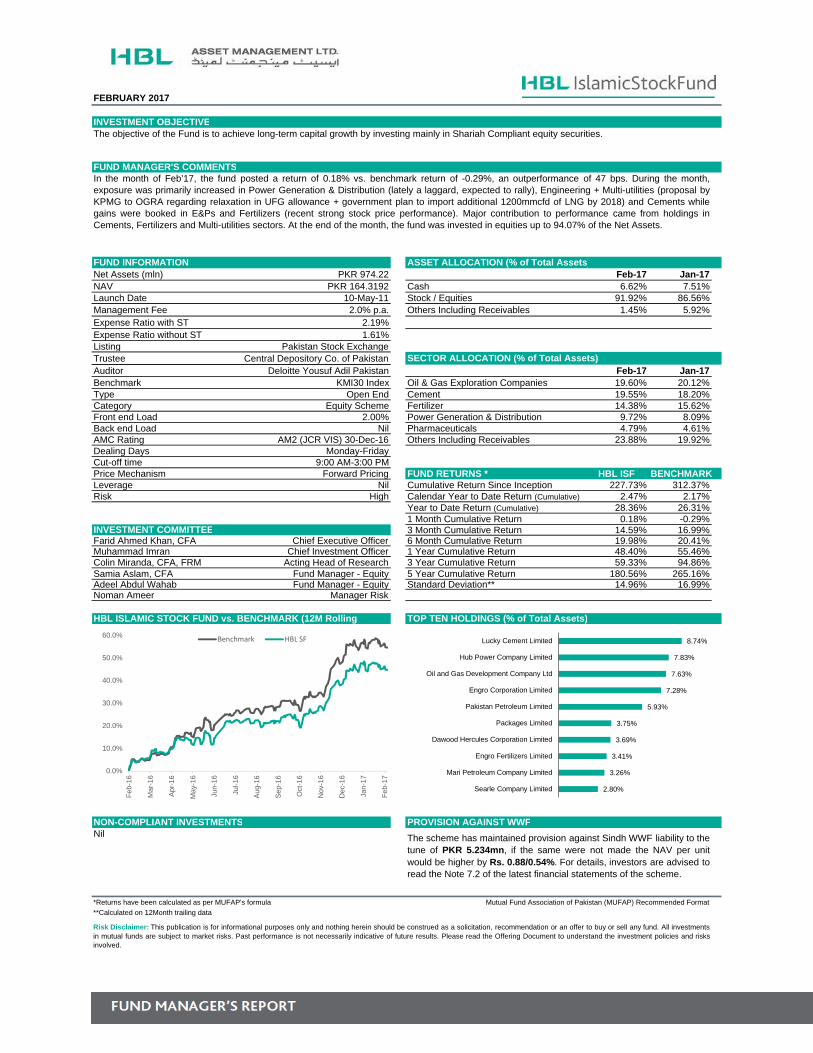
INVESTMENT OBJECTIVEThe objective of the Fund is to achieve long-term capital growth by investing mainly in Shariah Compliant equity securities.
FUND MANAGER'S COMMENTSIn the month of Feb’17, the fund posted a return of 0.18% vs. benchmark return of -0.29%, an outperformance of 47 bps. During the month,exposure was primarily increased in Power Generation & Distribution (lately a laggard, expected to rally), Engineering + Multi-utilities (proposal byKPMG to OGRA regarding relaxation in UFG allowance + government plan to import additional 1200mmcfd of LNG by 2018) and Cements whilegains were booked in E&Ps and Fertilizers (recent strong stock price performance). Major contribution to performance came from holdings inCements, Fertilizers and Multi-utilities sectors. At the end of the month, the fund was invested in equities up to 94.07% of the Net Assets.
FUND INFORMATION ASSET ALLOCATION (% of Total Assets)
2.80%
3.26%
3.41%
3.69%
3.75%
5.93%
7.28%
7.63%
7.83%
8.74%
Searle Company Limited
Mari Petroleum Company Limited
Engro Fertilizers Limited
Dawood Hercules Corporation Limited
Packages Limited
Pakistan Petroleum Limited
Engro Corporation Limited
Oil and Gas Development Company Ltd
Hub Power Company Limited
Lucky Cement Limited
0.0%
10.0%
20.0%
30.0%
40.0%
50.0%
60.0%
Feb
-16
Mar
-16
Apr
-16
May
-16
Jun-
16
Jul-1
6
Aug
-16
Sep
-16
Oct
-16
Nov
-16
Dec
-16
Jan-
17
Feb
-17
Benchmark HBL SF

FEBRUARY 2017
Net Assets (mln) PKR 458.05 Feb-17 Jan-17NAV PKR 136.6732 Cash 10.41% 8.24%Launch Date 29-May-14 Stock / Equities 88.66% 91.04%Management Fee 2% p.a Others Including Receivables 0.93% 0.72%Expense Ratio with ST 3.10%Expense Ratio without ST 2.20%Listing Pakistan Stock ExchangeTrustee Central Depository Co. of PakistanAuditor Deloitte Yousuf Adil Pakistan Feb-17 Jan-17Benchmark KMI-30 Index Oil & Gas Exploration Companies 19.23% 19.95%Type Open End Cement 18.98% 18.77%Category Islamic Equity Scheme Fertilizer 14.39% 15.85%Front end Load 3.00% Power Generation & Distribution 10.40% 9.18%Back end Load Nil Pharmaceuticals 7.38% 8.04%AMC Rating AM2 (JCRVIS) 30/12/2016 Others 18.27% 19.25%Dealing Days Monday-FridayCut off time 9:00 AM-4:00 PMPrice Mechanism Forward Pricing FUND RETURNS * HBL IEF BENCHMARKLeverage Nil Cumulative Return Since Inception 78.88% 78.85%Risk High Calendar Year to Date Return (Cumulative) 2.78% 2.17%
Year to Date Return (Cumulative) 28.36% 26.31%INVESTMENT COMMITTEE 1 Month Cumulative Return 0.53% -0.29%Farid Ahmed Khan, CFA Chief Executive Officer 3 Month Cumulative Return 14.51% 16.99%Muhammad Imran Chief Investment Officer 6 Month Cumulative Return 21.12% 20.41%Colin Miranda, CFA, FRM Acting Head of Research 1 Year Cumulative Return 45.75% 55.46%Samia Aslam, CFA Fund Manager- Equity Standard Deviation** 13.35% 16.99%Adeel Abdul Wahab Fund Manager- EquityNoman Ameer Manager Risk
INVESTMENT OBJECTIVEThe objective of PICIC Islamic Stock Fund is to provide the maximum total return to the unit holders from investment in shariah compliant equityinvestments for the given level of risk.
FUND MANAGER'S COMMENTS
FUND INFORMATION ASSET ALLOCATION (% of Total Assets)
The fund posted a return of 0.53% vs benchmark KMI-30 Index return of -0.29% M/M during Feb’17 (2.47% M/M in Jan’17) outperforming thebenchmark by 0.82%. Market activity remained range bound as political uncertainty and investigations against brokers dampened investorsentiment. During the month, we booked gains in the Fertilizer sector . At the end of the month the fund was 88.66% invested in Equities.
Provision against WWF: The scheme has maintained provisions againstSINDH WWF liability to the tune of Rs 3,466,575 if the same were notmade the NAV per unit/return of the scheme would be higher by Re1.0344/ 0.97% (YTD).For details, investors are advised to read the Note9 of the latest financial statements of the scheme.
**Calculated on 12Month trailing data
Risk Disclaimer: This publication is for informational purposes only and nothing herein should be construed as a solicitation, recommendation or an offer to buy or sell any fund. All investments inmutual funds are subject to market risks. Past performance is not necessarily indicative of future results. Please read the Offering Document to understand the investment policies and risksinvolved.
SECTOR ALLOCATION (% of Total Assets)
HBL IEF vs BENCHMARK (12M Rolling Returns) TOP TEN HOLDINGS
NON-COMPLIANT INVESTMENTS PROVISION AGAINST WWF
*Returns have been calculated as per MUFAP's formula Mutual Fund Association of Pakistan (MUFAP) Recommended Format
3.08%
3.32%
3.66%
4.24%
4.35%
4.66%
7.14%
7.38%
8.26%
8.84%
Mari Petroleum Company Ltd
Fauji Cement Company Limited
The Searle Company Ltd
Dawood Hercules Corporation Ltd
Pakistan Petroleum Ltd
Pakistan Oilfields Ltd
Oil & Gas Development Co Ltd
Engro Corporation Ltd
Hub Power Company Ltd
Lucky Cement Ltd
0.0%
10.0%
20.0%
30.0%
40.0%
50.0%
60.0%
70.0%
Fe
b-16
Ma
r-1
6
Apr
-16
Ma
y-16
Jun-
16
Jul-1
6
Aug
-16
Sep
-16
Oct
-16
Nov
-16
Dec
-16
Jan-
17
Fe
b-17
HBL IEF Benchmark
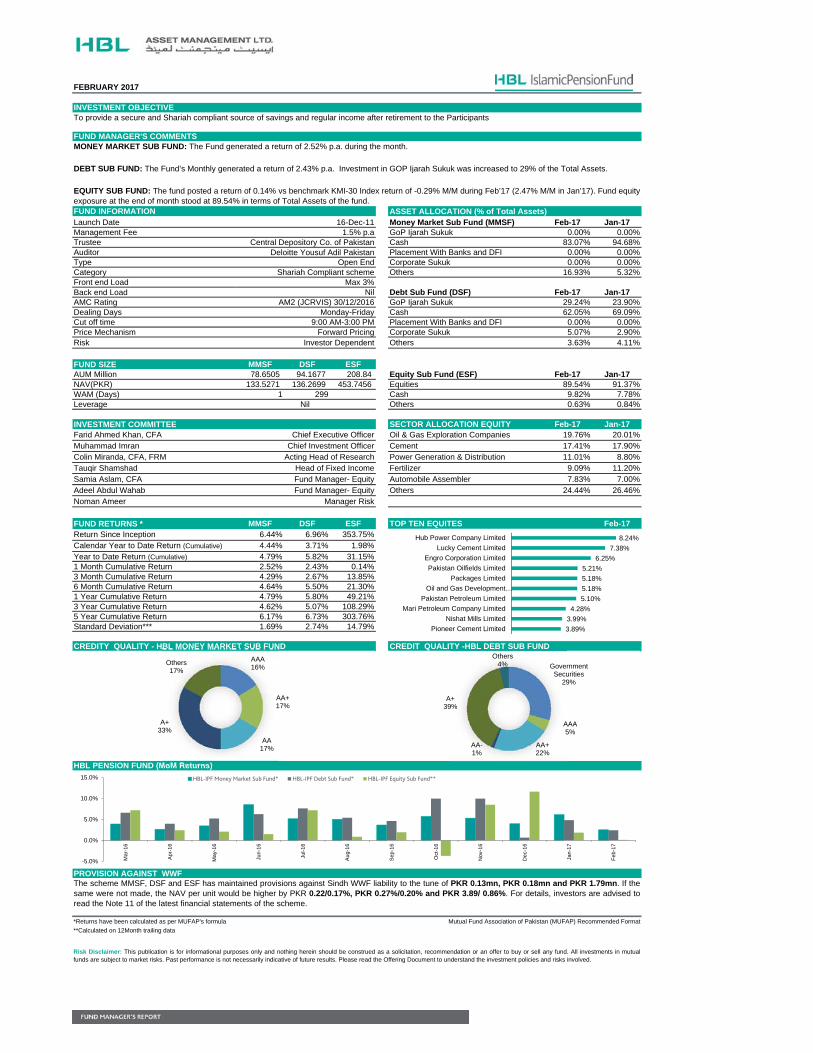
FUND INFORMATION ASSET ALLOCATION (% of Total Assets)Launch Date 16-Dec-11 Money Market Sub Fund (MMSF) Feb-17 Jan-17Management Fee 1.5% p.a GoP Ijarah Sukuk 0.00% 0.00%Trustee Central Depository Co. of Pakistan Cash 83.07% 94.68%Auditor Deloitte Yousuf Adil Pakistan Placement With Banks and DFI 0.00% 0.00%Type Open End Corporate Sukuk 0.00% 0.00%Category Shariah Compliant scheme Others 16.93% 5.32%Front end Load Max 3%Back end Load Nil Debt Sub Fund (DSF) Feb-17 Jan-17AMC Rating AM2 (JCRVIS) 30/12/2016 GoP Ijarah Sukuk 29.24% 23.90%Dealing Days Monday-Friday Cash 62.05% 69.09%Cut off time 9:00 AM-3:00 PM Placement With Banks and DFI 0.00% 0.00%Price Mechanism Forward Pricing Corporate Sukuk 5.07% 2.90%Risk Others 3.63% 4.11%
FUND SIZE MMSF DSF ESFAUM Million 78.6505 94.1677 208.84 Equity Sub Fund (ESF) Feb-17 Jan-17NAV(PKR) 133.5271 136.2699 453.7456 Equities 89.54% 91.37%WAM (Days) 1 299 Cash 9.82% 7.78%Leverage Others 0.63% 0.84%
INVESTMENT COMMITTEE SECTOR ALLOCATION EQUITY Feb-17 Jan-17Farid Ahmed Khan, CFA Chief Executive Officer Oil & Gas Exploration Companies 19.76% 20.01%Muhammad Imran Chief Investment Officer Cement 17.41% 17.90%Colin Miranda, CFA, FRM Acting Head of Research Power Generation & Distribution 11.01% 8.80%Tauqir Shamshad Head of Fixed Income Fertilizer 9.09% 11.20%Samia Aslam, CFA Fund Manager- Equity Automobile Assembler 7.83% 7.00%Adeel Abdul Wahab Fund Manager- Equity Others 24.44% 26.46%Noman Ameer Manager Risk
FUND RETURNS * MMSF DSF ESF TOP TEN EQUITES Feb-17Return Since Inception 6.44% 6.96% 353.75%Calendar Year to Date Return (Cumulative) 4.44% 3.71% 1.98%Year to Date Return (Cumulative) 4.79% 5.82% 31.15%1 Month Cumulative Return 2.52% 2.43% 0.14%3 Month Cumulative Return 4.29% 2.67% 13.85%6 Month Cumulative Return 4.64% 5.50% 21.30%1 Year Cumulative Return 4.79% 5.80% 49.21%3 Year Cumulative Return 4.62% 5.07% 108.29%5 Year Cumulative Return 6.17% 6.73% 303.76%Standard Deviation*** 1.69% 2.74% 14.79%
CREDITY QUALITY - HBL MONEY MARKET SUB FUND CREDIT QUALITY -HBL DEBT SUB FUND
PROVISION AGAINST WWF
**Calculated on 12Month trailing data
The scheme MMSF, DSF and ESF has maintained provisions against Sindh WWF liability to the tune of PKR 0.13mn, PKR 0.18mn and PKR 1.79mn. If thesame were not made, the NAV per unit would be higher by PKR 0.22/0.17%, PKR 0.27%/0.20% and PKR 3.89/ 0.86%. For details, investors are advised toread the Note 11 of the latest financial statements of the scheme.
Risk Disclaimer: This publication is for informational purposes only and nothing herein should be construed as a solicitation, recommendation or an offer to buy or sell any fund. All investments in mutualfunds are subject to market risks. Past performance is not necessarily indicative of future results. Please read the Offering Document to understand the investment policies and risks involved.
HBL PENSION FUND (MoM Returns)
*Returns have been calculated as per MUFAP's formula Mutual Fund Association of Pakistan (MUFAP) Recommended Format
Nil
Investor Dependent
FEBRUARY 2017
To provide a secure and Shariah compliant source of savings and regular income after retirement to the Participants
MONEY MARKET SUB FUND: The Fund generated a return of 2.52% p.a. during the month.
DEBT SUB FUND: The Fund’s Monthly generated a return of 2.43% p.a. Investment in GOP Ijarah Sukuk was increased to 29% of the Total Assets.
EQUITY SUB FUND: The fund posted a return of 0.14% vs benchmark KMI-30 Index return of -0.29% M/M during Feb’17 (2.47% M/M in Jan’17). Fund equityexposure at the end of month stood at 89.54% in terms of Total Assets of the fund.
INVESTMENT OBJECTIVE
FUND MANAGER'S COMMENTS
AAA16%
AA+17%
AA17%
A+33%
Others17%
Government Securities
29%
AAA5%
AA+22%
AA-1%
A+39%
Others4%
-5.0%
0.0%
5.0%
10.0%
15.0%
Mar
-16
Apr
-16
May
-16
Jun-
16
Jul-1
6
Aug
-16
Sep
-16
Oct
-16
Nov
-16
Dec
-16
Jan-
17
Feb
-17
HBL-IPF Money Market Sub Fund* HBL-IPF Debt Sub Fund* HBL-IPF Equity Sub Fund**
3.89%
3.99%
4.28%
5.10%
5.18%
5.18%
5.21%
6.25%
7.38%
8.24%
Pioneer Cement Limited
Nishat Mills Limited
Mari Petroleum Company Limited
Pakistan Petroleum Limited
Oil and Gas Development…
Packages Limited
Pakistan Oilfields Limited
Engro Corporation Limited
Lucky Cement Limited
Hub Power Company Limited
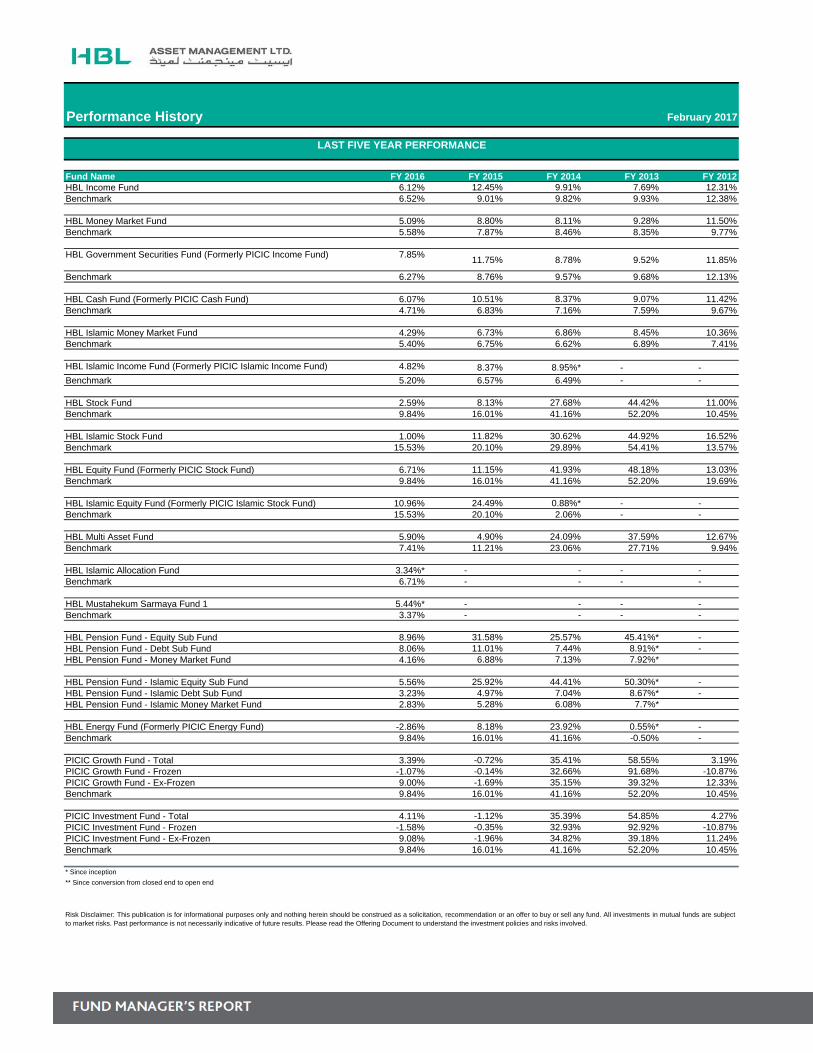
Fund Name FY 2016 FY 2015 FY 2014 FY 2013 FY 2012HBL Income Fund 6.12% 12.45% 9.91% 7.69% 12.31%Benchmark 6.52% 9.01% 9.82% 9.93% 12.38%
HBL Money Market Fund 5.09% 8.80% 8.11% 9.28% 11.50%Benchmark 5.58% 7.87% 8.46% 8.35% 9.77%
HBL Government Securities Fund (Formerly PICIC Income Fund) 7.85%11.75% 8.78% 9.52% 11.85%
Benchmark 6.27% 8.76% 9.57% 9.68% 12.13%
HBL Cash Fund (Formerly PICIC Cash Fund) 6.07% 10.51% 8.37% 9.07% 11.42%Benchmark 4.71% 6.83% 7.16% 7.59% 9.67%
HBL Islamic Money Market Fund 4.29% 6.73% 6.86% 8.45% 10.36%Benchmark 5.40% 6.75% 6.62% 6.89% 7.41%
HBL Islamic Income Fund (Formerly PICIC Islamic Income Fund) 4.82% 8.37% 8.95%* - -
Benchmark 5.20% 6.57% 6.49% - -
HBL Stock Fund 2.59% 8.13% 27.68% 44.42% 11.00%Benchmark 9.84% 16.01% 41.16% 52.20% 10.45%
HBL Islamic Stock Fund 1.00% 11.82% 30.62% 44.92% 16.52%Benchmark 15.53% 20.10% 29.89% 54.41% 13.57%
HBL Equity Fund (Formerly PICIC Stock Fund) 6.71% 11.15% 41.93% 48.18% 13.03%Benchmark 9.84% 16.01% 41.16% 52.20% 19.69%
HBL Islamic Equity Fund (Formerly PICIC Islamic Stock Fund) 10.96% 24.49% 0.88%* - -Benchmark 15.53% 20.10% 2.06% - -
HBL Multi Asset Fund 5.90% 4.90% 24.09% 37.59% 12.67%Benchmark 7.41% 11.21% 23.06% 27.71% 9.94%
HBL Islamic Allocation Fund 3.34%* - - - -Benchmark 6.71% - - - -
HBL Mustahekum Sarmaya Fund 1 5.44%* - - - -Benchmark 3.37% - - - -
HBL Pension Fund - Equity Sub Fund 8.96% 31.58% 25.57% 45.41%* -HBL Pension Fund - Debt Sub Fund 8.06% 11.01% 7.44% 8.91%* -HBL Pension Fund - Money Market Fund 4.16% 6.88% 7.13% 7.92%*
HBL Pension Fund - Islamic Equity Sub Fund 5.56% 25.92% 44.41% 50.30%* -HBL Pension Fund - Islamic Debt Sub Fund 3.23% 4.97% 7.04% 8.67%* -HBL Pension Fund - Islamic Money Market Fund 2.83% 5.28% 6.08% 7.7%*
HBL Energy Fund (Formerly PICIC Energy Fund) -2.86% 8.18% 23.92% 0.55%* -Benchmark 9.84% 16.01% 41.16% -0.50% -
PICIC Growth Fund - Total 3.39% -0.72% 35.41% 58.55% 3.19%PICIC Growth Fund - Frozen -1.07% -0.14% 32.66% 91.68% -10.87%PICIC Growth Fund - Ex-Frozen 9.00% -1.69% 35.15% 39.32% 12.33%Benchmark 9.84% 16.01% 41.16% 52.20% 10.45%
PICIC Investment Fund - Total 4.11% -1.12% 35.39% 54.85% 4.27%PICIC Investment Fund - Frozen -1.58% -0.35% 32.93% 92.92% -10.87%PICIC Investment Fund - Ex-Frozen 9.08% -1.96% 34.82% 39.18% 11.24%Benchmark 9.84% 16.01% 41.16% 52.20% 10.45%
* Since inception
** Since conversion from closed end to open end
Performance History February 2017
LAST FIVE YEAR PERFORMANCE
Risk Disclaimer: This publication is for informational purposes only and nothing herein should be construed as a solicitation, recommendation or an offer to buy or sell any fund. All investments in mutual funds are subjectto market risks. Past performance is not necessarily indicative of future results. Please read the Offering Document to understand the investment policies and risks involved.