fund facts 2q2021
TRANSCRIPT

Fund Facts2Q2021
Market review and outlook
WealthStyles Income Series articles
Fund fact sheets
Income distribution
2
Content
Fund fact sheets (as at 30 June 2021)
Conventional funds
Equity
Click on a title or fund name to view respective pages
Islamic funds
Equity
Manulife Private Retirement Scheme Series
Manulife PRS NESTEGG Series: Core funds
Fixed income
Fixed income
Manulife Shariah PRS NESTEGG Series: Core funds
Manulife PRS NESTEGG Series: Non-core fund
Manulife Shariah PRS NESTEGG Series: Non-core fund
Money market
Money market
3
Market review and outlook
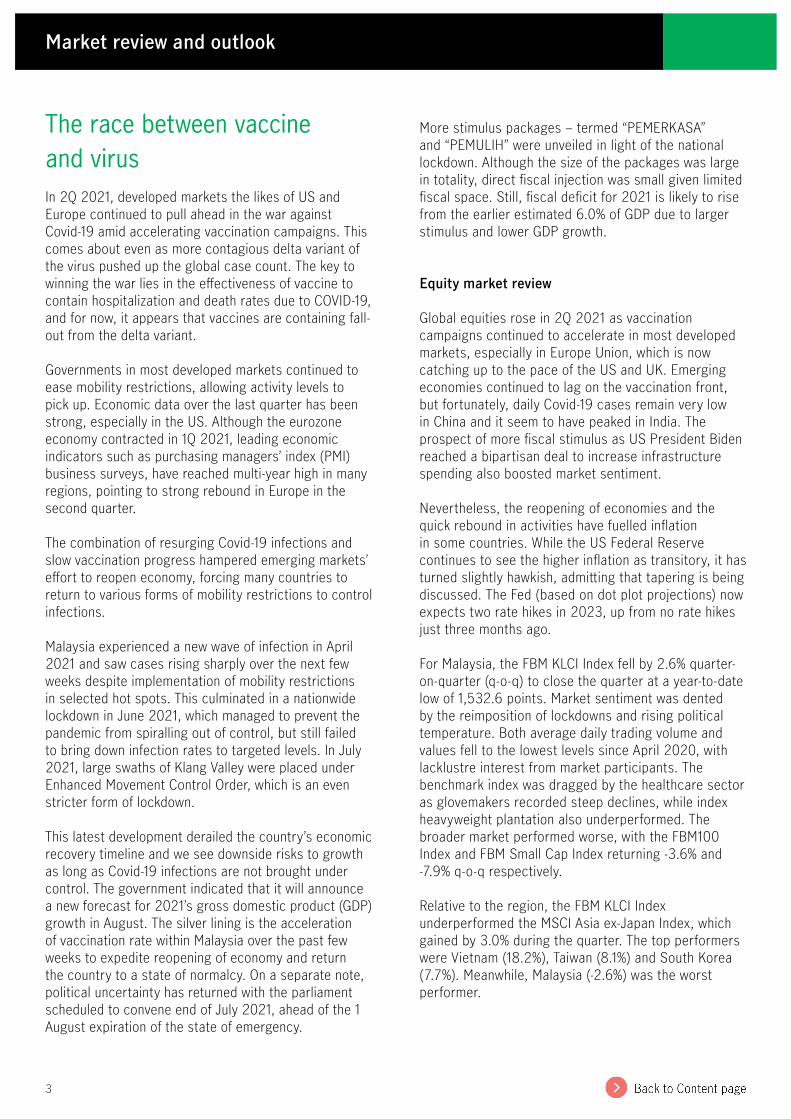
The race between vaccine and virusIn 2Q 2021, developed markets the likes of US and Europe continued to pull ahead in the war against Covid-19 amid accelerating vaccination campaigns. This comes about even as more contagious delta variant of the virus pushed up the global case count. The key to winning the war lies in the effectiveness of vaccine to contain hospitalization and death rates due to COVID-19, and for now, it appears that vaccines are containing fall-out from the delta variant.
Governments in most developed markets continued to ease mobility restrictions, allowing activity levels to pick up. Economic data over the last quarter has been strong, especially in the US. Although the eurozone economy contracted in 1Q 2021, leading economic indicators such as purchasing managers’ index (PMI) business surveys, have reached multi-year high in many regions, pointing to strong rebound in Europe in the second quarter.
The combination of resurging Covid-19 infections and slow vaccination progress hampered emerging markets’ effort to reopen economy, forcing many countries to return to various forms of mobility restrictions to control infections.
Malaysia experienced a new wave of infection in April 2021 and saw cases rising sharply over the next few weeks despite implementation of mobility restrictions in selected hot spots. This culminated in a nationwide lockdown in June 2021, which managed to prevent the pandemic from spiralling out of control, but still failed to bring down infection rates to targeted levels. In July 2021, large swaths of Klang Valley were placed under Enhanced Movement Control Order, which is an even stricter form of lockdown.
This latest development derailed the country’s economic recovery timeline and we see downside risks to growth as long as Covid-19 infections are not brought under control. The government indicated that it will announce a new forecast for 2021’s gross domestic product (GDP) growth in August. The silver lining is the acceleration of vaccination rate within Malaysia over the past few weeks to expedite reopening of economy and return the country to a state of normalcy. On a separate note, political uncertainty has returned with the parliament scheduled to convene end of July 2021, ahead of the 1 August expiration of the state of emergency.
More stimulus packages – termed “PEMERKASA” and “PEMULIH” were unveiled in light of the national lockdown. Although the size of the packages was large in totality, direct fiscal injection was small given limited fiscal space. Still, fiscal deficit for 2021 is likely to rise from the earlier estimated 6.0% of GDP due to larger stimulus and lower GDP growth.
Equity market review
Global equities rose in 2Q 2021 as vaccination campaigns continued to accelerate in most developed markets, especially in Europe Union, which is now catching up to the pace of the US and UK. Emerging economies continued to lag on the vaccination front, but fortunately, daily Covid-19 cases remain very low in China and it seem to have peaked in India. The prospect of more fiscal stimulus as US President Biden reached a bipartisan deal to increase infrastructure spending also boosted market sentiment.
Nevertheless, the reopening of economies and the quick rebound in activities have fuelled inflation in some countries. While the US Federal Reserve continues to see the higher inflation as transitory, it has turned slightly hawkish, admitting that tapering is being discussed. The Fed (based on dot plot projections) now expects two rate hikes in 2023, up from no rate hikes just three months ago.
For Malaysia, the FBM KLCI Index fell by 2.6% quarter-on-quarter (q-o-q) to close the quarter at a year-to-date low of 1,532.6 points. Market sentiment was dented by the reimposition of lockdowns and rising political temperature. Both average daily trading volume and values fell to the lowest levels since April 2020, with lacklustre interest from market participants. The benchmark index was dragged by the healthcare sector as glovemakers recorded steep declines, while index heavyweight plantation also underperformed. The broader market performed worse, with the FBM100 Index and FBM Small Cap Index returning -3.6% and -7.9% q-o-q respectively.
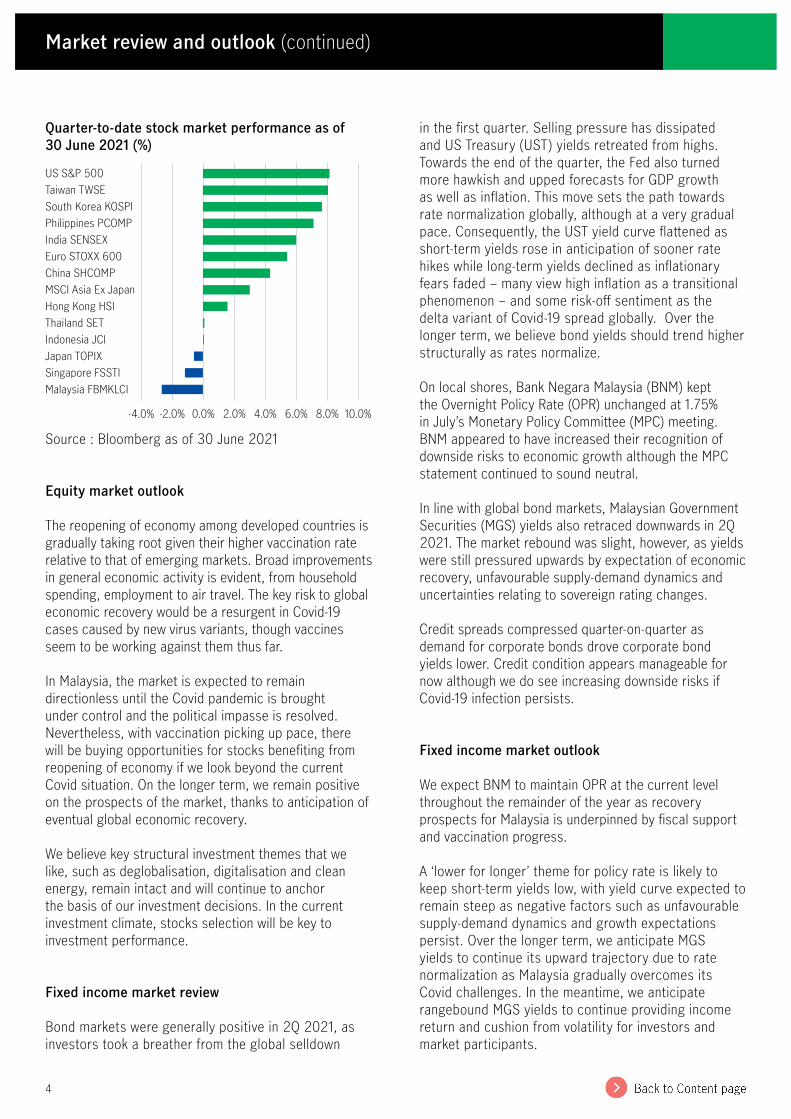
Relative to the region, the FBM KLCI Index underperformed the MSCI Asia ex-Japan Index, which gained by 3.0% during the quarter. The top performers were Vietnam (18.2%), Taiwan (8.1%) and South Korea (7.7%). Meanwhile, Malaysia (-2.6%) was the worst performer.
4
Quarter-to-date stock market performance as of 30 June 2021 (%)
US S&P 500Taiwan TWSESouth Korea KOSPIPhilippines PCOMPIndia SENSEXEuro STOXX 600China SHCOMPMSCI Asia Ex JapanHong Kong HSIThailand SETIndonesia JCIJapan TOPIXSingapore FSSTIMalaysia FBMKLCI
Source : Bloomberg as of 30 June 2021
Equity market outlook
The reopening of economy among developed countries is gradually taking root given their higher vaccination rate relative to that of emerging markets. Broad improvements in general economic activity is evident, from household spending, employment to air travel. The key risk to global economic recovery would be a resurgent in Covid-19 cases caused by new virus variants, though vaccines seem to be working against them thus far.
In Malaysia, the market is expected to remain directionless until the Covid pandemic is brought under control and the political impasse is resolved. Nevertheless, with vaccination picking up pace, there will be buying opportunities for stocks benefiting from reopening of economy if we look beyond the current Covid situation. On the longer term, we remain positive on the prospects of the market, thanks to anticipation of eventual global economic recovery.
We believe key structural investment themes that we like, such as deglobalisation, digitalisation and clean energy, remain intact and will continue to anchor the basis of our investment decisions. In the current investment climate, stocks selection will be key to investment performance.
Fixed income market review
Bond markets were generally positive in 2Q 2021, as investors took a breather from the global selldown
in the first quarter. Selling pressure has dissipated and US Treasury (UST) yields retreated from highs. Towards the end of the quarter, the Fed also turned more hawkish and upped forecasts for GDP growth as well as inflation. This move sets the path towards rate normalization globally, although at a very gradual pace. Consequently, the UST yield curve flattened as short-term yields rose in anticipation of sooner rate hikes while long-term yields declined as inflationary fears faded – many view high inflation as a transitional phenomenon – and some risk-off sentiment as the delta variant of Covid-19 spread globally. Over the longer term, we believe bond yields should trend higher structurally as rates normalize.
On local shores, Bank Negara Malaysia (BNM) kept the Overnight Policy Rate (OPR) unchanged at 1.75% in July’s Monetary Policy Committee (MPC) meeting. BNM appeared to have increased their recognition of downside risks to economic growth although the MPC statement continued to sound neutral.
In line with global bond markets, Malaysian Government Securities (MGS) yields also retraced downwards in 2Q 2021. The market rebound was slight, however, as yields were still pressured upwards by expectation of economic recovery, unfavourable supply-demand dynamics and uncertainties relating to sovereign rating changes.
Credit spreads compressed quarter-on-quarter as demand for corporate bonds drove corporate bond yields lower. Credit condition appears manageable for now although we do see increasing downside risks if Covid-19 infection persists.
Fixed income market outlook
We expect BNM to maintain OPR at the current level throughout the remainder of the year as recovery prospects for Malaysia is underpinned by fiscal support and vaccination progress.
A ‘lower for longer’ theme for policy rate is likely to keep short-term yields low, with yield curve expected to remain steep as negative factors such as unfavourable supply-demand dynamics and growth expectations persist. Over the longer term, we anticipate MGS yields to continue its upward trajectory due to rate normalization as Malaysia gradually overcomes its Covid challenges. In the meantime, we anticipate rangebound MGS yields to continue providing income return and cushion from volatility for investors and market participants.
Market review and outlook (continued)
8.0% 10.0%6.0%4.0%2.0%0.0%-2.0%-4.0%
5
The sudden emergence of COVID-19 has left a major dent in the global economy. To comply with regulatory requirements, some international banks cut or even suspended their dividend payouts last year without warning1. As a result, many investors who rely on dividends have been left in the lurch. How important is income to investors?
Bruno Lee, Regional Head of Retail Wealth Distribution, Wealth & Asset Management, Asia at Manulife Investment Management points out that global central banks have been implementing quantitative easing measures for years. This attempt to stimulate the economy by substantially increasing money supply has prolonged the low-rate environment, which, in turn, makes it harder for investors to generate income (It can take the form of cash dividend, interest, or coupon payments, while it doesn’t come from buying or selling assets).
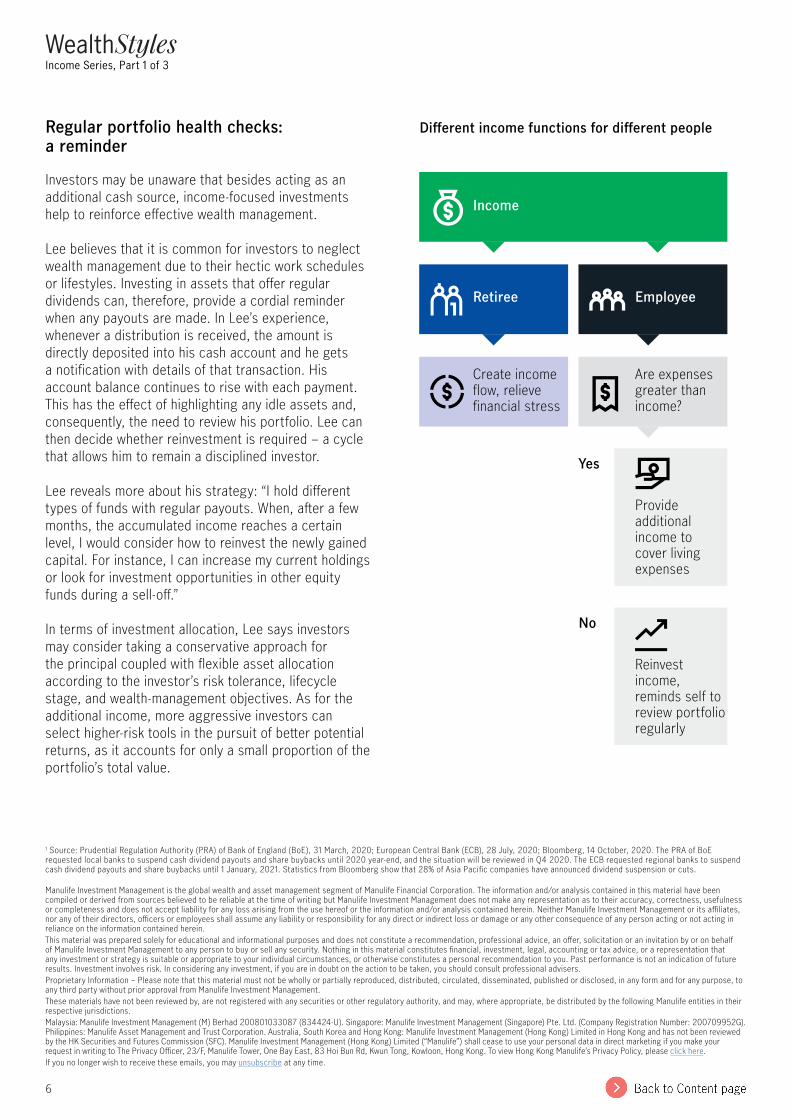
Income serves as an additional source of cash that allows investors to manage their daily expenses, for example. Something that is especially important for retirees, as they generally have to rely on their savings in the absence of a salary from paid employment. A steady investment income can also help to create an “alternative salary” by reversing the net cash outflow situation, which, in turn, alleviates the financial burden.
Younger people and those with established careers already have a regular salary, so they are probably more focused on capital gains. That’s why an investment tool that offers income payouts is not necessarily their first choice.
In fact, the purchase of income-paying assets actually serves two functions: firstly, income can be reinvested to achieve greater potential returns (potential income plus capital gains). Secondly, it serves as a reminder to review one’s portfolio regularly.
Income investing: The secret to financial health
Key takeaways
• Income investments can generate cash flow that may help to ease any financial burdens – this is important for retirees
• Those still working can achieve potentially greater returns by reinvesting their income payments – a reminder to perform regular portfolio reviews
WealthStylesIncome Series, Part 1 of 3
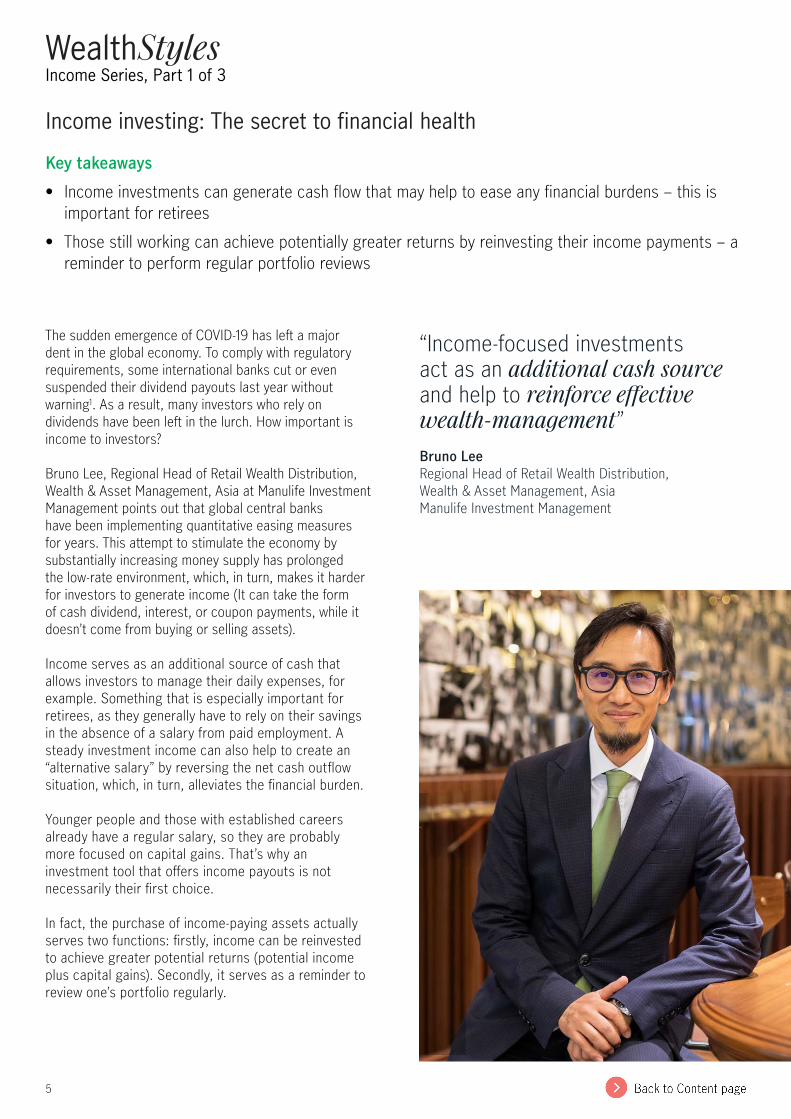
“Income-focused investments act as an additional cash source and help to reinforce effective wealth-management”Bruno LeeRegional Head of Retail Wealth Distribution, Wealth & Asset Management, AsiaManulife Investment Management
6
Regular portfolio health checks:a reminder
Investors may be unaware that besides acting as an additional cash source, income-focused investments help to reinforce effective wealth management.
Lee believes that it is common for investors to neglect wealth management due to their hectic work schedules or lifestyles. Investing in assets that offer regular dividends can, therefore, provide a cordial reminder when any payouts are made. In Lee’s experience, whenever a distribution is received, the amount is directly deposited into his cash account and he gets a notification with details of that transaction. His account balance continues to rise with each payment. This has the effect of highlighting any idle assets and, consequently, the need to review his portfolio. Lee can then decide whether reinvestment is required – a cycle that allows him to remain a disciplined investor.
Lee reveals more about his strategy: “I hold different types of funds with regular payouts. When, after a few months, the accumulated income reaches a certain level, I would consider how to reinvest the newly gained capital. For instance, I can increase my current holdings or look for investment opportunities in other equity funds during a sell-off.”
In terms of investment allocation, Lee says investors may consider taking a conservative approach for the principal coupled with flexible asset allocation according to the investor’s risk tolerance, lifecycle stage, and wealth-management objectives. As for the additional income, more aggressive investors can select higher-risk tools in the pursuit of better potential returns, as it accounts for only a small proportion of the portfolio’s total value.
Different income functions for different people
Income
Retiree Employee
Create income flow, relieve financial stress
Are expenses greater than income?
Provide additional income to cover living expenses
Reinvest income, reminds self to review portfolio regularly
Yes
No
WealthStylesIncome Series, Part 1 of 3
1 Source: Prudential Regulation Authority (PRA) of Bank of England (BoE), 31 March, 2020; European Central Bank (ECB), 28 July, 2020; Bloomberg, 14 October, 2020. The PRA of BoE requested local banks to suspend cash dividend payouts and share buybacks until 2020 year-end, and the situation will be reviewed in Q4 2020. The ECB requested regional banks to suspend cash dividend payouts and share buybacks until 1 January, 2021. Statistics from Bloomberg show that 28% of Asia Pacific companies have announced dividend suspension or cuts.
Manulife Investment Management is the global wealth and asset management segment of Manulife Financial Corporation. The information and/or analysis contained in this material have been compiled or derived from sources believed to be reliable at the time of writing but Manulife Investment Management does not make any representation as to their accuracy, correctness, usefulness or completeness and does not accept liability for any loss arising from the use hereof or the information and/or analysis contained herein. Neither Manulife Investment Management or its affiliates, nor any of their directors, officers or employees shall assume any liability or responsibility for any direct or indirect loss or damage or any other consequence of any person acting or not acting in reliance on the information contained herein.This material was prepared solely for educational and informational purposes and does not constitute a recommendation, professional advice, an offer, solicitation or an invitation by or on behalf of Manulife Investment Management to any person to buy or sell any security. Nothing in this material constitutes financial, investment, legal, accounting or tax advice, or a representation that any investment or strategy is suitable or appropriate to your individual circumstances, or otherwise constitutes a personal recommendation to you. Past performance is not an indication of future results. Investment involves risk. In considering any investment, if you are in doubt on the action to be taken, you should consult professional advisers.Proprietary Information – Please note that this material must not be wholly or partially reproduced, distributed, circulated, disseminated, published or disclosed, in any form and for any purpose, to any third party without prior approval from Manulife Investment Management.These materials have not been reviewed by, are not registered with any securities or other regulatory authority, and may, where appropriate, be distributed by the following Manulife entities in their respective jurisdictions.Malaysia: Manulife Investment Management (M) Berhad 200801033087 (834424-U). Singapore: Manulife Investment Management (Singapore) Pte. Ltd. (Company Registration Number: 200709952G). Philippines: Manulife Asset Management and Trust Corporation. Australia, South Korea and Hong Kong: Manulife Investment Management (Hong Kong) Limited in Hong Kong and has not been reviewed by the HK Securities and Futures Commission (SFC). Manulife Investment Management (Hong Kong) Limited (“Manulife”) shall cease to use your personal data in direct marketing if you make your request in writing to The Privacy Officer, 23/F, Manulife Tower, One Bay East, 83 Hoi Bun Rd, Kwun Tong, Kowloon, Hong Kong. To view Hong Kong Manulife’s Privacy Policy, please click here.If you no longer wish to receive these emails, you may unsubscribe at any time.
7
There are many income sources to consider, each with different characteristics such as income volatility and risk levels. By gaining an in-depth knowledge of these, investors should be able to find suitable options to broaden their investment income.
Traditional income sources
Income funds: These are mutual funds with payout characteristics that typically distribute dividends at regular intervals. Generally, the dividend yield is not guaranteed, but as is the case with any diversified portfolio, the likelihood of every holding simultaneously failing to distribute is small. Therefore, the chance for investors receiving no income is relatively low.
Non-traditional income sources
Real Estate Investment Trusts (REITs): REITs are legally obliged to distribute the majority of net income after tax as dividends. They cannot suspend payouts due to economic or business factors. As long as a REIT records positive net income, unit holders are entitled to dividend payouts.
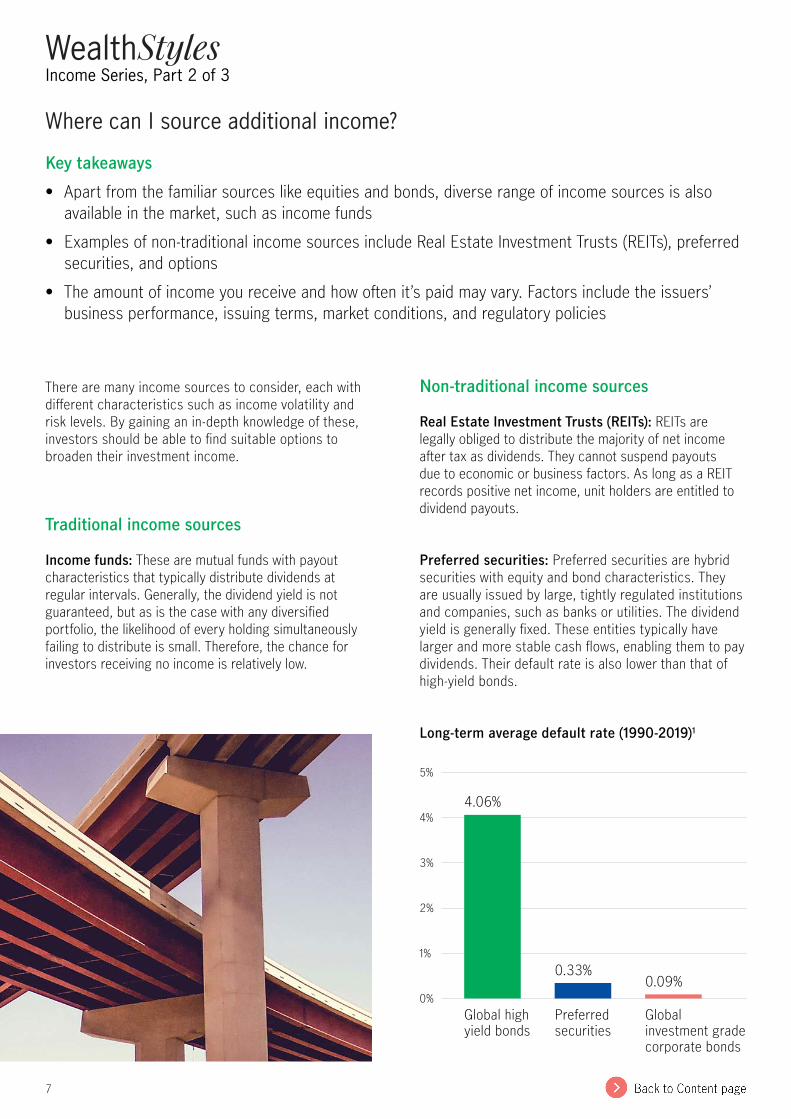
Preferred securities: Preferred securities are hybrid securities with equity and bond characteristics. They are usually issued by large, tightly regulated institutions and companies, such as banks or utilities. The dividend yield is generally fixed. These entities typically have larger and more stable cash flows, enabling them to pay dividends. Their default rate is also lower than that of high-yield bonds.
Long-term average default rate (1990-2019)1
5%
4%
3%
2%
1%
0%Global high yield bonds
Preferred securities
Global investment grade corporate bonds
4.06%
0.33%0.09%
Where can I source additional income?
Key takeaways
• Apart from the familiar sources like equities and bonds, diverse range of income sources is also available in the market, such as income funds
• Examples of non-traditional income sources include Real Estate Investment Trusts (REITs), preferred securities, and options
• The amount of income you receive and how often it’s paid may vary. Factors include the issuers’ business performance, issuing terms, market conditions, and regulatory policies
WealthStylesIncome Series, Part 2 of 3
8
Options: By selling a call option or put option, investors can receive a premium (income) in advance without waiting until the option expiry date. However, it should be noted that obtaining a premium does not necessarily mean that the overall investment return is positive.
If the trend of the underlying asset deviates from expectations, i.e., the price of an asset actually rises after selling a call option, or vice versa, overall returns may be negative, as the premium may not be adequate to offset the loss on exercising an option completely.
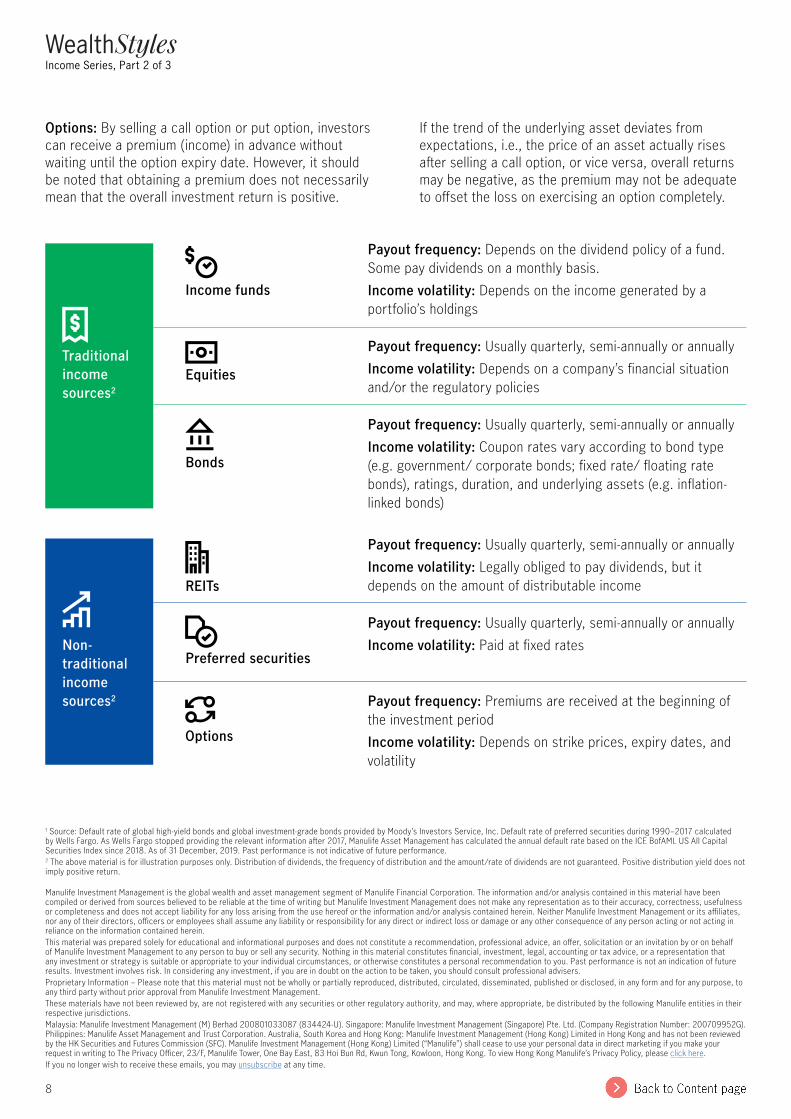
Payout frequency: Depends on the dividend policy of a fund. Some pay dividends on a monthly basis.Income volatility: Depends on the income generated by a portfolio’s holdings
Payout frequency: Usually quarterly, semi-annually or annually Income volatility: Depends on a company’s financial situation and/or the regulatory policies
Payout frequency: Usually quarterly, semi-annually or annually Income volatility: Coupon rates vary according to bond type (e.g. government/ corporate bonds; fixed rate/ floating rate bonds), ratings, duration, and underlying assets (e.g. inflation-linked bonds)
Payout frequency: Usually quarterly, semi-annually or annually Income volatility: Legally obliged to pay dividends, but it depends on the amount of distributable income
Payout frequency: Usually quarterly, semi-annually or annually Income volatility: Paid at fixed rates
Payout frequency: Premiums are received at the beginning of the investment period Income volatility: Depends on strike prices, expiry dates, and volatility
REITs
Preferred securities
Income funds
Options
Equities
Bonds
Non-traditional income sources2
Traditional income sources2
WealthStylesIncome Series, Part 2 of 3
1 Source: Default rate of global high-yield bonds and global investment-grade bonds provided by Moody’s Investors Service, Inc. Default rate of preferred securities during 1990–2017 calculated by Wells Fargo. As Wells Fargo stopped providing the relevant information after 2017, Manulife Asset Management has calculated the annual default rate based on the ICE BofAML US All Capital Securities Index since 2018. As of 31 December, 2019. Past performance is not indicative of future performance. 2 The above material is for illustration purposes only. Distribution of dividends, the frequency of distribution and the amount/rate of dividends are not guaranteed. Positive distribution yield does not imply positive return.
Manulife Investment Management is the global wealth and asset management segment of Manulife Financial Corporation. The information and/or analysis contained in this material have been compiled or derived from sources believed to be reliable at the time of writing but Manulife Investment Management does not make any representation as to their accuracy, correctness, usefulness or completeness and does not accept liability for any loss arising from the use hereof or the information and/or analysis contained herein. Neither Manulife Investment Management or its affiliates, nor any of their directors, officers or employees shall assume any liability or responsibility for any direct or indirect loss or damage or any other consequence of any person acting or not acting in reliance on the information contained herein.This material was prepared solely for educational and informational purposes and does not constitute a recommendation, professional advice, an offer, solicitation or an invitation by or on behalf of Manulife Investment Management to any person to buy or sell any security. Nothing in this material constitutes financial, investment, legal, accounting or tax advice, or a representation that any investment or strategy is suitable or appropriate to your individual circumstances, or otherwise constitutes a personal recommendation to you. Past performance is not an indication of future results. Investment involves risk. In considering any investment, if you are in doubt on the action to be taken, you should consult professional advisers.Proprietary Information – Please note that this material must not be wholly or partially reproduced, distributed, circulated, disseminated, published or disclosed, in any form and for any purpose, to any third party without prior approval from Manulife Investment Management.These materials have not been reviewed by, are not registered with any securities or other regulatory authority, and may, where appropriate, be distributed by the following Manulife entities in their respective jurisdictions.Malaysia: Manulife Investment Management (M) Berhad 200801033087 (834424-U). Singapore: Manulife Investment Management (Singapore) Pte. Ltd. (Company Registration Number: 200709952G). Philippines: Manulife Asset Management and Trust Corporation. Australia, South Korea and Hong Kong: Manulife Investment Management (Hong Kong) Limited in Hong Kong and has not been reviewed by the HK Securities and Futures Commission (SFC). Manulife Investment Management (Hong Kong) Limited (“Manulife”) shall cease to use your personal data in direct marketing if you make your request in writing to The Privacy Officer, 23/F, Manulife Tower, One Bay East, 83 Hoi Bun Rd, Kwun Tong, Kowloon, Hong Kong. To view Hong Kong Manulife’s Privacy Policy, please click here.If you no longer wish to receive these emails, you may unsubscribe at any time.
9
Choosing the right sources of income from the wide variety of options available in the market may seem daunting to many investors. To construct an optimal investment portfolio with income exposure, Bruno Lee, Regional Head of Retail Wealth Distribution, Wealth & Asset Management, Asia at Manulife Investment Management believes that investors should first understand the risks associated with each income source then consider their own risk tolerance level and wealth-management objectives.
Diverse sources of income, differenttypes of risks
Understanding the different types of income sourcesin the market is only the first step towards generating additional cash. Therefore, to identify the suitable investment tools, it is important to consider each source of risk, one by one.
Bonds: credit risk
The most significant risk associated with corporate bonds is credit risk. This occurs when issuers cannot fulfil the terms of a bond and fail to pay coupons or return the principal on time – commonly known as a bond default. To establish the level of credit risk, investors should understand various factors, such as how the issuer performs under different economic conditions and the size of its business. It’s also helpful to know about the issuer’s profitability and financial health. The extent of these risk factors is reflected by indicators, such as credit ratings and yields, and could serve as useful reference points when investing in single bonds.
The risks related to bond funds, which invest in a basket of bonds, can be determined by assessing each bond’s investment objectives, average credit ratings, and risk indicators. Lee uses investment-grade bond funds as an example, pointing out that while these are considered less risky than high-yield bond funds, they come with a lower yield. Meanwhile, the risk (yield) of emerging-market (i.e., Asian emerging markets) bond funds is higher than bond funds from developed markets, such as Europe and the US.
Preferred securities: a combination of equity and bond risk
Some companies also issue preferred securities, which feature characteristics of both equities and bonds. Therefore, investing in preferred securities bears the risks of these two asset classes simultaneously, which could include the credit and interest-rate risk of bond investments, as well as the volatility risk of equities.
REITs: property-market risk
Real Estate Investment Trusts (REITs), which have risen to prominence in recent years, invest primarily in real estate that generates a recurring rental income. While real estate assets are generally inflation resistant, and REITs are required by law to distribute the majority of their income as dividends, investors have to bear the risks associated with property markets. These can include changes in property prices (asset-price volatility), interest rate trends, and profitability, which are all affected by geographical location, asset type, occupancy rate, and fluctuations in rental income.
Understand income-source risks before asset allocation
Key takeaways
• To master the art of asset allocation, you should understand the risks associated with each income source. Consider your attitude towards risk then establish wealth-management objectives, as this will help you to identify the most suitable asset-allocation tools
• When constructing an investment portfolio, it’s vital to diversify your investments rather than focus on a single equity, bond, or fund
WealthStylesIncome Series, Part 3 of 3
10
Multi-asset funds: risk depends on asset-class coverage
In the case of multi-asset funds, risk is determined by the various asset classes in a portfolio. Lee points out that besides investing in stocks, bonds, REITs, and preferred securities, some funds also generate income by including options. Holding these funds, therefore, means that investors have to bear the credit risk of options issuers.
Dividend yield is not the sole indicator
When selecting investment tools to help meet their personal wealth management needs, investors would generally consider factors other than risk, such as dividend levels and past performance. However, Lee notes that while some funds offer an attractive dividend income, this should not be used as the sole indicator of that fund’s selection.
Instead, attention should be paid to total returns, where dividend return is combined with a change in fund prices to provide a more comprehensive picture. “The investment return of some portfolios may not support the payment of high dividends,” observes Lee.
Diversification increases the chancesof earning income
Apart from understanding the sources of risk and total return, investors also need to evaluate their own risk profiles and choose investment tools that match their risk tolerance level. When investors plan to construct a portfolio by themselves, Lee highlights that it’s vital to remember diversification: “It’s important to diversify investments and not focus on a single equity, bond, or fund. An income-focused investment portfolio should consist of at least three-to-five different types of funds or investments.”
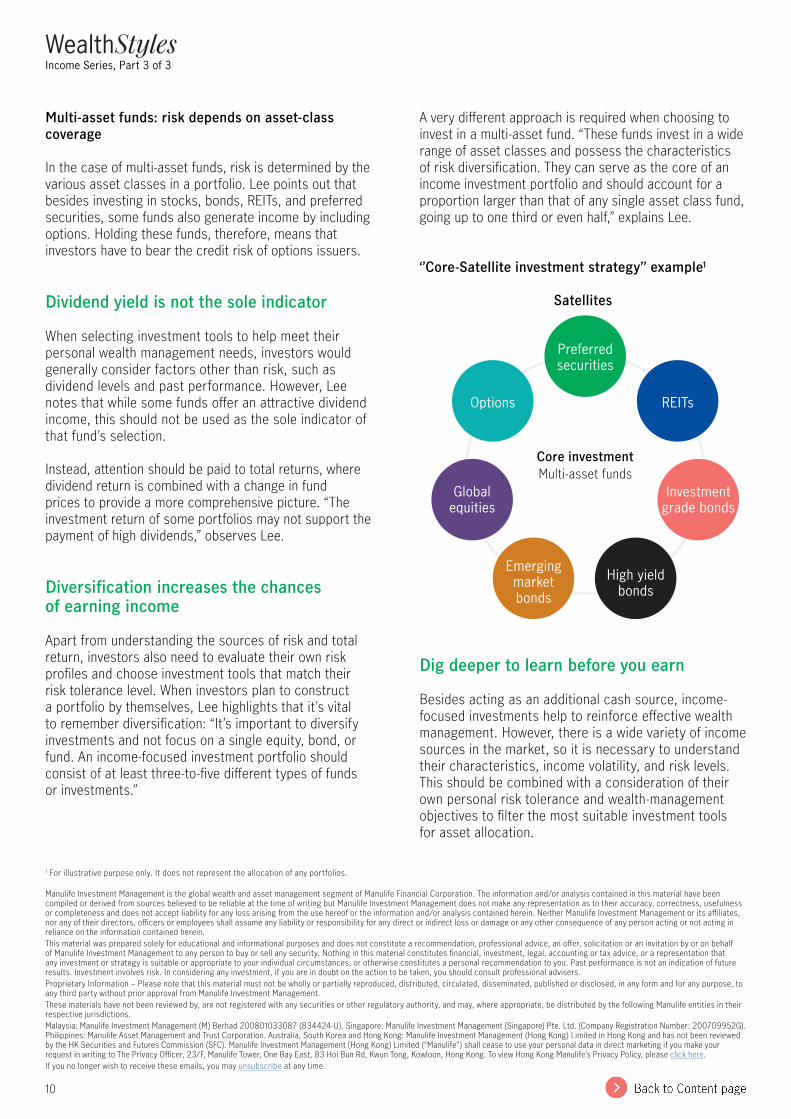
A very different approach is required when choosing to invest in a multi-asset fund. “These funds invest in a wide range of asset classes and possess the characteristics of risk diversification. They can serve as the core of an income investment portfolio and should account for a proportion larger than that of any single asset class fund, going up to one third or even half,” explains Lee.
‘’Core-Satellite investment strategy’’ example1
Satellites
Dig deeper to learn before you earn
Besides acting as an additional cash source, income-focused investments help to reinforce effective wealth management. However, there is a wide variety of income sources in the market, so it is necessary to understand their characteristics, income volatility, and risk levels. This should be combined with a consideration of their own personal risk tolerance and wealth-management objectives to filter the most suitable investment tools for asset allocation.
Core investmentMulti-asset funds
Preferred securities
REITs
Options
Global equities
Investment grade bonds
Emerging market bonds
High yield bonds
WealthStylesIncome Series, Part 3 of 3
1 For illustrative purpose only. It does not represent the allocation of any portfolios.
Manulife Investment Management is the global wealth and asset management segment of Manulife Financial Corporation. The information and/or analysis contained in this material have been compiled or derived from sources believed to be reliable at the time of writing but Manulife Investment Management does not make any representation as to their accuracy, correctness, usefulness or completeness and does not accept liability for any loss arising from the use hereof or the information and/or analysis contained herein. Neither Manulife Investment Management or its affiliates, nor any of their directors, officers or employees shall assume any liability or responsibility for any direct or indirect loss or damage or any other consequence of any person acting or not acting in reliance on the information contained herein.This material was prepared solely for educational and informational purposes and does not constitute a recommendation, professional advice, an offer, solicitation or an invitation by or on behalf of Manulife Investment Management to any person to buy or sell any security. Nothing in this material constitutes financial, investment, legal, accounting or tax advice, or a representation that any investment or strategy is suitable or appropriate to your individual circumstances, or otherwise constitutes a personal recommendation to you. Past performance is not an indication of future results. Investment involves risk. In considering any investment, if you are in doubt on the action to be taken, you should consult professional advisers.Proprietary Information – Please note that this material must not be wholly or partially reproduced, distributed, circulated, disseminated, published or disclosed, in any form and for any purpose, to any third party without prior approval from Manulife Investment Management.These materials have not been reviewed by, are not registered with any securities or other regulatory authority, and may, where appropriate, be distributed by the following Manulife entities in their respective jurisdictions.Malaysia: Manulife Investment Management (M) Berhad 200801033087 (834424-U). Singapore: Manulife Investment Management (Singapore) Pte. Ltd. (Company Registration Number: 200709952G). Philippines: Manulife Asset Management and Trust Corporation. Australia, South Korea and Hong Kong: Manulife Investment Management (Hong Kong) Limited in Hong Kong and has not been reviewed by the HK Securities and Futures Commission (SFC). Manulife Investment Management (Hong Kong) Limited (“Manulife”) shall cease to use your personal data in direct marketing if you make your request in writing to The Privacy Officer, 23/F, Manulife Tower, One Bay East, 83 Hoi Bun Rd, Kwun Tong, Kowloon, Hong Kong. To view Hong Kong Manulife’s Privacy Policy, please click here.If you no longer wish to receive these emails, you may unsubscribe at any time.
11
July 2021 Factsheet Manulife ASEAN Equity Fund
# JPMORGAN FUNDS - ASEAN EQUITY FUND
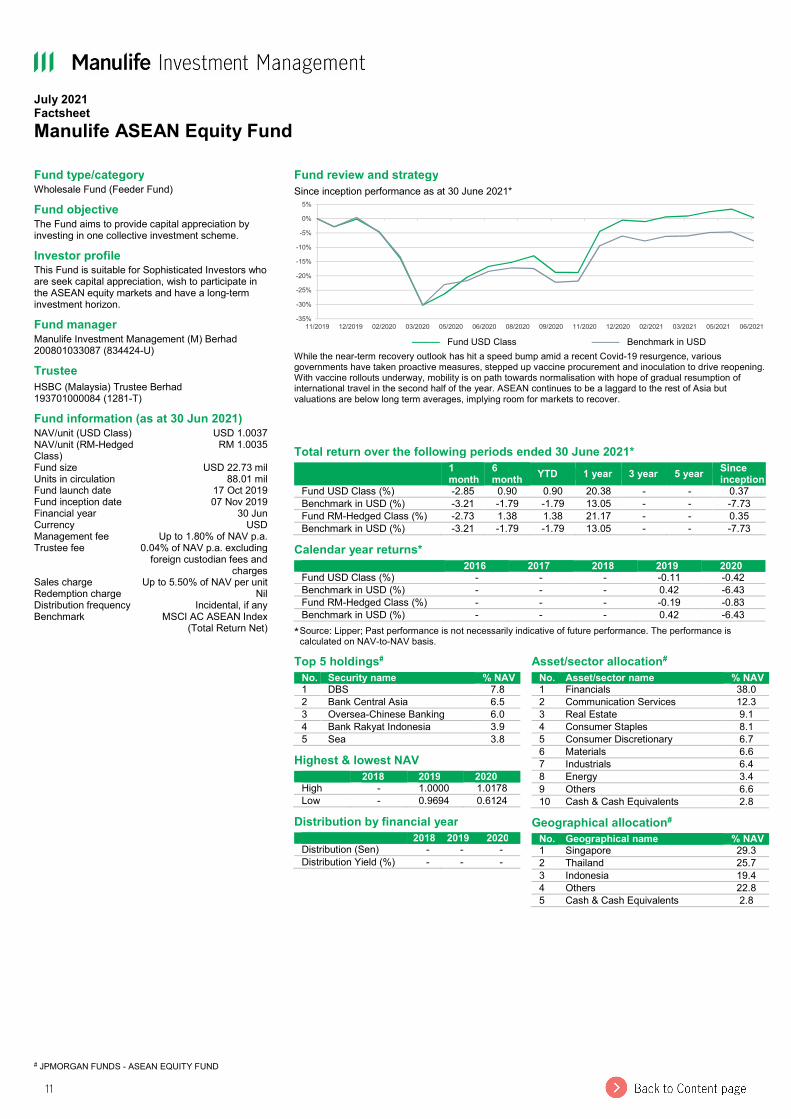
Fund type/category Wholesale Fund (Feeder Fund) Fund objective The Fund aims to provide capital appreciation by investing in one collective investment scheme. Investor profile This Fund is suitable for Sophisticated Investors who are seek capital appreciation, wish to participate in the ASEAN equity markets and have a long-term investment horizon. Fund manager Manulife Investment Management (M) Berhad 200801033087 (834424-U) Trustee HSBC (Malaysia) Trustee Berhad 193701000084 (1281-T) Fund information (as at 30 Jun 2021) NAV/unit (USD Class) USD 1.0037 NAV/unit (RM-Hedged Class)
RM 1.0035 Fund size USD 22.73 mil Units in circulation 88.01 mil Fund launch date 17 Oct 2019 Fund inception date 07 Nov 2019 Financial year 30 Jun Currency USD Management fee Up to 1.80% of NAV p.a. Trustee fee 0.04% of NAV p.a. excluding
foreign custodian fees and charges
Sales charge Up to 5.50% of NAV per unit Redemption charge Nil Distribution frequency Incidental, if any Benchmark MSCI AC ASEAN Index
(Total Return Net)
Fund review and strategy Since inception performance as at 30 June 2021*
——— Fund USD Class ——— Benchmark in USD
While the near-term recovery outlook has hit a speed bump amid a recent Covid-19 resurgence, various governments have taken proactive measures, stepped up vaccine procurement and inoculation to drive reopening. With vaccine rollouts underway, mobility is on path towards normalisation with hope of gradual resumption of international travel in the second half of the year. ASEAN continues to be a laggard to the rest of Asia but valuations are below long term averages, implying room for markets to recover.
Total return over the following periods ended 30 June 2021*
1 month
6 month YTD 1 year 3 year 5 year Since
inception Fund USD Class (%) -2.85 0.90 0.90 20.38 - - 0.37 Benchmark in USD (%) -3.21 -1.79 -1.79 13.05 - - -7.73 Fund RM-Hedged Class (%) -2.73 1.38 1.38 21.17 - - 0.35 Benchmark in USD (%) -3.21 -1.79 -1.79 13.05 - - -7.73
Calendar year returns* 2016 2017 2018 2019 2020
Fund USD Class (%) - - - -0.11 -0.42 Benchmark in USD (%) - - - 0.42 -6.43 Fund RM-Hedged Class (%) - - - -0.19 -0.83 Benchmark in USD (%) - - - 0.42 -6.43
* Source: Lipper; Past performance is not necessarily indicative of future performance. The performance is calculated on NAV-to-NAV basis.
-35%
-30%
-25%
-20%
-15%
-10%
-5%
0%
5%
11/2019 12/2019 02/2020 03/2020 05/2020 06/2020 08/2020 09/2020 11/2020 12/2020 02/2021 03/2021 05/2021 06/2021
Top 5 holdings# No. Security name % NAV
1 DBS 7.8 2 Bank Central Asia 6.5 3 Oversea-Chinese Banking 6.0 4 Bank Rakyat Indonesia 3.9 5 Sea 3.8
Highest & lowest NAV 2018 2019 2020
High - 1.0000 1.0178 Low - 0.9694 0.6124
Distribution by financial year 2018 2019 2020
Distribution (Sen) - - - Distribution Yield (%) - - -
Asset/sector allocation# No. Asset/sector name % NAV
1 Financials 38.0 2 Communication Services 12.3 3 Real Estate 9.1 4 Consumer Staples 8.1 5 Consumer Discretionary 6.7 6 Materials 6.6 7 Industrials 6.4 8 Energy 3.4 9 Others 6.6 10 Cash & Cash Equivalents 2.8
Geographical allocation# No. Geographical name % NAV
1 Singapore 29.3 2 Thailand 25.7 3 Indonesia 19.4 4 Others 22.8 5 Cash & Cash Equivalents 2.8
July 2021 Factsheet Manulife ASEAN Equity Fund
# JPMORGAN FUNDS - ASEAN EQUITY FUND
Fund type/category Wholesale Fund (Feeder Fund) Fund objective The Fund aims to provide capital appreciation by investing in one collective investment scheme. Investor profile This Fund is suitable for Sophisticated Investors who are seek capital appreciation, wish to participate in the ASEAN equity markets and have a long-term investment horizon. Fund manager Manulife Investment Management (M) Berhad 200801033087 (834424-U) Trustee HSBC (Malaysia) Trustee Berhad 193701000084 (1281-T) Fund information (as at 30 Jun 2021) NAV/unit (USD Class) USD 1.0037 NAV/unit (RM-Hedged Class)
RM 1.0035 Fund size USD 22.73 mil Units in circulation 88.01 mil Fund launch date 17 Oct 2019 Fund inception date 07 Nov 2019 Financial year 30 Jun Currency USD Management fee Up to 1.80% of NAV p.a. Trustee fee 0.04% of NAV p.a. excluding
foreign custodian fees and charges
Sales charge Up to 5.50% of NAV per unit Redemption charge Nil Distribution frequency Incidental, if any Benchmark MSCI AC ASEAN Index
(Total Return Net)
Fund review and strategy Since inception performance as at 30 June 2021*
——— Fund USD Class ——— Benchmark in USD
While the near-term recovery outlook has hit a speed bump amid a recent Covid-19 resurgence, various governments have taken proactive measures, stepped up vaccine procurement and inoculation to drive reopening. With vaccine rollouts underway, mobility is on path towards normalisation with hope of gradual resumption of international travel in the second half of the year. ASEAN continues to be a laggard to the rest of Asia but valuations are below long term averages, implying room for markets to recover.
Total return over the following periods ended 30 June 2021*
1 month
6 month YTD 1 year 3 year 5 year Since
inception Fund USD Class (%) -2.85 0.90 0.90 20.38 - - 0.37 Benchmark in USD (%) -3.21 -1.79 -1.79 13.05 - - -7.73 Fund RM-Hedged Class (%) -2.73 1.38 1.38 21.17 - - 0.35 Benchmark in USD (%) -3.21 -1.79 -1.79 13.05 - - -7.73
Calendar year returns* 2016 2017 2018 2019 2020
Fund USD Class (%) - - - -0.11 -0.42 Benchmark in USD (%) - - - 0.42 -6.43 Fund RM-Hedged Class (%) - - - -0.19 -0.83 Benchmark in USD (%) - - - 0.42 -6.43
* Source: Lipper; Past performance is not necessarily indicative of future performance. The performance is calculated on NAV-to-NAV basis.
-35%
-30%
-25%
-20%
-15%
-10%
-5%
0%
5%
11/2019 12/2019 02/2020 03/2020 05/2020 06/2020 08/2020 09/2020 11/2020 12/2020 02/2021 03/2021 05/2021 06/2021
Top 5 holdings# No. Security name % NAV
1 DBS 7.8 2 Bank Central Asia 6.5 3 Oversea-Chinese Banking 6.0 4 Bank Rakyat Indonesia 3.9 5 Sea 3.8
Highest & lowest NAV 2018 2019 2020
High - 1.0000 1.0178 Low - 0.9694 0.6124
Distribution by financial year 2018 2019 2020
Distribution (Sen) - - - Distribution Yield (%) - - -
Asset/sector allocation# No. Asset/sector name % NAV
1 Financials 38.0 2 Communication Services 12.3 3 Real Estate 9.1 4 Consumer Staples 8.1 5 Consumer Discretionary 6.7 6 Materials 6.6 7 Industrials 6.4 8 Energy 3.4 9 Others 6.6 10 Cash & Cash Equivalents 2.8
Geographical allocation# No. Geographical name % NAV
1 Singapore 29.3 2 Thailand 25.7 3 Indonesia 19.4 4 Others 22.8 5 Cash & Cash Equivalents 2.8
12
July 2021 Factsheet Manulife ASEAN Equity Fund Market Review The ASEAN region was flat on aggregate, with contrasting performance between markets, driven by COVID-19 infection trends. Singapore, Thailand and Malaysia saw subdued performance due to rising cases and tighter mobility restrictions, whereas the Philippines saw a strong market rebound as cases appeared to be stabilizing. Vietnam was the outlier – posting new all-time highs despite a flare up in cases. ASEAN lagged Asa ex Japan this month. Feeder Fund Review In June, the Feeder Fund posted a) -2.85% versus the benchmark return of -3.21% for its USD class; and b) -2.73% versus the benchmark return of -3.21% for its RM-Hedged class. The Fund was down but outperformed the benchmark. On a country level, stock selection was strong in Thailand and Singapore. Allocation to Vietnam also helped. On a sector level, communication services and health care were strong. On the positive side, sector allocation and stock selection in health care worked well. Being underweight the Malaysian glove makers again worked in our favour. Elsewhere in health care, the off-benchmark position in a Thailand medical services stock contributed on the back of increased hospitalization utility from the covid situation. In Singapore, a multinational technology conglomerate that own a leading e-commerce platform in Southeast Asian and Taiwan was the largest contributor on its long-term growth potential. In Vietnam, a commerce bank finally rallied after a stale price performance in the 1H2021. In Philippines, the market advanced on optimism around reopening. The COVID situation is improving locally with cases and hospitals’ bed occupancies improving. Holding a Philippines based energy company in the power sector was positive as the market starts to get comfortable around the prospects for capacity growth. A global port management company headquartered in Manila contributed as there were continual earnings and price upgrades by the market. Market Outlook While the near-term recovery outlook has hit a speed bump amid the recent Covid-19 resurgence, various governments have taken proactive measures, stepped up vaccine procurement and inoculation to drive reopening. With vaccine rollouts underway, mobility is on path towards normalisation with hope of a gradual resumption of international travel in the second half of the year. ASEAN continues to be a laggard to the rest of Asia but valuations are below long term averages, implying room for markets to recover. The structural positives for ASEAN remain unchanged through the pandemic. The region is well-placed for further supply chain diversification, and long-term structural themes such as increasing financial penetration, and tourism growth should gradually return to the fore as we move past the lockdown-induced cyclical troughs. The emergence of new economy stocks in ASEAN and potential public listings also present interesting opportunities. Meantime, we are encouraged by the positive progress in Indonesia’s Omnibus law reform, the financial health of its banking system in weathering this pandemic, and the robust growth story exhibited by Vietnam. The pace of the recovery will be uneven across the region, and active bottom-up picking remains crucial given the wide dispersion in stock fundamentals across ASEAN. We continue to be overweight companies in regions with long term growth profiles (Indonesia, Vietnam). The fund is more selective in Thailand and Singapore. Malaysia continues to be a structural underweight for the fund. Across ASEAN, we continue to prefer long-term compounders and domestic champions with attractive growth prospects, however we have been gradually positioning the portfolio more towards areas which may benefit from the eventual economic reopening. The above information has not been reviewed by the SC and is subject to the relevant warning, disclaimer, qualification or terms and conditions stated herein. Investors are advised to read and understand the contents of the Information Memorandum dated 11 February 2020 and all the respective Product Highlights Sheet(s) (collectively, the “Offering Documents”), obtainable at our offices or website, before investing. The Offering Documents have been registered with the Securities Commission Malaysia (SC), however the registration with the SC does not amount to nor indicate that the SC has recommended or endorsed the product. Where a unit split/distribution is declared, investors are advised that following the issue of additional units/distribution, the NAV per unit will be reduced from the pre-unit split NAV/cum-distribution NAV to post-unit split NAV/ex-distribution NAV; and where a unit split is declared, the value of your investment in the Fund’s denominated currency will remained unchanged after the distribution of the additional units. Past performances are not an indication of future performances. There are risks involved with investing in unit trust funds; wholesale funds and/or Private Retirement Schemes. Some of these risks associated with investments in unit trust funds; wholesale funds and/or Private Retirement Schemes are interest rate fluctuation risk, foreign exchange or currency risk, country risk, political risk, credit risk, non-compliance risk, counterparty risk, target fund manager risk, liquidity risk and interest rate risk. For further details on the risk profile of all the funds, please refer to the Risk Factors section in the Offering Documents. The price of units and income distribution may go down as well as up. Investors should compare and consider the fees, charges and costs involved. Investors are advised to conduct own risk assessment and consult the professional advisers if in doubt on the action to be taken.
13
July 2021 Factsheet Manulife Asia Pacific Income And Growth Fund
# MANULIFE ADVANCED FUND SPC - ASIA PACIFIC INCOME AND GROWTH FUND SEGREGATED PORTFOLIO
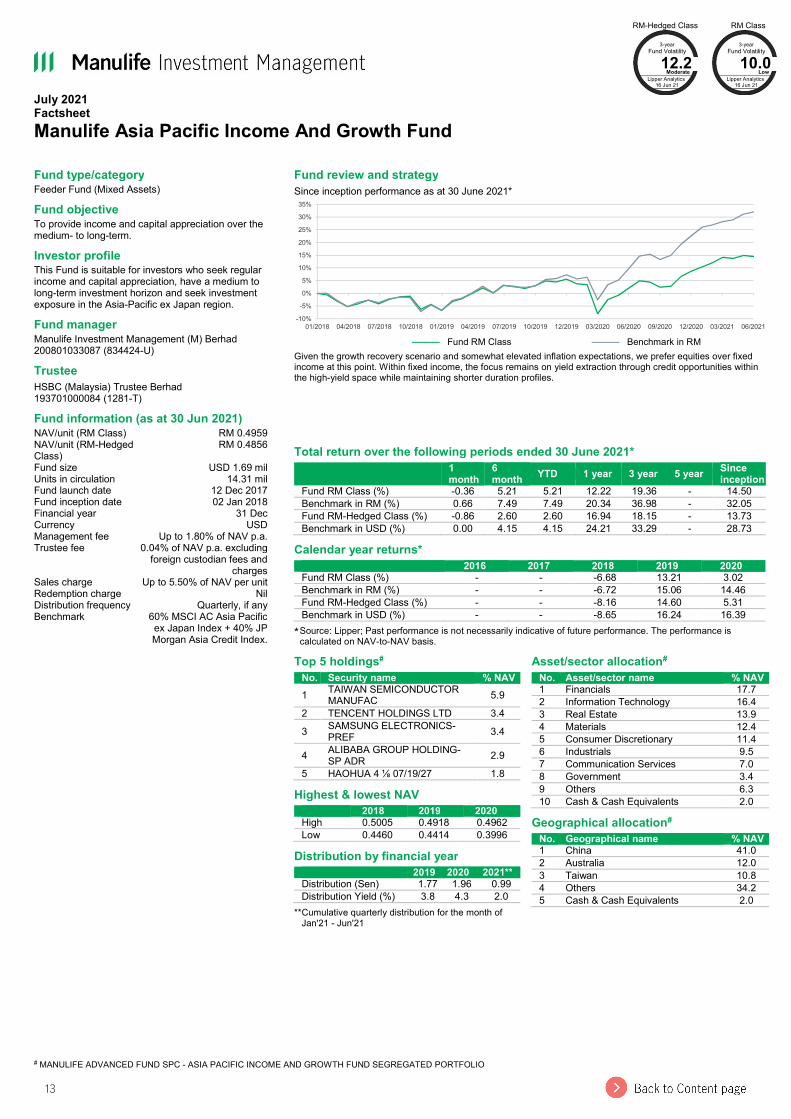
Fund type/category Feeder Fund (Mixed Assets) Fund objective To provide income and capital appreciation over the medium- to long-term. Investor profile This Fund is suitable for investors who seek regular income and capital appreciation, have a medium to long-term investment horizon and seek investment exposure in the Asia-Pacific ex Japan region. Fund manager Manulife Investment Management (M) Berhad 200801033087 (834424-U) Trustee HSBC (Malaysia) Trustee Berhad 193701000084 (1281-T) Fund information (as at 30 Jun 2021) NAV/unit (RM Class) RM 0.4959 NAV/unit (RM-Hedged Class)
RM 0.4856 Fund size USD 1.69 mil Units in circulation 14.31 mil Fund launch date 12 Dec 2017 Fund inception date 02 Jan 2018 Financial year 31 Dec Currency USD Management fee Up to 1.80% of NAV p.a. Trustee fee 0.04% of NAV p.a. excluding
foreign custodian fees and charges
Sales charge Up to 5.50% of NAV per unit Redemption charge Nil Distribution frequency Quarterly, if any Benchmark 60% MSCI AC Asia Pacific
ex Japan Index + 40% JP Morgan Asia Credit Index.
Fund review and strategy Since inception performance as at 30 June 2021*
——— Fund RM Class ——— Benchmark in RM
Given the growth recovery scenario and somewhat elevated inflation expectations, we prefer equities over fixed income at this point. Within fixed income, the focus remains on yield extraction through credit opportunities within the high-yield space while maintaining shorter duration profiles.
Total return over the following periods ended 30 June 2021*
1 month
6 month YTD 1 year 3 year 5 year Since
inception Fund RM Class (%) -0.36 5.21 5.21 12.22 19.36 - 14.50 Benchmark in RM (%) 0.66 7.49 7.49 20.34 36.98 - 32.05 Fund RM-Hedged Class (%) -0.86 2.60 2.60 16.94 18.15 - 13.73 Benchmark in USD (%) 0.00 4.15 4.15 24.21 33.29 - 28.73
Calendar year returns* 2016 2017 2018 2019 2020
Fund RM Class (%) - - -6.68 13.21 3.02 Benchmark in RM (%) - - -6.72 15.06 14.46 Fund RM-Hedged Class (%) - - -8.16 14.60 5.31 Benchmark in USD (%) - - -8.65 16.24 16.39
* Source: Lipper; Past performance is not necessarily indicative of future performance. The performance is calculated on NAV-to-NAV basis.
-10%
-5%
0%
5%
10%
15%
20%
25%
30%
35%
01/2018 04/2018 07/2018 10/2018 01/2019 04/2019 07/2019 10/2019 12/2019 03/2020 06/2020 09/2020 12/2020 03/2021 06/2021
Top 5 holdings# No. Security name % NAV
1 TAIWAN SEMICONDUCTOR MANUFAC 5.9
2 TENCENT HOLDINGS LTD 3.4 3 SAMSUNG ELECTRONICS-
PREF 3.4
4 ALIBABA GROUP HOLDING-SP ADR 2.9
5 HAOHUA 4 ⅛ 07/19/27 1.8 Highest & lowest NAV 2018 2019 2020
High 0.5005 0.4918 0.4962 Low 0.4460 0.4414 0.3996
Distribution by financial year 2019 2020 2021**
Distribution (Sen) 1.77 1.96 0.99 Distribution Yield (%) 3.8 4.3 2.0
** Cumulative quarterly distribution for the month of Jan'21 - Jun'21
Asset/sector allocation# No. Asset/sector name % NAV
1 Financials 17.7 2 Information Technology 16.4 3 Real Estate 13.9 4 Materials 12.4 5 Consumer Discretionary 11.4 6 Industrials 9.5 7 Communication Services 7.0 8 Government 3.4 9 Others 6.3 10 Cash & Cash Equivalents 2.0
Geographical allocation# No. Geographical name % NAV
1 China 41.0 2 Australia 12.0 3 Taiwan 10.8 4 Others 34.2 5 Cash & Cash Equivalents 2.0
RM Class 3-year
Fund Volatility 10.0
Low Lipper Analytics
16 Jun 21
RM-Hedged Class 3-year
Fund Volatility 12.2
Moderate Lipper Analytics
16 Jun 21
July 2021 Factsheet Manulife Asia Pacific Income And Growth Fund
# MANULIFE ADVANCED FUND SPC - ASIA PACIFIC INCOME AND GROWTH FUND SEGREGATED PORTFOLIO
Fund type/category Feeder Fund (Mixed Assets) Fund objective To provide income and capital appreciation over the medium- to long-term. Investor profile This Fund is suitable for investors who seek regular income and capital appreciation, have a medium to long-term investment horizon and seek investment exposure in the Asia-Pacific ex Japan region. Fund manager Manulife Investment Management (M) Berhad 200801033087 (834424-U) Trustee HSBC (Malaysia) Trustee Berhad 193701000084 (1281-T) Fund information (as at 30 Jun 2021) NAV/unit (RM Class) RM 0.4959 NAV/unit (RM-Hedged Class)
RM 0.4856 Fund size USD 1.69 mil Units in circulation 14.31 mil Fund launch date 12 Dec 2017 Fund inception date 02 Jan 2018 Financial year 31 Dec Currency USD Management fee Up to 1.80% of NAV p.a. Trustee fee 0.04% of NAV p.a. excluding
foreign custodian fees and charges
Sales charge Up to 5.50% of NAV per unit Redemption charge Nil Distribution frequency Quarterly, if any Benchmark 60% MSCI AC Asia Pacific
ex Japan Index + 40% JP Morgan Asia Credit Index.
Fund review and strategy Since inception performance as at 30 June 2021*
——— Fund RM Class ——— Benchmark in RM
Given the growth recovery scenario and somewhat elevated inflation expectations, we prefer equities over fixed income at this point. Within fixed income, the focus remains on yield extraction through credit opportunities within the high-yield space while maintaining shorter duration profiles.
Total return over the following periods ended 30 June 2021*
1 month
6 month YTD 1 year 3 year 5 year Since
inception Fund RM Class (%) -0.36 5.21 5.21 12.22 19.36 - 14.50 Benchmark in RM (%) 0.66 7.49 7.49 20.34 36.98 - 32.05 Fund RM-Hedged Class (%) -0.86 2.60 2.60 16.94 18.15 - 13.73 Benchmark in USD (%) 0.00 4.15 4.15 24.21 33.29 - 28.73
Calendar year returns* 2016 2017 2018 2019 2020
Fund RM Class (%) - - -6.68 13.21 3.02 Benchmark in RM (%) - - -6.72 15.06 14.46 Fund RM-Hedged Class (%) - - -8.16 14.60 5.31 Benchmark in USD (%) - - -8.65 16.24 16.39
* Source: Lipper; Past performance is not necessarily indicative of future performance. The performance is calculated on NAV-to-NAV basis.
-10%
-5%
0%
5%
10%
15%
20%
25%
30%
35%
01/2018 04/2018 07/2018 10/2018 01/2019 04/2019 07/2019 10/2019 12/2019 03/2020 06/2020 09/2020 12/2020 03/2021 06/2021
Top 5 holdings# No. Security name % NAV
1 TAIWAN SEMICONDUCTOR MANUFAC 5.9
2 TENCENT HOLDINGS LTD 3.4 3 SAMSUNG ELECTRONICS-
PREF 3.4
4 ALIBABA GROUP HOLDING-SP ADR 2.9
5 HAOHUA 4 ⅛ 07/19/27 1.8 Highest & lowest NAV 2018 2019 2020
High 0.5005 0.4918 0.4962 Low 0.4460 0.4414 0.3996
Distribution by financial year 2019 2020 2021**
Distribution (Sen) 1.77 1.96 0.99 Distribution Yield (%) 3.8 4.3 2.0
** Cumulative quarterly distribution for the month of Jan'21 - Jun'21
Asset/sector allocation# No. Asset/sector name % NAV
1 Financials 17.7 2 Information Technology 16.4 3 Real Estate 13.9 4 Materials 12.4 5 Consumer Discretionary 11.4 6 Industrials 9.5 7 Communication Services 7.0 8 Government 3.4 9 Others 6.3 10 Cash & Cash Equivalents 2.0
Geographical allocation# No. Geographical name % NAV
1 China 41.0 2 Australia 12.0 3 Taiwan 10.8 4 Others 34.2 5 Cash & Cash Equivalents 2.0
RM Class 3-year
Fund Volatility 10.0
Low Lipper Analytics
16 Jun 21
RM-Hedged Class 3-year
Fund Volatility 12.2
Moderate Lipper Analytics
16 Jun 21
14
July 2021 Factsheet Manulife Asia Pacific Income And Growth Fund Market Review Asia ex Japan equity markets moved marginally lower in June. Two catalysts dominated global equity markets for the month. In mid-June, the US Federal Reserve Board (Fed)’s unexpectedly hawkish statement that rates might be raised twice in 2023 due to rising inflationary pressures bolstered the US dollar and roiled equity markets, particularly emerging markets. In addition, the spread of the Delta variant of Covid-19 notably increased caseloads globally, particularly in Southeast Asia where lockdowns were reinstated due to lower vaccination rates. As a result, only a handful of regional markets posted gains (mostly in Northeast Asia except for the Philippines and Vietnam), while all major regional currencies were flat or weakened against the US dollar). In the United States, Treasury yields declined on the back of mixed economic data and the Federal Open Market Committee meeting. The May non-farm payrolls report came in short of market expectations that the US economy added 559,000 jobs, while the headline consumer price index rose by 5% year-on-year in May, hitting the highest monthly gains since 2008. The Fed was generally viewed as hawkish after they kept rates unchanged and hinted at the likelihood of higher rate hikes. The Fed’s dot plot pointed to two hikes by the end of 2023, but the Fed did not issue guidance on tapering its asset purchases. Post-Fed meeting, Fed officials eased inflation fears and expected inflationary pressure to be transitory. Over the period, the 10-year Treasury yield fell from 1.59% to 1.47%. Asian credit markets posted positive returns over the month owing to lower US Treasury yields and positive carry, offsetting wider credit spreads in the high-yield space. The Asian high yield corporate segment underperformed Asian investment grade credit; the JP Morgan Asian High Yield Corporate Bond Index decreased by -1.27%, while the JP Morgan Asian Investment Grade Corporate Bond Index increased by 0.82% in US dollar terms. Chinese high-yield names were soft, dragged by financing pressure and policy tightening concerns on the Chinese property sector, whilst investment grade credit remained relatively resilient. In Malaysia, S&P affirmed its A- sovereign rating and maintained a negative outlook due to renewed Covid-19 cases, though it did not induce significant price action. China equities moved marginally lower for the month. While onshore indices were essentially flat, growth-related indices (ChiNext and STAR 50) notably outperformed. In terms of capital flows, northbound inflows totalled 15 billion renminbi for the month, notably down from the 56 billion renminbi in May. On the economic front, monthly data in retail sales, fixed asset investments, and industrial output suggested weaker activity as they failed to meet market consensus. Taiwan’s equity market moved higher for the month even as several factors drove technology shares lower: concerns over supply chain breaks due to Covid-19 restrictions, a less optimistic outlook for global smartphone sales, and lower price hikes expected in the panel sector. On the economic front, exports continued their strong run, moving up 38.6% (year-on-year) in May. South Korean equity markets posted gains for the month. Equities were boosted by the floating of several successful initial public offerings, as well as declining investor fears over inflation and moderately optimistic expectations for the second quarter earnings season. On the economic front, exports posted their best performance since August 1988, surging 46 percent (year-on-year) in May. Indian equities posted losses for the month despite the decreasing number of Covid-19 cases. The Indian government unveiled new measures to help the economy at the end of the month, including additional lending for loan guarantee schemes and a broadening of credit guarantees. The Reserve Bank of India also pledged to maintain ample liquidity for markets, announcing it would increase already aggressive purchases of government bonds in third quarter. ASEAN markets were all lower except for the Philippines where the equity market moved higher on optimism of the economic opening; areas outside the capital were opened despite further restrictions imposed around Manila. The central bank pledged an accommodative position until at least the first half of 2022, as inflationary pressures receded in May. In Indonesia, a notable increase in the number of Covid-19 cases that led to further lockdowns, coupled with a hawkish Fed statement, weakened the rupiah and sent equities sharply lower. Malaysian equity markets were lower as the national lockdown originally scheduled for the first two weeks of June was extended through July – no end date was given. In Thailand, a notable increase in Covid-19 cases resulted in the country’s parliament passing a bill to borrow US$16 billion for virus-related fiscal relief. Political instability also increased as protestors calling for constitutional reform headed back onto the streets of the capital. In Australia, equity markets posted losses for the month. Equity markets moved lower as commodity prices on key exports were mixed – iron ore moved higher while copper receded – and new administrative lockdowns were imposed due to the spread of the Delta variant. Feeder Fund Review In June, the Feeder Fund posted -0.36% versus the benchmark return of 0.66% for its RM class while returned -0.86% versus the benchmark return of 0.002% for its RM-Hedged class. The Fund’s equity portion detracted on the back of stock selection at the country and sector level and asset allocation decisions at the country level. Stock selection in China, Taiwan and South Korea and the overweight to Singapore were the primary detractors to performance. Partially offsetting the detraction was stock selection in India. Detracting from performance was the Fund’s holding in a Chinese cybersecurity software company over concerns of weak second quarter results due to a delay in the government’s tender. However, we believe that the long-term structural growth in cybersecurity remains intact and supportive government policies should help support future growth. Another detractor was a Hong Kong fixed line telecommunications company that guided toward lower-than-expected divided per share growth on the back of stalled economic activity in Hong Kong driven by the global Covid pandemic. Contributing positively was the Fund’s holding in a Chinese e-commerce company after recording record gross merchandise value during the most recent promotional sales season. The company continues to increase its new business investment which should drive its future earnings. Another contributor was a Taiwanese wafer manufacturer on the back of an improved demand/supply outlook. The company’s long-term agreements for wafer supply should provide visibility to its revenue and earnings stream considering a tighter supply/demand situation owing to increasing demand but limited supply increase. Over the period, the portfolio’s overall security selection contributed to performance with US dollar-denominated holdings of a Chinese chemical state-owned-enterprise and an Indonesian cooking oil manufacturer being the outperformers. However, underweight US dollar interest rate duration positioning detracted as Treasury yields fell over the period. Overweight to US dollar-denominated Asian corporate bonds also detracted as this segment underperformed the broad Asian credit market. Market Outlook Despite global equity market valuations looking elevated relative to history, low absolute interest rates and somewhat depressed earnings need to be kept in mind with multiples looking far more reasonable several years out. Asian equities continue to trade at a reasonable discount to global markets and we anticipate strong double-digit earnings recovery in 2021. Although 10-year bond yields have risen since the start of the year, equity dividend yields continue to look attractive compared to bond yields. We see scope for further reductions in valuation dispersions between high price-earnings growth stocks and stocks that have attractive yields as we enter a period of global economic recovery as vaccinations take hold across the region and around the world.
15
July 2021 Factsheet Manulife Asia Pacific Income And Growth Fund The strength in the anticipated economic recovery has led us to favour more cyclical yields such as within materials and ports for instance. The consumer spending recovery is also prompting us to increase our allocation towards the consumer discretionary sector particularly those who also have solid long-term growth prospects. Bond proxy equities are less favoured compared to last year given the recent steepening in the yield curve. Although real estate investment trusts can be considered as bond proxies, we maintain a strong allocation as a source of yield although we favour trusts that benefit from re-opening post-Covid lockdowns such as retail commercial trusts. We also continue to see strong value in many expressway companies which are seeing a dramatic increase in traffic post-Covid. Many companies we like that offer robust growth at a reasonable yield continue to be within the Taiwanese information technology sector which continues to benefit from ongoing chip shortages and ongoing structural growth profiles with solid cash flows and generous dividend payout ratios. We continue to hold several exposures within the banking sector. The steepening yield curve together with our view that many regional property markets should see a recovery in activity should lead to stronger earnings fundamentals. In terms of growth sectors, we see some value emerging back into the Chinese e-commerce sector which has corrected due to the anti-monopoly campaign. Compared to a few months ago, there is a lot more clarity on what the earnings impact would be from fines and alterations to business practices. Overall, the earnings growth profile continues to look attractive at much lower valuations. Given the growth recovery scenario and somewhat elevated inflation expectations, we prefer equities over fixed income at this point. Within fixed income, the focus remains on yield extraction through credit opportunities within the high-yield space while maintaining shorter duration profiles. Based on the Fund's portfolio returns as at 31 May 2021 the Volatility Factor (VF) for the Fund is as indicated in the table above and are classified as in the table (source: Lipper). "Very High" includes Funds with VF that are above 17.190, "High" includes Funds with VF that are above 14.310 but not more than 17.190, "Moderate" includes Funds with VF that are above 10.755 but not more than 14.310, "Low" includes Funds with VF that are above 3.645 but not more than 10.755 and "Very Low" includes Funds with VF that are above 0.000 but not more than 3.645 (source:FiMM). The VF means there is a possibility for the Funds in generating an upside return or downside return around this VF. The Volatility Class (VC) is assigned by Lipper based on quintile ranks of VF for qualified Funds. VF and VC are subject to monthly revision or at any interval which may be prescribed by FIMM from time to time. The Fund's portfolio may have changed since this date and there is no guarantee that the Funds will continue to have the same VF or VC in the future. Presently, only Funds launched in the market for at least 36 months will display the VF and its VC. The above information has not been reviewed by the SC and is subject to the relevant warning, disclaimer, qualification or terms and conditions stated herein. Investors are advised to read and understand the contents of the Master Prospectus dated 10 August 2020 and its First Supplemental Master Prospectus dated 10 August 2020 and its Second Supplemental Master Prospectus dated 27 January 2021 and its Third Supplemental Master Prospectus dated 5 April 2021 and all the respective Product Highlights Sheet(s) (collectively, the “Offering Documents”), obtainable at our offices or website, before investing. The Offering Documents have been registered with the Securities Commission Malaysia (SC), however the registration with the SC does not amount to nor indicate that the SC has recommended or endorsed the product. Where a unit split/distribution is declared, investors are advised that following the issue of additional units/distribution, the NAV per unit will be reduced from the pre-unit split NAV/cum-distribution NAV to post-unit split NAV/ex-distribution NAV; and where a unit split is declared, the value of your investment in the Fund’s denominated currency will remained unchanged after the distribution of the additional units. Past performances are not an indication of future performances. There are risks involved with investing in unit trust funds; wholesale funds and/or Private Retirement Schemes. Some of these risks associated with investments in unit trust funds; wholesale funds and/or Private Retirement Schemes are interest rate fluctuation risk, foreign exchange or currency risk, country risk, political risk, credit risk, non-compliance risk, counterparty risk, target fund manager risk, liquidity risk and interest rate risk. For further details on the risk profile of all the funds, please refer to the Risk Factors section in the Offering Documents. The price of units and income distribution may go down as well as up. Investors should compare and consider the fees, charges and costs involved. Investors are advised to conduct own risk assessment and consult the professional advisers if in doubt on the action to be taken.
16
July 2021 Factsheet Manulife Asian Small Cap Equity Fund
# MANULIFE GLOBAL FUND - ASIAN SMALL CAP EQUITY FUND 1 Generally, “smaller capitalization companies” refers to small-sized public listed companies. Classifying these companies based on their market capitalization remains challenging as small-
sized public listed companies in one market may not be considered small-sized in another due to various factors such as size, liquidity and dynamic of a given market. 2 Please refers to important note in section 2.1, the investment objective of the Target Fund (Page 23 of Information Memorandum dated 11 Feb 2020) for better understanding on
investment temperament of the Target Fund.
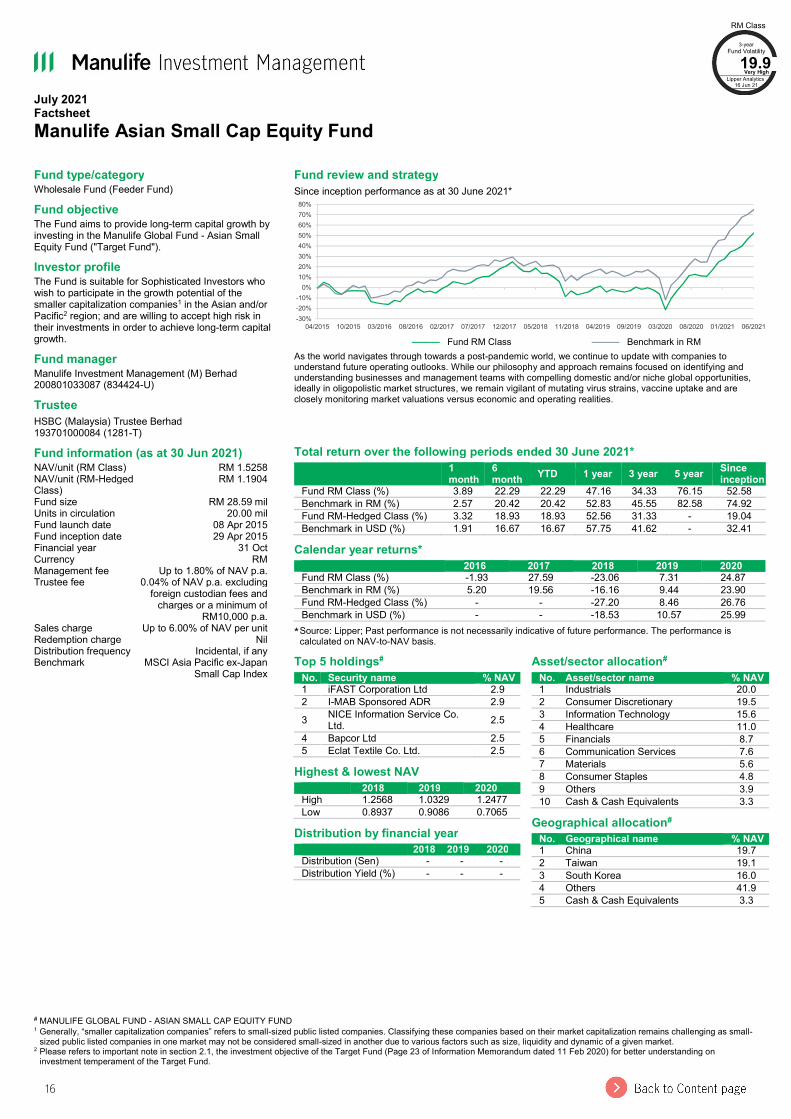
Fund type/category Wholesale Fund (Feeder Fund) Fund objective The Fund aims to provide long-term capital growth by investing in the Manulife Global Fund - Asian Small Equity Fund ("Target Fund"). Investor profile The Fund is suitable for Sophisticated Investors who wish to participate in the growth potential of the smaller capitalization companies1 in the Asian and/or Pacific2 region; and are willing to accept high risk in their investments in order to achieve long-term capital growth. Fund manager Manulife Investment Management (M) Berhad 200801033087 (834424-U) Trustee HSBC (Malaysia) Trustee Berhad 193701000084 (1281-T) Fund information (as at 30 Jun 2021) NAV/unit (RM Class) RM 1.5258 NAV/unit (RM-Hedged Class)
RM 1.1904 Fund size RM 28.59 mil Units in circulation 20.00 mil Fund launch date 08 Apr 2015 Fund inception date 29 Apr 2015 Financial year 31 Oct Currency RM Management fee Up to 1.80% of NAV p.a. Trustee fee 0.04% of NAV p.a. excluding
foreign custodian fees and charges or a minimum of
RM10,000 p.a. Sales charge Up to 6.00% of NAV per unit Redemption charge Nil Distribution frequency Incidental, if any Benchmark MSCI Asia Pacific ex-Japan
Small Cap Index
Fund review and strategy Since inception performance as at 30 June 2021*
——— Fund RM Class ——— Benchmark in RM
As the world navigates through towards a post-pandemic world, we continue to update with companies to understand future operating outlooks. While our philosophy and approach remains focused on identifying and understanding businesses and management teams with compelling domestic and/or niche global opportunities, ideally in oligopolistic market structures, we remain vigilant of mutating virus strains, vaccine uptake and are closely monitoring market valuations versus economic and operating realities.
Total return over the following periods ended 30 June 2021*
1 month
6 month YTD 1 year 3 year 5 year Since
inception Fund RM Class (%) 3.89 22.29 22.29 47.16 34.33 76.15 52.58 Benchmark in RM (%) 2.57 20.42 20.42 52.83 45.55 82.58 74.92 Fund RM-Hedged Class (%) 3.32 18.93 18.93 52.56 31.33 - 19.04 Benchmark in USD (%) 1.91 16.67 16.67 57.75 41.62 - 32.41
Calendar year returns* 2016 2017 2018 2019 2020
Fund RM Class (%) -1.93 27.59 -23.06 7.31 24.87 Benchmark in RM (%) 5.20 19.56 -16.16 9.44 23.90 Fund RM-Hedged Class (%) - - -27.20 8.46 26.76 Benchmark in USD (%) - - -18.53 10.57 25.99
* Source: Lipper; Past performance is not necessarily indicative of future performance. The performance is calculated on NAV-to-NAV basis.
-30%-20%-10%
0%10%20%30%40%50%60%70%80%
04/2015 10/2015 03/2016 08/2016 02/2017 07/2017 12/2017 05/2018 11/2018 04/2019 09/2019 03/2020 08/2020 01/2021 06/2021
Top 5 holdings# No. Security name % NAV
1 iFAST Corporation Ltd 2.9 2 I-MAB Sponsored ADR 2.9 3 NICE Information Service Co.
Ltd. 2.5 4 Bapcor Ltd 2.5 5 Eclat Textile Co. Ltd. 2.5
Highest & lowest NAV 2018 2019 2020
High 1.2568 1.0329 1.2477 Low 0.8937 0.9086 0.7065
Distribution by financial year 2018 2019 2020
Distribution (Sen) - - - Distribution Yield (%) - - -
Asset/sector allocation# No. Asset/sector name % NAV
1 Industrials 20.0 2 Consumer Discretionary 19.5 3 Information Technology 15.6 4 Healthcare 11.0 5 Financials 8.7 6 Communication Services 7.6 7 Materials 5.6 8 Consumer Staples 4.8 9 Others 3.9 10 Cash & Cash Equivalents 3.3
Geographical allocation# No. Geographical name % NAV
1 China 19.7 2 Taiwan 19.1 3 South Korea 16.0 4 Others 41.9 5 Cash & Cash Equivalents 3.3
RM Class 3-year
Fund Volatility 19.9
Very High Lipper Analytics
16 Jun 21
July 2021 Factsheet Manulife Asian Small Cap Equity Fund
# MANULIFE GLOBAL FUND - ASIAN SMALL CAP EQUITY FUND 1 Generally, “smaller capitalization companies” refers to small-sized public listed companies. Classifying these companies based on their market capitalization remains challenging as small-
sized public listed companies in one market may not be considered small-sized in another due to various factors such as size, liquidity and dynamic of a given market. 2 Please refers to important note in section 2.1, the investment objective of the Target Fund (Page 23 of Information Memorandum dated 11 Feb 2020) for better understanding on
investment temperament of the Target Fund.
Fund type/category Wholesale Fund (Feeder Fund) Fund objective The Fund aims to provide long-term capital growth by investing in the Manulife Global Fund - Asian Small Equity Fund ("Target Fund"). Investor profile The Fund is suitable for Sophisticated Investors who wish to participate in the growth potential of the smaller capitalization companies1 in the Asian and/or Pacific2 region; and are willing to accept high risk in their investments in order to achieve long-term capital growth. Fund manager Manulife Investment Management (M) Berhad 200801033087 (834424-U) Trustee HSBC (Malaysia) Trustee Berhad 193701000084 (1281-T) Fund information (as at 30 Jun 2021) NAV/unit (RM Class) RM 1.5258 NAV/unit (RM-Hedged Class)
RM 1.1904 Fund size RM 28.59 mil Units in circulation 20.00 mil Fund launch date 08 Apr 2015 Fund inception date 29 Apr 2015 Financial year 31 Oct Currency RM Management fee Up to 1.80% of NAV p.a. Trustee fee 0.04% of NAV p.a. excluding
foreign custodian fees and charges or a minimum of
RM10,000 p.a. Sales charge Up to 6.00% of NAV per unit Redemption charge Nil Distribution frequency Incidental, if any Benchmark MSCI Asia Pacific ex-Japan
Small Cap Index
Fund review and strategy Since inception performance as at 30 June 2021*
——— Fund RM Class ——— Benchmark in RM
As the world navigates through towards a post-pandemic world, we continue to update with companies to understand future operating outlooks. While our philosophy and approach remains focused on identifying and understanding businesses and management teams with compelling domestic and/or niche global opportunities, ideally in oligopolistic market structures, we remain vigilant of mutating virus strains, vaccine uptake and are closely monitoring market valuations versus economic and operating realities.
Total return over the following periods ended 30 June 2021*
1 month
6 month YTD 1 year 3 year 5 year Since
inception Fund RM Class (%) 3.89 22.29 22.29 47.16 34.33 76.15 52.58 Benchmark in RM (%) 2.57 20.42 20.42 52.83 45.55 82.58 74.92 Fund RM-Hedged Class (%) 3.32 18.93 18.93 52.56 31.33 - 19.04 Benchmark in USD (%) 1.91 16.67 16.67 57.75 41.62 - 32.41
Calendar year returns* 2016 2017 2018 2019 2020
Fund RM Class (%) -1.93 27.59 -23.06 7.31 24.87 Benchmark in RM (%) 5.20 19.56 -16.16 9.44 23.90 Fund RM-Hedged Class (%) - - -27.20 8.46 26.76 Benchmark in USD (%) - - -18.53 10.57 25.99
* Source: Lipper; Past performance is not necessarily indicative of future performance. The performance is calculated on NAV-to-NAV basis.
-30%-20%-10%
0%10%20%30%40%50%60%70%80%
04/2015 10/2015 03/2016 08/2016 02/2017 07/2017 12/2017 05/2018 11/2018 04/2019 09/2019 03/2020 08/2020 01/2021 06/2021
Top 5 holdings# No. Security name % NAV
1 iFAST Corporation Ltd 2.9 2 I-MAB Sponsored ADR 2.9 3 NICE Information Service Co.
Ltd. 2.5 4 Bapcor Ltd 2.5 5 Eclat Textile Co. Ltd. 2.5
Highest & lowest NAV 2018 2019 2020
High 1.2568 1.0329 1.2477 Low 0.8937 0.9086 0.7065
Distribution by financial year 2018 2019 2020
Distribution (Sen) - - - Distribution Yield (%) - - -
Asset/sector allocation# No. Asset/sector name % NAV
1 Industrials 20.0 2 Consumer Discretionary 19.5 3 Information Technology 15.6 4 Healthcare 11.0 5 Financials 8.7 6 Communication Services 7.6 7 Materials 5.6 8 Consumer Staples 4.8 9 Others 3.9 10 Cash & Cash Equivalents 3.3
Geographical allocation# No. Geographical name % NAV
1 China 19.7 2 Taiwan 19.1 3 South Korea 16.0 4 Others 41.9 5 Cash & Cash Equivalents 3.3
RM Class 3-year
Fund Volatility 19.9
Very High Lipper Analytics
16 Jun 21

17
July 2021 Factsheet Manulife Asian Small Cap Equity Fund Market Review Asia-Pacific ex Japan small cap equity markets moved higher in June. Two catalysts dominated global equity markets for the month. In mid-June, the US Federal Reserve Board’s unexpectedly hawkish statement that rates might be raised twice in 2023 due to rising inflationary pressures bolstered the US dollar and roiled equity markets, particularly emerging markets. In addition, the spread of the delta variant of Covid-19 notably increased caseloads globally, particularly in Southeast Asia where lockdowns were reinstated due to lower vaccination rates. Chinese equities moved marginally lower for the month. While onshore indices were essentially flat, growth-related indices (ChiNext and STAR 50) notably outperformed. In capital flows, northbound inflows totaled 15 billion renminbi for the month, notably down from the 56 billion renminbi in May. On the economic front, monthly data in retail sales, fixed asset investments, and industrial output suggested weaker activity as they failed to meet market consensus. Taiwan’s equity market moved higher for the month even as several factors drove technology shares lower: concerns over supply chain breaks due to Covid-19 restrictions, a less optimistic outlook for global smartphone sales, and lower price hikes expected in the panel sector. On the economic front, exports continued their strong run, moving up 38.6% (year-on-year) in May. South Korean equity markets posted gains for the month. Equities were boosted by the floating of several successful initial public offerings, as well as declining investor fears over inflation and moderately optimistic expectations for the second quarter earnings season. On the economic front, exports posted their best performance since August 1988, surging 46 percent (year-on-year) in May. Indian equities posted losses for the month despite the decreasing number of Covid-19 cases. The Indian government unveiled new measures to help the economy at the end of the month, including additional lending for loan guarantee schemes and a broadening of credit guarantees. The Reserve Bank of India also pledged to maintain ample liquidity for markets, announcing it would increase already aggressive purchases of government bonds in the third quarter. ASEAN markets were all lower except for the Philippines where the equity market moved higher on optimism of the economic opening; areas outside the capital were opened despite further restrictions imposed around Manila. The central bank pledged an accommodative position until at least the first half of 2022, as inflationary pressures receded in May. In Indonesia, a notable increase in the number of Covid-19 cases that led to further lockdowns, coupled with a hawkish Fed statement, weakened the rupiah and sent equities sharply lower. Malaysian equity markets were lower as the national lockdown originally scheduled for the first two weeks of June was extended through July – no end date was given. In Thailand, a notable increase in Covid-19 cases resulted in Thailand’s parliament passing a bill to borrow US$16 billion for virus-related fiscal relief. Political instability also increased as protestors calling for constitutional reform headed back onto the streets of the capital. Feeder Fund Review In June, the Feeder Fund posted: a) 3.89% versus the benchmark return of 2.57% for its RM class; and b) 3.32% versus the benchmark return of 1.91% for its RM-Hedged class. The Fund outperformed for the month on the back of stock selection at the country and sector level. Partially offsetting the detraction was asset allocation decisions at the country and sector level. Stock selection in South Korea, Hong Kong, Indonesia, India, Malaysia and the underweight in Australia were the primary contributors to performance. Partially offsetting the outperformance was stock selection in Taiwan, Australia and the overweight to Indonesia and China. Top individual contributor was a clinical contract research organisation that provides services throughout the drug discovery and development process. The company continues to see recovery in the US to pre-Covid levels, increasing synergies with its strategic partner and differentiation amongst its domestic competitors. Elsewhere, the exposure in a South Korean sport apparel and footwear stock contributed as the manufacturing and retail company should benefit from the economic reopening. Detracting was a Singapore-listed wealth management services provider as it was subject to profit-taking after strong year-to-date performance. We believe that the company’s unique business model helps differentiate it from the competition and with its geographic expansion, clear catalysts may emerge. Market Outlook As the world navigates through towards a post-pandemic world, we continue to update with companies to understand future operating outlooks. While our philosophy and approach remains focused on identifying and understanding businesses and management teams with compelling domestic and/or niche global opportunities, ideally in oligopolistic market structures, we remain vigilant of mutating virus strains, vaccine uptake and are closely monitoring market valuations versus economic and operating realities. We continue to consider the fiscal and monetary policy environments and how government aid and its magnitude will impact the speed of the recovery and medium to longer-term inflationary considerations. Larger questions will be the role of materially expanded monetary bases and shifts in fiscal spending priorities. While we adjust to quickly evolving markets, our approach is and will continue to be rooted in operating fundamentals. All of that said, and in comparison to 2020, there are clear reasons for lower equity risk premia: including more stable global trade relations and the opportunity for governments to cooperate on combating climate change. For economically open northern Asian countries like South Korea and Taiwan, a reduction in trade frictions would be a benefit. In other parts of Asia, even assuming a modest change in stance, the increasing importance of ASEAN as a beneficiary of outsourcing activities will not be diminished. Based on the Fund's portfolio returns as at 31 May 2021 the Volatility Factor (VF) for the Fund is as indicated in the table above and are classified as in the table (source: Lipper). "Very High" includes Funds with VF that are above 17.190, "High" includes Funds with VF that are above 14.310 but not more than 17.190, "Moderate" includes Funds with VF that are above 10.755 but not more than 14.310, "Low" includes Funds with VF that are above 3.645 but not more than 10.755 and "Very Low" includes Funds with VF that are above 0.000 but not more than 3.645 (source:FiMM). The VF means there is a possibility for the Funds in generating an upside return or downside return around this VF. The Volatility Class (VC) is assigned by Lipper based on quintile ranks of VF for qualified Funds. VF and VC are subject to monthly revision or at any interval which may be prescribed by FIMM from time to time. The Fund's portfolio may have changed since this date and there is no guarantee that the Funds will continue to have the same VF or VC in the future. Presently, only Funds launched in the market for at least 36 months will display the VF and its VC. The above information has not been reviewed by the SC and is subject to the relevant warning, disclaimer, qualification or terms and conditions stated herein. Investors are advised to read and understand the contents of the Information Memorandum dated 11 February 2020 and all the respective Product Highlights Sheet(s) (collectively, the “Offering Documents”), obtainable at our offices or website, before investing. The Offering Documents have been registered with the Securities Commission Malaysia (SC), however the registration with the SC does not amount to nor indicate that the SC has recommended or endorsed the product. Where a unit split/distribution is declared, investors are advised that following the issue of additional units/distribution, the NAV per unit will be reduced from the pre-unit split NAV/cum-distribution NAV to post-unit split NAV/ex-distribution NAV; and where a unit split is declared, the value of your investment in the Fund’s denominated currency will remained unchanged after the distribution of the additional units. Past performances are not an indication of future performances. There are risks involved with investing in unit trust funds; wholesale funds and/or Private Retirement Schemes. Some of these risks associated with investments in unit trust funds; wholesale funds and/or Private Retirement Schemes are interest rate fluctuation risk, foreign exchange or currency risk, country risk, political risk, credit risk, non-compliance risk, counterparty risk, target fund manager risk, liquidity risk and interest rate risk. For further details on the risk profile of all the funds, please refer to the Risk Factors section in the Offering Documents. The price of units and income distribution may go down as well as up. Investors should compare and consider the fees, charges and costs involved. Investors are advised to conduct own risk assessment and consult the professional advisers if in doubt on the action to be taken.
July 2021 Factsheet Manulife Asian Small Cap Equity Fund Market Review Asia-Pacific ex Japan small cap equity markets moved higher in June. Two catalysts dominated global equity markets for the month. In mid-June, the US Federal Reserve Board’s unexpectedly hawkish statement that rates might be raised twice in 2023 due to rising inflationary pressures bolstered the US dollar and roiled equity markets, particularly emerging markets. In addition, the spread of the delta variant of Covid-19 notably increased caseloads globally, particularly in Southeast Asia where lockdowns were reinstated due to lower vaccination rates. Chinese equities moved marginally lower for the month. While onshore indices were essentially flat, growth-related indices (ChiNext and STAR 50) notably outperformed. In capital flows, northbound inflows totaled 15 billion renminbi for the month, notably down from the 56 billion renminbi in May. On the economic front, monthly data in retail sales, fixed asset investments, and industrial output suggested weaker activity as they failed to meet market consensus. Taiwan’s equity market moved higher for the month even as several factors drove technology shares lower: concerns over supply chain breaks due to Covid-19 restrictions, a less optimistic outlook for global smartphone sales, and lower price hikes expected in the panel sector. On the economic front, exports continued their strong run, moving up 38.6% (year-on-year) in May. South Korean equity markets posted gains for the month. Equities were boosted by the floating of several successful initial public offerings, as well as declining investor fears over inflation and moderately optimistic expectations for the second quarter earnings season. On the economic front, exports posted their best performance since August 1988, surging 46 percent (year-on-year) in May. Indian equities posted losses for the month despite the decreasing number of Covid-19 cases. The Indian government unveiled new measures to help the economy at the end of the month, including additional lending for loan guarantee schemes and a broadening of credit guarantees. The Reserve Bank of India also pledged to maintain ample liquidity for markets, announcing it would increase already aggressive purchases of government bonds in the third quarter. ASEAN markets were all lower except for the Philippines where the equity market moved higher on optimism of the economic opening; areas outside the capital were opened despite further restrictions imposed around Manila. The central bank pledged an accommodative position until at least the first half of 2022, as inflationary pressures receded in May. In Indonesia, a notable increase in the number of Covid-19 cases that led to further lockdowns, coupled with a hawkish Fed statement, weakened the rupiah and sent equities sharply lower. Malaysian equity markets were lower as the national lockdown originally scheduled for the first two weeks of June was extended through July – no end date was given. In Thailand, a notable increase in Covid-19 cases resulted in Thailand’s parliament passing a bill to borrow US$16 billion for virus-related fiscal relief. Political instability also increased as protestors calling for constitutional reform headed back onto the streets of the capital. Feeder Fund Review In June, the Feeder Fund posted: a) 3.89% versus the benchmark return of 2.57% for its RM class; and b) 3.32% versus the benchmark return of 1.91% for its RM-Hedged class. The Fund outperformed for the month on the back of stock selection at the country and sector level. Partially offsetting the detraction was asset allocation decisions at the country and sector level. Stock selection in South Korea, Hong Kong, Indonesia, India, Malaysia and the underweight in Australia were the primary contributors to performance. Partially offsetting the outperformance was stock selection in Taiwan, Australia and the overweight to Indonesia and China. Top individual contributor was a clinical contract research organisation that provides services throughout the drug discovery and development process. The company continues to see recovery in the US to pre-Covid levels, increasing synergies with its strategic partner and differentiation amongst its domestic competitors. Elsewhere, the exposure in a South Korean sport apparel and footwear stock contributed as the manufacturing and retail company should benefit from the economic reopening. Detracting was a Singapore-listed wealth management services provider as it was subject to profit-taking after strong year-to-date performance. We believe that the company’s unique business model helps differentiate it from the competition and with its geographic expansion, clear catalysts may emerge. Market Outlook As the world navigates through towards a post-pandemic world, we continue to update with companies to understand future operating outlooks. While our philosophy and approach remains focused on identifying and understanding businesses and management teams with compelling domestic and/or niche global opportunities, ideally in oligopolistic market structures, we remain vigilant of mutating virus strains, vaccine uptake and are closely monitoring market valuations versus economic and operating realities. We continue to consider the fiscal and monetary policy environments and how government aid and its magnitude will impact the speed of the recovery and medium to longer-term inflationary considerations. Larger questions will be the role of materially expanded monetary bases and shifts in fiscal spending priorities. While we adjust to quickly evolving markets, our approach is and will continue to be rooted in operating fundamentals. All of that said, and in comparison to 2020, there are clear reasons for lower equity risk premia: including more stable global trade relations and the opportunity for governments to cooperate on combating climate change. For economically open northern Asian countries like South Korea and Taiwan, a reduction in trade frictions would be a benefit. In other parts of Asia, even assuming a modest change in stance, the increasing importance of ASEAN as a beneficiary of outsourcing activities will not be diminished. Based on the Fund's portfolio returns as at 31 May 2021 the Volatility Factor (VF) for the Fund is as indicated in the table above and are classified as in the table (source: Lipper). "Very High" includes Funds with VF that are above 17.190, "High" includes Funds with VF that are above 14.310 but not more than 17.190, "Moderate" includes Funds with VF that are above 10.755 but not more than 14.310, "Low" includes Funds with VF that are above 3.645 but not more than 10.755 and "Very Low" includes Funds with VF that are above 0.000 but not more than 3.645 (source:FiMM). The VF means there is a possibility for the Funds in generating an upside return or downside return around this VF. The Volatility Class (VC) is assigned by Lipper based on quintile ranks of VF for qualified Funds. VF and VC are subject to monthly revision or at any interval which may be prescribed by FIMM from time to time. The Fund's portfolio may have changed since this date and there is no guarantee that the Funds will continue to have the same VF or VC in the future. Presently, only Funds launched in the market for at least 36 months will display the VF and its VC. The above information has not been reviewed by the SC and is subject to the relevant warning, disclaimer, qualification or terms and conditions stated herein. Investors are advised to read and understand the contents of the Information Memorandum dated 11 February 2020 and all the respective Product Highlights Sheet(s) (collectively, the “Offering Documents”), obtainable at our offices or website, before investing. The Offering Documents have been registered with the Securities Commission Malaysia (SC), however the registration with the SC does not amount to nor indicate that the SC has recommended or endorsed the product. Where a unit split/distribution is declared, investors are advised that following the issue of additional units/distribution, the NAV per unit will be reduced from the pre-unit split NAV/cum-distribution NAV to post-unit split NAV/ex-distribution NAV; and where a unit split is declared, the value of your investment in the Fund’s denominated currency will remained unchanged after the distribution of the additional units. Past performances are not an indication of future performances. There are risks involved with investing in unit trust funds; wholesale funds and/or Private Retirement Schemes. Some of these risks associated with investments in unit trust funds; wholesale funds and/or Private Retirement Schemes are interest rate fluctuation risk, foreign exchange or currency risk, country risk, political risk, credit risk, non-compliance risk, counterparty risk, target fund manager risk, liquidity risk and interest rate risk. For further details on the risk profile of all the funds, please refer to the Risk Factors section in the Offering Documents. The price of units and income distribution may go down as well as up. Investors should compare and consider the fees, charges and costs involved. Investors are advised to conduct own risk assessment and consult the professional advisers if in doubt on the action to be taken.
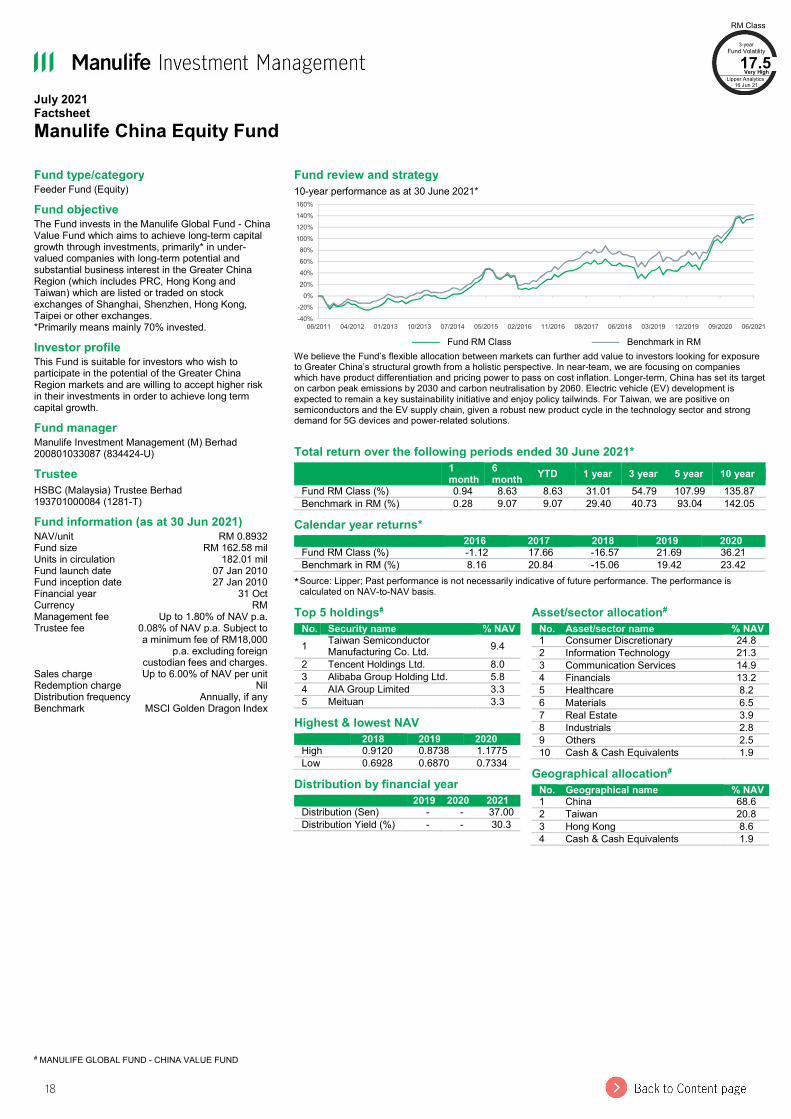
18
July 2021 Factsheet Manulife China Equity Fund
# MANULIFE GLOBAL FUND - CHINA VALUE FUND
Fund type/category Feeder Fund (Equity) Fund objective The Fund invests in the Manulife Global Fund - China Value Fund which aims to achieve long-term capital growth through investments, primarily* in under-valued companies with long-term potential and substantial business interest in the Greater China Region (which includes PRC, Hong Kong and Taiwan) which are listed or traded on stock exchanges of Shanghai, Shenzhen, Hong Kong, Taipei or other exchanges. *Primarily means mainly 70% invested. Investor profile This Fund is suitable for investors who wish to participate in the potential of the Greater China Region markets and are willing to accept higher risk in their investments in order to achieve long term capital growth. Fund manager Manulife Investment Management (M) Berhad 200801033087 (834424-U) Trustee HSBC (Malaysia) Trustee Berhad 193701000084 (1281-T) Fund information (as at 30 Jun 2021) NAV/unit RM 0.8932 Fund size RM 162.58 mil Units in circulation 182.01 mil Fund launch date 07 Jan 2010 Fund inception date 27 Jan 2010 Financial year 31 Oct Currency RM Management fee Up to 1.80% of NAV p.a. Trustee fee 0.08% of NAV p.a. Subject to
a minimum fee of RM18,000 p.a. excluding foreign
custodian fees and charges. Sales charge Up to 6.00% of NAV per unit Redemption charge Nil Distribution frequency Annually, if any Benchmark MSCI Golden Dragon Index
Fund review and strategy 10-year performance as at 30 June 2021*
——— Fund RM Class ——— Benchmark in RM
We believe the Fund’s flexible allocation between markets can further add value to investors looking for exposure to Greater China’s structural growth from a holistic perspective. In near-team, we are focusing on companies which have product differentiation and pricing power to pass on cost inflation. Longer-term, China has set its target on carbon peak emissions by 2030 and carbon neutralisation by 2060. Electric vehicle (EV) development is expected to remain a key sustainability initiative and enjoy policy tailwinds. For Taiwan, we are positive on semiconductors and the EV supply chain, given a robust new product cycle in the technology sector and strong demand for 5G devices and power-related solutions.
Total return over the following periods ended 30 June 2021*
1 month
6 month YTD 1 year 3 year 5 year 10 year
Fund RM Class (%) 0.94 8.63 8.63 31.01 54.79 107.99 135.87 Benchmark in RM (%) 0.28 9.07 9.07 29.40 40.73 93.04 142.05
Calendar year returns* 2016 2017 2018 2019 2020
Fund RM Class (%) -1.12 17.66 -16.57 21.69 36.21 Benchmark in RM (%) 8.16 20.84 -15.06 19.42 23.42
* Source: Lipper; Past performance is not necessarily indicative of future performance. The performance is calculated on NAV-to-NAV basis.
-40%
-20%
0%20%
40%
60%
80%100%
120%
140%160%
06/2011 04/2012 01/2013 10/2013 07/2014 05/2015 02/2016 11/2016 08/2017 06/2018 03/2019 12/2019 09/2020 06/2021
Top 5 holdings# No. Security name % NAV
1 Taiwan Semiconductor Manufacturing Co. Ltd. 9.4
2 Tencent Holdings Ltd. 8.0 3 Alibaba Group Holding Ltd. 5.8 4 AIA Group Limited 3.3 5 Meituan 3.3
Highest & lowest NAV 2018 2019 2020
High 0.9120 0.8738 1.1775 Low 0.6928 0.6870 0.7334
Distribution by financial year 2019 2020 2021
Distribution (Sen) - - 37.00 Distribution Yield (%) - - 30.3
Asset/sector allocation# No. Asset/sector name % NAV
1 Consumer Discretionary 24.8 2 Information Technology 21.3 3 Communication Services 14.9 4 Financials 13.2 5 Healthcare 8.2 6 Materials 6.5 7 Real Estate 3.9 8 Industrials 2.8 9 Others 2.5 10 Cash & Cash Equivalents 1.9
Geographical allocation# No. Geographical name % NAV
1 China 68.6 2 Taiwan 20.8 3 Hong Kong 8.6 4 Cash & Cash Equivalents 1.9
RM Class 3-year
Fund Volatility 17.5
Very High Lipper Analytics
16 Jun 21
19
July 2021 Factsheet Manulife China Equity Fund Market Review Chinese equities were largely flat for the month. Offshore Chinese equities moved marginally higher while onshore China A-shares retreated. In terms of style, growth-related China A-shares represented by ChiNext and STAR50 indices regained momentum and outperformed the broader A-shares market in the month. Capital flow wise, the Northbound Stock Connect Programme continued to register net inflows for the month albeit at a slower pace. Foreign ownership in A-shares has risen to an all-time high of 4.5%, up from 3.6% at end of 2019, and tripled the 1.5% in 2014 when Stock Connect was inaugurated. On the economic front, China’s manufacturing Purchasing Managers’ Index edged down to 50.9 from 51.0 in May. China Producer Price Index (PPI) reached 9.0% in May. Yet spillover effects to the Consumer Price Index (CPI) stayed modest with May CPI standing at 1.3%. While the weak PPI-to-CPI pass-through relieved concerns on inflationary pressure, margin pressure in the mid-stream manufacturing segment continued to build-up. Regulatory scrutiny on internet and e-commerce remains as an overhang of the mega-cap names in the related sectors. Hong Kong equities moved lower for the month despite economic activities continuing to pick-up. Taiwan’s equity market moved marginally higher as a partial relief from the drawdown in May where a spike in Covid cases was reported. Feeder Fund Review In June, the Feeder Fund posted positive return and outperformed the benchmark by 0.66%. Stock selection in information technology and real estate added the most value while consumer discretionary offset part of the gains. The Fund’s China A-shares holdings continued to contribute positively. Strategy-wise, we have selectively added exposure in semiconductor companies in Taiwan. Regarding individual holdings, the Fund’s exposure in an auto component maker contributed the most to performance. The company focuses on auto safety and assisted driving systems. The stock price reacted positively to its plans to launch autonomous driving products with two leading domestic smart driving technology-related companies. Another key contributor was a semiconductor company which has benefited from the supply tightness and uptrend in average selling prices. The company has also secured extra capacity from its foundry partners and is expected to benefit from robust demand in the coming quarters. On the detractor side, the Fund’s exposure in two education groups detracted from performance. The Fund’s position in a media and art training group announced an acquisition of an independent college specialised in professional sports training. As sports and Olympic-centric type of private training is less common, market has discounted the revenue growth and breakeven point of the acquisition and the stock reacted negatively to the news. Another detractor was an after-school tutoring company which continue to suffer from regulatory headwinds. The current valuation is undemanding, and we believe the company can benefit should the sector consolidate. Market Outlook In the second half of 2021, we expect the performance in greater China equities to be more balanced across sectors and styles. We expect market volatility may stay in the near-term and are mindful of policy risks. We continue to construct a balanced portfolio in terms of growth themes and share type exposure. We believe the Fund’s flexible allocation between markets can further add value to investors looking for exposure to Greater China’s structural growth from a holistic perspective. In the near team, we are focusing on companies which have product differentiation and pricing power to pass on cost inflation. For consumption upgrades, we remain positive on services and lifestyle-related opportunities which enjoy inelastic demand. Property management, tertiary education and vocational training are some examples. For innovation, we expect the current manufacturing capital expenditure upcycle to continue for the next few quarters and we are positive on industrial automation. Strategic priority segments such as modern machinery, robotics, and high-technology semiconductor equipment should enjoy policy tailwinds and research and development support. We also see opportunities in growth-oriented commodities used in battery storage and renewable energy that can bode well under the substantiality initiatives of China. Moreover, we anticipate more home-grown innovations in biotechnology to start bearing fruit. The Fund is well-positioned to capture quality biotechnology companies with strong pipelines and the research and development value chain which can extract growth from the segment. Longer-term, China has set its target on carbon peak emissions by 2030 and carbon neutralisation by 2060. Electric vehicle (EV) development is expected to remain a key sustainability initiative and enjoy policy tailwinds. China already has the largest sales volume of EVs globally and accounts for more than half of the world’s EV battery manufacturing. We see a rich opportunity set for the entire EV and smart car value chain, thanks to robust domestic demand and the local industry’s increasing presence in the global EV supply chain. For Taiwan, we are positive on semiconductors and the electric vehicle supply chain, given a robust new product cycle in the technology sector and strong demand for 5G devices and power-related solutions. Based on the Fund's portfolio returns as at 31 May 2021 the Volatility Factor (VF) for the Fund is as indicated in the table above and are classified as in the table (source: Lipper). "Very High" includes Funds with VF that are above 17.190, "High" includes Funds with VF that are above 14.310 but not more than 17.190, "Moderate" includes Funds with VF that are above 10.755 but not more than 14.310, "Low" includes Funds with VF that are above 3.645 but not more than 10.755 and "Very Low" includes Funds with VF that are above 0.000 but not more than 3.645 (source:FiMM). The VF means there is a possibility for the Funds in generating an upside return or downside return around this VF. The Volatility Class (VC) is assigned by Lipper based on quintile ranks of VF for qualified Funds. VF and VC are subject to monthly revision or at any interval which may be prescribed by FIMM from time to time. The Fund's portfolio may have changed since this date and there is no guarantee that the Funds will continue to have the same VF or VC in the future. Presently, only Funds launched in the market for at least 36 months will display the VF and its VC. The above information has not been reviewed by the SC and is subject to the relevant warning, disclaimer, qualification or terms and conditions stated herein. Investors are advised to read and understand the contents of the Master Prospectus dated 10 August 2020 and its First Supplemental Master Prospectus dated 10 August 2020 and its Second Supplemental Master Prospectus dated 27 January 2021 and its Third Supplemental Master Prospectus dated 5 April 2021 and all the respective Product Highlights Sheet(s) (collectively, the “Offering Documents”), obtainable at our offices or website, before investing. The Offering Documents have been registered with the Securities Commission Malaysia (SC), however the registration with the SC does not amount to nor indicate that the SC has recommended or endorsed the product. Where a unit split/distribution is declared, investors are advised that following the issue of additional units/distribution, the NAV per unit will be reduced from the pre-unit split NAV/cum-distribution NAV to post-unit split NAV/ex-distribution NAV; and where a unit split is declared, the value of your investment in the Fund’s denominated currency will remained unchanged after the distribution of the additional units. Past performances are not an indication of future performances. There are risks involved with investing in unit trust funds; wholesale funds and/or Private Retirement Schemes. Some of these risks associated with investments in unit trust funds; wholesale funds and/or Private Retirement Schemes are interest rate fluctuation risk, foreign exchange or currency risk, country risk, political risk, credit risk, non-compliance risk, counterparty risk, target fund manager risk, liquidity risk and interest rate risk. For further details on the risk profile of all the funds, please refer to the Risk Factors section in the Offering Documents. The price of units and income distribution may go down as well as up. Investors should compare and consider the fees, charges and costs involved. Investors are advised to conduct own risk assessment and consult the professional advisers if in doubt on the action to be taken.

20
July 2021 Factsheet Manulife Dragon Growth Fund
# MANULIFE GLOBAL FUND - DRAGON GROWTH FUND
Fund type/category Wholesale Fund (Feeder Fund) Fund objective The Fund seeks to achieve capital appreciation over the medium- to long-term period. Investor profile The Fund is suitable for Sophisticated Investors who seek capital appreciation, are willing to accept a higher level of risk and have a medium-to long-term investment horizon. Fund manager Manulife Investment Management (M) Berhad 200801033087 (834424-U) Trustee HSBC (Malaysia) Trustee Berhad 193701000084 (1281-T) Fund information (as at 30 Jun 2021) NAV/unit (USD Class) USD 1.7576 NAV/unit (RM-Hedged Class)
RM 1.8082 Fund size USD 128.10 mil Units in circulation 271.74 mil Fund launch date 03 Nov 2016 Fund inception date 16 Feb 2017 Financial year 31 Dec Currency USD Management fee Up to 1.80% of NAV p.a. Trustee fee 0.04% of NAV p.a. excluding
foreign custodian fees and charges
Sales charge Up to 5.50% of NAV per unit Redemption charge Nil Distribution frequency Incidental, if any Benchmark MSCI Zhong Hua Index
Fund review and strategy Since inception performance as at 30 June 2021*
——— Fund USD Class ——— Benchmark in USD
We believe the Fund’s flexible allocation between China and Hong Kong equities, and across onshore and offshore exposures can further add value to investors looking for exposure to China’s structural growth from a holistic perspective. We are focusing on companies which have product differentiation and pricing power to pass on cost inflation. Longer-term, China has set its target on carbon peak emissions by 2030 and carbon neutralisation by 2060. Electric vehicle (EV) development is expected to remain a key sustainability initiative and enjoy policy tailwinds. We see a rich opportunity set for the entire EV and smart car value chain.
Total return over the following periods ended 30 June 2021*
1 month
6 month YTD 1 year 3 year 5 year Since
inception Fund USD Class (%) 0.17 3.47 3.47 31.82 44.15 - 109.84 Benchmark in USD (%) -0.16 3.07 3.07 27.71 32.92 - 75.22 Fund RM-Hedged Class (%) 0.27 3.94 3.94 32.69 44.96 - 116.39 Benchmark in USD (%) -0.16 3.07 3.07 27.71 32.92 - 87.60
Calendar year returns* 2016 2017 2018 2019 2020
Fund USD Class (%) - 42.40 -15.89 20.59 40.41 Benchmark in USD (%) - 34.39 -16.25 20.71 25.13 Fund RM-Hedged Class (%) -3.40 50.62 -15.50 20.66 40.34 Benchmark in USD (%) -3.67 49.35 -16.25 20.71 25.13
* Source: Lipper; Past performance is not necessarily indicative of future performance. The performance is calculated on NAV-to-NAV basis.
-20%
0%
20%
40%
60%
80%
100%
120%
02/2017 07/2017 12/2017 04/2018 09/2018 02/2019 07/2019 11/2019 04/2020 09/2020 02/2021 06/2021
Top 5 holdings# No. Security name % NAV
1 Tencent Holdings Ltd. 6.8 2 Alibaba Group Holding Ltd. 5.8 3 AIA Group Limited 4.6 4 Meituan 4.0 5 Hong Kong Exchanges &
Clearing Ltd. 3.0 Highest & lowest NAV 2018 2019 2020
High 1.5936 1.4483 2.0280 Low 1.1574 1.1493 1.1550
Distribution by financial year 2019 2020 2021
Distribution (Sen) - - 36.50 Distribution Yield (%) - - 16.4
Asset/sector allocation# No. Asset/sector name % NAV
1 Consumer Discretionary 27.5 2 Communication Services 16.0 3 Financials 13.6 4 Healthcare 11.2 5 Materials 8.0 6 Real Estate 6.4 7 Information Technology 6.3 8 Industrials 4.3 9 Consumer Staples 3.4 10 Cash & Cash Equivalents 3.3
Geographical allocation# No. Geographical name % NAV
1 China 83.4 2 Hong Kong 13.3 3 Cash & Cash Equivalents 3.3
USD Class 3-year
Fund Volatility 18.4
Very High Lipper Analytics
16 Jun 21
RM-Hedged Class 3-year
Fund Volatility 21.0
Very High Lipper Analytics
16 Jun 21
21
July 2021 Factsheet Manulife Dragon Growth Fund Market Review Chinese equities were largely flat for the month. Offshore Chinese equities moved marginally higher while onshore China A-shares retreated. In terms of style, growth-related China A-shares represented by the ChiNext and STAR 50 indices regained momentum and outperformed the broader A-shares market in the month. Capital flow wise, the Northbound Stock Connect Programme continued to register net inflows for the month albeit at a slower pace. Foreign ownership in A-shares has risen to an all-time high of 4.5%, up from 3.6% at the end of 2019, and tripled the 1.5% in 2014 when Stock Connect was inaugurated. On the economic front, China’s manufacturing Purchasing Manufacturers’ Index edged down to 50.9 from 51.0 in May. China Producer Price Index (PPI) reached 9.0% in May. Yet spillover effects to the Consumer Price Index remained modest with May CPI standing at 1.3%. While the weak PPI-to-CPI pass-through relieved concerns on inflationary pressure, margin pressure in the mid-stream manufacturing segment continued to build-up. Regulatory scrutiny on internet and e-commerce remains as an overhang of the mega-cap names in the related sectors. Hong Kong equities moved lower for the month despite economic activities continuing to pick-up. Feeder Fund Review In June, the Feeder Fund posted a) 0.17% versus the benchmark return of -0.16% for its USD class; and b) 0.27% versus the benchmark return of -0.16% for its RM-Hedged class. Stock selection in information technology and real estate added the most value while consumer discretionary offset part of the gains. The Fund’s China A-shares holdings continued to contribute positively. Strategy-wise, we have selectively added exposure in healthcare companies with niche positioning. Regarding individual holdings, the Fund’s exposure in an auto component maker contributed the most to performance. The company focuses on auto safety and assisted driving systems. The stock price reacted positively to its plans to launch autonomous driving products with two leading domestic smart driving technology-related companies. Another key contributor was a semiconductor company which has benefited from the supply tightness and uptrend in average selling prices. The company has also secured extra capacity from its foundry partners and is expected to benefit from robust demand in the coming quarters. On the detractor side, the Fund’s exposure in two education groups detracted from performance. The Fund’s position in a media and art training group announced an acquisition of an independent college specialised in professional sports training. As sports and Olympic-centric type of private training is less common, the market has discounted the revenue growth and breakeven point of the acquisition and the stock reacted negatively to the news. Another detractor was an after-school tutoring company which continues to suffer from regulatory headwinds. The current valuation is undemanding, and we believe the company can benefit should the sector consolidate. Market Outlook In the second half of 2021, we expect China’s equity performance to be more balanced across sectors and styles. We expect market volatility may remain in the near-term and are mindful of the policy risks. We continue to construct a balanced portfolio in terms of growth themes and sector exposure. We believe the Fund’s flexible allocation between China and Hong Kong equities, and across onshore and offshore exposures can further add value to investors looking for exposure to China’s structural growth from a holistic perspective. In the near team, we are focusing on companies that have product differentiation and pricing power to pass on cost inflation. For consumption upgrades, we remain positive on services and lifestyle-related opportunities which enjoy inelastic demand. Property management and tertiary education and vocational training are some examples. For innovation, we expect the current manufacturing capital expenditure upcycle to continue for the next few quarters and are positive on industrial automation. Strategic priority segments such as modern machinery, robotics, and high-technology semiconductor equipment are expected to enjoy policy tailwinds and research and development support. We also see opportunities in growth-oriented commodities used in battery storage and renewable energy that can bode well under the substantiality initiatives of China. Moreover, we anticipate more home-grown innovations in biotechnology to start bearing fruit. The Fund is well-positioned to capture quality biotechnology companies with strong pipelines and the research and development value chain which can extract growth from the segment. Longer-term, China has set its target on carbon peak emissions by 2030 and carbon neutralisation by 2060. Electric vehicle (EV) development is expected to remain a key sustainability initiative and enjoy policy tailwinds. China already has the largest sales volume globally in EVs and accounts for more than half of the world’s EV battery manufacturing. We see a rich opportunity set for the entire EV and smart car value chain, thanks to robust domestic demand and the local industry’s increasing presence in the global EV supply chain. Based on the Fund's portfolio returns as at 31 May 2021 the Volatility Factor (VF) for the Fund is as indicated in the table above and are classified as in the table (source: Lipper). "Very High" includes Funds with VF that are above 17.190, "High" includes Funds with VF that are above 14.310 but not more than 17.190, "Moderate" includes Funds with VF that are above 10.755 but not more than 14.310, "Low" includes Funds with VF that are above 3.645 but not more than 10.755 and "Very Low" includes Funds with VF that are above 0.000 but not more than 3.645 (source:FiMM). The VF means there is a possibility for the Funds in generating an upside return or downside return around this VF. The Volatility Class (VC) is assigned by Lipper based on quintile ranks of VF for qualified Funds. VF and VC are subject to monthly revision or at any interval which may be prescribed by FIMM from time to time. The Fund's portfolio may have changed since this date and there is no guarantee that the Funds will continue to have the same VF or VC in the future. Presently, only Funds launched in the market for at least 36 months will display the VF and its VC. The above information has not been reviewed by the SC and is subject to the relevant warning, disclaimer, qualification or terms and conditions stated herein. Investors are advised to read and understand the contents of the Information Memorandum dated 11 February 2020 and all the respective Product Highlights Sheet(s) (collectively, the “Offering Documents”), obtainable at our offices or website, before investing. The Offering Documents have been registered with the Securities Commission Malaysia (SC), however the registration with the SC does not amount to nor indicate that the SC has recommended or endorsed the product. Where a unit split/distribution is declared, investors are advised that following the issue of additional units/distribution, the NAV per unit will be reduced from the pre-unit split NAV/cum-distribution NAV to post-unit split NAV/ex-distribution NAV; and where a unit split is declared, the value of your investment in the Fund’s denominated currency will remained unchanged after the distribution of the additional units. Past performances are not an indication of future performances. There are risks involved with investing in unit trust funds; wholesale funds and/or Private Retirement Schemes. Some of these risks associated with investments in unit trust funds; wholesale funds and/or Private Retirement Schemes are interest rate fluctuation risk, foreign exchange or currency risk, country risk, political risk, credit risk, non-compliance risk, counterparty risk, target fund manager risk, liquidity risk and interest rate risk. For further details on the risk profile of all the funds, please refer to the Risk Factors section in the Offering Documents. The price of units and income distribution may go down as well as up. Investors should compare and consider the fees, charges and costs involved. Investors are advised to conduct own risk assessment and consult the professional advisers if in doubt on the action to be taken.
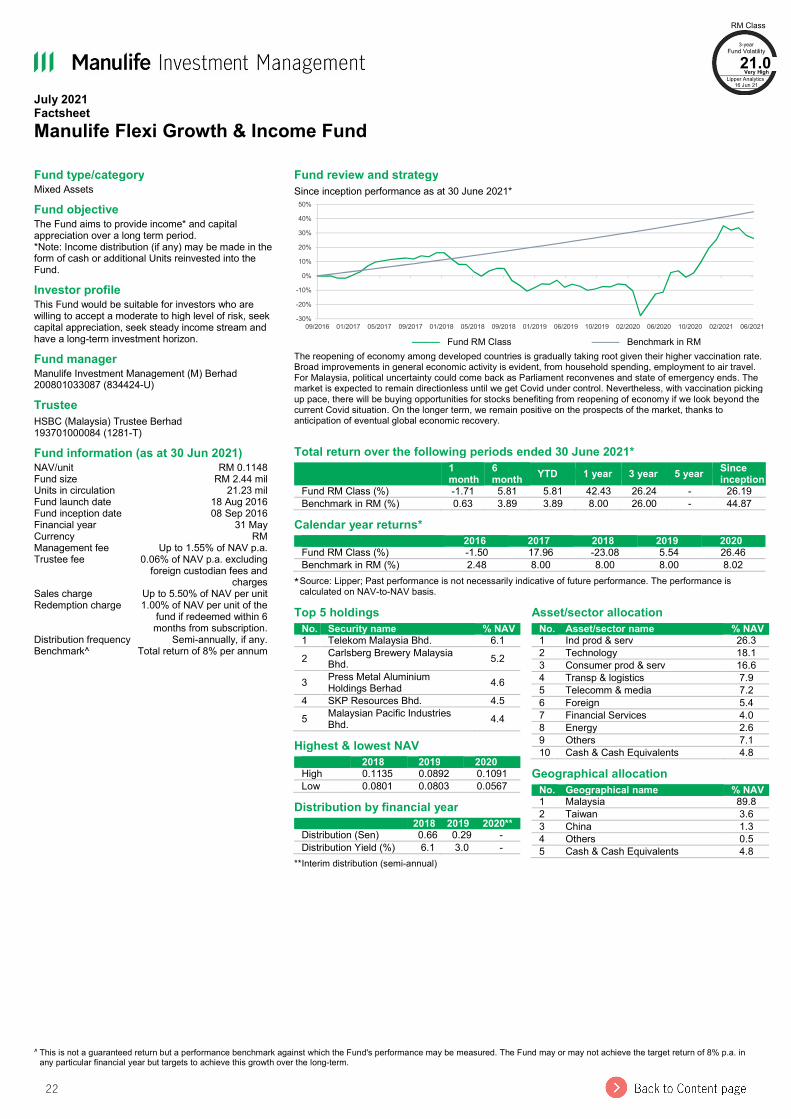
22
July 2021 Factsheet Manulife Flexi Growth & Income Fund
^ This is not a guaranteed return but a performance benchmark against which the Fund's performance may be measured. The Fund may or may not achieve the target return of 8% p.a. in any particular financial year but targets to achieve this growth over the long-term.
Fund type/category Mixed Assets Fund objective The Fund aims to provide income* and capital appreciation over a long term period. *Note: Income distribution (if any) may be made in the form of cash or additional Units reinvested into the Fund. Investor profile This Fund would be suitable for investors who are willing to accept a moderate to high level of risk, seek capital appreciation, seek steady income stream and have a long-term investment horizon. Fund manager Manulife Investment Management (M) Berhad 200801033087 (834424-U) Trustee HSBC (Malaysia) Trustee Berhad 193701000084 (1281-T) Fund information (as at 30 Jun 2021) NAV/unit RM 0.1148 Fund size RM 2.44 mil Units in circulation 21.23 mil Fund launch date 18 Aug 2016 Fund inception date 08 Sep 2016 Financial year 31 May Currency RM Management fee Up to 1.55% of NAV p.a. Trustee fee 0.06% of NAV p.a. excluding
foreign custodian fees and charges
Sales charge Up to 5.50% of NAV per unit Redemption charge 1.00% of NAV per unit of the
fund if redeemed within 6 months from subscription.
Distribution frequency Semi-annually, if any. Benchmark^ Total return of 8% per annum
Fund review and strategy Since inception performance as at 30 June 2021*
——— Fund RM Class ——— Benchmark in RM
The reopening of economy among developed countries is gradually taking root given their higher vaccination rate. Broad improvements in general economic activity is evident, from household spending, employment to air travel. For Malaysia, political uncertainty could come back as Parliament reconvenes and state of emergency ends. The market is expected to remain directionless until we get Covid under control. Nevertheless, with vaccination picking up pace, there will be buying opportunities for stocks benefiting from reopening of economy if we look beyond the current Covid situation. On the longer term, we remain positive on the prospects of the market, thanks to anticipation of eventual global economic recovery.
Total return over the following periods ended 30 June 2021*
1 month
6 month YTD 1 year 3 year 5 year Since
inception Fund RM Class (%) -1.71 5.81 5.81 42.43 26.24 - 26.19 Benchmark in RM (%) 0.63 3.89 3.89 8.00 26.00 - 44.87
Calendar year returns* 2016 2017 2018 2019 2020
Fund RM Class (%) -1.50 17.96 -23.08 5.54 26.46 Benchmark in RM (%) 2.48 8.00 8.00 8.00 8.02
* Source: Lipper; Past performance is not necessarily indicative of future performance. The performance is calculated on NAV-to-NAV basis.
-30%
-20%
-10%
0%
10%
20%
30%
40%
50%
09/2016 01/2017 05/2017 09/2017 01/2018 05/2018 09/2018 01/2019 06/2019 10/2019 02/2020 06/2020 10/2020 02/2021 06/2021
Top 5 holdings No. Security name % NAV
1 Telekom Malaysia Bhd. 6.1 2 Carlsberg Brewery Malaysia
Bhd. 5.2
3 Press Metal Aluminium Holdings Berhad 4.6
4 SKP Resources Bhd. 4.5 5 Malaysian Pacific Industries
Bhd. 4.4 Highest & lowest NAV 2018 2019 2020
High 0.1135 0.0892 0.1091 Low 0.0801 0.0803 0.0567
Distribution by financial year 2018 2019 2020**
Distribution (Sen) 0.66 0.29 - Distribution Yield (%) 6.1 3.0 -
** Interim distribution (semi-annual)
Asset/sector allocation No. Asset/sector name % NAV
1 Ind prod & serv 26.3 2 Technology 18.1 3 Consumer prod & serv 16.6 4 Transp & logistics 7.9 5 Telecomm & media 7.2 6 Foreign 5.4 7 Financial Services 4.0 8 Energy 2.6 9 Others 7.1 10 Cash & Cash Equivalents 4.8
Geographical allocation No. Geographical name % NAV
1 Malaysia 89.8 2 Taiwan 3.6 3 China 1.3 4 Others 0.5 5 Cash & Cash Equivalents 4.8
RM Class 3-year
Fund Volatility 21.0
Very High Lipper Analytics
16 Jun 21
23
July 2021 Factsheet Manulife Flexi Growth & Income Fund Market Review For the month of June, equity markets were relatively mixed. Developed economies’ equities rose as vaccination campaigns continued to accelerate, especially in European Union, which is now catching up to the pace of the US and UK. Governments in most developed markets have continued to ease Covid-related mobility restrictions and many indicators are pointing towards a strong economic rebound. Nevertheless, the reopening of economies and the quick rebound in activities have fuelled inflation in some countries. While the US Federal Reserve continues to see the higher inflation as transitory, it has become slightly hawkish, admitting that tapering is being discussed. The Fed (based on dot plot projections) now expects two rate hikes in 2023, up from no rate hikes just three months ago. As for emerging economies, most continued to lag on the vaccination front. In addition, the spread of the Delta variant is now a potential concern, as it could slow down the full reopening of economies. The highly contagious Delta variant, first detected in India in December 2021, has spread to about 100 countries and the World Health Organisation warned recently that it could soon become the dominant form of the virus. Fortunately, daily Covid-19 cases remain very low in China and it seem to have peaked in India. For Malaysia, the FBM KLCI Index fell by 3.2% m/m to close at a YTD low of 1,532.6 points. Market sentiment was hit by the persistently high new Covid-19 cases despite full MCO. On top of this, political uncertainty is also rising as the King had announced that Parliament should reconvene as soon as possible. Both average daily trading volume and values fell to the lowest levels since April 2020, with lacklustre interest from market participants. The best performing sectors in the month were transport, REIT and finance, while the worst performing sectors were healthcare, plantation and energy. FBM KLCI Index outperformed the FBM Small Cap Index (-3.6% m/m) due to positive gains in the banking sector, but underperformed the FBM100 Index (-2.9% m/m). Relative to the region, the FBM KLCI Index underperformed the MSCI Asia ex-Japan Index, which fell by 0.4% during the month. The top performers were Vietnam (6.1%), Philippines (4.1%) and Taiwan (4.0%). Meanwhile, Malaysia (-3.2%) was the worst performer. Fund Review The Fund fell by 1.71% in June 2021, underperforming the benchmark by 234bps. The underperformance was attributed to our positions in the industrial product, consumer, technology and financial services sectors. Meanwhile, positions in the transportation, construction and energy sectors offset some of the losses. Market Outlook The reopening of economy among developed countries is gradually taking root given their higher vaccination rate relative to that of emerging markets. Broad improvements in general economic activity is evident, from household spending, employment to air travel. In the US, the Federal Reserve has signalled that the first interest rate hike will come in 2023, earlier than previously forecast, as it raised the country’s GDP growth and inflation expectations. The key risk to global economic recovery would be a resurgent in Covid cases caused by new virus variants, though vaccines seem to be working against them thus far. For Malaysia, as the number of daily new cases remains stubbornly high, the government has imposed enhanced MCO in large parts of the Klang Valley. Meanwhile, political uncertainty could come back as Parliament reconvenes and state of emergency ends. The market is expected to remain directionless until we get Covid under control. Nevertheless, with vaccination picking up pace, there will be buying opportunities for stocks benefiting from reopening of economy if we look beyond the current Covid situation. On the longer term, we remain positive on the prospects of the market, thanks to anticipation of eventual global economic recovery. We believe the key structural investment themes that we like, such as deglobalisation, digitalisation and clean energy, remain intact and will continue to anchor the basis of our investment decisions. In the current investment climate, we believe stocks selection will be key to investment performance. Based on the Fund's portfolio returns as at 31 May 2021 the Volatility Factor (VF) for the Fund is as indicated in the table above and are classified as in the table (source: Lipper). "Very High" includes Funds with VF that are above 17.190, "High" includes Funds with VF that are above 14.310 but not more than 17.190, "Moderate" includes Funds with VF that are above 10.755 but not more than 14.310, "Low" includes Funds with VF that are above 3.645 but not more than 10.755 and "Very Low" includes Funds with VF that are above 0.000 but not more than 3.645 (source:FiMM). The VF means there is a possibility for the Funds in generating an upside return or downside return around this VF. The Volatility Class (VC) is assigned by Lipper based on quintile ranks of VF for qualified Funds. VF and VC are subject to monthly revision or at any interval which may be prescribed by FIMM from time to time. The Fund's portfolio may have changed since this date and there is no guarantee that the Funds will continue to have the same VF or VC in the future. Presently, only Funds launched in the market for at least 36 months will display the VF and its VC. The above information has not been reviewed by the SC and is subject to the relevant warning, disclaimer, qualification or terms and conditions stated herein. Investors are advised to read and understand the contents of the Master Prospectus dated 10 August 2020 and its First Supplemental Master Prospectus dated 10 August 2020 and its Second Supplemental Master Prospectus dated 27 January 2021 and its Third Supplemental Master Prospectus dated 5 April 2021 and all the respective Product Highlights Sheet(s) (collectively, the “Offering Documents”), obtainable at our offices or website, before investing. The Offering Documents have been registered with the Securities Commission Malaysia (SC), however the registration with the SC does not amount to nor indicate that the SC has recommended or endorsed the product. Where a unit split/distribution is declared, investors are advised that following the issue of additional units/distribution, the NAV per unit will be reduced from the pre-unit split NAV/cum-distribution NAV to post-unit split NAV/ex-distribution NAV; and where a unit split is declared, the value of your investment in the Fund’s denominated currency will remained unchanged after the distribution of the additional units. Past performances are not an indication of future performances. There are risks involved with investing in unit trust funds; wholesale funds and/or Private Retirement Schemes. Some of these risks associated with investments in unit trust funds; wholesale funds and/or Private Retirement Schemes are interest rate fluctuation risk, foreign exchange or currency risk, country risk, political risk, credit risk, non-compliance risk, counterparty risk, target fund manager risk, liquidity risk and interest rate risk. For further details on the risk profile of all the funds, please refer to the Risk Factors section in the Offering Documents. The price of units and income distribution may go down as well as up. Investors should compare and consider the fees, charges and costs involved. Investors are advised to conduct own risk assessment and consult the professional advisers if in doubt on the action to be taken.
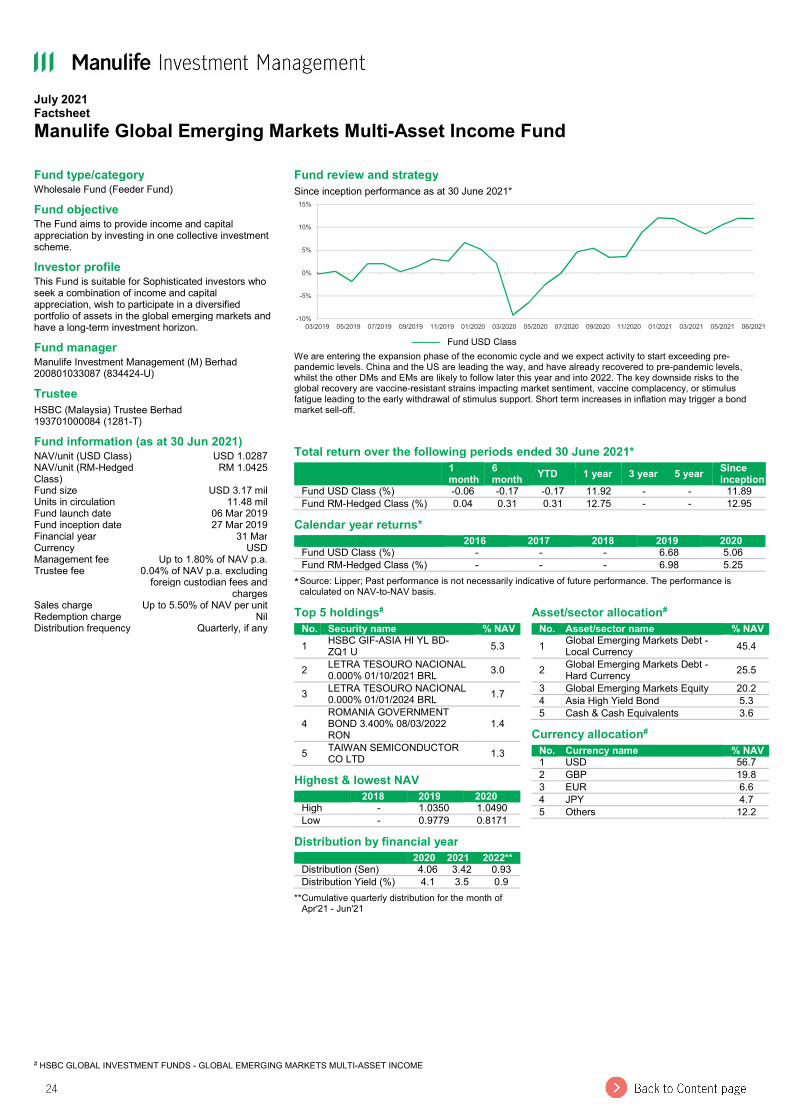
24
July 2021 Factsheet Manulife Global Emerging Markets Multi-Asset Income Fund
# HSBC GLOBAL INVESTMENT FUNDS - GLOBAL EMERGING MARKETS MULTI-ASSET INCOME
Fund type/category Wholesale Fund (Feeder Fund) Fund objective The Fund aims to provide income and capital appreciation by investing in one collective investment scheme. Investor profile This Fund is suitable for Sophisticated investors who seek a combination of income and capital appreciation, wish to participate in a diversified portfolio of assets in the global emerging markets and have a long-term investment horizon. Fund manager Manulife Investment Management (M) Berhad 200801033087 (834424-U) Trustee HSBC (Malaysia) Trustee Berhad 193701000084 (1281-T) Fund information (as at 30 Jun 2021) NAV/unit (USD Class) USD 1.0287 NAV/unit (RM-Hedged Class)
RM 1.0425 Fund size USD 3.17 mil Units in circulation 11.48 mil Fund launch date 06 Mar 2019 Fund inception date 27 Mar 2019 Financial year 31 Mar Currency USD Management fee Up to 1.80% of NAV p.a. Trustee fee 0.04% of NAV p.a. excluding
foreign custodian fees and charges
Sales charge Up to 5.50% of NAV per unit Redemption charge Nil Distribution frequency Quarterly, if any
Fund review and strategy Since inception performance as at 30 June 2021*
——— Fund USD Class
We are entering the expansion phase of the economic cycle and we expect activity to start exceeding pre-pandemic levels. China and the US are leading the way, and have already recovered to pre-pandemic levels, whilst the other DMs and EMs are likely to follow later this year and into 2022. The key downside risks to the global recovery are vaccine-resistant strains impacting market sentiment, vaccine complacency, or stimulus fatigue leading to the early withdrawal of stimulus support. Short term increases in inflation may trigger a bond market sell-off.
Total return over the following periods ended 30 June 2021*
1 month
6 month YTD 1 year 3 year 5 year Since
inception Fund USD Class (%) -0.06 -0.17 -0.17 11.92 - - 11.89 Fund RM-Hedged Class (%) 0.04 0.31 0.31 12.75 - - 12.95
Calendar year returns* 2016 2017 2018 2019 2020
Fund USD Class (%) - - - 6.68 5.06 Fund RM-Hedged Class (%) - - - 6.98 5.25
* Source: Lipper; Past performance is not necessarily indicative of future performance. The performance is calculated on NAV-to-NAV basis.
-10%
-5%
0%
5%
10%
15%
03/2019 05/2019 07/2019 09/2019 11/2019 01/2020 03/2020 05/2020 07/2020 09/2020 11/2020 01/2021 03/2021 05/2021 06/2021
Top 5 holdings# No. Security name % NAV
1 HSBC GIF-ASIA HI YL BD-ZQ1 U 5.3
2 LETRA TESOURO NACIONAL 0.000% 01/10/2021 BRL 3.0
3 LETRA TESOURO NACIONAL 0.000% 01/01/2024 BRL 1.7
4 ROMANIA GOVERNMENT BOND 3.400% 08/03/2022 RON
1.4
5 TAIWAN SEMICONDUCTOR CO LTD 1.3
Highest & lowest NAV 2018 2019 2020
High - 1.0350 1.0490 Low - 0.9779 0.8171
Distribution by financial year 2020 2021 2022**
Distribution (Sen) 4.06 3.42 0.93 Distribution Yield (%) 4.1 3.5 0.9
** Cumulative quarterly distribution for the month of Apr'21 - Jun'21
Asset/sector allocation# No. Asset/sector name % NAV
1 Global Emerging Markets Debt - Local Currency 45.4
2 Global Emerging Markets Debt - Hard Currency 25.5
3 Global Emerging Markets Equity 20.2 4 Asia High Yield Bond 5.3 5 Cash & Cash Equivalents 3.6
Currency allocation# No. Currency name % NAV
1 USD 56.7 2 GBP 19.8 3 EUR 6.6 4 JPY 4.7 5 Others 12.2
25
July 2021 Factsheet Manulife Global Emerging Markets Multi-Asset Income Fund Market Review Emerging markets experienced mixed performance over the month with equity and hard currency bonds delivering positive performance, while EMD in local currency and Asia High Yield delivered negative returns. Feeder Fund Review In June, the Feeder Fund posted a) -0.06% for its USD class; and b) 0.04% for its RM-Hedged class. The Fund posted flat returns on the month, reflecting the mixed performance in equity, EMD in local currency EMD hard currency and Asia High Yield Bond asset prices. The fund’s tactical positioning was marginally negative in the month of June 2021, however, remains firmly in positive territory in 2Q 2021. Market Outlook We are entering the expansion phase of the economic cycle and we expect activity to start exceeding pre-pandemic levels. China and the US are leading the way, and have already recovered to pre-pandemic levels, whilst the other DMs and EMs are likely to follow later this year and into 2022. The recovery in the US has been boosted by supportive fiscal policy while Europe is likely to perform well in the coming quarters as its vaccine rollout is now back on track. On the other hand, Emerging Markets have started to take control of the spread of the virus, suggesting stronger growth going forward. Lastly, China has tightened credit conditions in order to tilt their economy away from growth and towards financial stability. In the short-term, inflation numbers in developed markets are likely to remain elevated given energy price rises, supply chain disruption, and base effects. However, the longer term inflation outlook still remains muted. Importantly, the Fed’s policy framework implies a willingness to look through these short term CPI increases and delay interest rate rises. On the other hand, emerging market policy makers face more significant constraints, and we see some EMs central banks starting to tighten monetary policy. The key downside risks to the global recovery are vaccine-resistant strains impacting market sentiment, vaccine complacency, or stimulus fatigue leading to the early withdrawal of stimulus support. Short term increases in inflation may trigger a bond market sell-off. The above information has not been reviewed by the SC and is subject to the relevant warning, disclaimer, qualification or terms and conditions stated herein. Investors are advised to read and understand the contents of the Information Memorandum dated 11 February 2020 and all the respective Product Highlights Sheet(s) (collectively, the “Offering Documents”), obtainable at our offices or website, before investing. The Offering Documents have been registered with the Securities Commission Malaysia (SC), however the registration with the SC does not amount to nor indicate that the SC has recommended or endorsed the product. Where a unit split/distribution is declared, investors are advised that following the issue of additional units/distribution, the NAV per unit will be reduced from the pre-unit split NAV/cum-distribution NAV to post-unit split NAV/ex-distribution NAV; and where a unit split is declared, the value of your investment in the Fund’s denominated currency will remained unchanged after the distribution of the additional units. Past performances are not an indication of future performances. There are risks involved with investing in unit trust funds; wholesale funds and/or Private Retirement Schemes. Some of these risks associated with investments in unit trust funds; wholesale funds and/or Private Retirement Schemes are interest rate fluctuation risk, foreign exchange or currency risk, country risk, political risk, credit risk, non-compliance risk, counterparty risk, target fund manager risk, liquidity risk and interest rate risk. For further details on the risk profile of all the funds, please refer to the Risk Factors section in the Offering Documents. The price of units and income distribution may go down as well as up. Investors should compare and consider the fees, charges and costs involved. Investors are advised to conduct own risk assessment and consult the professional advisers if in doubt on the action to be taken.
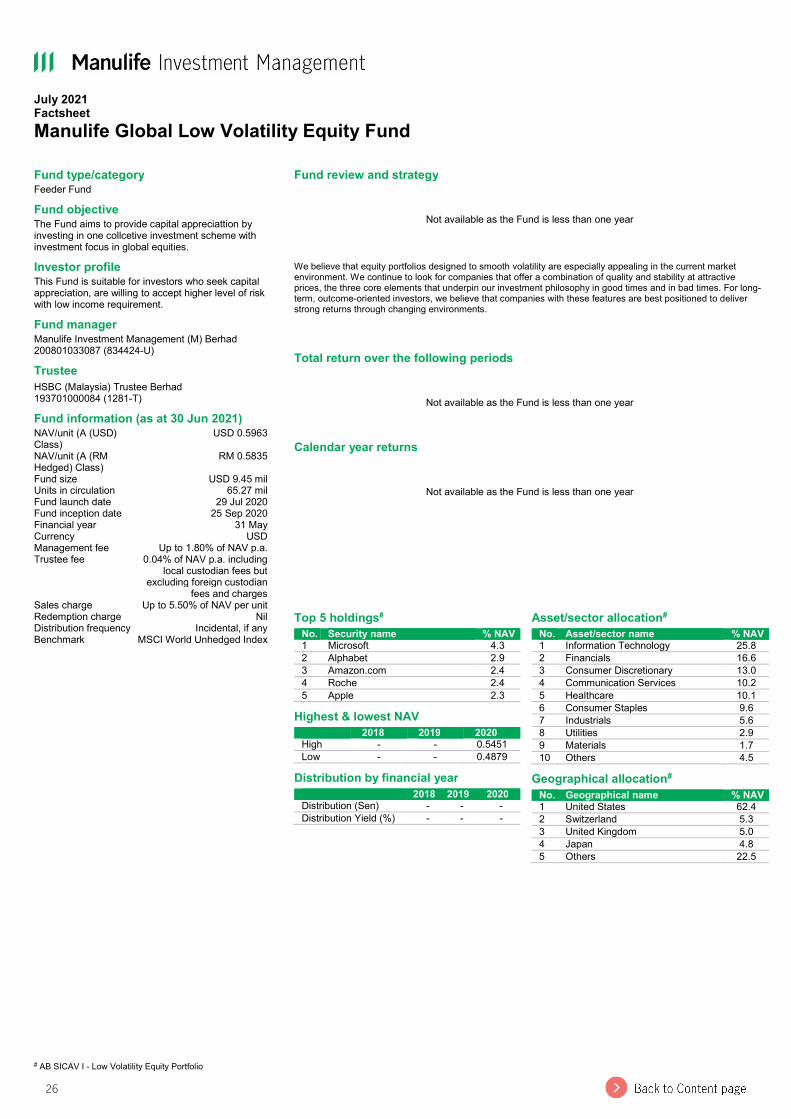
26
July 2021 Factsheet Manulife Global Low Volatility Equity Fund
# AB SICAV I - Low Volatility Equity Portfolio
Fund type/category Feeder Fund Fund objective The Fund aims to provide capital appreciattion by investing in one collcetive investment scheme with investment focus in global equities. Investor profile This Fund is suitable for investors who seek capital appreciation, are willing to accept higher level of risk with low income requirement. Fund manager Manulife Investment Management (M) Berhad 200801033087 (834424-U) Trustee HSBC (Malaysia) Trustee Berhad 193701000084 (1281-T) Fund information (as at 30 Jun 2021) NAV/unit (A (USD) Class)
USD 0.5963 NAV/unit (A (RM Hedged) Class)
RM 0.5835 Fund size USD 9.45 mil Units in circulation 65.27 mil Fund launch date 29 Jul 2020 Fund inception date 25 Sep 2020 Financial year 31 May Currency USD Management fee Up to 1.80% of NAV p.a. Trustee fee 0.04% of NAV p.a. including
local custodian fees but excluding foreign custodian
fees and charges Sales charge Up to 5.50% of NAV per unit Redemption charge Nil Distribution frequency Incidental, if any Benchmark MSCI World Unhedged Index
Fund review and strategy
Not available as the Fund is less than one year
We believe that equity portfolios designed to smooth volatility are especially appealing in the current market environment. We continue to look for companies that offer a combination of quality and stability at attractive prices, the three core elements that underpin our investment philosophy in good times and in bad times. For long-term, outcome-oriented investors, we believe that companies with these features are best positioned to deliver strong returns through changing environments.
Total return over the following periods
Not available as the Fund is less than one year
Calendar year returns
Not available as the Fund is less than one year
Top 5 holdings# No. Security name % NAV
1 Microsoft 4.3 2 Alphabet 2.9 3 Amazon.com 2.4 4 Roche 2.4 5 Apple 2.3
Highest & lowest NAV 2018 2019 2020
High - - 0.5451 Low - - 0.4879
Distribution by financial year 2018 2019 2020
Distribution (Sen) - - - Distribution Yield (%) - - -
Asset/sector allocation# No. Asset/sector name % NAV
1 Information Technology 25.8 2 Financials 16.6 3 Consumer Discretionary 13.0 4 Communication Services 10.2 5 Healthcare 10.1 6 Consumer Staples 9.6 7 Industrials 5.6 8 Utilities 2.9 9 Materials 1.7 10 Others 4.5
Geographical allocation# No. Geographical name % NAV
1 United States 62.4 2 Switzerland 5.3 3 United Kingdom 5.0 4 Japan 4.8 5 Others 22.5
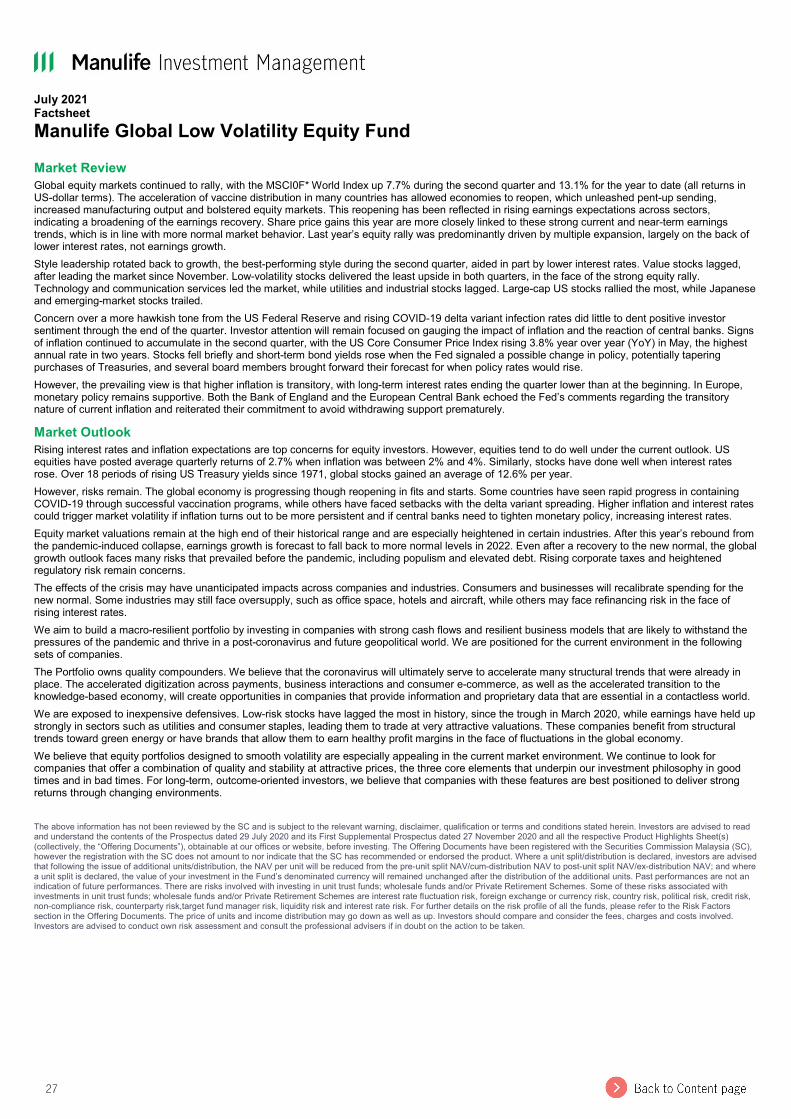
27
July 2021 Factsheet Manulife Global Low Volatility Equity Fund Market Review Global equity markets continued to rally, with the MSCI0F* World Index up 7.7% during the second quarter and 13.1% for the year to date (all returns in US-dollar terms). The acceleration of vaccine distribution in many countries has allowed economies to reopen, which unleashed pent-up sending, increased manufacturing output and bolstered equity markets. This reopening has been reflected in rising earnings expectations across sectors, indicating a broadening of the earnings recovery. Share price gains this year are more closely linked to these strong current and near-term earnings trends, which is in line with more normal market behavior. Last year’s equity rally was predominantly driven by multiple expansion, largely on the back of lower interest rates, not earnings growth. Style leadership rotated back to growth, the best-performing style during the second quarter, aided in part by lower interest rates. Value stocks lagged, after leading the market since November. Low-volatility stocks delivered the least upside in both quarters, in the face of the strong equity rally. Technology and communication services led the market, while utilities and industrial stocks lagged. Large-cap US stocks rallied the most, while Japanese and emerging-market stocks trailed. Concern over a more hawkish tone from the US Federal Reserve and rising COVID-19 delta variant infection rates did little to dent positive investor sentiment through the end of the quarter. Investor attention will remain focused on gauging the impact of inflation and the reaction of central banks. Signs of inflation continued to accumulate in the second quarter, with the US Core Consumer Price Index rising 3.8% year over year (YoY) in May, the highest annual rate in two years. Stocks fell briefly and short-term bond yields rose when the Fed signaled a possible change in policy, potentially tapering purchases of Treasuries, and several board members brought forward their forecast for when policy rates would rise. However, the prevailing view is that higher inflation is transitory, with long-term interest rates ending the quarter lower than at the beginning. In Europe, monetary policy remains supportive. Both the Bank of England and the European Central Bank echoed the Fed’s comments regarding the transitory nature of current inflation and reiterated their commitment to avoid withdrawing support prematurely. Market Outlook Rising interest rates and inflation expectations are top concerns for equity investors. However, equities tend to do well under the current outlook. US equities have posted average quarterly returns of 2.7% when inflation was between 2% and 4%. Similarly, stocks have done well when interest rates rose. Over 18 periods of rising US Treasury yields since 1971, global stocks gained an average of 12.6% per year. However, risks remain. The global economy is progressing though reopening in fits and starts. Some countries have seen rapid progress in containing COVID-19 through successful vaccination programs, while others have faced setbacks with the delta variant spreading. Higher inflation and interest rates could trigger market volatility if inflation turns out to be more persistent and if central banks need to tighten monetary policy, increasing interest rates. Equity market valuations remain at the high end of their historical range and are especially heightened in certain industries. After this year’s rebound from the pandemic-induced collapse, earnings growth is forecast to fall back to more normal levels in 2022. Even after a recovery to the new normal, the global growth outlook faces many risks that prevailed before the pandemic, including populism and elevated debt. Rising corporate taxes and heightened regulatory risk remain concerns. The effects of the crisis may have unanticipated impacts across companies and industries. Consumers and businesses will recalibrate spending for the new normal. Some industries may still face oversupply, such as office space, hotels and aircraft, while others may face refinancing risk in the face of rising interest rates. We aim to build a macro-resilient portfolio by investing in companies with strong cash flows and resilient business models that are likely to withstand the pressures of the pandemic and thrive in a post-coronavirus and future geopolitical world. We are positioned for the current environment in the following sets of companies. The Portfolio owns quality compounders. We believe that the coronavirus will ultimately serve to accelerate many structural trends that were already in place. The accelerated digitization across payments, business interactions and consumer e-commerce, as well as the accelerated transition to the knowledge-based economy, will create opportunities in companies that provide information and proprietary data that are essential in a contactless world. We are exposed to inexpensive defensives. Low-risk stocks have lagged the most in history, since the trough in March 2020, while earnings have held up strongly in sectors such as utilities and consumer staples, leading them to trade at very attractive valuations. These companies benefit from structural trends toward green energy or have brands that allow them to earn healthy profit margins in the face of fluctuations in the global economy. We believe that equity portfolios designed to smooth volatility are especially appealing in the current market environment. We continue to look for companies that offer a combination of quality and stability at attractive prices, the three core elements that underpin our investment philosophy in good times and in bad times. For long-term, outcome-oriented investors, we believe that companies with these features are best positioned to deliver strong returns through changing environments. The above information has not been reviewed by the SC and is subject to the relevant warning, disclaimer, qualification or terms and conditions stated herein. Investors are advised to read and understand the contents of the Prospectus dated 29 July 2020 and its First Supplemental Prospectus dated 27 November 2020 and all the respective Product Highlights Sheet(s) (collectively, the “Offering Documents”), obtainable at our offices or website, before investing. The Offering Documents have been registered with the Securities Commission Malaysia (SC), however the registration with the SC does not amount to nor indicate that the SC has recommended or endorsed the product. Where a unit split/distribution is declared, investors are advised that following the issue of additional units/distribution, the NAV per unit will be reduced from the pre-unit split NAV/cum-distribution NAV to post-unit split NAV/ex-distribution NAV; and where a unit split is declared, the value of your investment in the Fund’s denominated currency will remained unchanged after the distribution of the additional units. Past performances are not an indication of future performances. There are risks involved with investing in unit trust funds; wholesale funds and/or Private Retirement Schemes. Some of these risks associated with investments in unit trust funds; wholesale funds and/or Private Retirement Schemes are interest rate fluctuation risk, foreign exchange or currency risk, country risk, political risk, credit risk, non-compliance risk, counterparty risk,target fund manager risk, liquidity risk and interest rate risk. For further details on the risk profile of all the funds, please refer to the Risk Factors section in the Offering Documents. The price of units and income distribution may go down as well as up. Investors should compare and consider the fees, charges and costs involved. Investors are advised to conduct own risk assessment and consult the professional advisers if in doubt on the action to be taken.
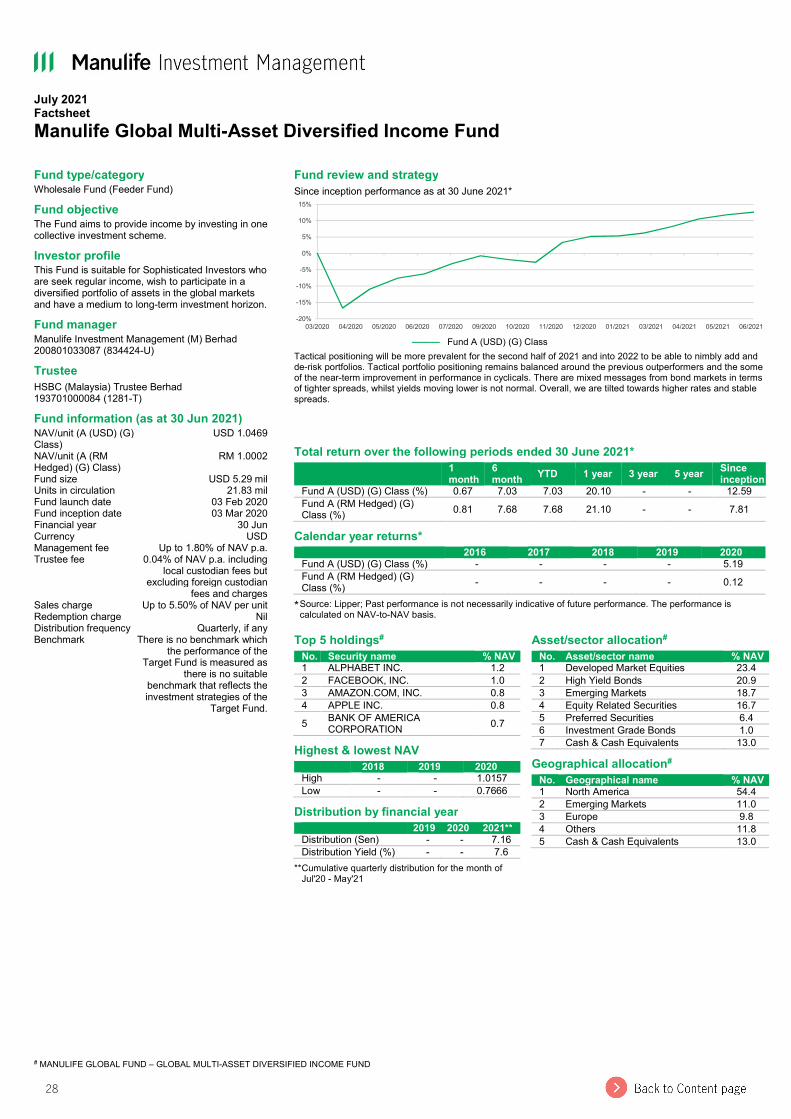
28
July 2021 Factsheet Manulife Global Multi-Asset Diversified Income Fund
# MANULIFE GLOBAL FUND – GLOBAL MULTI-ASSET DIVERSIFIED INCOME FUND
Fund type/category Wholesale Fund (Feeder Fund) Fund objective The Fund aims to provide income by investing in one collective investment scheme. Investor profile This Fund is suitable for Sophisticated Investors who are seek regular income, wish to participate in a diversified portfolio of assets in the global markets and have a medium to long-term investment horizon. Fund manager Manulife Investment Management (M) Berhad 200801033087 (834424-U) Trustee HSBC (Malaysia) Trustee Berhad 193701000084 (1281-T) Fund information (as at 30 Jun 2021) NAV/unit (A (USD) (G) Class)
USD 1.0469 NAV/unit (A (RM Hedged) (G) Class)
RM 1.0002 Fund size USD 5.29 mil Units in circulation 21.83 mil Fund launch date 03 Feb 2020 Fund inception date 03 Mar 2020 Financial year 30 Jun Currency USD Management fee Up to 1.80% of NAV p.a. Trustee fee 0.04% of NAV p.a. including
local custodian fees but excluding foreign custodian
fees and charges Sales charge Up to 5.50% of NAV per unit Redemption charge Nil Distribution frequency Quarterly, if any Benchmark There is no benchmark which
the performance of the Target Fund is measured as
there is no suitable benchmark that reflects the investment strategies of the
Target Fund.
Fund review and strategy Since inception performance as at 30 June 2021*
——— Fund A (USD) (G) Class
Tactical positioning will be more prevalent for the second half of 2021 and into 2022 to be able to nimbly add and de-risk portfolios. Tactical portfolio positioning remains balanced around the previous outperformers and the some of the near-term improvement in performance in cyclicals. There are mixed messages from bond markets in terms of tighter spreads, whilst yields moving lower is not normal. Overall, we are tilted towards higher rates and stable spreads.
Total return over the following periods ended 30 June 2021*
1 month
6 month YTD 1 year 3 year 5 year Since
inception Fund A (USD) (G) Class (%) 0.67 7.03 7.03 20.10 - - 12.59 Fund A (RM Hedged) (G) Class (%) 0.81 7.68 7.68 21.10 - - 7.81
Calendar year returns* 2016 2017 2018 2019 2020
Fund A (USD) (G) Class (%) - - - - 5.19 Fund A (RM Hedged) (G) Class (%) - - - - 0.12
* Source: Lipper; Past performance is not necessarily indicative of future performance. The performance is calculated on NAV-to-NAV basis.
-20%
-15%
-10%
-5%
0%
5%
10%
15%
03/2020 04/2020 05/2020 06/2020 07/2020 09/2020 10/2020 11/2020 12/2020 01/2021 03/2021 04/2021 05/2021 06/2021
Top 5 holdings# No. Security name % NAV
1 ALPHABET INC. 1.2 2 FACEBOOK, INC. 1.0 3 AMAZON.COM, INC. 0.8 4 APPLE INC. 0.8 5 BANK OF AMERICA
CORPORATION 0.7 Highest & lowest NAV 2018 2019 2020
High - - 1.0157 Low - - 0.7666
Distribution by financial year 2019 2020 2021**
Distribution (Sen) - - 7.16 Distribution Yield (%) - - 7.6
** Cumulative quarterly distribution for the month of Jul'20 - May'21
Asset/sector allocation# No. Asset/sector name % NAV
1 Developed Market Equities 23.4 2 High Yield Bonds 20.9 3 Emerging Markets 18.7 4 Equity Related Securities 16.7 5 Preferred Securities 6.4 6 Investment Grade Bonds 1.0 7 Cash & Cash Equivalents 13.0
Geographical allocation# No. Geographical name % NAV
1 North America 54.4 2 Emerging Markets 11.0 3 Europe 9.8 4 Others 11.8 5 Cash & Cash Equivalents 13.0

29
July 2021 Factsheet Manulife Global Multi-Asset Diversified Income Fund Market Review June saw the rally continue to end a strong quarter and first half for risk assets, both in equities and higher yielding credit spread assets. Market performance was pressured somewhat by concerns that mounting inflation pressures may eventually force the US Federal Reserve Board (Fed) and other major central banks to begin tightening monetary policy. Still, the Fed continued to reassure investors of its intent to keep interest rates near zero for an extended period. For June 2021, in equities, MSCI World gained +1.5%, S&P 500 gained +2.3%, whilst developed markets (DM) ex US underperformed as Europe fell -1.3%, Japan -0.3% as well as Asia ex Japan falling -0.3%. Emerging markets (EM) had a small gain of +0.2% whilst Chinese equities remained soft over the month gaining +1%. EM trailed DM in the first half of 2021 by a sizeable margin, appearing more sensitive to potential Fed policy shifts, whilst segments of the Chinese markets have more recently been impacted by a pick-up in regulatory activity towards e-commerce and technology firms. The markets experienced a change in leadership under the surface. The value style, which had led the way higher over the previous six months, began to lag as investors rotated back into growth. This dynamic contributed to outperformance for the US market due to the high representation of technology stocks in its major indexes. Sectorally, growth-oriented equities outperformed as we saw information technology take back leadership over the month being the outperforming sector, gaining +6.9% whilst energy and healthcare also added +3.1% and 3% respectively. Materials fell -4.1%. Russell 1000 Small Cap Growth gained +6.3%, whilst Russell 1000 Small Cap Value fell -1.2%. Oil related equities gained +10.9%, whilst gold fell -7%. Within fixed income, the more rate sensitive pockets underperformed the broader spread related assets as the Citi World Gov Bond Index fell -1.1%, Barclays Global Aggregate fell -0.9%, whilst Barclays Global High Yield gained +0.2% and Barclays EM USD Aggregate gained +0.7%. The US dollar was stronger over June against most majors, as the British pound depreciated -2.8%, euro -3% and renminbi -1.6%. We continue to believe that US dollar weakness is likely to continue given the dovish stance of the Fed, the persistent and rising US trade deficit, and the expansionist fiscal policy of the new Biden administration. In terms of spreads, we again saw a tightening over the month in the Bloomberg Barclays US Corporate High Yield Average OAS which was 267 basis points (bps) by the end of June versus 294 bps at the end of May. EM underperformed the US, the JP Morgan CEMBI Diversified Broad High Yield Blended Spread was flat at 456 bps as at the end of June versus 457 bps at the end of May. The VIX ended June 2021, similar to May at a low of 16. Governments and central banks continue to demonstrate readiness to stand-in with monetary and fiscal tools to mitigate the risk of economic damage arising from the pandemic. Fed guidance, a function of job creation and inflation expectations, at this point remains the key driver of near-term asset markets. Feeder Fund Review In June, the Feeder Fund posted a) 0.67% for its A (USD) (G) Class; and b) 0.81% for A (RM Hedged) (G) Class. The Feeder Fund posted positive returns for the month of June, whilst the natural underlying yield generation remained healthy at approximately 4.5%. Less aggressive call overwriting, at similar strikes, over the June period reduced overall premiums collected, although the equity sleeve was able to incrementally participate in an upside market. Equities: Allocation to equities remains historically high at 22% and remains the key driver of performance over the month. The equity sleeve has a slight value tilt and remains underweight technology, although this is partially offset by the overweight in communication services holdings. The equity sleeve held up well versus a global MSCI ACWI benchmark over the month of June 2021. Options: Options overwriting has been steadily harvesting premiums over the last few months, although the strategy was further reduced again from 19% in May 2021 to 17% in June 2021. Overwriting consisted of 30D calls and 50D puts which were written as per last month, albeit less equities had an overwriting call structure. The strategy will continue to be approached tactically to reflect the team’s views on market direction as well as continue to harvest premium. Fixed Income: June 2021 was a strong month of performance for US credit while the rest of the world lagged. US high-yield spreads tightened further whilst CEMBI EM HY were flat to wider. Within EM, Asia once again was the underperformer. Within the portfolio, adds were to US movie theatres, energy, technology and lodging. Outside of the US, adds were to Brazilian and Chilean electric power providers. Profits were taken in a US energy producer, selling the entire position. Within Asia credit, we saw investment grade outperform high-yield over the course of June 2021. Asia investment grade credit managed to tighten and returned close to 1%. Chinese state-owned enterprises, investment grade and local government financing vehicles led the gain over the month on expectations of an improving onshore financing situation. However, such strong sentiment did not feed into Asia high-yield which achieved a negative return, primarily dragged lower by the weak sentiment in Chinese high-yield properties, due to continuous, sustained policy tightening and financial distress observed in selective names. Over the month, we participated in several China industrial names which are repeat issuers with good track records and strong fundamentals. The investment was performance supportive and provided the further diversification across the portfolio away from China high-yield properties. The overall exposure in China remained significant within the Asia credit bucket, which we are comfortable with, whilst watching closely for a better entry point to potentially increase selective China high-yield property names. Major tail risk events would be the Southeast Asia Covid-19 situation, the handling of the China AMC situation, where there has been limited communication lately, and any renewal of China sanctions. Yield: At the top level, contribution to yield by asset class for the month of June was 25% from options, 28% from global ex EM high-yield, 26% from EM debt, 7% from global equity, 9% from preferred and the remainder from investment grade holdings, REITs and cash/cash equivalents. Return: On a higher level by sleeve, returns were positive for the Fund across most segments, although Asia credits were relatively soft. Equities, followed by fixed income, were the main drivers of performance over the month.
30
July 2021 Factsheet Manulife Global Multi-Asset Diversified Income Fund Market Outlook Fed tapering, the removal of extraordinary liquidity provisions, is likely to occur by year-end. Policy, however, will likely still remain very accommodative with a very slow and gradual response in terms of rate hikes, which we don’t expect until 2024. Massive monetary and fiscal emergency packages have been put in place, but this is becoming incrementally less supportive. Vaccines are giving populations the opportunity to be more mobile again, although government restrictions remain in varying degrees of strictness which will further impact mobility trends. Policy support will likely remain abundant for businesses and the consumer to get back to some form of new Covid reality. Tactical positioning will be more prevalent for the second half of 2021 and into 2022 to be able to nimbly add and de-risk portfolios. Tactical portfolio positioning remains balanced around the previous outperformers and the some of the near-term improvement in performance in cyclicals. There are mixed messages from bond markets in terms of tighter spreads, whilst yields moving lower isn't normal. Overall, we are tilted towards higher rates and stable spreads. Markets have reacted positively to the fiscal deployment, vaccine news and continued Fed guidance to run an economy towards a long term 2% inflation target, however, more recently the rally in yields, which more recently faded towards the end of the second quarter of 2021, is causing some concern on how much of a probability the Fed could exit sooner from the current zero rate policy, as well as potentially baking in higher inflation expectations and how transitory higher prices will be. Corporate fundamentals are varied across sectors. Markets remain sensitive to a host of factors including Covid-19 vaccine success and fears of inflationary pressures. We expect global stimulus efforts to remain a focus whilst central banks’ divergent policies will keep market participants second-guessing on policy responses. We are closely monitoring the direct and indirect impacts of Covid-19 to avoid issuers with liquidity concerns. The outlook for US high-yield markets remains balanced. We expect uncertainty to remain in the coming months but believe investors are generally being compensated for the risks. We feel that defaults have peaked and trailing 12-month default rates will decline in 2021. Our fundamental analysis and stress testing give us confidence in our ability to navigate these challenges. All indications point to an extended period of low interest rates and continued government support to put the global economy back on a positive trajectory. However, the pace of the recovery into 2021 and beyond is difficult to project given the sheer number of variables to consider. Economic data has seen pockets of improvement whilst there also remains pockets of weakness. The massive volatility in indicator readings makes the positive signs less reassuring, and we believe that the level to which data eventually normalises will be more important. US macro data over the coming months are likely to be some of the best seen in years. Vaccines are being rolled out, although Covid variants are impacting the efficacy of current vaccines which governments and healthcare corporates have to try to manage. The most recent evidence points to high levels of effectiveness towards the new variants. A rising number of questions are growing around Fed policy as well as multiple questions around vaccine hesitancy in some populations. A vaccine will be a game-changer for the economies of Latin America, Indonesia, and India – however, a medical solution is unlikely to drive a robust, rapid economic solution. Fiscal stimulus is unlikely to be enough for a rapid economic recovery, as getting back to pre-Covid growth rates is likely to be pushed into 2022. The lasting impact of Covid-19 on the global economy is not the only factor to monitor. Rising geopolitical tensions, decelerating growth rates post-stimulus, supply chain disruptions and a general deglobalisation trend all raise questions about the future trajectory of global debt and equity markets. The above information has not been reviewed by the SC and is subject to the relevant warning, disclaimer, qualification or terms and conditions stated herein. Investors are advised to read and understand the contents of the Information Memorandum dated 03 February 2020 and all the respective Product Highlights Sheet(s) (collectively, the “Offering Documents”), obtainable at our offices or website, before investing. The Offering Documents have been registered with the Securities Commission Malaysia (SC), however the registration with the SC does not amount to nor indicate that the SC has recommended or endorsed the product. Where a unit split/distribution is declared, investors are advised that following the issue of additional units/distribution, the NAV per unit will be reduced from the pre-unit split NAV/cum-distribution NAV to post-unit split NAV/ex-distribution NAV; and where a unit split is declared, the value of your investment in the Fund’s denominated currency will remained unchanged after the distribution of the additional units. Past performances are not an indication of future performances. There are risks involved with investing in unit trust funds; wholesale funds and/or Private Retirement Schemes. Some of these risks associated with investments in unit trust funds; wholesale funds and/or Private Retirement Schemes are interest rate fluctuation risk, foreign exchange or currency risk, country risk, political risk, credit risk, non-compliance risk, counterparty risk, target fund manager risk, liquidity risk and interest rate risk. For further details on the risk profile of all the funds, please refer to the Risk Factors section in the Offering Documents. The price of units and income distribution may go down as well as up. Investors should compare and consider the fees, charges and costs involved. Investors are advised to conduct own risk assessment and consult the professional advisers if in doubt on the action to be taken.
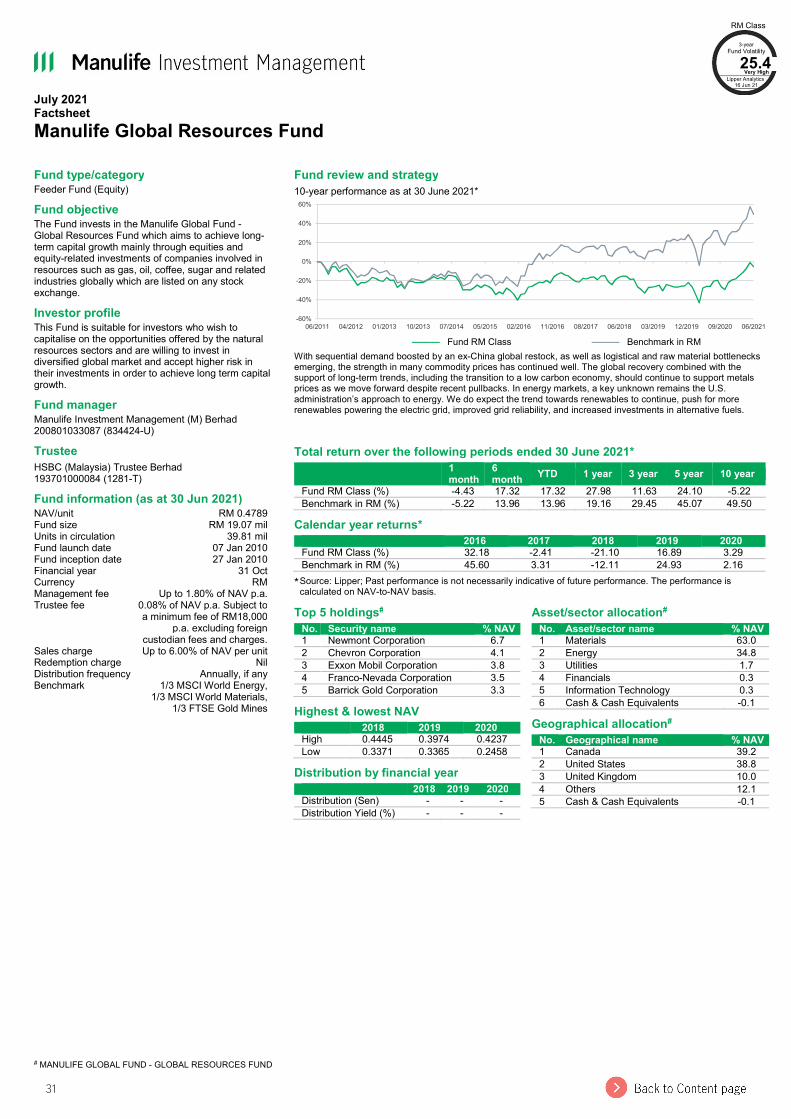
31
July 2021 Factsheet Manulife Global Resources Fund
# MANULIFE GLOBAL FUND - GLOBAL RESOURCES FUND
Fund type/category Feeder Fund (Equity) Fund objective The Fund invests in the Manulife Global Fund - Global Resources Fund which aims to achieve long-term capital growth mainly through equities and equity-related investments of companies involved in resources such as gas, oil, coffee, sugar and related industries globally which are listed on any stock exchange. Investor profile This Fund is suitable for investors who wish to capitalise on the opportunities offered by the natural resources sectors and are willing to invest in diversified global market and accept higher risk in their investments in order to achieve long term capital growth. Fund manager Manulife Investment Management (M) Berhad 200801033087 (834424-U) Trustee HSBC (Malaysia) Trustee Berhad 193701000084 (1281-T) Fund information (as at 30 Jun 2021) NAV/unit RM 0.4789 Fund size RM 19.07 mil Units in circulation 39.81 mil Fund launch date 07 Jan 2010 Fund inception date 27 Jan 2010 Financial year 31 Oct Currency RM Management fee Up to 1.80% of NAV p.a. Trustee fee 0.08% of NAV p.a. Subject to
a minimum fee of RM18,000 p.a. excluding foreign
custodian fees and charges. Sales charge Up to 6.00% of NAV per unit Redemption charge Nil Distribution frequency Annually, if any Benchmark 1/3 MSCI World Energy,
1/3 MSCI World Materials, 1/3 FTSE Gold Mines
Fund review and strategy 10-year performance as at 30 June 2021*
——— Fund RM Class ——— Benchmark in RM
With sequential demand boosted by an ex-China global restock, as well as logistical and raw material bottlenecks emerging, the strength in many commodity prices has continued well. The global recovery combined with the support of long-term trends, including the transition to a low carbon economy, should continue to support metals prices as we move forward despite recent pullbacks. In energy markets, a key unknown remains the U.S. administration’s approach to energy. We do expect the trend towards renewables to continue, push for more renewables powering the electric grid, improved grid reliability, and increased investments in alternative fuels.
Total return over the following periods ended 30 June 2021*
1 month
6 month YTD 1 year 3 year 5 year 10 year
Fund RM Class (%) -4.43 17.32 17.32 27.98 11.63 24.10 -5.22 Benchmark in RM (%) -5.22 13.96 13.96 19.16 29.45 45.07 49.50
Calendar year returns* 2016 2017 2018 2019 2020
Fund RM Class (%) 32.18 -2.41 -21.10 16.89 3.29 Benchmark in RM (%) 45.60 3.31 -12.11 24.93 2.16
* Source: Lipper; Past performance is not necessarily indicative of future performance. The performance is calculated on NAV-to-NAV basis.
-60%
-40%
-20%
0%
20%
40%
60%
06/2011 04/2012 01/2013 10/2013 07/2014 05/2015 02/2016 11/2016 08/2017 06/2018 03/2019 12/2019 09/2020 06/2021
Top 5 holdings# No. Security name % NAV
1 Newmont Corporation 6.7 2 Chevron Corporation 4.1 3 Exxon Mobil Corporation 3.8 4 Franco-Nevada Corporation 3.5 5 Barrick Gold Corporation 3.3
Highest & lowest NAV 2018 2019 2020
High 0.4445 0.3974 0.4237 Low 0.3371 0.3365 0.2458
Distribution by financial year 2018 2019 2020
Distribution (Sen) - - - Distribution Yield (%) - - -
Asset/sector allocation# No. Asset/sector name % NAV
1 Materials 63.0 2 Energy 34.8 3 Utilities 1.7 4 Financials 0.3 5 Information Technology 0.3 6 Cash & Cash Equivalents -0.1
Geographical allocation# No. Geographical name % NAV
1 Canada 39.2 2 United States 38.8 3 United Kingdom 10.0 4 Others 12.1 5 Cash & Cash Equivalents -0.1
RM Class 3-year
Fund Volatility 25.4
Very High Lipper Analytics
16 Jun 21
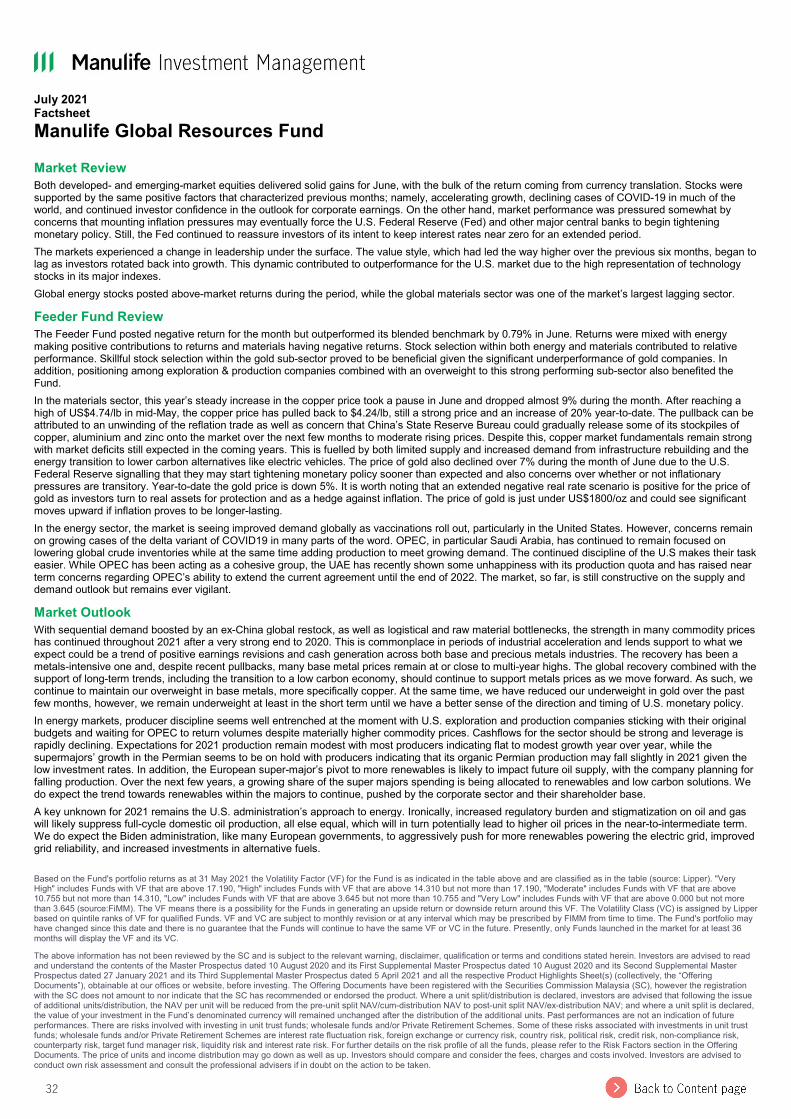
32
July 2021 Factsheet Manulife Global Resources Fund Market Review Both developed- and emerging-market equities delivered solid gains for June, with the bulk of the return coming from currency translation. Stocks were supported by the same positive factors that characterized previous months; namely, accelerating growth, declining cases of COVID-19 in much of the world, and continued investor confidence in the outlook for corporate earnings. On the other hand, market performance was pressured somewhat by concerns that mounting inflation pressures may eventually force the U.S. Federal Reserve (Fed) and other major central banks to begin tightening monetary policy. Still, the Fed continued to reassure investors of its intent to keep interest rates near zero for an extended period. The markets experienced a change in leadership under the surface. The value style, which had led the way higher over the previous six months, began to lag as investors rotated back into growth. This dynamic contributed to outperformance for the U.S. market due to the high representation of technology stocks in its major indexes. Global energy stocks posted above-market returns during the period, while the global materials sector was one of the market’s largest lagging sector. Feeder Fund Review The Feeder Fund posted negative return for the month but outperformed its blended benchmark by 0.79% in June. Returns were mixed with energy making positive contributions to returns and materials having negative returns. Stock selection within both energy and materials contributed to relative performance. Skillful stock selection within the gold sub-sector proved to be beneficial given the significant underperformance of gold companies. In addition, positioning among exploration & production companies combined with an overweight to this strong performing sub-sector also benefited the Fund. In the materials sector, this year’s steady increase in the copper price took a pause in June and dropped almost 9% during the month. After reaching a high of US$4.74/lb in mid-May, the copper price has pulled back to $4.24/lb, still a strong price and an increase of 20% year-to-date. The pullback can be attributed to an unwinding of the reflation trade as well as concern that China’s State Reserve Bureau could gradually release some of its stockpiles of copper, aluminium and zinc onto the market over the next few months to moderate rising prices. Despite this, copper market fundamentals remain strong with market deficits still expected in the coming years. This is fuelled by both limited supply and increased demand from infrastructure rebuilding and the energy transition to lower carbon alternatives like electric vehicles. The price of gold also declined over 7% during the month of June due to the U.S. Federal Reserve signalling that they may start tightening monetary policy sooner than expected and also concerns over whether or not inflationary pressures are transitory. Year-to-date the gold price is down 5%. It is worth noting that an extended negative real rate scenario is positive for the price of gold as investors turn to real assets for protection and as a hedge against inflation. The price of gold is just under US$1800/oz and could see significant moves upward if inflation proves to be longer-lasting. In the energy sector, the market is seeing improved demand globally as vaccinations roll out, particularly in the United States. However, concerns remain on growing cases of the delta variant of COVID19 in many parts of the word. OPEC, in particular Saudi Arabia, has continued to remain focused on lowering global crude inventories while at the same time adding production to meet growing demand. The continued discipline of the U.S makes their task easier. While OPEC has been acting as a cohesive group, the UAE has recently shown some unhappiness with its production quota and has raised near term concerns regarding OPEC’s ability to extend the current agreement until the end of 2022. The market, so far, is still constructive on the supply and demand outlook but remains ever vigilant. Market Outlook With sequential demand boosted by an ex-China global restock, as well as logistical and raw material bottlenecks, the strength in many commodity prices has continued throughout 2021 after a very strong end to 2020. This is commonplace in periods of industrial acceleration and lends support to what we expect could be a trend of positive earnings revisions and cash generation across both base and precious metals industries. The recovery has been a metals-intensive one and, despite recent pullbacks, many base metal prices remain at or close to multi-year highs. The global recovery combined with the support of long-term trends, including the transition to a low carbon economy, should continue to support metals prices as we move forward. As such, we continue to maintain our overweight in base metals, more specifically copper. At the same time, we have reduced our underweight in gold over the past few months, however, we remain underweight at least in the short term until we have a better sense of the direction and timing of U.S. monetary policy. In energy markets, producer discipline seems well entrenched at the moment with U.S. exploration and production companies sticking with their original budgets and waiting for OPEC to return volumes despite materially higher commodity prices. Cashflows for the sector should be strong and leverage is rapidly declining. Expectations for 2021 production remain modest with most producers indicating flat to modest growth year over year, while the supermajors’ growth in the Permian seems to be on hold with producers indicating that its organic Permian production may fall slightly in 2021 given the low investment rates. In addition, the European super-major’s pivot to more renewables is likely to impact future oil supply, with the company planning for falling production. Over the next few years, a growing share of the super majors spending is being allocated to renewables and low carbon solutions. We do expect the trend towards renewables within the majors to continue, pushed by the corporate sector and their shareholder base. A key unknown for 2021 remains the U.S. administration’s approach to energy. Ironically, increased regulatory burden and stigmatization on oil and gas will likely suppress full-cycle domestic oil production, all else equal, which will in turn potentially lead to higher oil prices in the near-to-intermediate term. We do expect the Biden administration, like many European governments, to aggressively push for more renewables powering the electric grid, improved grid reliability, and increased investments in alternative fuels. Based on the Fund's portfolio returns as at 31 May 2021 the Volatility Factor (VF) for the Fund is as indicated in the table above and are classified as in the table (source: Lipper). "Very High" includes Funds with VF that are above 17.190, "High" includes Funds with VF that are above 14.310 but not more than 17.190, "Moderate" includes Funds with VF that are above 10.755 but not more than 14.310, "Low" includes Funds with VF that are above 3.645 but not more than 10.755 and "Very Low" includes Funds with VF that are above 0.000 but not more than 3.645 (source:FiMM). The VF means there is a possibility for the Funds in generating an upside return or downside return around this VF. The Volatility Class (VC) is assigned by Lipper based on quintile ranks of VF for qualified Funds. VF and VC are subject to monthly revision or at any interval which may be prescribed by FIMM from time to time. The Fund's portfolio may have changed since this date and there is no guarantee that the Funds will continue to have the same VF or VC in the future. Presently, only Funds launched in the market for at least 36 months will display the VF and its VC. The above information has not been reviewed by the SC and is subject to the relevant warning, disclaimer, qualification or terms and conditions stated herein. Investors are advised to read and understand the contents of the Master Prospectus dated 10 August 2020 and its First Supplemental Master Prospectus dated 10 August 2020 and its Second Supplemental Master Prospectus dated 27 January 2021 and its Third Supplemental Master Prospectus dated 5 April 2021 and all the respective Product Highlights Sheet(s) (collectively, the “Offering Documents”), obtainable at our offices or website, before investing. The Offering Documents have been registered with the Securities Commission Malaysia (SC), however the registration with the SC does not amount to nor indicate that the SC has recommended or endorsed the product. Where a unit split/distribution is declared, investors are advised that following the issue of additional units/distribution, the NAV per unit will be reduced from the pre-unit split NAV/cum-distribution NAV to post-unit split NAV/ex-distribution NAV; and where a unit split is declared, the value of your investment in the Fund’s denominated currency will remained unchanged after the distribution of the additional units. Past performances are not an indication of future performances. There are risks involved with investing in unit trust funds; wholesale funds and/or Private Retirement Schemes. Some of these risks associated with investments in unit trust funds; wholesale funds and/or Private Retirement Schemes are interest rate fluctuation risk, foreign exchange or currency risk, country risk, political risk, credit risk, non-compliance risk, counterparty risk, target fund manager risk, liquidity risk and interest rate risk. For further details on the risk profile of all the funds, please refer to the Risk Factors section in the Offering Documents. The price of units and income distribution may go down as well as up. Investors should compare and consider the fees, charges and costs involved. Investors are advised to conduct own risk assessment and consult the professional advisers if in doubt on the action to be taken.
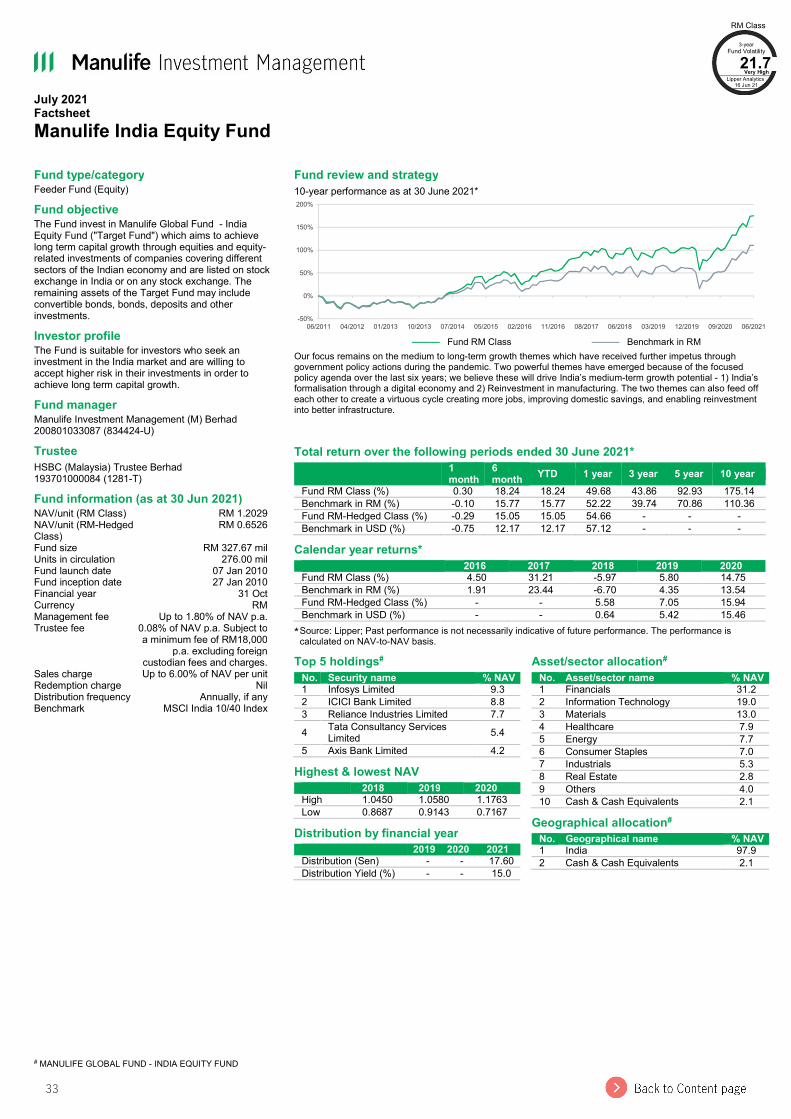
33
July 2021 Factsheet Manulife India Equity Fund
# MANULIFE GLOBAL FUND - INDIA EQUITY FUND
Fund type/category Feeder Fund (Equity) Fund objective The Fund invest in Manulife Global Fund - India Equity Fund ("Target Fund") which aims to achieve long term capital growth through equities and equity-related investments of companies covering different sectors of the Indian economy and are listed on stock exchange in India or on any stock exchange. The remaining assets of the Target Fund may include convertible bonds, bonds, deposits and other investments. Investor profile The Fund is suitable for investors who seek an investment in the India market and are willing to accept higher risk in their investments in order to achieve long term capital growth. Fund manager Manulife Investment Management (M) Berhad 200801033087 (834424-U) Trustee HSBC (Malaysia) Trustee Berhad 193701000084 (1281-T) Fund information (as at 30 Jun 2021) NAV/unit (RM Class) RM 1.2029 NAV/unit (RM-Hedged Class)
RM 0.6526 Fund size RM 327.67 mil Units in circulation 276.00 mil Fund launch date 07 Jan 2010 Fund inception date 27 Jan 2010 Financial year 31 Oct Currency RM Management fee Up to 1.80% of NAV p.a. Trustee fee 0.08% of NAV p.a. Subject to
a minimum fee of RM18,000 p.a. excluding foreign
custodian fees and charges. Sales charge Up to 6.00% of NAV per unit Redemption charge Nil Distribution frequency Annually, if any Benchmark MSCI India 10/40 Index
Fund review and strategy 10-year performance as at 30 June 2021*
——— Fund RM Class ——— Benchmark in RM
Our focus remains on the medium to long-term growth themes which have received further impetus through government policy actions during the pandemic. Two powerful themes have emerged because of the focused policy agenda over the last six years; we believe these will drive India’s medium-term growth potential - 1) India’s formalisation through a digital economy and 2) Reinvestment in manufacturing. The two themes can also feed off each other to create a virtuous cycle creating more jobs, improving domestic savings, and enabling reinvestment into better infrastructure.
Total return over the following periods ended 30 June 2021*
1 month
6 month YTD 1 year 3 year 5 year 10 year
Fund RM Class (%) 0.30 18.24 18.24 49.68 43.86 92.93 175.14 Benchmark in RM (%) -0.10 15.77 15.77 52.22 39.74 70.86 110.36 Fund RM-Hedged Class (%) -0.29 15.05 15.05 54.66 - - - Benchmark in USD (%) -0.75 12.17 12.17 57.12 - - -
Calendar year returns* 2016 2017 2018 2019 2020
Fund RM Class (%) 4.50 31.21 -5.97 5.80 14.75 Benchmark in RM (%) 1.91 23.44 -6.70 4.35 13.54 Fund RM-Hedged Class (%) - - 5.58 7.05 15.94 Benchmark in USD (%) - - 0.64 5.42 15.46
* Source: Lipper; Past performance is not necessarily indicative of future performance. The performance is calculated on NAV-to-NAV basis.
-50%
0%
50%
100%
150%
200%
06/2011 04/2012 01/2013 10/2013 07/2014 05/2015 02/2016 11/2016 08/2017 06/2018 03/2019 12/2019 09/2020 06/2021
Top 5 holdings# No. Security name % NAV
1 Infosys Limited 9.3 2 ICICI Bank Limited 8.8 3 Reliance Industries Limited 7.7 4 Tata Consultancy Services
Limited 5.4 5 Axis Bank Limited 4.2
Highest & lowest NAV 2018 2019 2020
High 1.0450 1.0580 1.1763 Low 0.8687 0.9143 0.7167
Distribution by financial year 2019 2020 2021
Distribution (Sen) - - 17.60 Distribution Yield (%) - - 15.0
Asset/sector allocation# No. Asset/sector name % NAV
1 Financials 31.2 2 Information Technology 19.0 3 Materials 13.0 4 Healthcare 7.9 5 Energy 7.7 6 Consumer Staples 7.0 7 Industrials 5.3 8 Real Estate 2.8 9 Others 4.0 10 Cash & Cash Equivalents 2.1
Geographical allocation# No. Geographical name % NAV
1 India 97.9 2 Cash & Cash Equivalents 2.1
RM Class 3-year
Fund Volatility 21.7
Very High Lipper Analytics
16 Jun 21

34
July 2021 Factsheet Manulife India Equity Fund Market Review The Indian market was an average performer within the region in June 2021 as the market took a breather after the strong performance in May. Key events during the month were: 1) The trend of falling active cases continued in India since the second wave peaked mid-May. Active cases are down about 86% from the peak and have declined by roughly 72% over the last month. Total active cases stand at about 530,000 now versus about 3.7 million at the peak of the second wave. In response, many states across India have continued to relax restrictions. This has been visible in high frequency indicators in June. We expect further cyclical recovery in July; 2) The pace of vaccinations has ramped up and remains the key in India’s fight against Covid-19. India has significant capacities of vaccines domestically of the Oxford-AstraZeneca vaccine, sold in India under the brand name “Covishield”. Average daily vaccinations are at less than four million/day versus closer to two million/day at the end of May. We expect supplies to improve further in July with Moderna vaccine supplies. Up to 30 June, India administered roughly 330 million shots of Covid-19 vaccines; 3) The government has announced another round of supply-side support, with new credit guarantee programmes targeted at the health, microfinance institutions and tourism sectors. This should bolster the nascent economic recovery; 4) May consumer price index (CPI) inflation at 6.3% is above the upper boundary of the Reserve Bank of India despite weak demand and lockdowns. However, the Monetary Policy Committee minutes reveal that despite supply side pressures on inflation, the members have maintained assurance of accommodative policies citing growth concerns. While risks remain of a globally coordinated policy reversal, we believe risks of a third wave and pressure on the informal sector will keep policy normalisation at bay in the medium-term. The RBI is likely to focus on growth given the hit to the economy from the second wave and supply side nature of the inflation while there may be reduced policy headroom as growth recovers in the fourth quarter unless the current inflation turns out to be transitory. Feeder Fund Review In June, the Feeder Fund posted a) 0.30% versus the benchmark return of -0.10% for its RM class; and b) -0.29% versus the benchmark return of -0.75% for its RM-Hedged class. Information technology and consumer staples outperformed. On the other hand, utilities, real estate, energy, financials and materials detracted. Healthcare, industrials, consumer discretionary and communication services broadly performed in line with the market. After the strong performance over May and part of June over falling infections, the markets took a breather and more defensive sectors like information technology and consumer staples outperformed. The detraction in utilities was driven by a sharp fall in the shares of a conglomerate group with India’s largest depository freezing the accounts of some of their large institutional shareholders. The detraction in real estate was stock specific. Energy detracted as rising oil prices may squeeze the spreads of downstream companies. Financials detracted due to doubts on the way forward for monetary policy considering rising inflation both globally and locally. Materials detracted as the sector saw profit booking after a strong performance in many previous months. Versus to its benchmark, the Fund benefited from stock selection in financials, materials, information technology and utilities. It also benefited from underweight positions in utilities and energy. On the other hand, stock selection in consumer discretionary and consumer staples were the main detractors. From an allocation point of view, an overweight in real estate, financials and materials as well as an underweight in consumer staples were the major detractors to performance. Market Outlook We have written in our past communications since the beginning of the year that we believe that the stage is set for growth to stage a strong comeback in 2021 in India, driven by the government’s long-term policy framework and the RBI’s supportive monetary policies. The growth outlook is further supported by benign monetary conditions and low real rates that are a result of strong capital flows to India to participate in India’s long-term growth story. With the second wave of Covid-19 peaking and restrictions gradually starting to ease, we should see the effect of the disruptions in April and May gradually wear off in the coming months. The loss of output in the second wave has been lower as there has not been a total lockdown like the first wave and the government has focused on faster vaccinations rather than relying only on lockdowns to bring an end to the pandemic. This disruption will delay, but not derail the expected economic recovery in our view. India remains one of the few countries in the world which has enough vaccine capacity to vaccinate its population. We expect that by the end of September-October, almost all adult Indians in urban India will be fully vaccinated. This may happen even faster if supplies are augmented with overseas vaccine supplies from the likes of Pfizer and Moderna. Increasingly, the market is likely to focus on the recovery. Despite the recent rise in inflation, we expect that the RBI will keep monetary policy accommodative for now to support the recovery as well as to prevent any systemic issues in the banking system; it may normalise policy from the fourth quarter after enough progress is made on vaccinations and there is more confidence on the recovery having strong roots. Our focus remains on the medium to long-term growth themes, which have received further impetus through government policy actions during the pandemic. Two powerful themes have emerged because of the focused policy agenda over the last six years; we believe these will drive India’s medium-term growth potential – 1) India’s formalisation through a digital economy and 2) reinvestment in manufacturing. The two themes can also feed off each other to create a virtuous cycle creating more jobs, improving domestic savings, and enabling reinvestment into better infrastructure. We have consistently highlighted through our past communications, that despite the cyclical challenges of the pandemic in 2020 and the cyclical slowdown that preceded it, India remains a local and bottom-up story supported by a host of structural reforms already in place to promote formalisation (Jan Dhan Yojana or JAM Trinity, lower corporate taxes, indirect tax reform - GST, real estate regulations - RERA, the Bankruptcy Act). We had also argued that with the fundamental building block of formalisation in place, the Indian government has a unique opportunity to revitalise economic growth through a policy framework we called the 3Rs (Recycle, Rebuild and Reinvest). The government has consistently moved ahead on this policy agenda over the last 18 months, focusing on long-term policies during the pandemic, rather than just fiscal stimulus (reduction in corporate taxes, simplifying labour laws, incentivising localisation of manufacturing to India). The Union budget presented in February 2021 carries on these policy initiatives with a focus on asset monetisation across sectors to fund growth ambitions and government spending. With this top-down backdrop, we are more constructive on: · Materials and Industrials: These sectors are a play on a recovery in the economy, increased government spending on infrastructure as well as a recovery in real estate through cement, building materials and commercial vehicles. · Financials: Financials will benefit from a cyclical upturn when the economy fully reopens as well as from longer-term structural trends of formalisation. · Real Estate: With negative real rates, the attractiveness of real estate has gone up along with improved affordability due to real estate inflation being below the CPI for more than five years now. · Structural Themes: We are constructive on macro themes like import substitution plays benefiting from government policies that encourage domestic manufacturing, as well as a diversification of production away from China due to the trade war. These companies are present across consumer discretionary, materials and healthcare. Also, we are less constructive on: · Consumer Discretionary and Staples: Valuations in these sectors have re-rated ahead of fundamentals and we see limited opportunities. · Energy and Utilities: Most companies in this sector have weak environmental, social and governance characteristics and an uncertain growth outlook.
July 2021 Factsheet Manulife India Equity Fund Market Review The Indian market was an average performer within the region in June 2021 as the market took a breather after the strong performance in May. Key events during the month were: 1) The trend of falling active cases continued in India since the second wave peaked mid-May. Active cases are down about 86% from the peak and have declined by roughly 72% over the last month. Total active cases stand at about 530,000 now versus about 3.7 million at the peak of the second wave. In response, many states across India have continued to relax restrictions. This has been visible in high frequency indicators in June. We expect further cyclical recovery in July; 2) The pace of vaccinations has ramped up and remains the key in India’s fight against Covid-19. India has significant capacities of vaccines domestically of the Oxford-AstraZeneca vaccine, sold in India under the brand name “Covishield”. Average daily vaccinations are at less than four million/day versus closer to two million/day at the end of May. We expect supplies to improve further in July with Moderna vaccine supplies. Up to 30 June, India administered roughly 330 million shots of Covid-19 vaccines; 3) The government has announced another round of supply-side support, with new credit guarantee programmes targeted at the health, microfinance institutions and tourism sectors. This should bolster the nascent economic recovery; 4) May consumer price index (CPI) inflation at 6.3% is above the upper boundary of the Reserve Bank of India despite weak demand and lockdowns. However, the Monetary Policy Committee minutes reveal that despite supply side pressures on inflation, the members have maintained assurance of accommodative policies citing growth concerns. While risks remain of a globally coordinated policy reversal, we believe risks of a third wave and pressure on the informal sector will keep policy normalisation at bay in the medium-term. The RBI is likely to focus on growth given the hit to the economy from the second wave and supply side nature of the inflation while there may be reduced policy headroom as growth recovers in the fourth quarter unless the current inflation turns out to be transitory. Feeder Fund Review In June, the Feeder Fund posted a) 0.30% versus the benchmark return of -0.10% for its RM class; and b) -0.29% versus the benchmark return of -0.75% for its RM-Hedged class. Information technology and consumer staples outperformed. On the other hand, utilities, real estate, energy, financials and materials detracted. Healthcare, industrials, consumer discretionary and communication services broadly performed in line with the market. After the strong performance over May and part of June over falling infections, the markets took a breather and more defensive sectors like information technology and consumer staples outperformed. The detraction in utilities was driven by a sharp fall in the shares of a conglomerate group with India’s largest depository freezing the accounts of some of their large institutional shareholders. The detraction in real estate was stock specific. Energy detracted as rising oil prices may squeeze the spreads of downstream companies. Financials detracted due to doubts on the way forward for monetary policy considering rising inflation both globally and locally. Materials detracted as the sector saw profit booking after a strong performance in many previous months. Versus to its benchmark, the Fund benefited from stock selection in financials, materials, information technology and utilities. It also benefited from underweight positions in utilities and energy. On the other hand, stock selection in consumer discretionary and consumer staples were the main detractors. From an allocation point of view, an overweight in real estate, financials and materials as well as an underweight in consumer staples were the major detractors to performance. Market Outlook We have written in our past communications since the beginning of the year that we believe that the stage is set for growth to stage a strong comeback in 2021 in India, driven by the government’s long-term policy framework and the RBI’s supportive monetary policies. The growth outlook is further supported by benign monetary conditions and low real rates that are a result of strong capital flows to India to participate in India’s long-term growth story. With the second wave of Covid-19 peaking and restrictions gradually starting to ease, we should see the effect of the disruptions in April and May gradually wear off in the coming months. The loss of output in the second wave has been lower as there has not been a total lockdown like the first wave and the government has focused on faster vaccinations rather than relying only on lockdowns to bring an end to the pandemic. This disruption will delay, but not derail the expected economic recovery in our view. India remains one of the few countries in the world which has enough vaccine capacity to vaccinate its population. We expect that by the end of September-October, almost all adult Indians in urban India will be fully vaccinated. This may happen even faster if supplies are augmented with overseas vaccine supplies from the likes of Pfizer and Moderna. Increasingly, the market is likely to focus on the recovery. Despite the recent rise in inflation, we expect that the RBI will keep monetary policy accommodative for now to support the recovery as well as to prevent any systemic issues in the banking system; it may normalise policy from the fourth quarter after enough progress is made on vaccinations and there is more confidence on the recovery having strong roots. Our focus remains on the medium to long-term growth themes, which have received further impetus through government policy actions during the pandemic. Two powerful themes have emerged because of the focused policy agenda over the last six years; we believe these will drive India’s medium-term growth potential – 1) India’s formalisation through a digital economy and 2) reinvestment in manufacturing. The two themes can also feed off each other to create a virtuous cycle creating more jobs, improving domestic savings, and enabling reinvestment into better infrastructure. We have consistently highlighted through our past communications, that despite the cyclical challenges of the pandemic in 2020 and the cyclical slowdown that preceded it, India remains a local and bottom-up story supported by a host of structural reforms already in place to promote formalisation (Jan Dhan Yojana or JAM Trinity, lower corporate taxes, indirect tax reform - GST, real estate regulations - RERA, the Bankruptcy Act). We had also argued that with the fundamental building block of formalisation in place, the Indian government has a unique opportunity to revitalise economic growth through a policy framework we called the 3Rs (Recycle, Rebuild and Reinvest). The government has consistently moved ahead on this policy agenda over the last 18 months, focusing on long-term policies during the pandemic, rather than just fiscal stimulus (reduction in corporate taxes, simplifying labour laws, incentivising localisation of manufacturing to India). The Union budget presented in February 2021 carries on these policy initiatives with a focus on asset monetisation across sectors to fund growth ambitions and government spending. With this top-down backdrop, we are more constructive on: · Materials and Industrials: These sectors are a play on a recovery in the economy, increased government spending on infrastructure as well as a recovery in real estate through cement, building materials and commercial vehicles. · Financials: Financials will benefit from a cyclical upturn when the economy fully reopens as well as from longer-term structural trends of formalisation. · Real Estate: With negative real rates, the attractiveness of real estate has gone up along with improved affordability due to real estate inflation being below the CPI for more than five years now. · Structural Themes: We are constructive on macro themes like import substitution plays benefiting from government policies that encourage domestic manufacturing, as well as a diversification of production away from China due to the trade war. These companies are present across consumer discretionary, materials and healthcare. Also, we are less constructive on: · Consumer Discretionary and Staples: Valuations in these sectors have re-rated ahead of fundamentals and we see limited opportunities. · Energy and Utilities: Most companies in this sector have weak environmental, social and governance characteristics and an uncertain growth outlook.
35
July 2021 Factsheet Manulife India Equity Fund · Communication Services: This sector has high debt and low pricing power. Based on the Fund's portfolio returns as at 31 May 2021 the Volatility Factor (VF) for the Fund is as indicated in the table above and are classified as in the table (source: Lipper). "Very High" includes Funds with VF that are above 17.190, "High" includes Funds with VF that are above 14.310 but not more than 17.190, "Moderate" includes Funds with VF that are above 10.755 but not more than 14.310, "Low" includes Funds with VF that are above 3.645 but not more than 10.755 and "Very Low" includes Funds with VF that are above 0.000 but not more than 3.645 (source:FiMM). The VF means there is a possibility for the Funds in generating an upside return or downside return around this VF. The Volatility Class (VC) is assigned by Lipper based on quintile ranks of VF for qualified Funds. VF and VC are subject to monthly revision or at any interval which may be prescribed by FIMM from time to time. The Fund's portfolio may have changed since this date and there is no guarantee that the Funds will continue to have the same VF or VC in the future. Presently, only Funds launched in the market for at least 36 months will display the VF and its VC. The above information has not been reviewed by the SC and is subject to the relevant warning, disclaimer, qualification or terms and conditions stated herein. Investors are advised to read and understand the contents of the Master Prospectus dated 10 August 2020 and its First Supplemental Master Prospectus dated 10 August 2020 and its Second Supplemental Master Prospectus dated 27 January 2021 and its Third Supplemental Master Prospectus dated 5 April 2021 and all the respective Product Highlights Sheet(s) (collectively, the “Offering Documents”), obtainable at our offices or website, before investing. The Offering Documents have been registered with the Securities Commission Malaysia (SC), however the registration with the SC does not amount to nor indicate that the SC has recommended or endorsed the product. Where a unit split/distribution is declared, investors are advised that following the issue of additional units/distribution, the NAV per unit will be reduced from the pre-unit split NAV/cum-distribution NAV to post-unit split NAV/ex-distribution NAV; and where a unit split is declared, the value of your investment in the Fund’s denominated currency will remained unchanged after the distribution of the additional units. Past performances are not an indication of future performances. There are risks involved with investing in unit trust funds; wholesale funds and/or Private Retirement Schemes. Some of these risks associated with investments in unit trust funds; wholesale funds and/or Private Retirement Schemes are interest rate fluctuation risk, foreign exchange or currency risk, country risk, political risk, credit risk, non-compliance risk, counterparty risk, target fund manager risk, liquidity risk and interest rate risk. For further details on the risk profile of all the funds, please refer to the Risk Factors section in the Offering Documents. The price of units and income distribution may go down as well as up. Investors should compare and consider the fees, charges and costs involved. Investors are advised to conduct own risk assessment and consult the professional advisers if in doubt on the action to be taken.
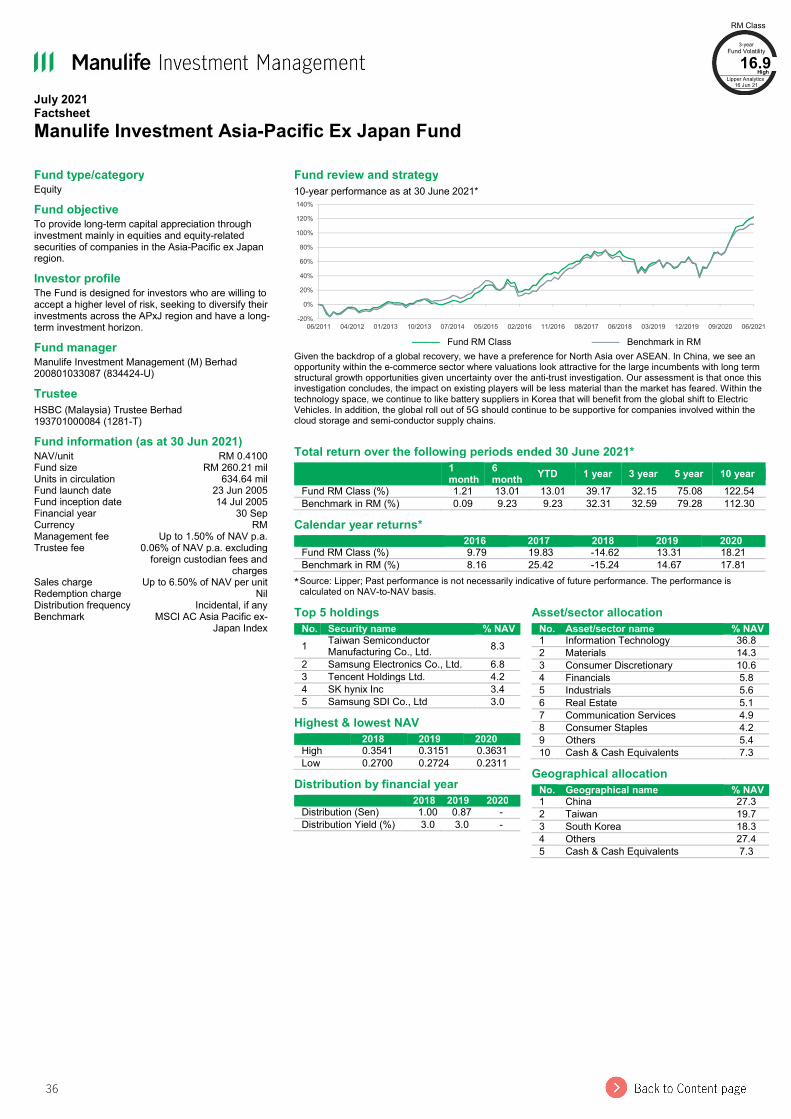
36
July 2021 Factsheet Manulife Investment Asia-Pacific Ex Japan Fund
Fund type/category Equity Fund objective To provide long-term capital appreciation through investment mainly in equities and equity-related securities of companies in the Asia-Pacific ex Japan region. Investor profile The Fund is designed for investors who are willing to accept a higher level of risk, seeking to diversify their investments across the APxJ region and have a long-term investment horizon. Fund manager Manulife Investment Management (M) Berhad 200801033087 (834424-U) Trustee HSBC (Malaysia) Trustee Berhad 193701000084 (1281-T) Fund information (as at 30 Jun 2021) NAV/unit RM 0.4100 Fund size RM 260.21 mil Units in circulation 634.64 mil Fund launch date 23 Jun 2005 Fund inception date 14 Jul 2005 Financial year 30 Sep Currency RM Management fee Up to 1.50% of NAV p.a. Trustee fee 0.06% of NAV p.a. excluding
foreign custodian fees and charges
Sales charge Up to 6.50% of NAV per unit Redemption charge Nil Distribution frequency Incidental, if any Benchmark MSCI AC Asia Pacific ex-
Japan Index
Fund review and strategy 10-year performance as at 30 June 2021*
——— Fund RM Class ——— Benchmark in RM
Given the backdrop of a global recovery, we have a preference for North Asia over ASEAN. In China, we see an opportunity within the e-commerce sector where valuations look attractive for the large incumbents with long term structural growth opportunities given uncertainty over the anti-trust investigation. Our assessment is that once this investigation concludes, the impact on existing players will be less material than the market has feared. Within the technology space, we continue to like battery suppliers in Korea that will benefit from the global shift to Electric Vehicles. In addition, the global roll out of 5G should continue to be supportive for companies involved within the cloud storage and semi-conductor supply chains.
Total return over the following periods ended 30 June 2021*
1 month
6 month YTD 1 year 3 year 5 year 10 year
Fund RM Class (%) 1.21 13.01 13.01 39.17 32.15 75.08 122.54 Benchmark in RM (%) 0.09 9.23 9.23 32.31 32.59 79.28 112.30
Calendar year returns* 2016 2017 2018 2019 2020
Fund RM Class (%) 9.79 19.83 -14.62 13.31 18.21 Benchmark in RM (%) 8.16 25.42 -15.24 14.67 17.81
* Source: Lipper; Past performance is not necessarily indicative of future performance. The performance is calculated on NAV-to-NAV basis.
-20%
0%
20%
40%
60%
80%
100%
120%
140%
06/2011 04/2012 01/2013 10/2013 07/2014 05/2015 02/2016 11/2016 08/2017 06/2018 03/2019 12/2019 09/2020 06/2021
Top 5 holdings No. Security name % NAV
1 Taiwan Semiconductor Manufacturing Co., Ltd. 8.3
2 Samsung Electronics Co., Ltd. 6.8 3 Tencent Holdings Ltd. 4.2 4 SK hynix Inc 3.4 5 Samsung SDI Co., Ltd 3.0
Highest & lowest NAV 2018 2019 2020
High 0.3541 0.3151 0.3631 Low 0.2700 0.2724 0.2311
Distribution by financial year 2018 2019 2020
Distribution (Sen) 1.00 0.87 - Distribution Yield (%) 3.0 3.0 -
Asset/sector allocation No. Asset/sector name % NAV
1 Information Technology 36.8 2 Materials 14.3 3 Consumer Discretionary 10.6 4 Financials 5.8 5 Industrials 5.6 6 Real Estate 5.1 7 Communication Services 4.9 8 Consumer Staples 4.2 9 Others 5.4 10 Cash & Cash Equivalents 7.3
Geographical allocation No. Geographical name % NAV
1 China 27.3 2 Taiwan 19.7 3 South Korea 18.3 4 Others 27.4 5 Cash & Cash Equivalents 7.3
RM Class 3-year
Fund Volatility 16.9
High Lipper Analytics
16 Jun 21
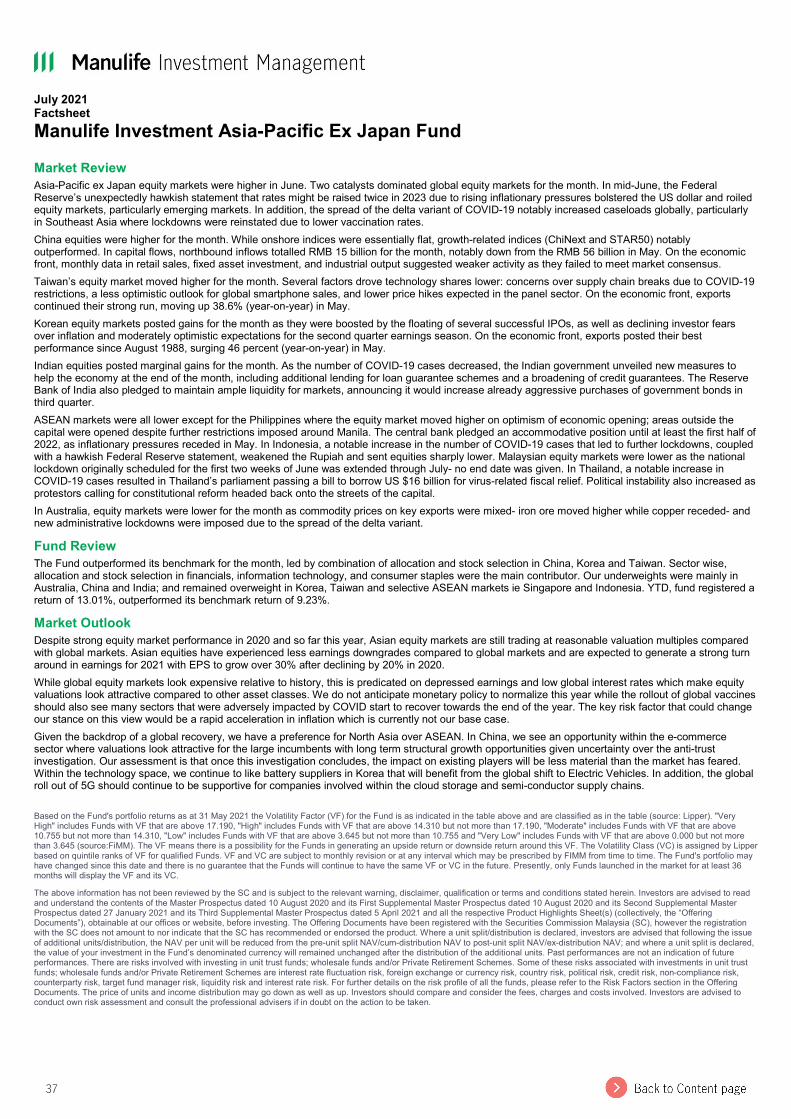
37
July 2021 Factsheet Manulife Investment Asia-Pacific Ex Japan Fund Market Review Asia-Pacific ex Japan equity markets were higher in June. Two catalysts dominated global equity markets for the month. In mid-June, the Federal Reserve’s unexpectedly hawkish statement that rates might be raised twice in 2023 due to rising inflationary pressures bolstered the US dollar and roiled equity markets, particularly emerging markets. In addition, the spread of the delta variant of COVID-19 notably increased caseloads globally, particularly in Southeast Asia where lockdowns were reinstated due to lower vaccination rates. China equities were higher for the month. While onshore indices were essentially flat, growth-related indices (ChiNext and STAR50) notably outperformed. In capital flows, northbound inflows totalled RMB 15 billion for the month, notably down from the RMB 56 billion in May. On the economic front, monthly data in retail sales, fixed asset investment, and industrial output suggested weaker activity as they failed to meet market consensus. Taiwan’s equity market moved higher for the month. Several factors drove technology shares lower: concerns over supply chain breaks due to COVID-19 restrictions, a less optimistic outlook for global smartphone sales, and lower price hikes expected in the panel sector. On the economic front, exports continued their strong run, moving up 38.6% (year-on-year) in May. Korean equity markets posted gains for the month as they were boosted by the floating of several successful IPOs, as well as declining investor fears over inflation and moderately optimistic expectations for the second quarter earnings season. On the economic front, exports posted their best performance since August 1988, surging 46 percent (year-on-year) in May. Indian equities posted marginal gains for the month. As the number of COVID-19 cases decreased, the Indian government unveiled new measures to help the economy at the end of the month, including additional lending for loan guarantee schemes and a broadening of credit guarantees. The Reserve Bank of India also pledged to maintain ample liquidity for markets, announcing it would increase already aggressive purchases of government bonds in third quarter. ASEAN markets were all lower except for the Philippines where the equity market moved higher on optimism of economic opening; areas outside the capital were opened despite further restrictions imposed around Manila. The central bank pledged an accommodative position until at least the first half of 2022, as inflationary pressures receded in May. In Indonesia, a notable increase in the number of COVID-19 cases that led to further lockdowns, coupled with a hawkish Federal Reserve statement, weakened the Rupiah and sent equities sharply lower. Malaysian equity markets were lower as the national lockdown originally scheduled for the first two weeks of June was extended through July- no end date was given. In Thailand, a notable increase in COVID-19 cases resulted in Thailand’s parliament passing a bill to borrow US $16 billion for virus-related fiscal relief. Political instability also increased as protestors calling for constitutional reform headed back onto the streets of the capital. In Australia, equity markets were lower for the month as commodity prices on key exports were mixed- iron ore moved higher while copper receded- and new administrative lockdowns were imposed due to the spread of the delta variant. Fund Review The Fund outperformed its benchmark for the month, led by combination of allocation and stock selection in China, Korea and Taiwan. Sector wise, allocation and stock selection in financials, information technology, and consumer staples were the main contributor. Our underweights were mainly in Australia, China and India; and remained overweight in Korea, Taiwan and selective ASEAN markets ie Singapore and Indonesia. YTD, fund registered a return of 13.01%, outperformed its benchmark return of 9.23%. Market Outlook Despite strong equity market performance in 2020 and so far this year, Asian equity markets are still trading at reasonable valuation multiples compared with global markets. Asian equities have experienced less earnings downgrades compared to global markets and are expected to generate a strong turn around in earnings for 2021 with EPS to grow over 30% after declining by 20% in 2020. While global equity markets look expensive relative to history, this is predicated on depressed earnings and low global interest rates which make equity valuations look attractive compared to other asset classes. We do not anticipate monetary policy to normalize this year while the rollout of global vaccines should also see many sectors that were adversely impacted by COVID start to recover towards the end of the year. The key risk factor that could change our stance on this view would be a rapid acceleration in inflation which is currently not our base case. Given the backdrop of a global recovery, we have a preference for North Asia over ASEAN. In China, we see an opportunity within the e-commerce sector where valuations look attractive for the large incumbents with long term structural growth opportunities given uncertainty over the anti-trust investigation. Our assessment is that once this investigation concludes, the impact on existing players will be less material than the market has feared. Within the technology space, we continue to like battery suppliers in Korea that will benefit from the global shift to Electric Vehicles. In addition, the global roll out of 5G should continue to be supportive for companies involved within the cloud storage and semi-conductor supply chains. Based on the Fund's portfolio returns as at 31 May 2021 the Volatility Factor (VF) for the Fund is as indicated in the table above and are classified as in the table (source: Lipper). "Very High" includes Funds with VF that are above 17.190, "High" includes Funds with VF that are above 14.310 but not more than 17.190, "Moderate" includes Funds with VF that are above 10.755 but not more than 14.310, "Low" includes Funds with VF that are above 3.645 but not more than 10.755 and "Very Low" includes Funds with VF that are above 0.000 but not more than 3.645 (source:FiMM). The VF means there is a possibility for the Funds in generating an upside return or downside return around this VF. The Volatility Class (VC) is assigned by Lipper based on quintile ranks of VF for qualified Funds. VF and VC are subject to monthly revision or at any interval which may be prescribed by FIMM from time to time. The Fund's portfolio may have changed since this date and there is no guarantee that the Funds will continue to have the same VF or VC in the future. Presently, only Funds launched in the market for at least 36 months will display the VF and its VC. The above information has not been reviewed by the SC and is subject to the relevant warning, disclaimer, qualification or terms and conditions stated herein. Investors are advised to read and understand the contents of the Master Prospectus dated 10 August 2020 and its First Supplemental Master Prospectus dated 10 August 2020 and its Second Supplemental Master Prospectus dated 27 January 2021 and its Third Supplemental Master Prospectus dated 5 April 2021 and all the respective Product Highlights Sheet(s) (collectively, the “Offering Documents”), obtainable at our offices or website, before investing. The Offering Documents have been registered with the Securities Commission Malaysia (SC), however the registration with the SC does not amount to nor indicate that the SC has recommended or endorsed the product. Where a unit split/distribution is declared, investors are advised that following the issue of additional units/distribution, the NAV per unit will be reduced from the pre-unit split NAV/cum-distribution NAV to post-unit split NAV/ex-distribution NAV; and where a unit split is declared, the value of your investment in the Fund’s denominated currency will remained unchanged after the distribution of the additional units. Past performances are not an indication of future performances. There are risks involved with investing in unit trust funds; wholesale funds and/or Private Retirement Schemes. Some of these risks associated with investments in unit trust funds; wholesale funds and/or Private Retirement Schemes are interest rate fluctuation risk, foreign exchange or currency risk, country risk, political risk, credit risk, non-compliance risk, counterparty risk, target fund manager risk, liquidity risk and interest rate risk. For further details on the risk profile of all the funds, please refer to the Risk Factors section in the Offering Documents. The price of units and income distribution may go down as well as up. Investors should compare and consider the fees, charges and costs involved. Investors are advised to conduct own risk assessment and consult the professional advisers if in doubt on the action to be taken.
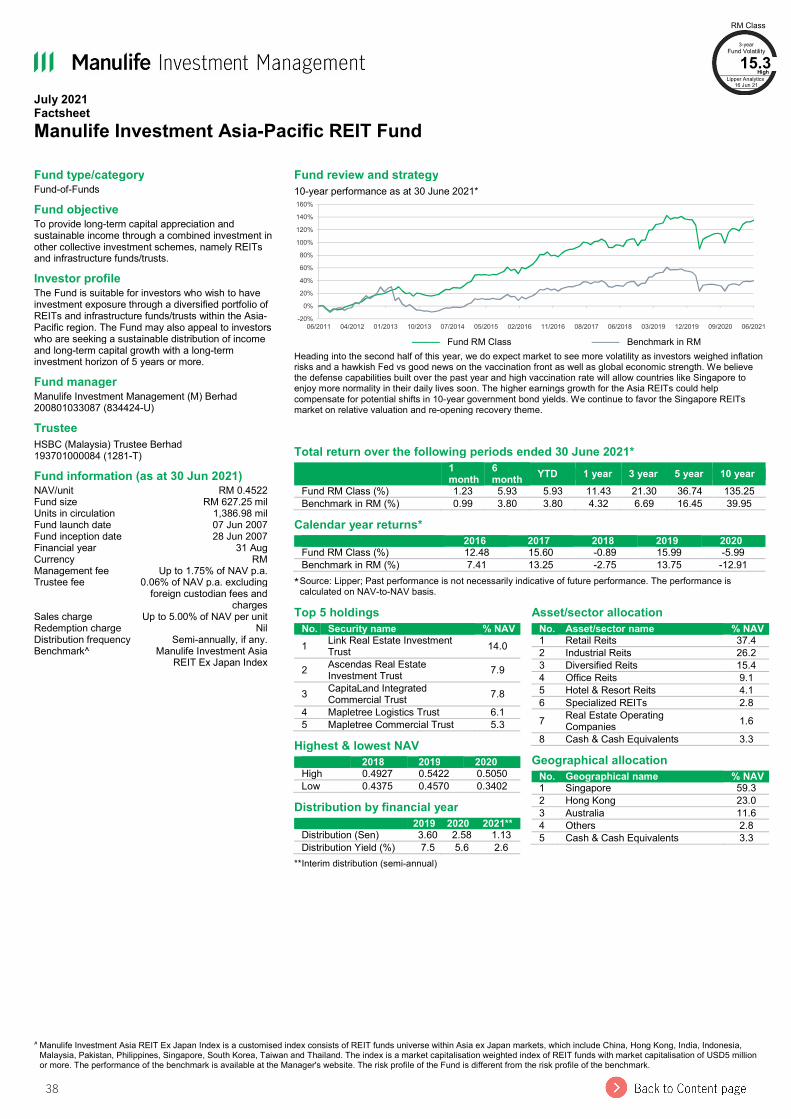
38
July 2021 Factsheet Manulife Investment Asia-Pacific REIT Fund
^ Manulife Investment Asia REIT Ex Japan Index is a customised index consists of REIT funds universe within Asia ex Japan markets, which include China, Hong Kong, India, Indonesia, Malaysia, Pakistan, Philippines, Singapore, South Korea, Taiwan and Thailand. The index is a market capitalisation weighted index of REIT funds with market capitalisation of USD5 million or more. The performance of the benchmark is available at the Manager's website. The risk profile of the Fund is different from the risk profile of the benchmark.
Fund type/category Fund-of-Funds Fund objective To provide long-term capital appreciation and sustainable income through a combined investment in other collective investment schemes, namely REITs and infrastructure funds/trusts. Investor profile The Fund is suitable for investors who wish to have investment exposure through a diversified portfolio of REITs and infrastructure funds/trusts within the Asia-Pacific region. The Fund may also appeal to investors who are seeking a sustainable distribution of income and long-term capital growth with a long-term investment horizon of 5 years or more. Fund manager Manulife Investment Management (M) Berhad 200801033087 (834424-U) Trustee HSBC (Malaysia) Trustee Berhad 193701000084 (1281-T) Fund information (as at 30 Jun 2021) NAV/unit RM 0.4522 Fund size RM 627.25 mil Units in circulation 1,386.98 mil Fund launch date 07 Jun 2007 Fund inception date 28 Jun 2007 Financial year 31 Aug Currency RM Management fee Up to 1.75% of NAV p.a. Trustee fee 0.06% of NAV p.a. excluding
foreign custodian fees and charges
Sales charge Up to 5.00% of NAV per unit Redemption charge Nil Distribution frequency Semi-annually, if any. Benchmark^ Manulife Investment Asia
REIT Ex Japan Index
Fund review and strategy 10-year performance as at 30 June 2021*
——— Fund RM Class ——— Benchmark in RM
Heading into the second half of this year, we do expect market to see more volatility as investors weighed inflation risks and a hawkish Fed vs good news on the vaccination front as well as global economic strength. We believe the defense capabilities built over the past year and high vaccination rate will allow countries like Singapore to enjoy more normality in their daily lives soon. The higher earnings growth for the Asia REITs could help compensate for potential shifts in 10-year government bond yields. We continue to favor the Singapore REITs market on relative valuation and re-opening recovery theme.
Total return over the following periods ended 30 June 2021*
1 month
6 month YTD 1 year 3 year 5 year 10 year
Fund RM Class (%) 1.23 5.93 5.93 11.43 21.30 36.74 135.25 Benchmark in RM (%) 0.99 3.80 3.80 4.32 6.69 16.45 39.95
Calendar year returns* 2016 2017 2018 2019 2020
Fund RM Class (%) 12.48 15.60 -0.89 15.99 -5.99 Benchmark in RM (%) 7.41 13.25 -2.75 13.75 -12.91
* Source: Lipper; Past performance is not necessarily indicative of future performance. The performance is calculated on NAV-to-NAV basis.
-20%
0%
20%
40%
60%
80%
100%
120%
140%
160%
06/2011 04/2012 01/2013 10/2013 07/2014 05/2015 02/2016 11/2016 08/2017 06/2018 03/2019 12/2019 09/2020 06/2021
Top 5 holdings No. Security name % NAV
1 Link Real Estate Investment Trust 14.0
2 Ascendas Real Estate Investment Trust 7.9
3 CapitaLand Integrated Commercial Trust 7.8
4 Mapletree Logistics Trust 6.1 5 Mapletree Commercial Trust 5.3
Highest & lowest NAV 2018 2019 2020
High 0.4927 0.5422 0.5050 Low 0.4375 0.4570 0.3402
Distribution by financial year 2019 2020 2021**
Distribution (Sen) 3.60 2.58 1.13 Distribution Yield (%) 7.5 5.6 2.6
** Interim distribution (semi-annual)
Asset/sector allocation No. Asset/sector name % NAV
1 Retail Reits 37.4 2 Industrial Reits 26.2 3 Diversified Reits 15.4 4 Office Reits 9.1 5 Hotel & Resort Reits 4.1 6 Specialized REITs 2.8 7 Real Estate Operating
Companies 1.6 8 Cash & Cash Equivalents 3.3
Geographical allocation No. Geographical name % NAV
1 Singapore 59.3 2 Hong Kong 23.0 3 Australia 11.6 4 Others 2.8 5 Cash & Cash Equivalents 3.3
RM Class 3-year
Fund Volatility 15.3
High Lipper Analytics
16 Jun 21
39
July 2021 Factsheet Manulife Investment Asia-Pacific REIT Fund Market Review Major Asia ex Japan REITs markets managed to close the month in positive territory in June despite more hawkish statements from the latest US Federal Reserve meeting. Buying sentiment was underpinned by a retreat in global bond yields. On the global Covid-19 front, we saw more countries being affected by rising cases due to the Delta variant, but investors appeared to look past that and focused on the strengthening of US and global economy. Australia REITs market continued its strong performance as the Australian 10-year bond tightened 18bps across the month in the sharpest monthly compression since Sep-20, providing a tailwind for the yield-sensitive sector. Gains were broad-based with fund managers, Charter Hall Group and Goodman Group among the top performers. A majority of AREITs have announced Jun-21 revaluations, with assets revalued 5% higher for the six months to Jun-21 and cap rates tightening 25bps on average. Industrial, unsurprisingly, led the way up a very strong 12% following exceptional transaction activity. Hong Kong REITS market lagged the region with relatively flat returns for June. Heavyweight Link REIT reported full year results that were in line with expectations and guided for a more optimistic outlook. The REIT shared that HK retail rental reversions recovered to positive levels in the 4QFY21 as tenant sales are recovering with the relaxation of social distancing measures. On the other hand, office REIT, Champion REIT, underperformed as central office rental recovery is expected to lag behind retail in HK. Singapore REITs market recovered in June as the country accelerates the vaccination program from Saturday (June 26) and administers up to 80,000 vaccine doses daily. Re-opening plays saw buying interest returning as social distancing restrictions were gradually relaxed from middle of June with dining-in resuming from 21 June. More than half of Singapore’s population is targeted to be fully vaccinated by the end of July and the government has guided that it will move to treating Covid-19 as an endemic disease by the end of the year. Fund Review The Fund outperformed its benchmark for the month. A combination of allocation and stock selection in Australia and Hong Kong, with Industrial, Diversified and Office REITs, being the main contributors. Our underweights are mainly in Thailand, India, Malaysia, and Taiwan; and overweight in Australia and Singapore and Hong Kong, with Industrial and hospitality REITs remain key overweight. Market Outlook Heading into the second half of this year, we do expect market to see more volatility as investors weighed inflation risks and a hawkish Fed vs good news on the vaccination front as well as global economic strength. We believe the defense capabilities built over the past year and high vaccination rate will allow countries like Singapore to enjoy more normality in their daily lives soon. The higher earnings growth for the Asia REITs could help compensate for potential shifts in 10-year government bond yields. We continue to favor the Singapore REITs market on relative valuation and re-opening recovery theme. Based on the Fund's portfolio returns as at 31 May 2021 the Volatility Factor (VF) for the Fund is as indicated in the table above and are classified as in the table (source: Lipper). "Very High" includes Funds with VF that are above 17.190, "High" includes Funds with VF that are above 14.310 but not more than 17.190, "Moderate" includes Funds with VF that are above 10.755 but not more than 14.310, "Low" includes Funds with VF that are above 3.645 but not more than 10.755 and "Very Low" includes Funds with VF that are above 0.000 but not more than 3.645 (source:FiMM). The VF means there is a possibility for the Funds in generating an upside return or downside return around this VF. The Volatility Class (VC) is assigned by Lipper based on quintile ranks of VF for qualified Funds. VF and VC are subject to monthly revision or at any interval which may be prescribed by FIMM from time to time. The Fund's portfolio may have changed since this date and there is no guarantee that the Funds will continue to have the same VF or VC in the future. Presently, only Funds launched in the market for at least 36 months will display the VF and its VC. The above information has not been reviewed by the SC and is subject to the relevant warning, disclaimer, qualification or terms and conditions stated herein. Investors are advised to read and understand the contents of the Master Prospectus dated 10 August 2020 and its First Supplemental Master Prospectus dated 10 August 2020 and its Second Supplemental Master Prospectus dated 27 January 2021 and its Third Supplemental Master Prospectus dated 5 April 2021 and all the respective Product Highlights Sheet(s) (collectively, the “Offering Documents”), obtainable at our offices or website, before investing. The Offering Documents have been registered with the Securities Commission Malaysia (SC), however the registration with the SC does not amount to nor indicate that the SC has recommended or endorsed the product. Where a unit split/distribution is declared, investors are advised that following the issue of additional units/distribution, the NAV per unit will be reduced from the pre-unit split NAV/cum-distribution NAV to post-unit split NAV/ex-distribution NAV; and where a unit split is declared, the value of your investment in the Fund’s denominated currency will remained unchanged after the distribution of the additional units. Past performances are not an indication of future performances. There are risks involved with investing in unit trust funds; wholesale funds and/or Private Retirement Schemes. Some of these risks associated with investments in unit trust funds; wholesale funds and/or Private Retirement Schemes are interest rate fluctuation risk, foreign exchange or currency risk, country risk, political risk, credit risk, non-compliance risk, counterparty risk, target fund manager risk, liquidity risk and interest rate risk. For further details on the risk profile of all the funds, please refer to the Risk Factors section in the Offering Documents. The price of units and income distribution may go down as well as up. Investors should compare and consider the fees, charges and costs involved. Investors are advised to conduct own risk assessment and consult the professional advisers if in doubt on the action to be taken.
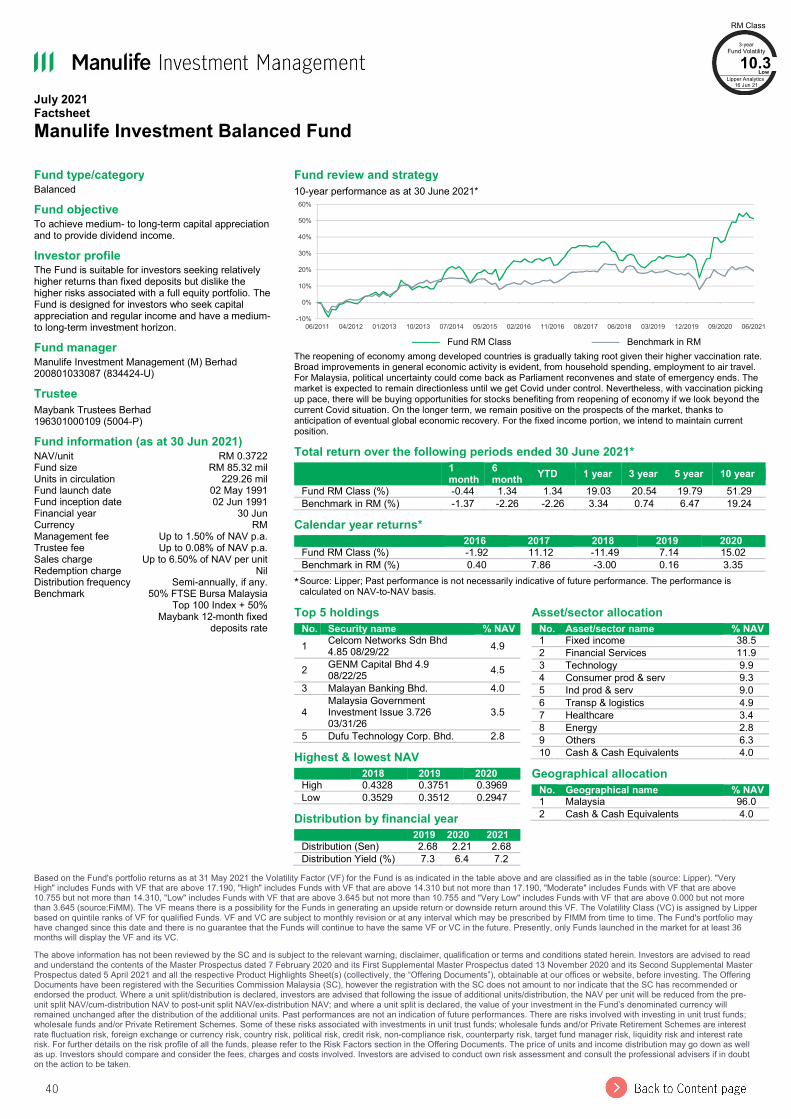
40
July 2021 Factsheet Manulife Investment Balanced Fund
Based on the Fund's portfolio returns as at 31 May 2021 the Volatility Factor (VF) for the Fund is as indicated in the table above and are classified as in the table (source: Lipper). "Very High" includes Funds with VF that are above 17.190, "High" includes Funds with VF that are above 14.310 but not more than 17.190, "Moderate" includes Funds with VF that are above 10.755 but not more than 14.310, "Low" includes Funds with VF that are above 3.645 but not more than 10.755 and "Very Low" includes Funds with VF that are above 0.000 but not more than 3.645 (source:FiMM). The VF means there is a possibility for the Funds in generating an upside return or downside return around this VF. The Volatility Class (VC) is assigned by Lipper based on quintile ranks of VF for qualified Funds. VF and VC are subject to monthly revision or at any interval which may be prescribed by FIMM from time to time. The Fund's portfolio may have changed since this date and there is no guarantee that the Funds will continue to have the same VF or VC in the future. Presently, only Funds launched in the market for at least 36 months will display the VF and its VC. The above information has not been reviewed by the SC and is subject to the relevant warning, disclaimer, qualification or terms and conditions stated herein. Investors are advised to read and understand the contents of the Master Prospectus dated 7 February 2020 and its First Supplemental Master Prospectus dated 13 November 2020 and its Second Supplemental Master Prospectus dated 5 April 2021 and all the respective Product Highlights Sheet(s) (collectively, the “Offering Documents”), obtainable at our offices or website, before investing. The Offering Documents have been registered with the Securities Commission Malaysia (SC), however the registration with the SC does not amount to nor indicate that the SC has recommended or endorsed the product. Where a unit split/distribution is declared, investors are advised that following the issue of additional units/distribution, the NAV per unit will be reduced from the pre-unit split NAV/cum-distribution NAV to post-unit split NAV/ex-distribution NAV; and where a unit split is declared, the value of your investment in the Fund’s denominated currency will remained unchanged after the distribution of the additional units. Past performances are not an indication of future performances. There are risks involved with investing in unit trust funds; wholesale funds and/or Private Retirement Schemes. Some of these risks associated with investments in unit trust funds; wholesale funds and/or Private Retirement Schemes are interest rate fluctuation risk, foreign exchange or currency risk, country risk, political risk, credit risk, non-compliance risk, counterparty risk, target fund manager risk, liquidity risk and interest rate risk. For further details on the risk profile of all the funds, please refer to the Risk Factors section in the Offering Documents. The price of units and income distribution may go down as well as up. Investors should compare and consider the fees, charges and costs involved. Investors are advised to conduct own risk assessment and consult the professional advisers if in doubt on the action to be taken.
Fund type/category Balanced Fund objective To achieve medium- to long-term capital appreciation and to provide dividend income. Investor profile The Fund is suitable for investors seeking relatively higher returns than fixed deposits but dislike the higher risks associated with a full equity portfolio. The Fund is designed for investors who seek capital appreciation and regular income and have a medium- to long-term investment horizon. Fund manager Manulife Investment Management (M) Berhad 200801033087 (834424-U) Trustee Maybank Trustees Berhad 196301000109 (5004-P) Fund information (as at 30 Jun 2021) NAV/unit RM 0.3722 Fund size RM 85.32 mil Units in circulation 229.26 mil Fund launch date 02 May 1991 Fund inception date 02 Jun 1991 Financial year 30 Jun Currency RM Management fee Up to 1.50% of NAV p.a. Trustee fee Up to 0.08% of NAV p.a. Sales charge Up to 6.50% of NAV per unit Redemption charge Nil Distribution frequency Semi-annually, if any. Benchmark 50% FTSE Bursa Malaysia
Top 100 Index + 50% Maybank 12-month fixed
deposits rate
Fund review and strategy 10-year performance as at 30 June 2021*
——— Fund RM Class ——— Benchmark in RM
The reopening of economy among developed countries is gradually taking root given their higher vaccination rate. Broad improvements in general economic activity is evident, from household spending, employment to air travel. For Malaysia, political uncertainty could come back as Parliament reconvenes and state of emergency ends. The market is expected to remain directionless until we get Covid under control. Nevertheless, with vaccination picking up pace, there will be buying opportunities for stocks benefiting from reopening of economy if we look beyond the current Covid situation. On the longer term, we remain positive on the prospects of the market, thanks to anticipation of eventual global economic recovery. For the fixed income portion, we intend to maintain current position. Total return over the following periods ended 30 June 2021*
1 month
6 month YTD 1 year 3 year 5 year 10 year
Fund RM Class (%) -0.44 1.34 1.34 19.03 20.54 19.79 51.29 Benchmark in RM (%) -1.37 -2.26 -2.26 3.34 0.74 6.47 19.24
Calendar year returns* 2016 2017 2018 2019 2020
Fund RM Class (%) -1.92 11.12 -11.49 7.14 15.02 Benchmark in RM (%) 0.40 7.86 -3.00 0.16 3.35
* Source: Lipper; Past performance is not necessarily indicative of future performance. The performance is calculated on NAV-to-NAV basis.
-10%
0%
10%
20%
30%
40%
50%
60%
06/2011 04/2012 01/2013 10/2013 07/2014 05/2015 02/2016 11/2016 08/2017 06/2018 03/2019 12/2019 09/2020 06/2021
Top 5 holdings No. Security name % NAV
1 Celcom Networks Sdn Bhd 4.85 08/29/22 4.9
2 GENM Capital Bhd 4.9 08/22/25 4.5
3 Malayan Banking Bhd. 4.0
4 Malaysia Government Investment Issue 3.726 03/31/26
3.5
5 Dufu Technology Corp. Bhd. 2.8 Highest & lowest NAV 2018 2019 2020
High 0.4328 0.3751 0.3969 Low 0.3529 0.3512 0.2947
Distribution by financial year 2019 2020 2021
Distribution (Sen) 2.68 2.21 2.68 Distribution Yield (%) 7.3 6.4 7.2
Asset/sector allocation No. Asset/sector name % NAV
1 Fixed income 38.5 2 Financial Services 11.9 3 Technology 9.9 4 Consumer prod & serv 9.3 5 Ind prod & serv 9.0 6 Transp & logistics 4.9 7 Healthcare 3.4 8 Energy 2.8 9 Others 6.3 10 Cash & Cash Equivalents 4.0
Geographical allocation No. Geographical name % NAV
1 Malaysia 96.0 2 Cash & Cash Equivalents 4.0
RM Class 3-year
Fund Volatility 10.3
Low Lipper Analytics
16 Jun 21
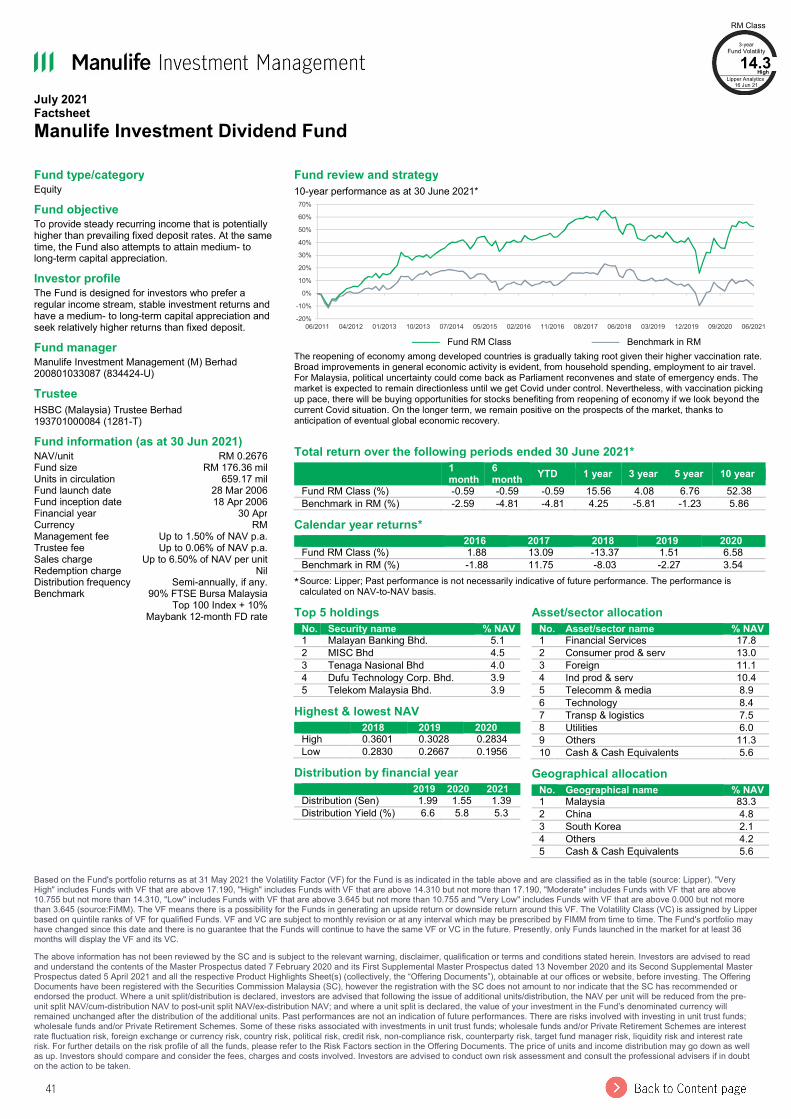
41
July 2021 Factsheet Manulife Investment Dividend Fund
Based on the Fund's portfolio returns as at 31 May 2021 the Volatility Factor (VF) for the Fund is as indicated in the table above and are classified as in the table (source: Lipper). "Very High" includes Funds with VF that are above 17.190, "High" includes Funds with VF that are above 14.310 but not more than 17.190, "Moderate" includes Funds with VF that are above 10.755 but not more than 14.310, "Low" includes Funds with VF that are above 3.645 but not more than 10.755 and "Very Low" includes Funds with VF that are above 0.000 but not more than 3.645 (source:FiMM). The VF means there is a possibility for the Funds in generating an upside return or downside return around this VF. The Volatility Class (VC) is assigned by Lipper based on quintile ranks of VF for qualified Funds. VF and VC are subject to monthly revision or at any interval which may be prescribed by FIMM from time to time. The Fund's portfolio may have changed since this date and there is no guarantee that the Funds will continue to have the same VF or VC in the future. Presently, only Funds launched in the market for at least 36 months will display the VF and its VC. The above information has not been reviewed by the SC and is subject to the relevant warning, disclaimer, qualification or terms and conditions stated herein. Investors are advised to read and understand the contents of the Master Prospectus dated 7 February 2020 and its First Supplemental Master Prospectus dated 13 November 2020 and its Second Supplemental Master Prospectus dated 5 April 2021 and all the respective Product Highlights Sheet(s) (collectively, the “Offering Documents”), obtainable at our offices or website, before investing. The Offering Documents have been registered with the Securities Commission Malaysia (SC), however the registration with the SC does not amount to nor indicate that the SC has recommended or endorsed the product. Where a unit split/distribution is declared, investors are advised that following the issue of additional units/distribution, the NAV per unit will be reduced from the pre-unit split NAV/cum-distribution NAV to post-unit split NAV/ex-distribution NAV; and where a unit split is declared, the value of your investment in the Fund’s denominated currency will remained unchanged after the distribution of the additional units. Past performances are not an indication of future performances. There are risks involved with investing in unit trust funds; wholesale funds and/or Private Retirement Schemes. Some of these risks associated with investments in unit trust funds; wholesale funds and/or Private Retirement Schemes are interest rate fluctuation risk, foreign exchange or currency risk, country risk, political risk, credit risk, non-compliance risk, counterparty risk, target fund manager risk, liquidity risk and interest rate risk. For further details on the risk profile of all the funds, please refer to the Risk Factors section in the Offering Documents. The price of units and income distribution may go down as well as up. Investors should compare and consider the fees, charges and costs involved. Investors are advised to conduct own risk assessment and consult the professional advisers if in doubt on the action to be taken.
Fund type/category Equity Fund objective To provide steady recurring income that is potentially higher than prevailing fixed deposit rates. At the same time, the Fund also attempts to attain medium- to long-term capital appreciation. Investor profile The Fund is designed for investors who prefer a regular income stream, stable investment returns and have a medium- to long-term capital appreciation and seek relatively higher returns than fixed deposit. Fund manager Manulife Investment Management (M) Berhad 200801033087 (834424-U) Trustee HSBC (Malaysia) Trustee Berhad 193701000084 (1281-T) Fund information (as at 30 Jun 2021) NAV/unit RM 0.2676 Fund size RM 176.36 mil Units in circulation 659.17 mil Fund launch date 28 Mar 2006 Fund inception date 18 Apr 2006 Financial year 30 Apr Currency RM Management fee Up to 1.50% of NAV p.a. Trustee fee Up to 0.06% of NAV p.a. Sales charge Up to 6.50% of NAV per unit Redemption charge Nil Distribution frequency Semi-annually, if any. Benchmark 90% FTSE Bursa Malaysia
Top 100 Index + 10% Maybank 12-month FD rate
Fund review and strategy 10-year performance as at 30 June 2021*
——— Fund RM Class ——— Benchmark in RM
The reopening of economy among developed countries is gradually taking root given their higher vaccination rate. Broad improvements in general economic activity is evident, from household spending, employment to air travel. For Malaysia, political uncertainty could come back as Parliament reconvenes and state of emergency ends. The market is expected to remain directionless until we get Covid under control. Nevertheless, with vaccination picking up pace, there will be buying opportunities for stocks benefiting from reopening of economy if we look beyond the current Covid situation. On the longer term, we remain positive on the prospects of the market, thanks to anticipation of eventual global economic recovery.
Total return over the following periods ended 30 June 2021*
1 month
6 month YTD 1 year 3 year 5 year 10 year
Fund RM Class (%) -0.59 -0.59 -0.59 15.56 4.08 6.76 52.38 Benchmark in RM (%) -2.59 -4.81 -4.81 4.25 -5.81 -1.23 5.86
Calendar year returns* 2016 2017 2018 2019 2020
Fund RM Class (%) 1.88 13.09 -13.37 1.51 6.58 Benchmark in RM (%) -1.88 11.75 -8.03 -2.27 3.54
* Source: Lipper; Past performance is not necessarily indicative of future performance. The performance is calculated on NAV-to-NAV basis.
-20%
-10%
0%
10%
20%
30%
40%
50%
60%
70%
06/2011 04/2012 01/2013 10/2013 07/2014 05/2015 02/2016 11/2016 08/2017 06/2018 03/2019 12/2019 09/2020 06/2021
Top 5 holdings No. Security name % NAV
1 Malayan Banking Bhd. 5.1 2 MISC Bhd 4.5 3 Tenaga Nasional Bhd 4.0 4 Dufu Technology Corp. Bhd. 3.9 5 Telekom Malaysia Bhd. 3.9
Highest & lowest NAV 2018 2019 2020
High 0.3601 0.3028 0.2834 Low 0.2830 0.2667 0.1956
Distribution by financial year 2019 2020 2021
Distribution (Sen) 1.99 1.55 1.39 Distribution Yield (%) 6.6 5.8 5.3
Asset/sector allocation No. Asset/sector name % NAV
1 Financial Services 17.8 2 Consumer prod & serv 13.0 3 Foreign 11.1 4 Ind prod & serv 10.4 5 Telecomm & media 8.9 6 Technology 8.4 7 Transp & logistics 7.5 8 Utilities 6.0 9 Others 11.3 10 Cash & Cash Equivalents 5.6
Geographical allocation No. Geographical name % NAV
1 Malaysia 83.3 2 China 4.8 3 South Korea 2.1 4 Others 4.2 5 Cash & Cash Equivalents 5.6
RM Class 3-year
Fund Volatility 14.3
High Lipper Analytics
16 Jun 21
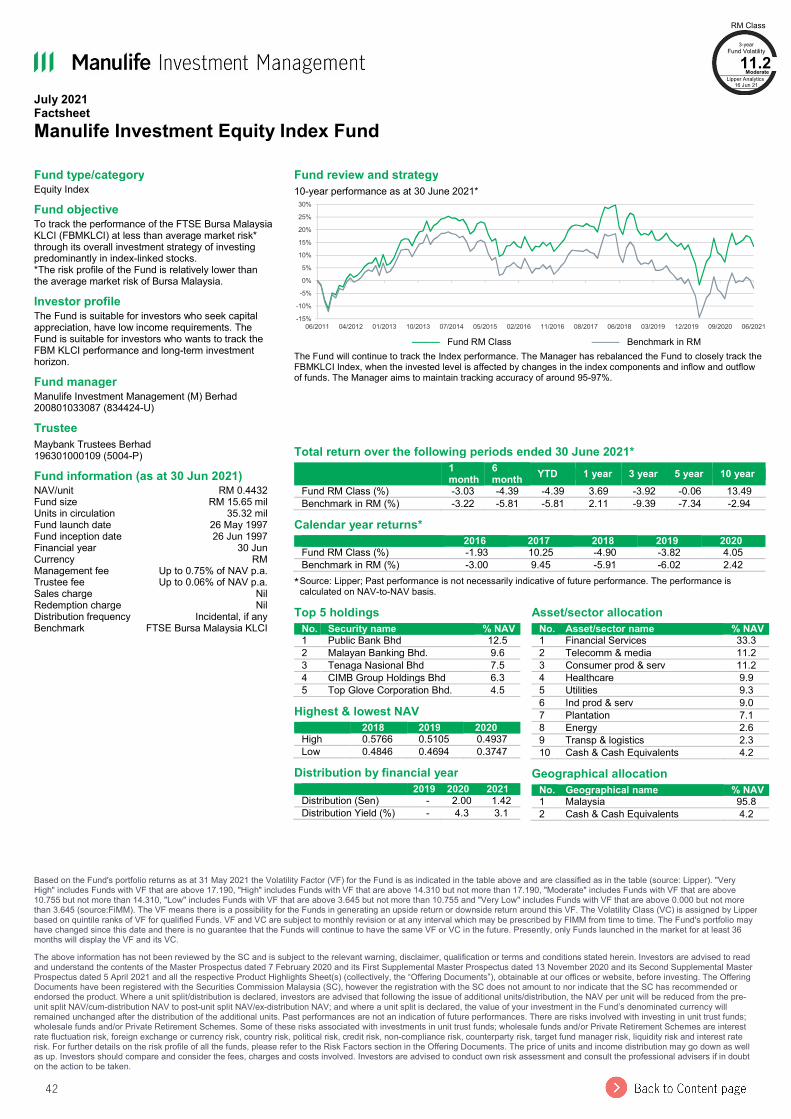
42
July 2021 Factsheet Manulife Investment Equity Index Fund
Based on the Fund's portfolio returns as at 31 May 2021 the Volatility Factor (VF) for the Fund is as indicated in the table above and are classified as in the table (source: Lipper). "Very High" includes Funds with VF that are above 17.190, "High" includes Funds with VF that are above 14.310 but not more than 17.190, "Moderate" includes Funds with VF that are above 10.755 but not more than 14.310, "Low" includes Funds with VF that are above 3.645 but not more than 10.755 and "Very Low" includes Funds with VF that are above 0.000 but not more than 3.645 (source:FiMM). The VF means there is a possibility for the Funds in generating an upside return or downside return around this VF. The Volatility Class (VC) is assigned by Lipper based on quintile ranks of VF for qualified Funds. VF and VC are subject to monthly revision or at any interval which may be prescribed by FIMM from time to time. The Fund's portfolio may have changed since this date and there is no guarantee that the Funds will continue to have the same VF or VC in the future. Presently, only Funds launched in the market for at least 36 months will display the VF and its VC. The above information has not been reviewed by the SC and is subject to the relevant warning, disclaimer, qualification or terms and conditions stated herein. Investors are advised to read and understand the contents of the Master Prospectus dated 7 February 2020 and its First Supplemental Master Prospectus dated 13 November 2020 and its Second Supplemental Master Prospectus dated 5 April 2021 and all the respective Product Highlights Sheet(s) (collectively, the “Offering Documents”), obtainable at our offices or website, before investing. The Offering Documents have been registered with the Securities Commission Malaysia (SC), however the registration with the SC does not amount to nor indicate that the SC has recommended or endorsed the product. Where a unit split/distribution is declared, investors are advised that following the issue of additional units/distribution, the NAV per unit will be reduced from the pre-unit split NAV/cum-distribution NAV to post-unit split NAV/ex-distribution NAV; and where a unit split is declared, the value of your investment in the Fund’s denominated currency will remained unchanged after the distribution of the additional units. Past performances are not an indication of future performances. There are risks involved with investing in unit trust funds; wholesale funds and/or Private Retirement Schemes. Some of these risks associated with investments in unit trust funds; wholesale funds and/or Private Retirement Schemes are interest rate fluctuation risk, foreign exchange or currency risk, country risk, political risk, credit risk, non-compliance risk, counterparty risk, target fund manager risk, liquidity risk and interest rate risk. For further details on the risk profile of all the funds, please refer to the Risk Factors section in the Offering Documents. The price of units and income distribution may go down as well as up. Investors should compare and consider the fees, charges and costs involved. Investors are advised to conduct own risk assessment and consult the professional advisers if in doubt on the action to be taken.
Fund type/category Equity Index Fund objective To track the performance of the FTSE Bursa Malaysia KLCI (FBMKLCI) at less than average market risk* through its overall investment strategy of investing predominantly in index-linked stocks. *The risk profile of the Fund is relatively lower than the average market risk of Bursa Malaysia. Investor profile The Fund is suitable for investors who seek capital appreciation, have low income requirements. The Fund is suitable for investors who wants to track the FBM KLCI performance and long-term investment horizon. Fund manager Manulife Investment Management (M) Berhad 200801033087 (834424-U) Trustee Maybank Trustees Berhad 196301000109 (5004-P) Fund information (as at 30 Jun 2021) NAV/unit RM 0.4432 Fund size RM 15.65 mil Units in circulation 35.32 mil Fund launch date 26 May 1997 Fund inception date 26 Jun 1997 Financial year 30 Jun Currency RM Management fee Up to 0.75% of NAV p.a. Trustee fee Up to 0.06% of NAV p.a. Sales charge Nil Redemption charge Nil Distribution frequency Incidental, if any Benchmark FTSE Bursa Malaysia KLCI
Fund review and strategy 10-year performance as at 30 June 2021*
——— Fund RM Class ——— Benchmark in RM
The Fund will continue to track the Index performance. The Manager has rebalanced the Fund to closely track the FBMKLCI Index, when the invested level is affected by changes in the index components and inflow and outflow of funds. The Manager aims to maintain tracking accuracy of around 95-97%.
Total return over the following periods ended 30 June 2021*
1 month
6 month YTD 1 year 3 year 5 year 10 year
Fund RM Class (%) -3.03 -4.39 -4.39 3.69 -3.92 -0.06 13.49 Benchmark in RM (%) -3.22 -5.81 -5.81 2.11 -9.39 -7.34 -2.94
Calendar year returns* 2016 2017 2018 2019 2020
Fund RM Class (%) -1.93 10.25 -4.90 -3.82 4.05 Benchmark in RM (%) -3.00 9.45 -5.91 -6.02 2.42
* Source: Lipper; Past performance is not necessarily indicative of future performance. The performance is calculated on NAV-to-NAV basis.
-15%
-10%
-5%
0%
5%
10%
15%
20%
25%
30%
06/2011 04/2012 01/2013 10/2013 07/2014 05/2015 02/2016 11/2016 08/2017 06/2018 03/2019 12/2019 09/2020 06/2021
Top 5 holdings No. Security name % NAV
1 Public Bank Bhd 12.5 2 Malayan Banking Bhd. 9.6 3 Tenaga Nasional Bhd 7.5 4 CIMB Group Holdings Bhd 6.3 5 Top Glove Corporation Bhd. 4.5
Highest & lowest NAV 2018 2019 2020
High 0.5766 0.5105 0.4937 Low 0.4846 0.4694 0.3747
Distribution by financial year 2019 2020 2021
Distribution (Sen) - 2.00 1.42 Distribution Yield (%) - 4.3 3.1
Asset/sector allocation No. Asset/sector name % NAV
1 Financial Services 33.3 2 Telecomm & media 11.2 3 Consumer prod & serv 11.2 4 Healthcare 9.9 5 Utilities 9.3 6 Ind prod & serv 9.0 7 Plantation 7.1 8 Energy 2.6 9 Transp & logistics 2.3 10 Cash & Cash Equivalents 4.2
Geographical allocation No. Geographical name % NAV
1 Malaysia 95.8 2 Cash & Cash Equivalents 4.2
RM Class 3-year
Fund Volatility 11.2
Moderate Lipper Analytics
16 Jun 21
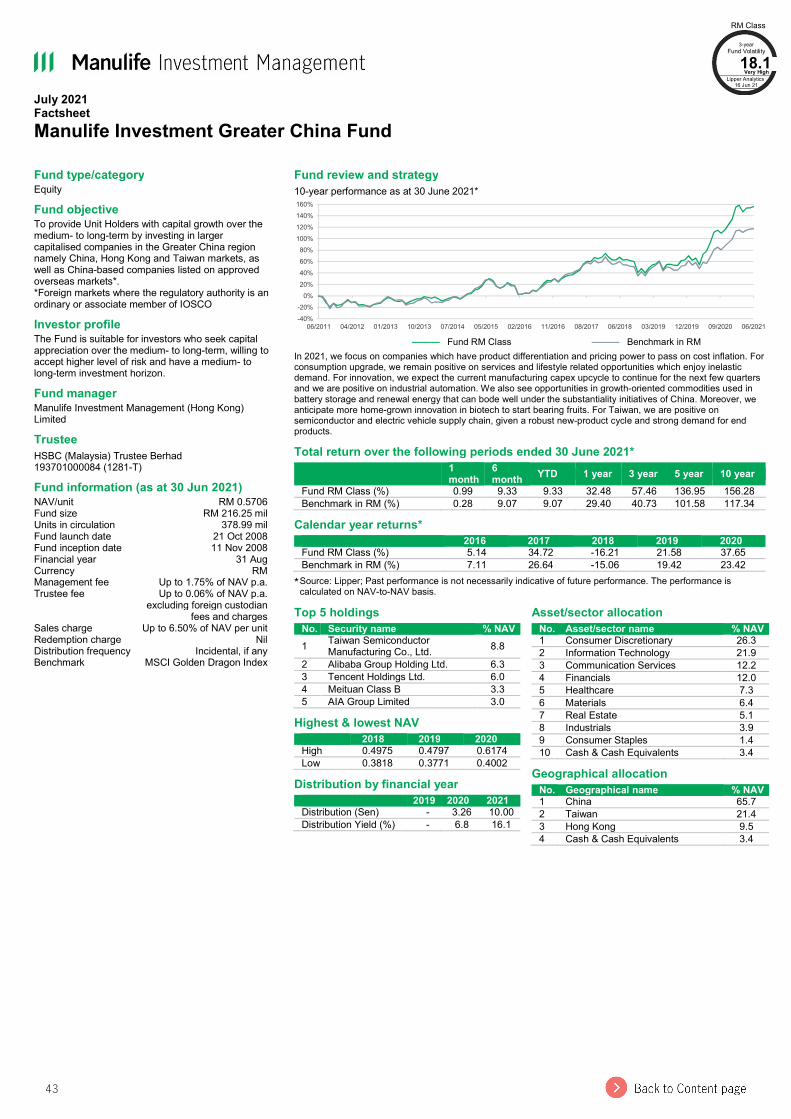
43
July 2021 Factsheet Manulife Investment Greater China Fund
Fund type/category Equity Fund objective To provide Unit Holders with capital growth over the medium- to long-term by investing in larger capitalised companies in the Greater China region namely China, Hong Kong and Taiwan markets, as well as China-based companies listed on approved overseas markets*. *Foreign markets where the regulatory authority is an ordinary or associate member of IOSCO Investor profile The Fund is suitable for investors who seek capital appreciation over the medium- to long-term, willing to accept higher level of risk and have a medium- to long-term investment horizon. Fund manager Manulife Investment Management (Hong Kong) Limited Trustee HSBC (Malaysia) Trustee Berhad 193701000084 (1281-T) Fund information (as at 30 Jun 2021) NAV/unit RM 0.5706 Fund size RM 216.25 mil Units in circulation 378.99 mil Fund launch date 21 Oct 2008 Fund inception date 11 Nov 2008 Financial year 31 Aug Currency RM Management fee Up to 1.75% of NAV p.a. Trustee fee Up to 0.06% of NAV p.a.
excluding foreign custodian fees and charges
Sales charge Up to 6.50% of NAV per unit Redemption charge Nil Distribution frequency Incidental, if any Benchmark MSCI Golden Dragon Index
Fund review and strategy 10-year performance as at 30 June 2021*
——— Fund RM Class ——— Benchmark in RM
In 2021, we focus on companies which have product differentiation and pricing power to pass on cost inflation. For consumption upgrade, we remain positive on services and lifestyle related opportunities which enjoy inelastic demand. For innovation, we expect the current manufacturing capex upcycle to continue for the next few quarters and we are positive on industrial automation. We also see opportunities in growth-oriented commodities used in battery storage and renewal energy that can bode well under the substantiality initiatives of China. Moreover, we anticipate more home-grown innovation in biotech to start bearing fruits. For Taiwan, we are positive on semiconductor and electric vehicle supply chain, given a robust new-product cycle and strong demand for end products. Total return over the following periods ended 30 June 2021*
1 month
6 month YTD 1 year 3 year 5 year 10 year
Fund RM Class (%) 0.99 9.33 9.33 32.48 57.46 136.95 156.28 Benchmark in RM (%) 0.28 9.07 9.07 29.40 40.73 101.58 117.34
Calendar year returns* 2016 2017 2018 2019 2020
Fund RM Class (%) 5.14 34.72 -16.21 21.58 37.65 Benchmark in RM (%) 7.11 26.64 -15.06 19.42 23.42
* Source: Lipper; Past performance is not necessarily indicative of future performance. The performance is calculated on NAV-to-NAV basis.
-40%
-20%
0%20%
40%
60%
80%100%
120%
140%160%
06/2011 04/2012 01/2013 10/2013 07/2014 05/2015 02/2016 11/2016 08/2017 06/2018 03/2019 12/2019 09/2020 06/2021
Top 5 holdings No. Security name % NAV
1 Taiwan Semiconductor Manufacturing Co., Ltd. 8.8
2 Alibaba Group Holding Ltd. 6.3 3 Tencent Holdings Ltd. 6.0 4 Meituan Class B 3.3 5 AIA Group Limited 3.0
Highest & lowest NAV 2018 2019 2020
High 0.4975 0.4797 0.6174 Low 0.3818 0.3771 0.4002
Distribution by financial year 2019 2020 2021
Distribution (Sen) - 3.26 10.00 Distribution Yield (%) - 6.8 16.1
Asset/sector allocation No. Asset/sector name % NAV
1 Consumer Discretionary 26.3 2 Information Technology 21.9 3 Communication Services 12.2 4 Financials 12.0 5 Healthcare 7.3 6 Materials 6.4 7 Real Estate 5.1 8 Industrials 3.9 9 Consumer Staples 1.4 10 Cash & Cash Equivalents 3.4
Geographical allocation No. Geographical name % NAV
1 China 65.7 2 Taiwan 21.4 3 Hong Kong 9.5 4 Cash & Cash Equivalents 3.4
RM Class 3-year
Fund Volatility 18.1
Very High Lipper Analytics
16 Jun 21
44
July 2021 Factsheet Manulife Investment Greater China Fund Market Review Chinese equities were largely flat for the month. Offshore Chinese equities moved marginally higher while onshore China A-shares retreated. Capital flow wise, Northbound Stock Connect Program continued to register net inflow for the month albeit at a slower pace. Foreign ownership in A-shares has risen to an all-time high of 4.5%, up from 3.6% at end of 2019, and tripled the 1.5% in 2014 when Stock Connect was inaugurated. On the economic front, China manufacturing PMI edged down to 50.9 from 51.0 in May. China PPI reached 9.0% in May. Yet spillover effects to CPI stayed modest with May CPI standing at 1.3%. While the weak PPI-to-CPI pass-through relieved concerns on inflationary pressure, margin pressure in the mid-stream manufacturing segment continued to build up. Regulatory scrutiny on internet and e-commerce remains as an overhang of the mega-cap names in the related sectors. Hong Kong equity moved lower for the month despite economic activities continued to pick up. Taiwan’s equity market fell moved marginally higher as a partial relief from the drawdown in May where a spike in COVID cases was reported. Fund Review The Fund gained in the month and outperformed its benchmark. Stock selection in information technology and real estate added most value while consumer discretionary offset part of the gains. The Fund’s China A-shares holdings continued to contribute positively. Strategy-wise, we have selectively added exposure in semiconductor companies in Taiwan. Regarding individual holdings, the Fund’s exposure in an auto component maker contributed most to relative performance. The company focuses on auto safety and assisted driving systems. The stock price reacted positively to its plans to launch autonomous driving products with two leading domestic smart driving technology-related companies. Another key contributor is a semiconductor company which has benefitted from the supply tightness and uptrend in average selling prices. The company has also secured extra capacity from its foundry partners and is expected to benefit from the robust demand for the coming quarters. On the detractor side, the Fund’s exposure in two education groups detracted from performance. The Fund’s position in a media and art training group announced an acquisition of an independent college specialized in professional sports training. As sports and Olympic-centric type of private training is less common, market has discounted the revenue growth and breakeven point of the acquisition and the stock reacted negatively to the news. Another detractor is an after-school tutoring company which continue to suffer from regulatory headwind. The current valuation is undemanding, and we believe the company can benefit should the sector consolidate. Market Outlook In the second half of 2021, we expect Greater China equities performance will be more balanced across sectors and style. We expect market volatility may stay in the near term and are mindful of policy risks. We continue to construct a balanced portfolio in terms of growth theme and share type exposure. We believe the Fund’s flexible allocation between markets can further add value to investors looking for exposure for Greater China’s structural growth from a holistic perspective. In the near team, we focus on companies which have product differentiation and pricing power to pass on cost inflation. For consumption upgrade, we remain positive on services and lifestyle related opportunities which enjoy inelastic demand. Property management and tertiary education & vocational training are some examples. For innovation, we expect the current manufacturing capex upcycle to continue for the next few quarters and we are positive on industrial automation. Strategic priority segments such as modern machinery, robotics, and high-tech semiconductor equipment shall enjoy policy tailwinds and R&D support. We also see opportunities in growth-oriented commodities used in battery storage and renewal energy that can bode well under the substantiality initiatives of China. Moreover, we anticipate more home-grown innovation in biotech to start bearing fruits. The Fund is well positioned to capture quality biotech companies with strong pipelines and the R&D value chain which can extract growth from the segment. Longer term, China has set its target on carbon peak emission by 2030 and carbon neutralization by 2060. Electric vehicle (EV) development is expected to stay as a key sustainability initiative and enjoy policy tailwind. China is already the largest electric vehicle by sales volume globally and accounts for more than half of the world’s EV battery manufacturing. We see a rich opportunity set for the entire EV and smart car value chain, thanks to robust domestic demand and the local industry’s increasing presence in the global EV supply chain. For Taiwan, we are positive on semiconductor and also electric vehicle supply chain, given a robust new-product cycle in the tech sector and strong demand for 5G devices and power related solutions. Based on the Fund's portfolio returns as at 31 May 2021 the Volatility Factor (VF) for the Fund is as indicated in the table above and are classified as in the table (source: Lipper). "Very High" includes Funds with VF that are above 17.190, "High" includes Funds with VF that are above 14.310 but not more than 17.190, "Moderate" includes Funds with VF that are above 10.755 but not more than 14.310, "Low" includes Funds with VF that are above 3.645 but not more than 10.755 and "Very Low" includes Funds with VF that are above 0.000 but not more than 3.645 (source:FiMM). The VF means there is a possibility for the Funds in generating an upside return or downside return around this VF. The Volatility Class (VC) is assigned by Lipper based on quintile ranks of VF for qualified Funds. VF and VC are subject to monthly revision or at any interval which may be prescribed by FIMM from time to time. The Fund's portfolio may have changed since this date and there is no guarantee that the Funds will continue to have the same VF or VC in the future. Presently, only Funds launched in the market for at least 36 months will display the VF and its VC. The above information has not been reviewed by the SC and is subject to the relevant warning, disclaimer, qualification or terms and conditions stated herein. Investors are advised to read and understand the contents of the Master Prospectus dated 10 August 2020 and its First Supplemental Master Prospectus dated 10 August 2020 and its Second Supplemental Master Prospectus dated 27 January 2021 and its Third Supplemental Master Prospectus dated 5 April 2021 and all the respective Product Highlights Sheet(s) (collectively, the “Offering Documents”), obtainable at our offices or website, before investing. The Offering Documents have been registered with the Securities Commission Malaysia (SC), however the registration with the SC does not amount to nor indicate that the SC has recommended or endorsed the product. Where a unit split/distribution is declared, investors are advised that following the issue of additional units/distribution, the NAV per unit will be reduced from the pre-unit split NAV/cum-distribution NAV to post-unit split NAV/ex-distribution NAV; and where a unit split is declared, the value of your investment in the Fund’s denominated currency will remained unchanged after the distribution of the additional units. Past performances are not an indication of future performances. There are risks involved with investing in unit trust funds; wholesale funds and/or Private Retirement Schemes. Some of these risks associated with investments in unit trust funds; wholesale funds and/or Private Retirement Schemes are interest rate fluctuation risk, foreign exchange or currency risk, country risk, political risk, credit risk, non-compliance risk, counterparty risk, target fund manager risk, liquidity risk and interest rate risk. For further details on the risk profile of all the funds, please refer to the Risk Factors section in the Offering Documents. The price of units and income distribution may go down as well as up. Investors should compare and consider the fees, charges and costs involved. Investors are advised to conduct own risk assessment and consult the professional advisers if in doubt on the action to be taken.
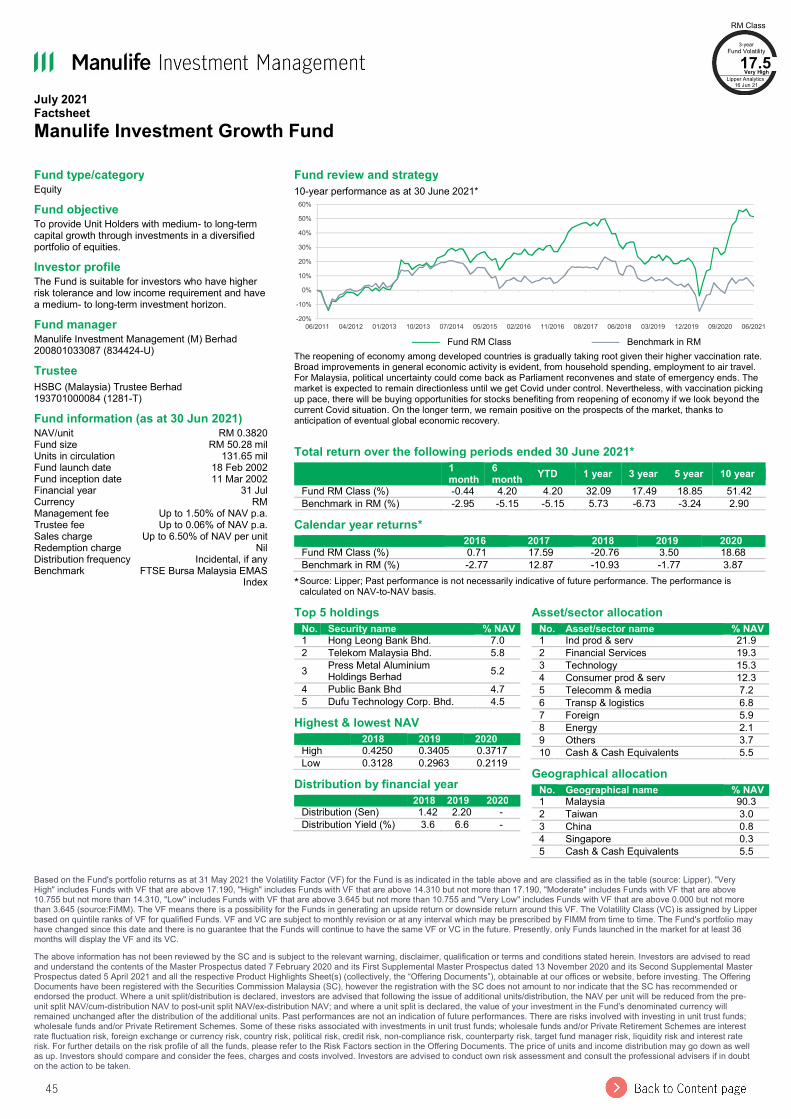
45
July 2021 Factsheet Manulife Investment Growth Fund
Based on the Fund's portfolio returns as at 31 May 2021 the Volatility Factor (VF) for the Fund is as indicated in the table above and are classified as in the table (source: Lipper). "Very High" includes Funds with VF that are above 17.190, "High" includes Funds with VF that are above 14.310 but not more than 17.190, "Moderate" includes Funds with VF that are above 10.755 but not more than 14.310, "Low" includes Funds with VF that are above 3.645 but not more than 10.755 and "Very Low" includes Funds with VF that are above 0.000 but not more than 3.645 (source:FiMM). The VF means there is a possibility for the Funds in generating an upside return or downside return around this VF. The Volatility Class (VC) is assigned by Lipper based on quintile ranks of VF for qualified Funds. VF and VC are subject to monthly revision or at any interval which may be prescribed by FIMM from time to time. The Fund's portfolio may have changed since this date and there is no guarantee that the Funds will continue to have the same VF or VC in the future. Presently, only Funds launched in the market for at least 36 months will display the VF and its VC. The above information has not been reviewed by the SC and is subject to the relevant warning, disclaimer, qualification or terms and conditions stated herein. Investors are advised to read and understand the contents of the Master Prospectus dated 7 February 2020 and its First Supplemental Master Prospectus dated 13 November 2020 and its Second Supplemental Master Prospectus dated 5 April 2021 and all the respective Product Highlights Sheet(s) (collectively, the “Offering Documents”), obtainable at our offices or website, before investing. The Offering Documents have been registered with the Securities Commission Malaysia (SC), however the registration with the SC does not amount to nor indicate that the SC has recommended or endorsed the product. Where a unit split/distribution is declared, investors are advised that following the issue of additional units/distribution, the NAV per unit will be reduced from the pre-unit split NAV/cum-distribution NAV to post-unit split NAV/ex-distribution NAV; and where a unit split is declared, the value of your investment in the Fund’s denominated currency will remained unchanged after the distribution of the additional units. Past performances are not an indication of future performances. There are risks involved with investing in unit trust funds; wholesale funds and/or Private Retirement Schemes. Some of these risks associated with investments in unit trust funds; wholesale funds and/or Private Retirement Schemes are interest rate fluctuation risk, foreign exchange or currency risk, country risk, political risk, credit risk, non-compliance risk, counterparty risk, target fund manager risk, liquidity risk and interest rate risk. For further details on the risk profile of all the funds, please refer to the Risk Factors section in the Offering Documents. The price of units and income distribution may go down as well as up. Investors should compare and consider the fees, charges and costs involved. Investors are advised to conduct own risk assessment and consult the professional advisers if in doubt on the action to be taken.
Fund type/category Equity Fund objective To provide Unit Holders with medium- to long-term capital growth through investments in a diversified portfolio of equities. Investor profile The Fund is suitable for investors who have higher risk tolerance and low income requirement and have a medium- to long-term investment horizon. Fund manager Manulife Investment Management (M) Berhad 200801033087 (834424-U) Trustee HSBC (Malaysia) Trustee Berhad 193701000084 (1281-T) Fund information (as at 30 Jun 2021) NAV/unit RM 0.3820 Fund size RM 50.28 mil Units in circulation 131.65 mil Fund launch date 18 Feb 2002 Fund inception date 11 Mar 2002 Financial year 31 Jul Currency RM Management fee Up to 1.50% of NAV p.a. Trustee fee Up to 0.06% of NAV p.a. Sales charge Up to 6.50% of NAV per unit Redemption charge Nil Distribution frequency Incidental, if any Benchmark FTSE Bursa Malaysia EMAS
Index
Fund review and strategy 10-year performance as at 30 June 2021*
——— Fund RM Class ——— Benchmark in RM
The reopening of economy among developed countries is gradually taking root given their higher vaccination rate. Broad improvements in general economic activity is evident, from household spending, employment to air travel. For Malaysia, political uncertainty could come back as Parliament reconvenes and state of emergency ends. The market is expected to remain directionless until we get Covid under control. Nevertheless, with vaccination picking up pace, there will be buying opportunities for stocks benefiting from reopening of economy if we look beyond the current Covid situation. On the longer term, we remain positive on the prospects of the market, thanks to anticipation of eventual global economic recovery.
Total return over the following periods ended 30 June 2021*
1 month
6 month YTD 1 year 3 year 5 year 10 year
Fund RM Class (%) -0.44 4.20 4.20 32.09 17.49 18.85 51.42 Benchmark in RM (%) -2.95 -5.15 -5.15 5.73 -6.73 -3.24 2.90
Calendar year returns* 2016 2017 2018 2019 2020
Fund RM Class (%) 0.71 17.59 -20.76 3.50 18.68 Benchmark in RM (%) -2.77 12.87 -10.93 -1.77 3.87
* Source: Lipper; Past performance is not necessarily indicative of future performance. The performance is calculated on NAV-to-NAV basis.
-20%
-10%
0%
10%
20%
30%
40%
50%
60%
06/2011 04/2012 01/2013 10/2013 07/2014 05/2015 02/2016 11/2016 08/2017 06/2018 03/2019 12/2019 09/2020 06/2021
Top 5 holdings No. Security name % NAV
1 Hong Leong Bank Bhd. 7.0 2 Telekom Malaysia Bhd. 5.8 3 Press Metal Aluminium
Holdings Berhad 5.2 4 Public Bank Bhd 4.7 5 Dufu Technology Corp. Bhd. 4.5
Highest & lowest NAV 2018 2019 2020
High 0.4250 0.3405 0.3717 Low 0.3128 0.2963 0.2119
Distribution by financial year 2018 2019 2020
Distribution (Sen) 1.42 2.20 - Distribution Yield (%) 3.6 6.6 -
Asset/sector allocation No. Asset/sector name % NAV
1 Ind prod & serv 21.9 2 Financial Services 19.3 3 Technology 15.3 4 Consumer prod & serv 12.3 5 Telecomm & media 7.2 6 Transp & logistics 6.8 7 Foreign 5.9 8 Energy 2.1 9 Others 3.7 10 Cash & Cash Equivalents 5.5
Geographical allocation No. Geographical name % NAV
1 Malaysia 90.3 2 Taiwan 3.0 3 China 0.8 4 Singapore 0.3 5 Cash & Cash Equivalents 5.5
RM Class 3-year
Fund Volatility 17.5
Very High Lipper Analytics
16 Jun 21

46
July 2021 Factsheet Manulife Investment Indonesia Equity Fund
Fund type/category Equity Fund objective The Fund seeks to achieve capital appreciation over the long term through investments in equities and equity-related instruments predominantly in Indonesia market. Investor profile The Fund is suitable for investors who wish to participate in the Indonesia equity market. It is also suitable for investors who seek capital appreciation over the long term and for investors who are willing to accept a high level of risk. Fund manager Manulife Investment Management (Hong Kong) Limited Trustee HSBC (Malaysia) Trustee Berhad 193701000084 (1281-T) Fund information (as at 30 Jun 2021) NAV/unit RM 0.2077 Fund size RM 18.12 mil Units in circulation 87.25 mil Fund launch date 19 Oct 2010 Fund inception date 09 Nov 2010 Financial year 31 Aug Currency RM Management fee Up to 1.80% of NAV p.a. Trustee fee Up to 0.06% of NAV p.a.
excluding foreign custodian fees and charges
Sales charge Up to 6.50% of NAV per unit Redemption charge Nil Distribution frequency Incidental, if any Benchmark Jakarta Composite Index
Fund review and strategy 10-year performance as at 30 June 2021*
——— Fund RM Class ——— Benchmark in RM
The Indonesian equity market was marginally higher for the month despite a notable increase in the number of COVID-19 cases that led to further lockdowns. Coupled with a hawkish Federal Reserve statement, the Rupiah weakened. To position our portfolio, the Fund will add exposure in consumption and financial sectors amid city reopen and recovery stage, and companies with strong cash flows and robust balance sheets. Our investments are chosen on the basis of value, not popularity.
Total return over the following periods ended 30 June 2021*
1 month
6 month YTD 1 year 3 year 5 year 10 year
Fund RM Class (%) 9.55 23.85 23.85 49.64 18.75 18.75 -15.91 Benchmark in RM (%) -0.24 0.11 0.11 16.46 4.83 11.95 25.16
Calendar year returns* 2016 2017 2018 2019 2020
Fund RM Class (%) 16.36 4.97 -11.03 0.23 -5.31 Benchmark in RM (%) 23.29 7.49 -6.10 4.27 -7.78
* Source: Lipper; Past performance is not necessarily indicative of future performance. The performance is calculated on NAV-to-NAV basis.
-60%-50%-40%-30%-20%-10%
0%10%20%30%40%50%
06/2011 04/2012 01/2013 10/2013 07/2014 05/2015 02/2016 11/2016 08/2017 06/2018 03/2019 12/2019 09/2020 06/2021
Top 5 holdings No. Security name % NAV
1 PT DCI Indonesia Tbk 9.0 2 PT Bank Central Asia Tbk 7.7 3 PT Bank Rakyat Indonesia
(Persero) Tbk Class B 6.9 4 PT Bank Jago Tbk 6.7 5 PT Bank Aladin Syariah Tbk 6.4
Highest & lowest NAV 2018 2019 2020
High 0.2076 0.1948 0.1842 Low 0.1586 0.1687 0.0940
Distribution by financial year 2018 2019 2020
Distribution (Sen) - - - Distribution Yield (%) - - -
Asset/sector allocation No. Asset/sector name % NAV
1 Financials 42.7 2 Information Technology 17.3 3 Communication Services 12.1 4 Healthcare 7.2 5 Consumer Discretionary 6.5 6 Consumer Staples 6.1 7 Materials 4.2 8 Industrials 1.9 9 Others 2.5 10 Cash & Cash Equivalents -0.5
Geographical allocation No. Geographical name % NAV
1 Indonesia 100.5 2 Cash & Cash Equivalents -0.5
RM Class 3-year
Fund Volatility 27.2
Very High Lipper Analytics
16 Jun 21
47
July 2021 Factsheet Manulife Investment Indonesia Equity Fund Market Review The Indonesian equity market was marginally higher for the month despite a notable increase in the number of COVID-19 cases that led to further lockdowns. Coupled with a hawkish Federal Reserve statement, the Rupiah weakened. Fund Review The Fund outperformed the benchmark during the month. Stock selection and asset allocation decisions contributed positively to relative performance. Stock selection in consumer staples, financials and consumer discretionary and the overweight to technology were the primary drivers of outperformance. Detracting from performance was stock selection in technology, real estate and energy. Market Outlook With continued expansionary fiscal policy in 2021, based on a government target of 5.7% of GDP, the key focus will be towards spending on infrastructure and social safety aid. As of 2019, around 90 out of 245 National Strategic Projects (NSP) had been completed, with the remainder expected in 2021; after being deferred in 2020 due to COVID-19. The prospect for the pace of economic activity to increase should also lead to higher employment and a general positive outlook for the economy going forward. For 2021, we focus on consumption, corporate restocking and net exports to benefit from unwinding of restrictions alongside favourable base effects, while slower fiscal support and direction of the pandemic curve are risks to the outlook. The recast window for corporates and deferred Banks’ non-performing loans classification to provide some succour to the banking system in the near-term. Into 2021, besides the pandemic, focus will also be on expanding manufacturing and investment footprint via the recently passed Omnibus Bill and finalisation of the Regional Comprehensive Economic Partnership (RCEP) multilateral agreement. Foreign direct investments (FDI) will be improving in 2021 as government encourage foreign investors to invest the whole production chain of electric vehicle in Indonesia. Foreign investors are venture into transportation, telecommunication, base metal, non-machinery & equipment industry, and consumer staple industry. Indonesia’s forex reserves remained healthy at US$136bn by end of May 2021, supported by higher oil & gas sales revenue, benign trade surplus and subdued import. The current reserves level is estimated to be sufficient to support more than 9 months of imports and payments of the government’s short-term debts. To position our portfolio, the Fund will add exposure in ecommerce, industrial, and financial sectors for a new opportunity of middle-income class spending power increase as well as financial industry reshape. Our investments are chosen on the basis of value and growth, not popularity. We focus on the balance of return and safety of the portfolio. Understanding how investors are thinking about and dealing with risk is perhaps the most important thing to strive for. In short, excessive risk tolerance contributes to the creation of danger, and the swing to excessive risk aversion depresses markets, creating some of the greatest buying opportunities. Based on the Fund's portfolio returns as at 31 May 2021 the Volatility Factor (VF) for the Fund is as indicated in the table above and are classified as in the table (source: Lipper). "Very High" includes Funds with VF that are above 17.190, "High" includes Funds with VF that are above 14.310 but not more than 17.190, "Moderate" includes Funds with VF that are above 10.755 but not more than 14.310, "Low" includes Funds with VF that are above 3.645 but not more than 10.755 and "Very Low" includes Funds with VF that are above 0.000 but not more than 3.645 (source:FiMM). The VF means there is a possibility for the Funds in generating an upside return or downside return around this VF. The Volatility Class (VC) is assigned by Lipper based on quintile ranks of VF for qualified Funds. VF and VC are subject to monthly revision or at any interval which may be prescribed by FIMM from time to time. The Fund's portfolio may have changed since this date and there is no guarantee that the Funds will continue to have the same VF or VC in the future. Presently, only Funds launched in the market for at least 36 months will display the VF and its VC. The above information has not been reviewed by the SC and is subject to the relevant warning, disclaimer, qualification or terms and conditions stated herein. Investors are advised to read and understand the contents of the Master Prospectus dated 10 August 2020 and its First Supplemental Master Prospectus dated 10 August 2020 and its Second Supplemental Master Prospectus dated 27 January 2021 and its Third Supplemental Master Prospectus dated 5 April 2021 and all the respective Product Highlights Sheet(s) (collectively, the “Offering Documents”), obtainable at our offices or website, before investing. The Offering Documents have been registered with the Securities Commission Malaysia (SC), however the registration with the SC does not amount to nor indicate that the SC has recommended or endorsed the product. Where a unit split/distribution is declared, investors are advised that following the issue of additional units/distribution, the NAV per unit will be reduced from the pre-unit split NAV/cum-distribution NAV to post-unit split NAV/ex-distribution NAV; and where a unit split is declared, the value of your investment in the Fund’s denominated currency will remained unchanged after the distribution of the additional units. Past performances are not an indication of future performances. There are risks involved with investing in unit trust funds; wholesale funds and/or Private Retirement Schemes. Some of these risks associated with investments in unit trust funds; wholesale funds and/or Private Retirement Schemes are interest rate fluctuation risk, foreign exchange or currency risk, country risk, political risk, credit risk, non-compliance risk, counterparty risk, target fund manager risk, liquidity risk and interest rate risk. For further details on the risk profile of all the funds, please refer to the Risk Factors section in the Offering Documents. The price of units and income distribution may go down as well as up. Investors should compare and consider the fees, charges and costs involved. Investors are advised to conduct own risk assessment and consult the professional advisers if in doubt on the action to be taken.
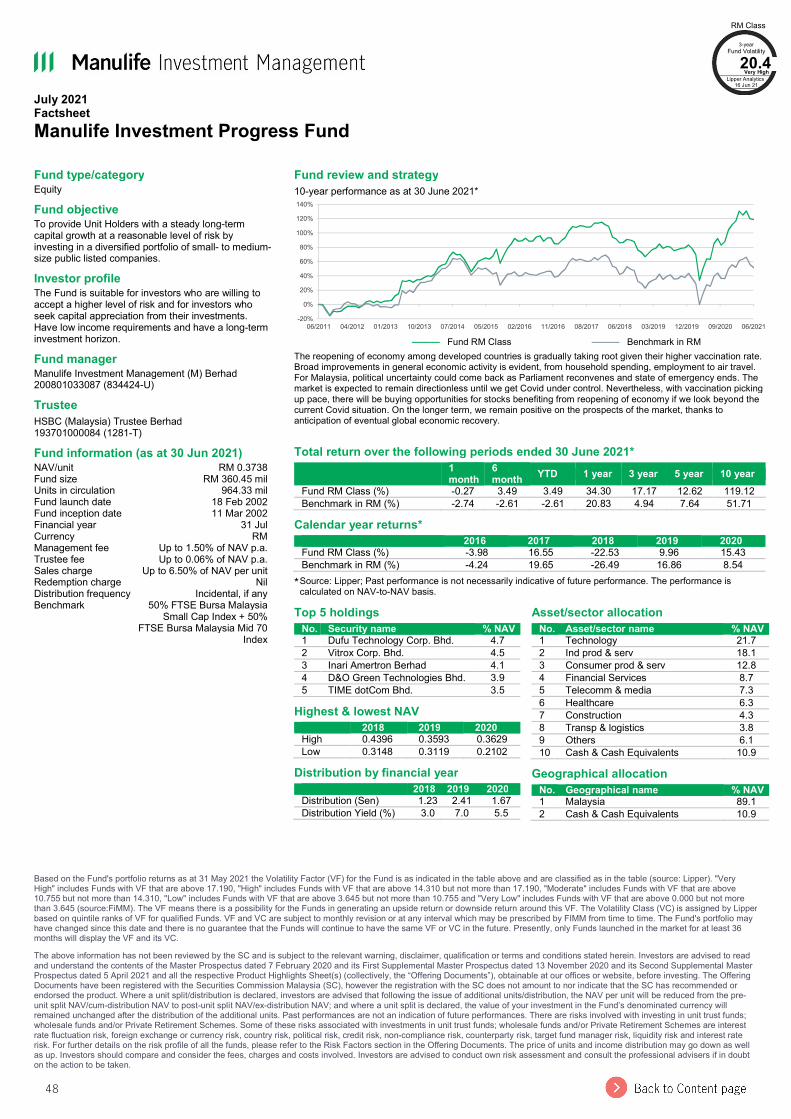
48
July 2021 Factsheet Manulife Investment Progress Fund
Based on the Fund's portfolio returns as at 31 May 2021 the Volatility Factor (VF) for the Fund is as indicated in the table above and are classified as in the table (source: Lipper). "Very High" includes Funds with VF that are above 17.190, "High" includes Funds with VF that are above 14.310 but not more than 17.190, "Moderate" includes Funds with VF that are above 10.755 but not more than 14.310, "Low" includes Funds with VF that are above 3.645 but not more than 10.755 and "Very Low" includes Funds with VF that are above 0.000 but not more than 3.645 (source:FiMM). The VF means there is a possibility for the Funds in generating an upside return or downside return around this VF. The Volatility Class (VC) is assigned by Lipper based on quintile ranks of VF for qualified Funds. VF and VC are subject to monthly revision or at any interval which may be prescribed by FIMM from time to time. The Fund's portfolio may have changed since this date and there is no guarantee that the Funds will continue to have the same VF or VC in the future. Presently, only Funds launched in the market for at least 36 months will display the VF and its VC. The above information has not been reviewed by the SC and is subject to the relevant warning, disclaimer, qualification or terms and conditions stated herein. Investors are advised to read and understand the contents of the Master Prospectus dated 7 February 2020 and its First Supplemental Master Prospectus dated 13 November 2020 and its Second Supplemental Master Prospectus dated 5 April 2021 and all the respective Product Highlights Sheet(s) (collectively, the “Offering Documents”), obtainable at our offices or website, before investing. The Offering Documents have been registered with the Securities Commission Malaysia (SC), however the registration with the SC does not amount to nor indicate that the SC has recommended or endorsed the product. Where a unit split/distribution is declared, investors are advised that following the issue of additional units/distribution, the NAV per unit will be reduced from the pre-unit split NAV/cum-distribution NAV to post-unit split NAV/ex-distribution NAV; and where a unit split is declared, the value of your investment in the Fund’s denominated currency will remained unchanged after the distribution of the additional units. Past performances are not an indication of future performances. There are risks involved with investing in unit trust funds; wholesale funds and/or Private Retirement Schemes. Some of these risks associated with investments in unit trust funds; wholesale funds and/or Private Retirement Schemes are interest rate fluctuation risk, foreign exchange or currency risk, country risk, political risk, credit risk, non-compliance risk, counterparty risk, target fund manager risk, liquidity risk and interest rate risk. For further details on the risk profile of all the funds, please refer to the Risk Factors section in the Offering Documents. The price of units and income distribution may go down as well as up. Investors should compare and consider the fees, charges and costs involved. Investors are advised to conduct own risk assessment and consult the professional advisers if in doubt on the action to be taken.
Fund type/category Equity Fund objective To provide Unit Holders with a steady long-term capital growth at a reasonable level of risk by investing in a diversified portfolio of small- to medium-size public listed companies. Investor profile The Fund is suitable for investors who are willing to accept a higher level of risk and for investors who seek capital appreciation from their investments. Have low income requirements and have a long-term investment horizon. Fund manager Manulife Investment Management (M) Berhad 200801033087 (834424-U) Trustee HSBC (Malaysia) Trustee Berhad 193701000084 (1281-T) Fund information (as at 30 Jun 2021) NAV/unit RM 0.3738 Fund size RM 360.45 mil Units in circulation 964.33 mil Fund launch date 18 Feb 2002 Fund inception date 11 Mar 2002 Financial year 31 Jul Currency RM Management fee Up to 1.50% of NAV p.a. Trustee fee Up to 0.06% of NAV p.a. Sales charge Up to 6.50% of NAV per unit Redemption charge Nil Distribution frequency Incidental, if any Benchmark 50% FTSE Bursa Malaysia
Small Cap Index + 50% FTSE Bursa Malaysia Mid 70
Index
Fund review and strategy 10-year performance as at 30 June 2021*
——— Fund RM Class ——— Benchmark in RM
The reopening of economy among developed countries is gradually taking root given their higher vaccination rate. Broad improvements in general economic activity is evident, from household spending, employment to air travel. For Malaysia, political uncertainty could come back as Parliament reconvenes and state of emergency ends. The market is expected to remain directionless until we get Covid under control. Nevertheless, with vaccination picking up pace, there will be buying opportunities for stocks benefiting from reopening of economy if we look beyond the current Covid situation. On the longer term, we remain positive on the prospects of the market, thanks to anticipation of eventual global economic recovery.
Total return over the following periods ended 30 June 2021*
1 month
6 month YTD 1 year 3 year 5 year 10 year
Fund RM Class (%) -0.27 3.49 3.49 34.30 17.17 12.62 119.12 Benchmark in RM (%) -2.74 -2.61 -2.61 20.83 4.94 7.64 51.71
Calendar year returns* 2016 2017 2018 2019 2020
Fund RM Class (%) -3.98 16.55 -22.53 9.96 15.43 Benchmark in RM (%) -4.24 19.65 -26.49 16.86 8.54
* Source: Lipper; Past performance is not necessarily indicative of future performance. The performance is calculated on NAV-to-NAV basis.
-20%
0%
20%
40%
60%
80%
100%
120%
140%
06/2011 04/2012 01/2013 10/2013 07/2014 05/2015 02/2016 11/2016 08/2017 06/2018 03/2019 12/2019 09/2020 06/2021
Top 5 holdings No. Security name % NAV
1 Dufu Technology Corp. Bhd. 4.7 2 Vitrox Corp. Bhd. 4.5 3 Inari Amertron Berhad 4.1 4 D&O Green Technologies Bhd. 3.9 5 TIME dotCom Bhd. 3.5
Highest & lowest NAV 2018 2019 2020
High 0.4396 0.3593 0.3629 Low 0.3148 0.3119 0.2102
Distribution by financial year 2018 2019 2020
Distribution (Sen) 1.23 2.41 1.67 Distribution Yield (%) 3.0 7.0 5.5
Asset/sector allocation No. Asset/sector name % NAV
1 Technology 21.7 2 Ind prod & serv 18.1 3 Consumer prod & serv 12.8 4 Financial Services 8.7 5 Telecomm & media 7.3 6 Healthcare 6.3 7 Construction 4.3 8 Transp & logistics 3.8 9 Others 6.1 10 Cash & Cash Equivalents 10.9
Geographical allocation No. Geographical name % NAV
1 Malaysia 89.1 2 Cash & Cash Equivalents 10.9
RM Class 3-year
Fund Volatility 20.4
Very High Lipper Analytics
16 Jun 21
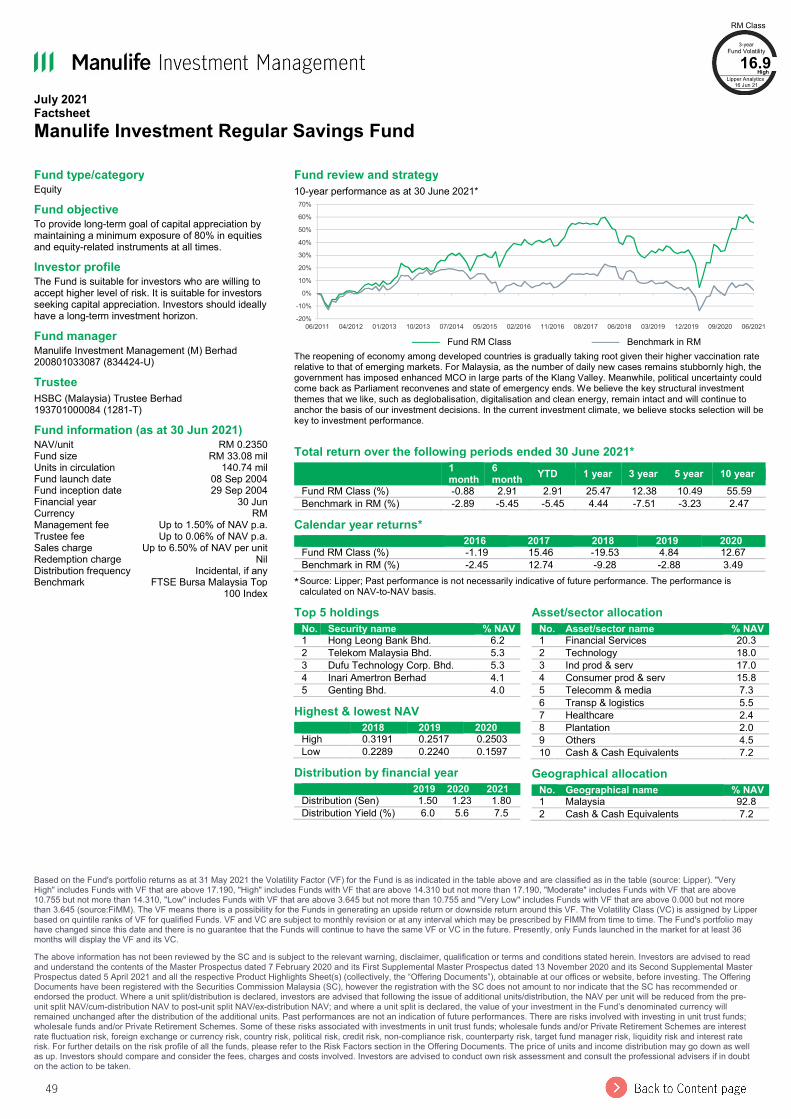
49
July 2021 Factsheet Manulife Investment Regular Savings Fund
Based on the Fund's portfolio returns as at 31 May 2021 the Volatility Factor (VF) for the Fund is as indicated in the table above and are classified as in the table (source: Lipper). "Very High" includes Funds with VF that are above 17.190, "High" includes Funds with VF that are above 14.310 but not more than 17.190, "Moderate" includes Funds with VF that are above 10.755 but not more than 14.310, "Low" includes Funds with VF that are above 3.645 but not more than 10.755 and "Very Low" includes Funds with VF that are above 0.000 but not more than 3.645 (source:FiMM). The VF means there is a possibility for the Funds in generating an upside return or downside return around this VF. The Volatility Class (VC) is assigned by Lipper based on quintile ranks of VF for qualified Funds. VF and VC are subject to monthly revision or at any interval which may be prescribed by FIMM from time to time. The Fund's portfolio may have changed since this date and there is no guarantee that the Funds will continue to have the same VF or VC in the future. Presently, only Funds launched in the market for at least 36 months will display the VF and its VC. The above information has not been reviewed by the SC and is subject to the relevant warning, disclaimer, qualification or terms and conditions stated herein. Investors are advised to read and understand the contents of the Master Prospectus dated 7 February 2020 and its First Supplemental Master Prospectus dated 13 November 2020 and its Second Supplemental Master Prospectus dated 5 April 2021 and all the respective Product Highlights Sheet(s) (collectively, the “Offering Documents”), obtainable at our offices or website, before investing. The Offering Documents have been registered with the Securities Commission Malaysia (SC), however the registration with the SC does not amount to nor indicate that the SC has recommended or endorsed the product. Where a unit split/distribution is declared, investors are advised that following the issue of additional units/distribution, the NAV per unit will be reduced from the pre-unit split NAV/cum-distribution NAV to post-unit split NAV/ex-distribution NAV; and where a unit split is declared, the value of your investment in the Fund’s denominated currency will remained unchanged after the distribution of the additional units. Past performances are not an indication of future performances. There are risks involved with investing in unit trust funds; wholesale funds and/or Private Retirement Schemes. Some of these risks associated with investments in unit trust funds; wholesale funds and/or Private Retirement Schemes are interest rate fluctuation risk, foreign exchange or currency risk, country risk, political risk, credit risk, non-compliance risk, counterparty risk, target fund manager risk, liquidity risk and interest rate risk. For further details on the risk profile of all the funds, please refer to the Risk Factors section in the Offering Documents. The price of units and income distribution may go down as well as up. Investors should compare and consider the fees, charges and costs involved. Investors are advised to conduct own risk assessment and consult the professional advisers if in doubt on the action to be taken.
Fund type/category Equity Fund objective To provide long-term goal of capital appreciation by maintaining a minimum exposure of 80% in equities and equity-related instruments at all times. Investor profile The Fund is suitable for investors who are willing to accept higher level of risk. It is suitable for investors seeking capital appreciation. Investors should ideally have a long-term investment horizon. Fund manager Manulife Investment Management (M) Berhad 200801033087 (834424-U) Trustee HSBC (Malaysia) Trustee Berhad 193701000084 (1281-T) Fund information (as at 30 Jun 2021) NAV/unit RM 0.2350 Fund size RM 33.08 mil Units in circulation 140.74 mil Fund launch date 08 Sep 2004 Fund inception date 29 Sep 2004 Financial year 30 Jun Currency RM Management fee Up to 1.50% of NAV p.a. Trustee fee Up to 0.06% of NAV p.a. Sales charge Up to 6.50% of NAV per unit Redemption charge Nil Distribution frequency Incidental, if any Benchmark FTSE Bursa Malaysia Top
100 Index
Fund review and strategy 10-year performance as at 30 June 2021*
——— Fund RM Class ——— Benchmark in RM
The reopening of economy among developed countries is gradually taking root given their higher vaccination rate relative to that of emerging markets. For Malaysia, as the number of daily new cases remains stubbornly high, the government has imposed enhanced MCO in large parts of the Klang Valley. Meanwhile, political uncertainty could come back as Parliament reconvenes and state of emergency ends. We believe the key structural investment themes that we like, such as deglobalisation, digitalisation and clean energy, remain intact and will continue to anchor the basis of our investment decisions. In the current investment climate, we believe stocks selection will be key to investment performance.
Total return over the following periods ended 30 June 2021*
1 month
6 month YTD 1 year 3 year 5 year 10 year
Fund RM Class (%) -0.88 2.91 2.91 25.47 12.38 10.49 55.59 Benchmark in RM (%) -2.89 -5.45 -5.45 4.44 -7.51 -3.23 2.47
Calendar year returns* 2016 2017 2018 2019 2020
Fund RM Class (%) -1.19 15.46 -19.53 4.84 12.67 Benchmark in RM (%) -2.45 12.74 -9.28 -2.88 3.49
* Source: Lipper; Past performance is not necessarily indicative of future performance. The performance is calculated on NAV-to-NAV basis.
-20%
-10%
0%
10%
20%
30%
40%
50%
60%
70%
06/2011 04/2012 01/2013 10/2013 07/2014 05/2015 02/2016 11/2016 08/2017 06/2018 03/2019 12/2019 09/2020 06/2021
Top 5 holdings No. Security name % NAV
1 Hong Leong Bank Bhd. 6.2 2 Telekom Malaysia Bhd. 5.3 3 Dufu Technology Corp. Bhd. 5.3 4 Inari Amertron Berhad 4.1 5 Genting Bhd. 4.0
Highest & lowest NAV 2018 2019 2020
High 0.3191 0.2517 0.2503 Low 0.2289 0.2240 0.1597
Distribution by financial year 2019 2020 2021
Distribution (Sen) 1.50 1.23 1.80 Distribution Yield (%) 6.0 5.6 7.5
Asset/sector allocation No. Asset/sector name % NAV
1 Financial Services 20.3 2 Technology 18.0 3 Ind prod & serv 17.0 4 Consumer prod & serv 15.8 5 Telecomm & media 7.3 6 Transp & logistics 5.5 7 Healthcare 2.4 8 Plantation 2.0 9 Others 4.5 10 Cash & Cash Equivalents 7.2
Geographical allocation No. Geographical name % NAV
1 Malaysia 92.8 2 Cash & Cash Equivalents 7.2
RM Class 3-year
Fund Volatility 16.9
High Lipper Analytics
16 Jun 21
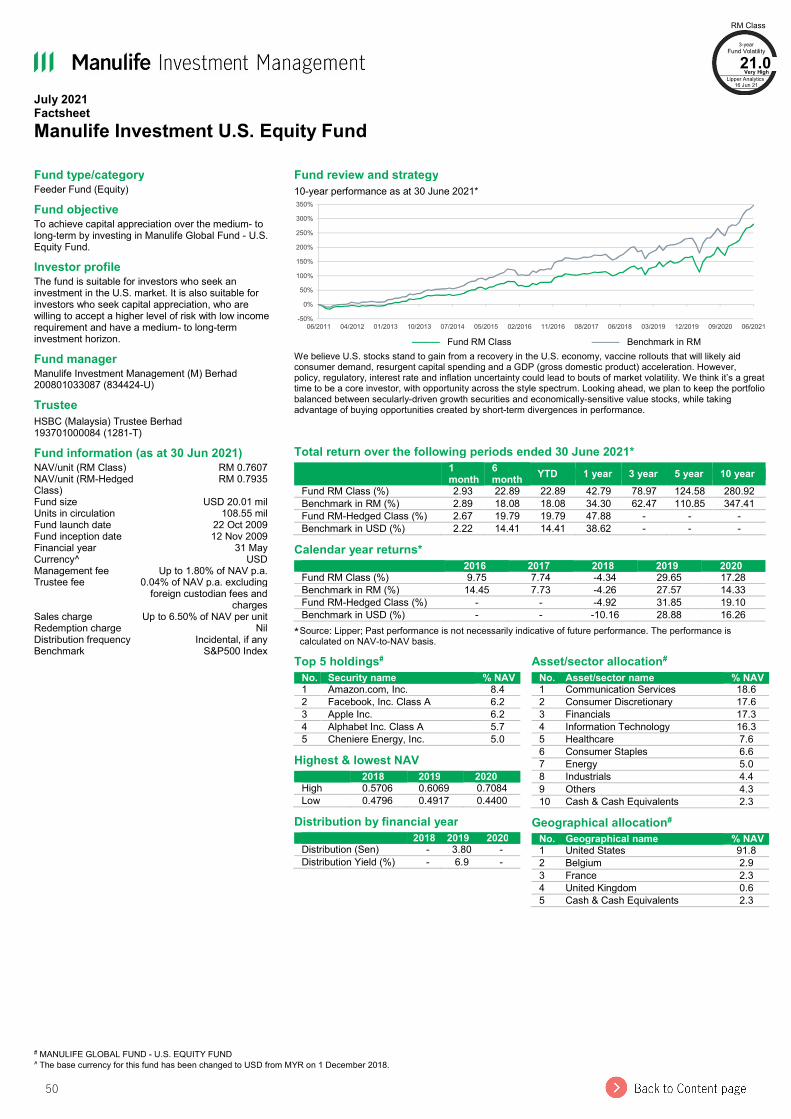
50
July 2021 Factsheet Manulife Investment U.S. Equity Fund
# MANULIFE GLOBAL FUND - U.S. EQUITY FUND ^ The base currency for this fund has been changed to USD from MYR on 1 December 2018.
Fund type/category Feeder Fund (Equity) Fund objective To achieve capital appreciation over the medium- to long-term by investing in Manulife Global Fund - U.S. Equity Fund. Investor profile The fund is suitable for investors who seek an investment in the U.S. market. It is also suitable for investors who seek capital appreciation, who are willing to accept a higher level of risk with low income requirement and have a medium- to long-term investment horizon. Fund manager Manulife Investment Management (M) Berhad 200801033087 (834424-U) Trustee HSBC (Malaysia) Trustee Berhad 193701000084 (1281-T) Fund information (as at 30 Jun 2021) NAV/unit (RM Class) RM 0.7607 NAV/unit (RM-Hedged Class)
RM 0.7935 Fund size USD 20.01 mil Units in circulation 108.55 mil Fund launch date 22 Oct 2009 Fund inception date 12 Nov 2009 Financial year 31 May Currency^ USD Management fee Up to 1.80% of NAV p.a. Trustee fee 0.04% of NAV p.a. excluding
foreign custodian fees and charges
Sales charge Up to 6.50% of NAV per unit Redemption charge Nil Distribution frequency Incidental, if any Benchmark S&P500 Index
Fund review and strategy 10-year performance as at 30 June 2021*
——— Fund RM Class ——— Benchmark in RM
We believe U.S. stocks stand to gain from a recovery in the U.S. economy, vaccine rollouts that will likely aid consumer demand, resurgent capital spending and a GDP (gross domestic product) acceleration. However, policy, regulatory, interest rate and inflation uncertainty could lead to bouts of market volatility. We think it’s a great time to be a core investor, with opportunity across the style spectrum. Looking ahead, we plan to keep the portfolio balanced between secularly-driven growth securities and economically-sensitive value stocks, while taking advantage of buying opportunities created by short-term divergences in performance.
Total return over the following periods ended 30 June 2021*
1 month
6 month YTD 1 year 3 year 5 year 10 year
Fund RM Class (%) 2.93 22.89 22.89 42.79 78.97 124.58 280.92 Benchmark in RM (%) 2.89 18.08 18.08 34.30 62.47 110.85 347.41 Fund RM-Hedged Class (%) 2.67 19.79 19.79 47.88 - - - Benchmark in USD (%) 2.22 14.41 14.41 38.62 - - -
Calendar year returns* 2016 2017 2018 2019 2020
Fund RM Class (%) 9.75 7.74 -4.34 29.65 17.28 Benchmark in RM (%) 14.45 7.73 -4.26 27.57 14.33 Fund RM-Hedged Class (%) - - -4.92 31.85 19.10 Benchmark in USD (%) - - -10.16 28.88 16.26
* Source: Lipper; Past performance is not necessarily indicative of future performance. The performance is calculated on NAV-to-NAV basis.
-50%
0%
50%
100%
150%
200%
250%
300%
350%
06/2011 04/2012 01/2013 10/2013 07/2014 05/2015 02/2016 11/2016 08/2017 06/2018 03/2019 12/2019 09/2020 06/2021
Top 5 holdings# No. Security name % NAV
1 Amazon.com, Inc. 8.4 2 Facebook, Inc. Class A 6.2 3 Apple Inc. 6.2 4 Alphabet Inc. Class A 5.7 5 Cheniere Energy, Inc. 5.0
Highest & lowest NAV 2018 2019 2020
High 0.5706 0.6069 0.7084 Low 0.4796 0.4917 0.4400
Distribution by financial year 2018 2019 2020
Distribution (Sen) - 3.80 - Distribution Yield (%) - 6.9 -
Asset/sector allocation# No. Asset/sector name % NAV
1 Communication Services 18.6 2 Consumer Discretionary 17.6 3 Financials 17.3 4 Information Technology 16.3 5 Healthcare 7.6 6 Consumer Staples 6.6 7 Energy 5.0 8 Industrials 4.4 9 Others 4.3 10 Cash & Cash Equivalents 2.3
Geographical allocation# No. Geographical name % NAV
1 United States 91.8 2 Belgium 2.9 3 France 2.3 4 United Kingdom 0.6 5 Cash & Cash Equivalents 2.3
RM Class 3-year
Fund Volatility 21.0
Very High Lipper Analytics
16 Jun 21

51
July 2021 Factsheet Manulife Investment U.S. Equity Fund Market Review The U.S. stock market posted a modest – albeit choppy – advance in June. Growing confidence in the economic recovery and increased prospects that Congress could pass a bi-partisan infrastructure-spending bill helped lift the broad-based S&P 500 Index to new records. However, concerns about the pace of economic growth, the potential for higher inflation and interest rate hikes, plus the spread of the more-infectious Delta variant of COVID-19 made for an uneven return environment. Growth stocks led the market higher, as interest rates remained low and investors locked in year-to-date profits on value stocks. Within the S&P 500 Index, the Information Technology and Consumer Discretionary sectors posted the strongest gains, while the more economically sensitive Materials and Financials sectors were the weakest performers. Feeder Fund Review In June, the Feeder Fund posted a) 2.93% versus the benchmark return of 2.89% for its RM class; and b) 2.67% versus the benchmark return of 2.22% for its RM-Hedged class. Security selection in the Consumer Discretionary and Health Care sectors helped the Fund outperform the S&P 500 Index. Top individual contributors included a non-Index position in a pharmaceuticals company that benefited from ramping up production of its COVID-19 vaccine, which remains in strong demand globally, especially given the proliferation of the new Delta variant. In the Consumer Discretionary sector, an overweight in a U.S.-based used-car retailer rallied amid strong vehicle demand and limited supply. Conversely, underexposure to the Information Technology sector hindered relative performance. More specifically, an underweight in and the subsequent sale of a well-known software stock that continued to rally hurt. We locked in profits in favour of what we viewed as opportunities with more upside potential elsewhere. Elsewhere, a non-Index stake in a Belgium-based global brewer declined as investors took a wait-and-see attitude to on-premises consumption recovery, especially overseas. Market Outlook We believe U.S. stocks stand to gain from a recovery in the U.S. economy, vaccine rollouts that will likely aid consumer demand, resurgent capital spending and a GDP (gross domestic product) acceleration. However, policy, regulatory, interest rate and inflation uncertainty could lead to bouts of market volatility. We think it’s a great time to be a core investor, with opportunity across the style spectrum. Looking ahead, we plan to keep the portfolio balanced between secularly-driven growth securities and economically-sensitive value stocks, while taking advantage of buying opportunities created by short-term divergences in performance. Based on the Fund's portfolio returns as at 31 May 2021 the Volatility Factor (VF) for the Fund is as indicated in the table above and are classified as in the table (source: Lipper). "Very High" includes Funds with VF that are above 17.190, "High" includes Funds with VF that are above 14.310 but not more than 17.190, "Moderate" includes Funds with VF that are above 10.755 but not more than 14.310, "Low" includes Funds with VF that are above 3.645 but not more than 10.755 and "Very Low" includes Funds with VF that are above 0.000 but not more than 3.645 (source:FiMM). The VF means there is a possibility for the Funds in generating an upside return or downside return around this VF. The Volatility Class (VC) is assigned by Lipper based on quintile ranks of VF for qualified Funds. VF and VC are subject to monthly revision or at any interval which may be prescribed by FIMM from time to time. The Fund's portfolio may have changed since this date and there is no guarantee that the Funds will continue to have the same VF or VC in the future. Presently, only Funds launched in the market for at least 36 months will display the VF and its VC. The above information has not been reviewed by the SC and is subject to the relevant warning, disclaimer, qualification or terms and conditions stated herein. Investors are advised to read and understand the contents of the Master Prospectus dated 10 August 2020 and its First Supplemental Master Prospectus dated 10 August 2020 and its Second Supplemental Master Prospectus dated 27 January 2021 and its Third Supplemental Master Prospectus dated 5 April 2021 and all the respective Product Highlights Sheet(s) (collectively, the “Offering Documents”), obtainable at our offices or website, before investing. The Offering Documents have been registered with the Securities Commission Malaysia (SC), however the registration with the SC does not amount to nor indicate that the SC has recommended or endorsed the product. Where a unit split/distribution is declared, investors are advised that following the issue of additional units/distribution, the NAV per unit will be reduced from the pre-unit split NAV/cum-distribution NAV to post-unit split NAV/ex-distribution NAV; and where a unit split is declared, the value of your investment in the Fund’s denominated currency will remained unchanged after the distribution of the additional units. Past performances are not an indication of future performances. There are risks involved with investing in unit trust funds; wholesale funds and/or Private Retirement Schemes. Some of these risks associated with investments in unit trust funds; wholesale funds and/or Private Retirement Schemes are interest rate fluctuation risk, foreign exchange or currency risk, country risk, political risk, credit risk, non-compliance risk, counterparty risk, target fund manager risk, liquidity risk and interest rate risk. For further details on the risk profile of all the funds, please refer to the Risk Factors section in the Offering Documents. The price of units and income distribution may go down as well as up. Investors should compare and consider the fees, charges and costs involved. Investors are advised to conduct own risk assessment and consult the professional advisers if in doubt on the action to be taken.
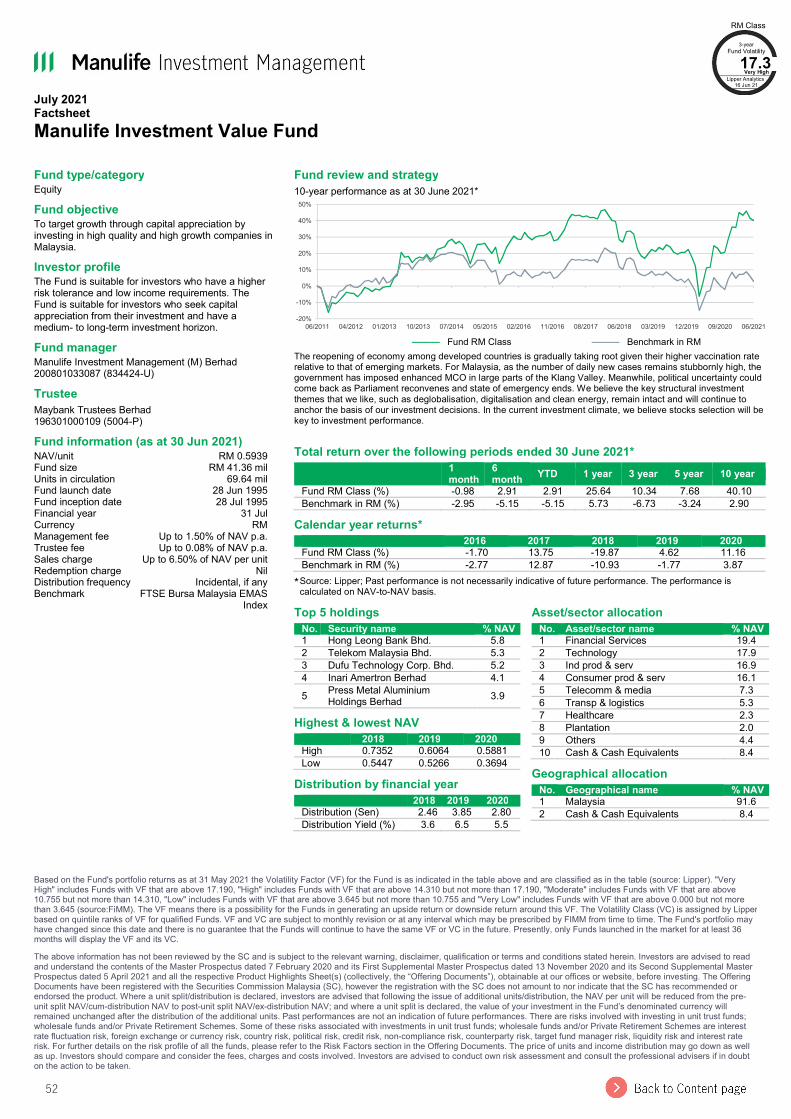
52
July 2021 Factsheet Manulife Investment Value Fund
Based on the Fund's portfolio returns as at 31 May 2021 the Volatility Factor (VF) for the Fund is as indicated in the table above and are classified as in the table (source: Lipper). "Very High" includes Funds with VF that are above 17.190, "High" includes Funds with VF that are above 14.310 but not more than 17.190, "Moderate" includes Funds with VF that are above 10.755 but not more than 14.310, "Low" includes Funds with VF that are above 3.645 but not more than 10.755 and "Very Low" includes Funds with VF that are above 0.000 but not more than 3.645 (source:FiMM). The VF means there is a possibility for the Funds in generating an upside return or downside return around this VF. The Volatility Class (VC) is assigned by Lipper based on quintile ranks of VF for qualified Funds. VF and VC are subject to monthly revision or at any interval which may be prescribed by FIMM from time to time. The Fund's portfolio may have changed since this date and there is no guarantee that the Funds will continue to have the same VF or VC in the future. Presently, only Funds launched in the market for at least 36 months will display the VF and its VC. The above information has not been reviewed by the SC and is subject to the relevant warning, disclaimer, qualification or terms and conditions stated herein. Investors are advised to read and understand the contents of the Master Prospectus dated 7 February 2020 and its First Supplemental Master Prospectus dated 13 November 2020 and its Second Supplemental Master Prospectus dated 5 April 2021 and all the respective Product Highlights Sheet(s) (collectively, the “Offering Documents”), obtainable at our offices or website, before investing. The Offering Documents have been registered with the Securities Commission Malaysia (SC), however the registration with the SC does not amount to nor indicate that the SC has recommended or endorsed the product. Where a unit split/distribution is declared, investors are advised that following the issue of additional units/distribution, the NAV per unit will be reduced from the pre-unit split NAV/cum-distribution NAV to post-unit split NAV/ex-distribution NAV; and where a unit split is declared, the value of your investment in the Fund’s denominated currency will remained unchanged after the distribution of the additional units. Past performances are not an indication of future performances. There are risks involved with investing in unit trust funds; wholesale funds and/or Private Retirement Schemes. Some of these risks associated with investments in unit trust funds; wholesale funds and/or Private Retirement Schemes are interest rate fluctuation risk, foreign exchange or currency risk, country risk, political risk, credit risk, non-compliance risk, counterparty risk, target fund manager risk, liquidity risk and interest rate risk. For further details on the risk profile of all the funds, please refer to the Risk Factors section in the Offering Documents. The price of units and income distribution may go down as well as up. Investors should compare and consider the fees, charges and costs involved. Investors are advised to conduct own risk assessment and consult the professional advisers if in doubt on the action to be taken.
Fund type/category Equity Fund objective To target growth through capital appreciation by investing in high quality and high growth companies in Malaysia. Investor profile The Fund is suitable for investors who have a higher risk tolerance and low income requirements. The Fund is suitable for investors who seek capital appreciation from their investment and have a medium- to long-term investment horizon. Fund manager Manulife Investment Management (M) Berhad 200801033087 (834424-U) Trustee Maybank Trustees Berhad 196301000109 (5004-P) Fund information (as at 30 Jun 2021) NAV/unit RM 0.5939 Fund size RM 41.36 mil Units in circulation 69.64 mil Fund launch date 28 Jun 1995 Fund inception date 28 Jul 1995 Financial year 31 Jul Currency RM Management fee Up to 1.50% of NAV p.a. Trustee fee Up to 0.08% of NAV p.a. Sales charge Up to 6.50% of NAV per unit Redemption charge Nil Distribution frequency Incidental, if any Benchmark FTSE Bursa Malaysia EMAS
Index
Fund review and strategy 10-year performance as at 30 June 2021*
——— Fund RM Class ——— Benchmark in RM
The reopening of economy among developed countries is gradually taking root given their higher vaccination rate relative to that of emerging markets. For Malaysia, as the number of daily new cases remains stubbornly high, the government has imposed enhanced MCO in large parts of the Klang Valley. Meanwhile, political uncertainty could come back as Parliament reconvenes and state of emergency ends. We believe the key structural investment themes that we like, such as deglobalisation, digitalisation and clean energy, remain intact and will continue to anchor the basis of our investment decisions. In the current investment climate, we believe stocks selection will be key to investment performance.
Total return over the following periods ended 30 June 2021*
1 month
6 month YTD 1 year 3 year 5 year 10 year
Fund RM Class (%) -0.98 2.91 2.91 25.64 10.34 7.68 40.10 Benchmark in RM (%) -2.95 -5.15 -5.15 5.73 -6.73 -3.24 2.90
Calendar year returns* 2016 2017 2018 2019 2020
Fund RM Class (%) -1.70 13.75 -19.87 4.62 11.16 Benchmark in RM (%) -2.77 12.87 -10.93 -1.77 3.87
* Source: Lipper; Past performance is not necessarily indicative of future performance. The performance is calculated on NAV-to-NAV basis.
-20%
-10%
0%
10%
20%
30%
40%
50%
06/2011 04/2012 01/2013 10/2013 07/2014 05/2015 02/2016 11/2016 08/2017 06/2018 03/2019 12/2019 09/2020 06/2021
Top 5 holdings No. Security name % NAV
1 Hong Leong Bank Bhd. 5.8 2 Telekom Malaysia Bhd. 5.3 3 Dufu Technology Corp. Bhd. 5.2 4 Inari Amertron Berhad 4.1 5 Press Metal Aluminium
Holdings Berhad 3.9 Highest & lowest NAV 2018 2019 2020
High 0.7352 0.6064 0.5881 Low 0.5447 0.5266 0.3694
Distribution by financial year 2018 2019 2020
Distribution (Sen) 2.46 3.85 2.80 Distribution Yield (%) 3.6 6.5 5.5
Asset/sector allocation No. Asset/sector name % NAV
1 Financial Services 19.4 2 Technology 17.9 3 Ind prod & serv 16.9 4 Consumer prod & serv 16.1 5 Telecomm & media 7.3 6 Transp & logistics 5.3 7 Healthcare 2.3 8 Plantation 2.0 9 Others 4.4 10 Cash & Cash Equivalents 8.4
Geographical allocation No. Geographical name % NAV
1 Malaysia 91.6 2 Cash & Cash Equivalents 8.4
RM Class 3-year
Fund Volatility 17.3
Very High Lipper Analytics
16 Jun 21
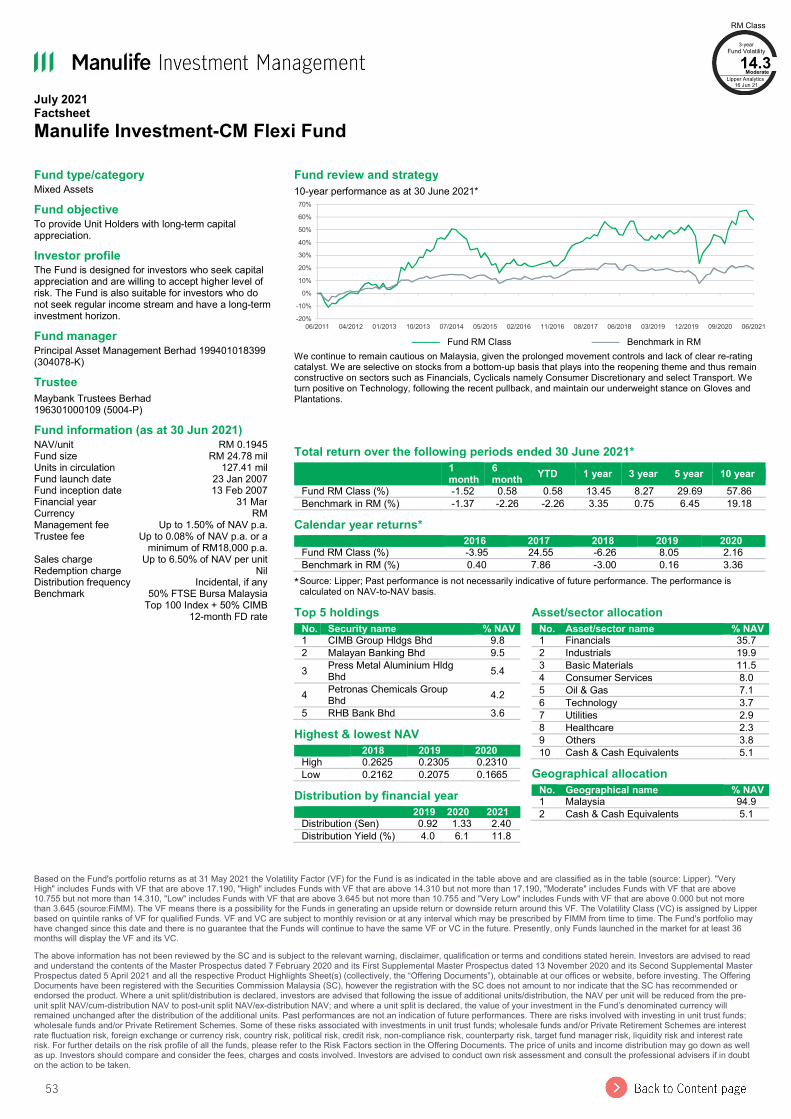
53
July 2021 Factsheet Manulife Investment-CM Flexi Fund
Based on the Fund's portfolio returns as at 31 May 2021 the Volatility Factor (VF) for the Fund is as indicated in the table above and are classified as in the table (source: Lipper). "Very High" includes Funds with VF that are above 17.190, "High" includes Funds with VF that are above 14.310 but not more than 17.190, "Moderate" includes Funds with VF that are above 10.755 but not more than 14.310, "Low" includes Funds with VF that are above 3.645 but not more than 10.755 and "Very Low" includes Funds with VF that are above 0.000 but not more than 3.645 (source:FiMM). The VF means there is a possibility for the Funds in generating an upside return or downside return around this VF. The Volatility Class (VC) is assigned by Lipper based on quintile ranks of VF for qualified Funds. VF and VC are subject to monthly revision or at any interval which may be prescribed by FIMM from time to time. The Fund's portfolio may have changed since this date and there is no guarantee that the Funds will continue to have the same VF or VC in the future. Presently, only Funds launched in the market for at least 36 months will display the VF and its VC. The above information has not been reviewed by the SC and is subject to the relevant warning, disclaimer, qualification or terms and conditions stated herein. Investors are advised to read and understand the contents of the Master Prospectus dated 7 February 2020 and its First Supplemental Master Prospectus dated 13 November 2020 and its Second Supplemental Master Prospectus dated 5 April 2021 and all the respective Product Highlights Sheet(s) (collectively, the “Offering Documents”), obtainable at our offices or website, before investing. The Offering Documents have been registered with the Securities Commission Malaysia (SC), however the registration with the SC does not amount to nor indicate that the SC has recommended or endorsed the product. Where a unit split/distribution is declared, investors are advised that following the issue of additional units/distribution, the NAV per unit will be reduced from the pre-unit split NAV/cum-distribution NAV to post-unit split NAV/ex-distribution NAV; and where a unit split is declared, the value of your investment in the Fund’s denominated currency will remained unchanged after the distribution of the additional units. Past performances are not an indication of future performances. There are risks involved with investing in unit trust funds; wholesale funds and/or Private Retirement Schemes. Some of these risks associated with investments in unit trust funds; wholesale funds and/or Private Retirement Schemes are interest rate fluctuation risk, foreign exchange or currency risk, country risk, political risk, credit risk, non-compliance risk, counterparty risk, target fund manager risk, liquidity risk and interest rate risk. For further details on the risk profile of all the funds, please refer to the Risk Factors section in the Offering Documents. The price of units and income distribution may go down as well as up. Investors should compare and consider the fees, charges and costs involved. Investors are advised to conduct own risk assessment and consult the professional advisers if in doubt on the action to be taken.
Fund type/category Mixed Assets Fund objective To provide Unit Holders with long-term capital appreciation. Investor profile The Fund is designed for investors who seek capital appreciation and are willing to accept higher level of risk. The Fund is also suitable for investors who do not seek regular income stream and have a long-term investment horizon. Fund manager Principal Asset Management Berhad 199401018399 (304078-K) Trustee Maybank Trustees Berhad 196301000109 (5004-P) Fund information (as at 30 Jun 2021) NAV/unit RM 0.1945 Fund size RM 24.78 mil Units in circulation 127.41 mil Fund launch date 23 Jan 2007 Fund inception date 13 Feb 2007 Financial year 31 Mar Currency RM Management fee Up to 1.50% of NAV p.a. Trustee fee Up to 0.08% of NAV p.a. or a
minimum of RM18,000 p.a. Sales charge Up to 6.50% of NAV per unit Redemption charge Nil Distribution frequency Incidental, if any Benchmark 50% FTSE Bursa Malaysia
Top 100 Index + 50% CIMB 12-month FD rate
Fund review and strategy 10-year performance as at 30 June 2021*
——— Fund RM Class ——— Benchmark in RM
We continue to remain cautious on Malaysia, given the prolonged movement controls and lack of clear re-rating catalyst. We are selective on stocks from a bottom-up basis that plays into the reopening theme and thus remain constructive on sectors such as Financials, Cyclicals namely Consumer Discretionary and select Transport. We turn positive on Technology, following the recent pullback, and maintain our underweight stance on Gloves and Plantations.
Total return over the following periods ended 30 June 2021*
1 month
6 month YTD 1 year 3 year 5 year 10 year
Fund RM Class (%) -1.52 0.58 0.58 13.45 8.27 29.69 57.86 Benchmark in RM (%) -1.37 -2.26 -2.26 3.35 0.75 6.45 19.18
Calendar year returns* 2016 2017 2018 2019 2020
Fund RM Class (%) -3.95 24.55 -6.26 8.05 2.16 Benchmark in RM (%) 0.40 7.86 -3.00 0.16 3.36
* Source: Lipper; Past performance is not necessarily indicative of future performance. The performance is calculated on NAV-to-NAV basis.
-20%
-10%
0%
10%
20%
30%
40%
50%
60%
70%
06/2011 04/2012 01/2013 10/2013 07/2014 05/2015 02/2016 11/2016 08/2017 06/2018 03/2019 12/2019 09/2020 06/2021
Top 5 holdings No. Security name % NAV
1 CIMB Group Hldgs Bhd 9.8 2 Malayan Banking Bhd 9.5 3 Press Metal Aluminium Hldg
Bhd 5.4
4 Petronas Chemicals Group Bhd 4.2
5 RHB Bank Bhd 3.6 Highest & lowest NAV 2018 2019 2020
High 0.2625 0.2305 0.2310 Low 0.2162 0.2075 0.1665
Distribution by financial year 2019 2020 2021
Distribution (Sen) 0.92 1.33 2.40 Distribution Yield (%) 4.0 6.1 11.8
Asset/sector allocation No. Asset/sector name % NAV
1 Financials 35.7 2 Industrials 19.9 3 Basic Materials 11.5 4 Consumer Services 8.0 5 Oil & Gas 7.1 6 Technology 3.7 7 Utilities 2.9 8 Healthcare 2.3 9 Others 3.8 10 Cash & Cash Equivalents 5.1
Geographical allocation No. Geographical name % NAV
1 Malaysia 94.9 2 Cash & Cash Equivalents 5.1
RM Class 3-year
Fund Volatility 14.3
Moderate Lipper Analytics
16 Jun 21
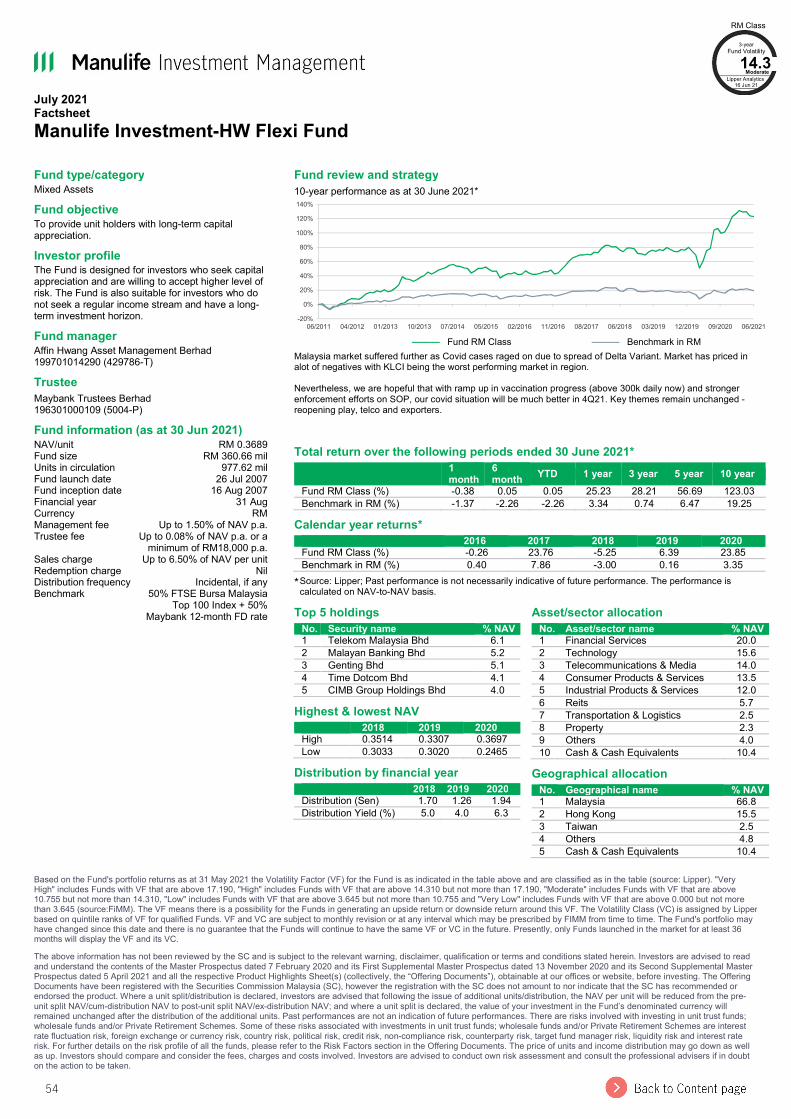
54
July 2021 Factsheet Manulife Investment-HW Flexi Fund
Based on the Fund's portfolio returns as at 31 May 2021 the Volatility Factor (VF) for the Fund is as indicated in the table above and are classified as in the table (source: Lipper). "Very High" includes Funds with VF that are above 17.190, "High" includes Funds with VF that are above 14.310 but not more than 17.190, "Moderate" includes Funds with VF that are above 10.755 but not more than 14.310, "Low" includes Funds with VF that are above 3.645 but not more than 10.755 and "Very Low" includes Funds with VF that are above 0.000 but not more than 3.645 (source:FiMM). The VF means there is a possibility for the Funds in generating an upside return or downside return around this VF. The Volatility Class (VC) is assigned by Lipper based on quintile ranks of VF for qualified Funds. VF and VC are subject to monthly revision or at any interval which may be prescribed by FIMM from time to time. The Fund's portfolio may have changed since this date and there is no guarantee that the Funds will continue to have the same VF or VC in the future. Presently, only Funds launched in the market for at least 36 months will display the VF and its VC. The above information has not been reviewed by the SC and is subject to the relevant warning, disclaimer, qualification or terms and conditions stated herein. Investors are advised to read and understand the contents of the Master Prospectus dated 7 February 2020 and its First Supplemental Master Prospectus dated 13 November 2020 and its Second Supplemental Master Prospectus dated 5 April 2021 and all the respective Product Highlights Sheet(s) (collectively, the “Offering Documents”), obtainable at our offices or website, before investing. The Offering Documents have been registered with the Securities Commission Malaysia (SC), however the registration with the SC does not amount to nor indicate that the SC has recommended or endorsed the product. Where a unit split/distribution is declared, investors are advised that following the issue of additional units/distribution, the NAV per unit will be reduced from the pre-unit split NAV/cum-distribution NAV to post-unit split NAV/ex-distribution NAV; and where a unit split is declared, the value of your investment in the Fund’s denominated currency will remained unchanged after the distribution of the additional units. Past performances are not an indication of future performances. There are risks involved with investing in unit trust funds; wholesale funds and/or Private Retirement Schemes. Some of these risks associated with investments in unit trust funds; wholesale funds and/or Private Retirement Schemes are interest rate fluctuation risk, foreign exchange or currency risk, country risk, political risk, credit risk, non-compliance risk, counterparty risk, target fund manager risk, liquidity risk and interest rate risk. For further details on the risk profile of all the funds, please refer to the Risk Factors section in the Offering Documents. The price of units and income distribution may go down as well as up. Investors should compare and consider the fees, charges and costs involved. Investors are advised to conduct own risk assessment and consult the professional advisers if in doubt on the action to be taken.
Fund type/category Mixed Assets Fund objective To provide unit holders with long-term capital appreciation. Investor profile The Fund is designed for investors who seek capital appreciation and are willing to accept higher level of risk. The Fund is also suitable for investors who do not seek a regular income stream and have a long-term investment horizon. Fund manager Affin Hwang Asset Management Berhad 199701014290 (429786-T) Trustee Maybank Trustees Berhad 196301000109 (5004-P) Fund information (as at 30 Jun 2021) NAV/unit RM 0.3689 Fund size RM 360.66 mil Units in circulation 977.62 mil Fund launch date 26 Jul 2007 Fund inception date 16 Aug 2007 Financial year 31 Aug Currency RM Management fee Up to 1.50% of NAV p.a. Trustee fee Up to 0.08% of NAV p.a. or a
minimum of RM18,000 p.a. Sales charge Up to 6.50% of NAV per unit Redemption charge Nil Distribution frequency Incidental, if any Benchmark 50% FTSE Bursa Malaysia
Top 100 Index + 50% Maybank 12-month FD rate
Fund review and strategy 10-year performance as at 30 June 2021*
——— Fund RM Class ——— Benchmark in RM
Malaysia market suffered further as Covid cases raged on due to spread of Delta Variant. Market has priced in alot of negatives with KLCI being the worst performing market in region. Nevertheless, we are hopeful that with ramp up in vaccination progress (above 300k daily now) and stronger enforcement efforts on SOP, our covid situation will be much better in 4Q21. Key themes remain unchanged - reopening play, telco and exporters.
Total return over the following periods ended 30 June 2021*
1 month
6 month YTD 1 year 3 year 5 year 10 year
Fund RM Class (%) -0.38 0.05 0.05 25.23 28.21 56.69 123.03 Benchmark in RM (%) -1.37 -2.26 -2.26 3.34 0.74 6.47 19.25
Calendar year returns* 2016 2017 2018 2019 2020
Fund RM Class (%) -0.26 23.76 -5.25 6.39 23.85 Benchmark in RM (%) 0.40 7.86 -3.00 0.16 3.35
* Source: Lipper; Past performance is not necessarily indicative of future performance. The performance is calculated on NAV-to-NAV basis.
-20%
0%
20%
40%
60%
80%
100%
120%
140%
06/2011 04/2012 01/2013 10/2013 07/2014 05/2015 02/2016 11/2016 08/2017 06/2018 03/2019 12/2019 09/2020 06/2021
Top 5 holdings No. Security name % NAV
1 Telekom Malaysia Bhd 6.1 2 Malayan Banking Bhd 5.2 3 Genting Bhd 5.1 4 Time Dotcom Bhd 4.1 5 CIMB Group Holdings Bhd 4.0
Highest & lowest NAV 2018 2019 2020
High 0.3514 0.3307 0.3697 Low 0.3033 0.3020 0.2465
Distribution by financial year 2018 2019 2020
Distribution (Sen) 1.70 1.26 1.94 Distribution Yield (%) 5.0 4.0 6.3
Asset/sector allocation No. Asset/sector name % NAV
1 Financial Services 20.0 2 Technology 15.6 3 Telecommunications & Media 14.0 4 Consumer Products & Services 13.5 5 Industrial Products & Services 12.0 6 Reits 5.7 7 Transportation & Logistics 2.5 8 Property 2.3 9 Others 4.0 10 Cash & Cash Equivalents 10.4
Geographical allocation No. Geographical name % NAV
1 Malaysia 66.8 2 Hong Kong 15.5 3 Taiwan 2.5 4 Others 4.8 5 Cash & Cash Equivalents 10.4
RM Class 3-year
Fund Volatility 14.3
Moderate Lipper Analytics
16 Jun 21
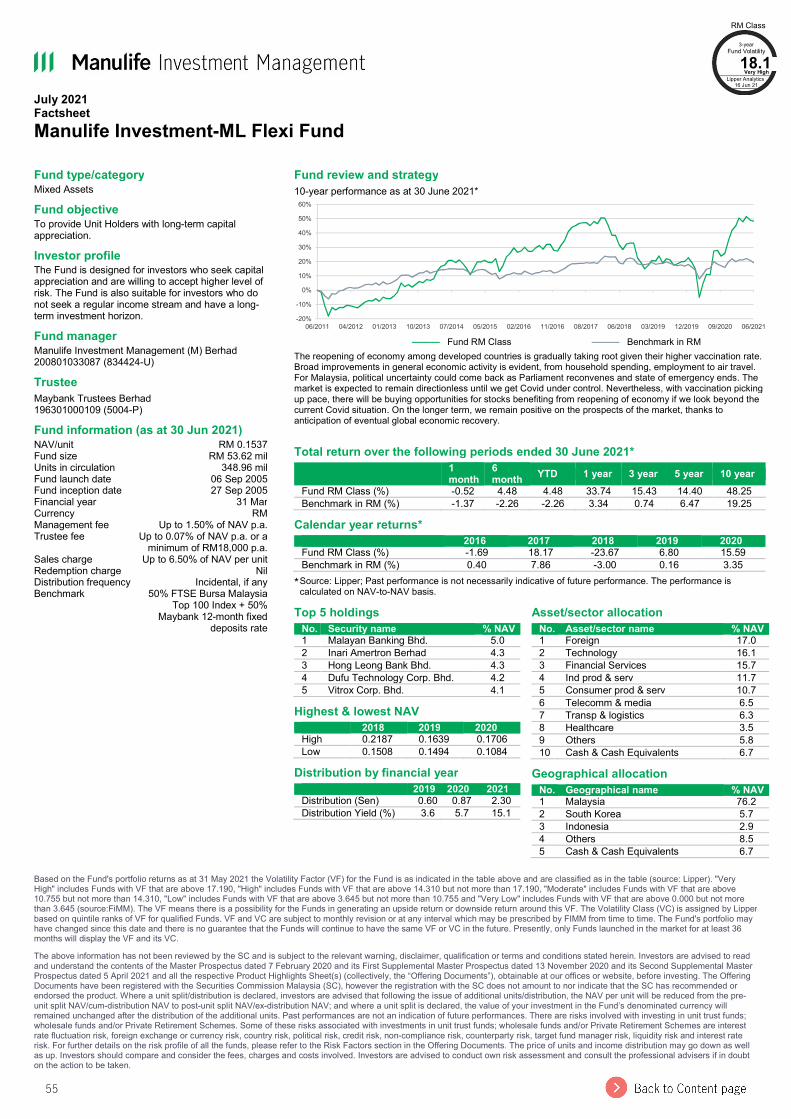
55
July 2021 Factsheet Manulife Investment-ML Flexi Fund
Based on the Fund's portfolio returns as at 31 May 2021 the Volatility Factor (VF) for the Fund is as indicated in the table above and are classified as in the table (source: Lipper). "Very High" includes Funds with VF that are above 17.190, "High" includes Funds with VF that are above 14.310 but not more than 17.190, "Moderate" includes Funds with VF that are above 10.755 but not more than 14.310, "Low" includes Funds with VF that are above 3.645 but not more than 10.755 and "Very Low" includes Funds with VF that are above 0.000 but not more than 3.645 (source:FiMM). The VF means there is a possibility for the Funds in generating an upside return or downside return around this VF. The Volatility Class (VC) is assigned by Lipper based on quintile ranks of VF for qualified Funds. VF and VC are subject to monthly revision or at any interval which may be prescribed by FIMM from time to time. The Fund's portfolio may have changed since this date and there is no guarantee that the Funds will continue to have the same VF or VC in the future. Presently, only Funds launched in the market for at least 36 months will display the VF and its VC. The above information has not been reviewed by the SC and is subject to the relevant warning, disclaimer, qualification or terms and conditions stated herein. Investors are advised to read and understand the contents of the Master Prospectus dated 7 February 2020 and its First Supplemental Master Prospectus dated 13 November 2020 and its Second Supplemental Master Prospectus dated 5 April 2021 and all the respective Product Highlights Sheet(s) (collectively, the “Offering Documents”), obtainable at our offices or website, before investing. The Offering Documents have been registered with the Securities Commission Malaysia (SC), however the registration with the SC does not amount to nor indicate that the SC has recommended or endorsed the product. Where a unit split/distribution is declared, investors are advised that following the issue of additional units/distribution, the NAV per unit will be reduced from the pre-unit split NAV/cum-distribution NAV to post-unit split NAV/ex-distribution NAV; and where a unit split is declared, the value of your investment in the Fund’s denominated currency will remained unchanged after the distribution of the additional units. Past performances are not an indication of future performances. There are risks involved with investing in unit trust funds; wholesale funds and/or Private Retirement Schemes. Some of these risks associated with investments in unit trust funds; wholesale funds and/or Private Retirement Schemes are interest rate fluctuation risk, foreign exchange or currency risk, country risk, political risk, credit risk, non-compliance risk, counterparty risk, target fund manager risk, liquidity risk and interest rate risk. For further details on the risk profile of all the funds, please refer to the Risk Factors section in the Offering Documents. The price of units and income distribution may go down as well as up. Investors should compare and consider the fees, charges and costs involved. Investors are advised to conduct own risk assessment and consult the professional advisers if in doubt on the action to be taken.
Fund type/category Mixed Assets Fund objective To provide Unit Holders with long-term capital appreciation. Investor profile The Fund is designed for investors who seek capital appreciation and are willing to accept higher level of risk. The Fund is also suitable for investors who do not seek a regular income stream and have a long-term investment horizon. Fund manager Manulife Investment Management (M) Berhad 200801033087 (834424-U) Trustee Maybank Trustees Berhad 196301000109 (5004-P) Fund information (as at 30 Jun 2021) NAV/unit RM 0.1537 Fund size RM 53.62 mil Units in circulation 348.96 mil Fund launch date 06 Sep 2005 Fund inception date 27 Sep 2005 Financial year 31 Mar Currency RM Management fee Up to 1.50% of NAV p.a. Trustee fee Up to 0.07% of NAV p.a. or a
minimum of RM18,000 p.a. Sales charge Up to 6.50% of NAV per unit Redemption charge Nil Distribution frequency Incidental, if any Benchmark 50% FTSE Bursa Malaysia
Top 100 Index + 50% Maybank 12-month fixed
deposits rate
Fund review and strategy 10-year performance as at 30 June 2021*
——— Fund RM Class ——— Benchmark in RM
The reopening of economy among developed countries is gradually taking root given their higher vaccination rate. Broad improvements in general economic activity is evident, from household spending, employment to air travel. For Malaysia, political uncertainty could come back as Parliament reconvenes and state of emergency ends. The market is expected to remain directionless until we get Covid under control. Nevertheless, with vaccination picking up pace, there will be buying opportunities for stocks benefiting from reopening of economy if we look beyond the current Covid situation. On the longer term, we remain positive on the prospects of the market, thanks to anticipation of eventual global economic recovery.
Total return over the following periods ended 30 June 2021*
1 month
6 month YTD 1 year 3 year 5 year 10 year
Fund RM Class (%) -0.52 4.48 4.48 33.74 15.43 14.40 48.25 Benchmark in RM (%) -1.37 -2.26 -2.26 3.34 0.74 6.47 19.25
Calendar year returns* 2016 2017 2018 2019 2020
Fund RM Class (%) -1.69 18.17 -23.67 6.80 15.59 Benchmark in RM (%) 0.40 7.86 -3.00 0.16 3.35
* Source: Lipper; Past performance is not necessarily indicative of future performance. The performance is calculated on NAV-to-NAV basis.
-20%
-10%
0%
10%
20%
30%
40%
50%
60%
06/2011 04/2012 01/2013 10/2013 07/2014 05/2015 02/2016 11/2016 08/2017 06/2018 03/2019 12/2019 09/2020 06/2021
Top 5 holdings No. Security name % NAV
1 Malayan Banking Bhd. 5.0 2 Inari Amertron Berhad 4.3 3 Hong Leong Bank Bhd. 4.3 4 Dufu Technology Corp. Bhd. 4.2 5 Vitrox Corp. Bhd. 4.1
Highest & lowest NAV 2018 2019 2020
High 0.2187 0.1639 0.1706 Low 0.1508 0.1494 0.1084
Distribution by financial year 2019 2020 2021
Distribution (Sen) 0.60 0.87 2.30 Distribution Yield (%) 3.6 5.7 15.1
Asset/sector allocation No. Asset/sector name % NAV
1 Foreign 17.0 2 Technology 16.1 3 Financial Services 15.7 4 Ind prod & serv 11.7 5 Consumer prod & serv 10.7 6 Telecomm & media 6.5 7 Transp & logistics 6.3 8 Healthcare 3.5 9 Others 5.8 10 Cash & Cash Equivalents 6.7
Geographical allocation No. Geographical name % NAV
1 Malaysia 76.2 2 South Korea 5.7 3 Indonesia 2.9 4 Others 8.5 5 Cash & Cash Equivalents 6.7
RM Class 3-year
Fund Volatility 18.1
Very High Lipper Analytics
16 Jun 21
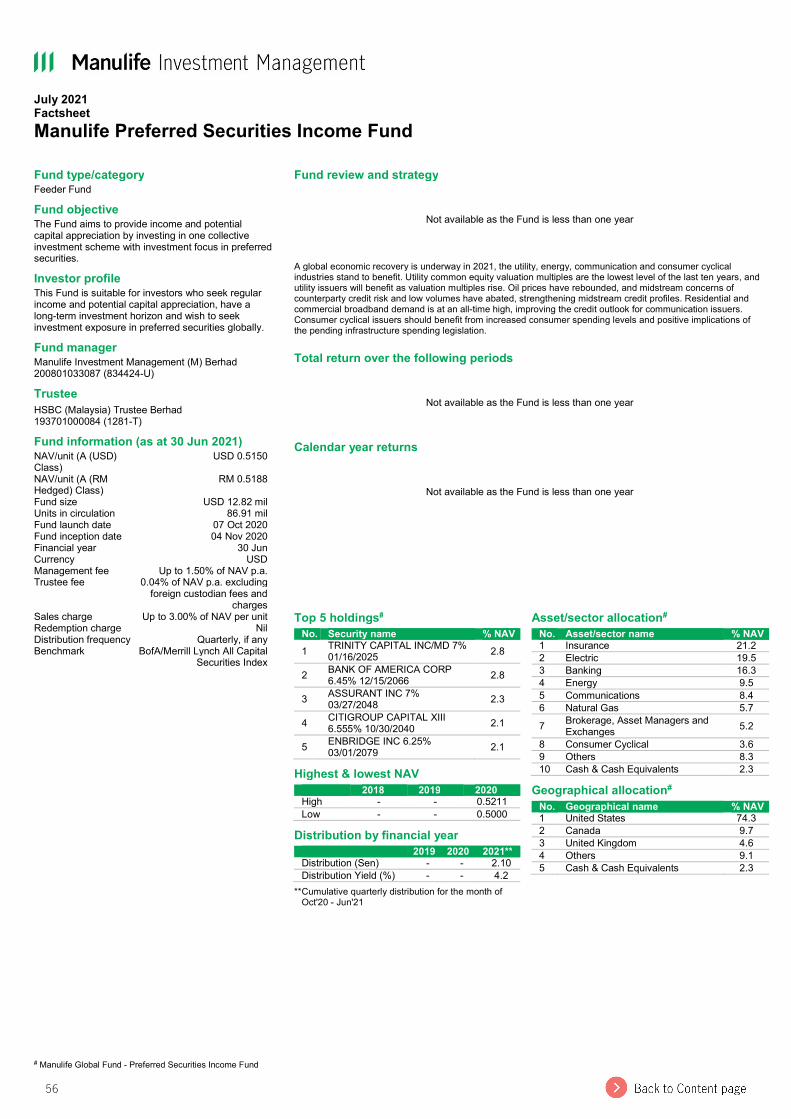
56
July 2021 Factsheet Manulife Preferred Securities Income Fund
# Manulife Global Fund - Preferred Securities Income Fund
Fund type/category Feeder Fund Fund objective The Fund aims to provide income and potential capital appreciation by investing in one collective investment scheme with investment focus in preferred securities. Investor profile This Fund is suitable for investors who seek regular income and potential capital appreciation, have a long-term investment horizon and wish to seek investment exposure in preferred securities globally. Fund manager Manulife Investment Management (M) Berhad 200801033087 (834424-U) Trustee HSBC (Malaysia) Trustee Berhad 193701000084 (1281-T) Fund information (as at 30 Jun 2021) NAV/unit (A (USD) Class)
USD 0.5150 NAV/unit (A (RM Hedged) Class)
RM 0.5188 Fund size USD 12.82 mil Units in circulation 86.91 mil Fund launch date 07 Oct 2020 Fund inception date 04 Nov 2020 Financial year 30 Jun Currency USD Management fee Up to 1.50% of NAV p.a. Trustee fee 0.04% of NAV p.a. excluding
foreign custodian fees and charges
Sales charge Up to 3.00% of NAV per unit Redemption charge Nil Distribution frequency Quarterly, if any Benchmark BofA/Merrill Lynch All Capital
Securities Index
Fund review and strategy
Not available as the Fund is less than one year
A global economic recovery is underway in 2021, the utility, energy, communication and consumer cyclical industries stand to benefit. Utility common equity valuation multiples are the lowest level of the last ten years, and utility issuers will benefit as valuation multiples rise. Oil prices have rebounded, and midstream concerns of counterparty credit risk and low volumes have abated, strengthening midstream credit profiles. Residential and commercial broadband demand is at an all-time high, improving the credit outlook for communication issuers. Consumer cyclical issuers should benefit from increased consumer spending levels and positive implications of the pending infrastructure spending legislation.
Total return over the following periods
Not available as the Fund is less than one year
Calendar year returns
Not available as the Fund is less than one year
Top 5 holdings# No. Security name % NAV
1 TRINITY CAPITAL INC/MD 7% 01/16/2025 2.8
2 BANK OF AMERICA CORP 6.45% 12/15/2066 2.8
3 ASSURANT INC 7% 03/27/2048 2.3
4 CITIGROUP CAPITAL XIII 6.555% 10/30/2040 2.1
5 ENBRIDGE INC 6.25% 03/01/2079 2.1
Highest & lowest NAV 2018 2019 2020
High - - 0.5211 Low - - 0.5000
Distribution by financial year 2019 2020 2021**
Distribution (Sen) - - 2.10 Distribution Yield (%) - - 4.2
** Cumulative quarterly distribution for the month of Oct'20 - Jun'21
Asset/sector allocation# No. Asset/sector name % NAV
1 Insurance 21.2 2 Electric 19.5 3 Banking 16.3 4 Energy 9.5 5 Communications 8.4 6 Natural Gas 5.7 7 Brokerage, Asset Managers and
Exchanges 5.2 8 Consumer Cyclical 3.6 9 Others 8.3 10 Cash & Cash Equivalents 2.3
Geographical allocation# No. Geographical name % NAV
1 United States 74.3 2 Canada 9.7 3 United Kingdom 4.6 4 Others 9.1 5 Cash & Cash Equivalents 2.3

57
July 2021 Factsheet Manulife Preferred Securities Income Fund Market Review US bonds advanced in June as yields moved lower during the month. The US economy continued its gradual recovery from the Covid-19 pandemic, albeit in fits and starts, as more and more restrictions were lifted around the country despite a leveling-off in vaccination rates and the increased spread of the more-transmissible Delta variant. Supply shortages in many industries, caused by production bottlenecks and transportation disruptions, remained an economic constraint while at the same time driving prices higher. As a result, the year-over-year inflation rate reached 5%, its highest level in nearly 13 years. Despite the notably high inflation rate, bond yields declined for the third consecutive month, led by the intermediate and long-term maturity segments. Lower yields suggest that bond investors view elevated inflation levels as temporary and anticipate a return to a slower inflation rate when supply chain disruptions ease. On a sector basis, convertible preferred and retail par preferred securities delivered the best returns in June, reflecting continued investor demand for yield, while institutional par preferred securities also posted positive returns during the month. Market Outlook A global economic recovery is underway in 2021, and the utility, energy, communication, and consumer cyclical industries stand to benefit significantly. Utility common equity valuation multiples are the lowest level of the last ten years. We believe convertible preferred securities of utility issuers will benefit as valuation multiples rise. Global oil prices have rebounded into the US$70s from negative prices in 2020. Midstream concerns of counterparty credit risk and low volumes have abated, strengthening midstream credit profiles. Residential and commercial broadband demand is at an all-time high, improving the credit outlook for communication issuers. And consumer cyclical issuers should benefit from increased consumer spending levels and positive implications of the pending infrastructure spending legislation. The Fund is overweight the utilities sector which has limited exposure from an economic standpoint to the coronavirus. Commercial and industrial electricity demand has declined but at the same time, residential demand increased as many Americans continue to work from home. Importantly, utilities often make between 2-3 times more margin from residential customers than they do commercial and industrial. In addition, most utilities have regulatory mechanisms in place to make up for lost demand. We see tremendous value in the utility preferred space as many of these securities are not trading on their underlying fundamentals. Further, we believe that President Biden will incentivise renewable energy investments which will result in even better earnings and cash flows for the next several years. Financial services companies, another large weighting in the portfolio, are well-positioned from a balance sheet standpoint for this crisis. US banks are strong, well-capitalised with good liquidity. During the 2008-09 financial crisis, banks were forced to tighten their lending standards because of their weak balance sheets. Insurance companies, regulated by the states where they operate, similarly are well-positioned from a balance sheet standpoint currently. Property and casualty insurance companies are benefiting from increases in premiums paid as these companies have been raising prices owing to several years of higher-than-expected claims. We see value in the financial services sector as the market is not recognising their strong balance sheets. The Fund’s holdings in the energy sector do not have direct exposure to commodity prices. Our energy holdings are midstream companies that transport oil and/or gas on their pipelines. Many of these companies are diversified into different areas of the midstream space such as natural gas pipelines, gasoline pipelines and storage. Overall, we are confident in the stability of the income in our midstream names. We view the yields offered by these companies as very attractive. The above information has not been reviewed by the SC and is subject to the relevant warning, disclaimer, qualification or terms and conditions stated herein. Investors are advised to read and understand the contents of the Prospectus dated 7 October 2020 and its First Supplemental Prospectus dated 9 February 2021 and all the respective Product Highlights Sheet(s) (collectively, the “Offering Documents”), obtainable at our offices or website, before investing. The Offering Documents have been registered with the Securities Commission Malaysia (SC), however the registration with the SC does not amount to nor indicate that the SC has recommended or endorsed the product. Where a unit split/distribution is declared, investors are advised that following the issue of additional units/distribution, the NAV per unit will be reduced from the pre-unit split NAV/cum-distribution NAV to post-unit split NAV/ex-distribution NAV; and where a unit split is declared, the value of your investment in the Fund’s denominated currency will remained unchanged after the distribution of the additional units. Past performances are not an indication of future performances. There are risks involved with investing in unit trust funds; wholesale funds and/or Private Retirement Schemes. Some of these risks associated with investments in unit trust funds; wholesale funds and/or Private Retirement Schemes are interest rate fluctuation risk, foreign exchange or currency risk, country risk, political risk, credit risk, non-compliance risk, counterparty risk,target fund manager risk, liquidity risk and interest rate risk. For further details on the risk profile of all the funds, please refer to the Risk Factors section in the Offering Documents. The price of units and income distribution may go down as well as up. Investors should compare and consider the fees, charges and costs involved. Investors are advised to conduct own risk assessment and consult the professional advisers if in doubt on the action to be taken.
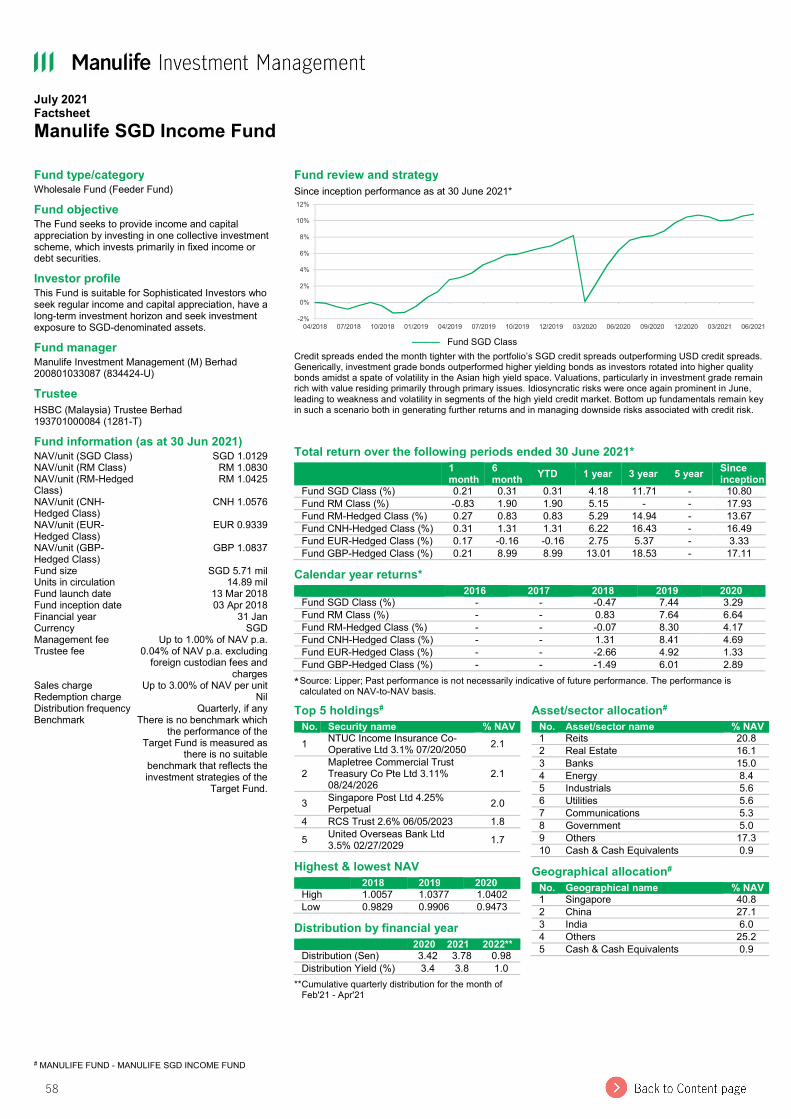
58
July 2021 Factsheet Manulife SGD Income Fund
# MANULIFE FUND - MANULIFE SGD INCOME FUND
Fund type/category Wholesale Fund (Feeder Fund) Fund objective The Fund seeks to provide income and capital appreciation by investing in one collective investment scheme, which invests primarily in fixed income or debt securities. Investor profile This Fund is suitable for Sophisticated Investors who seek regular income and capital appreciation, have a long-term investment horizon and seek investment exposure to SGD-denominated assets. Fund manager Manulife Investment Management (M) Berhad 200801033087 (834424-U) Trustee HSBC (Malaysia) Trustee Berhad 193701000084 (1281-T) Fund information (as at 30 Jun 2021) NAV/unit (SGD Class) SGD 1.0129 NAV/unit (RM Class) RM 1.0830 NAV/unit (RM-Hedged Class)
RM 1.0425 NAV/unit (CNH-Hedged Class)
CNH 1.0576 NAV/unit (EUR-Hedged Class)
EUR 0.9339 NAV/unit (GBP-Hedged Class)
GBP 1.0837 Fund size SGD 5.71 mil Units in circulation 14.89 mil Fund launch date 13 Mar 2018 Fund inception date 03 Apr 2018 Financial year 31 Jan Currency SGD Management fee Up to 1.00% of NAV p.a. Trustee fee 0.04% of NAV p.a. excluding
foreign custodian fees and charges
Sales charge Up to 3.00% of NAV per unit Redemption charge Nil Distribution frequency Quarterly, if any Benchmark There is no benchmark which
the performance of the Target Fund is measured as
there is no suitable benchmark that reflects the investment strategies of the
Target Fund.
Fund review and strategy Since inception performance as at 30 June 2021*
——— Fund SGD Class
Credit spreads ended the month tighter with the portfolio’s SGD credit spreads outperforming USD credit spreads. Generically, investment grade bonds outperformed higher yielding bonds as investors rotated into higher quality bonds amidst a spate of volatility in the Asian high yield space. Valuations, particularly in investment grade remain rich with value residing primarily through primary issues. Idiosyncratic risks were once again prominent in June, leading to weakness and volatility in segments of the high yield credit market. Bottom up fundamentals remain key in such a scenario both in generating further returns and in managing downside risks associated with credit risk.
Total return over the following periods ended 30 June 2021*
1 month
6 month YTD 1 year 3 year 5 year Since
inception Fund SGD Class (%) 0.21 0.31 0.31 4.18 11.71 - 10.80 Fund RM Class (%) -0.83 1.90 1.90 5.15 - - 17.93 Fund RM-Hedged Class (%) 0.27 0.83 0.83 5.29 14.94 - 13.67 Fund CNH-Hedged Class (%) 0.31 1.31 1.31 6.22 16.43 - 16.49 Fund EUR-Hedged Class (%) 0.17 -0.16 -0.16 2.75 5.37 - 3.33 Fund GBP-Hedged Class (%) 0.21 8.99 8.99 13.01 18.53 - 17.11
Calendar year returns* 2016 2017 2018 2019 2020
Fund SGD Class (%) - - -0.47 7.44 3.29 Fund RM Class (%) - - 0.83 7.64 6.64 Fund RM-Hedged Class (%) - - -0.07 8.30 4.17 Fund CNH-Hedged Class (%) - - 1.31 8.41 4.69 Fund EUR-Hedged Class (%) - - -2.66 4.92 1.33 Fund GBP-Hedged Class (%) - - -1.49 6.01 2.89
* Source: Lipper; Past performance is not necessarily indicative of future performance. The performance is calculated on NAV-to-NAV basis.
-2%
0%
2%
4%
6%
8%
10%
12%
04/2018 07/2018 10/2018 01/2019 04/2019 07/2019 10/2019 12/2019 03/2020 06/2020 09/2020 12/2020 03/2021 06/2021
Top 5 holdings# No. Security name % NAV
1 NTUC Income Insurance Co-Operative Ltd 3.1% 07/20/2050 2.1
2 Mapletree Commercial Trust Treasury Co Pte Ltd 3.11% 08/24/2026
2.1
3 Singapore Post Ltd 4.25% Perpetual 2.0
4 RCS Trust 2.6% 06/05/2023 1.8 5 United Overseas Bank Ltd
3.5% 02/27/2029 1.7 Highest & lowest NAV 2018 2019 2020
High 1.0057 1.0377 1.0402 Low 0.9829 0.9906 0.9473
Distribution by financial year 2020 2021 2022**
Distribution (Sen) 3.42 3.78 0.98 Distribution Yield (%) 3.4 3.8 1.0
** Cumulative quarterly distribution for the month of Feb'21 - Apr'21
Asset/sector allocation# No. Asset/sector name % NAV
1 Reits 20.8 2 Real Estate 16.1 3 Banks 15.0 4 Energy 8.4 5 Industrials 5.6 6 Utilities 5.6 7 Communications 5.3 8 Government 5.0 9 Others 17.3 10 Cash & Cash Equivalents 0.9
Geographical allocation# No. Geographical name % NAV
1 Singapore 40.8 2 China 27.1 3 India 6.0 4 Others 25.2 5 Cash & Cash Equivalents 0.9

59
July 2021 Factsheet Manulife SGD Income Fund Market Review The global economy continued its path of recovery as data in June painted a picture of strong economic growth, particularly in developed economies with higher vaccination rates. Although vaccination rates are increasing globally, several economies also started seeing an increase in Covid-19 cases caused by the spread of the more virulent Delta variant. Against such a backdrop, US treasury yields ended mixed in June across a flatter curve while Singapore sovereign yields were broadly higher. The US Federal Reserve (Fed) left its benchmark policy rate unchanged in June anchored near zero with Fed chairman Powell noting that the Fed aims to achieve inflation moderately above two percent for some time and until then, expects to maintain an accommodative stance of monetary policy. Chairman Powell did note, however, that progress on vaccinations has reduced the spread of Covid-19 and this progress in tandem with strong policy support has resulted in stronger and improved indicators of economic activity and employment. Closer to home, China’s economy continued to expand with manufacturing PMI printing 50.9 in June. This however reflected a dip compared to the prior months amidst wider supply chain disruptions in Asia due to higher raw materials and a shortage of semiconductors. In Singapore, non-oil domestic exports (NODX) grew at a faster rate in May rising 8.8% on a year-on-year basis relative to April’s 6.0% figure. This faster pace of growth was driven by electronics exports which rose 11% year-on-year. The 8.8% growth in May however, fell short of consensus expectations for a 16.0% growth. Headline inflation ticked higher in May printing 2.4% on a year-on-year basis vs 2.1% in April driven mainly by higher services inflation. Core inflation also saw its fourth straight month of positive prints, increasing 0.8% year-on-year vs 0.6% in the month prior. Short term interest rates remained low by historical standards and stable, tracking the stabilizing global interest rate environment. Feeder Fund Review In June, the Feeder Fund posted a) 0.21% for its SGD class; b) -0.83% for its RM class; c) 0.27% for its RM-Hedged class; d) 0.21% for its GBP-Hedged class; e) 0.17% for its EUR-Hedged class; and f) 0.31% for its CNH-Hedged class. The Feeder Fund returned positively denominated in SGD, driven primarily by tighter credit spreads for both SGD and USD corporate bonds with further returns supplemented by the portfolio’s carry. However, the Feeder Fund’s RM class ended in the negative territory caused by a depreciation of Singapore dollar against Malaysian ringgit in the month. Market Outlook The global economy moves deeper into the recovery phase post the Covid-19 induced recession. The increasing adoption of vaccinations has allowed countries and regions to open their economies again, albeit at a measured pace. Despite the progress made towards tackling the pandemic, uncertainties still exist as some economies saw a resurgence in Covid-19 cases in June brought about by the more virulent Delta variant. Risk assets in Asia should still see support given the continuation of easy monetary policies and flushed liquidity conditions globally in tandem with a low yielding environment. Downside risks, however, are not negligible given the recent resurgence of the Delta variant and geopolitical tensions particularly between the US and China not seeing much improvements. Indicators of economic activity in Singapore continued to expand in June given a more favourable macroeconomic backdrop with economic activity and trade picking up globally. Singapore announced relaxation of measures in June following a month of the phase 2 heightened alert (P2HA) designed to contain emerging clusters of Covid-19 cases locally. Phase 3 heightened alert (P3HA) will see social gathering sizes increase as well as the resumption of dining outs and other services. This should provide some tailwinds for sectors such as retail and F&B. The national vaccination program has made good progress over the second quarter of the year and the recovery of these sectors and to an extent, of Singapore’s economy will hinge on further relaxation of Covid-19 measures locally and globally given that the government has indicated that Covid-19 will be “endemic” going forward. Growth for this year should come in the higher end of the 4.0% - 6.0% range this year indicated by the government. Credit spreads ended the month tighter with the portfolio’s SGD credit spreads outperforming USD credit spreads. Generically, investment grade bonds outperformed higher yielding bonds as investors rotated into higher quality bonds amidst a spate of volatility in the Asian high yield space. Valuations, particularly in investment grade remain rich with value residing primarily through primary issues. Idiosyncratic risks were once again prominent in June, leading to weakness and volatility in segments of the high yield credit market. We have been and will continue to be cognizant of such idiosyncratic risks with our view of managing downside risks more broadly remaining unchanged. Bottom up fundamentals remain key in such a scenario both in generating further returns and in managing downside risks associated with credit risk. The above information has not been reviewed by the SC and is subject to the relevant warning, disclaimer, qualification or terms and conditions stated herein. Investors are advised to read and understand the contents of the Information Memorandum dated 11 February 2020 and all the respective Product Highlights Sheet(s) (collectively, the “Offering Documents”), obtainable at our offices or website, before investing. The Offering Documents have been registered with the Securities Commission Malaysia (SC), however the registration with the SC does not amount to nor indicate that the SC has recommended or endorsed the product. Where a unit split/distribution is declared, investors are advised that following the issue of additional units/distribution, the NAV per unit will be reduced from the pre-unit split NAV/cum-distribution NAV to post-unit split NAV/ex-distribution NAV; and where a unit split is declared, the value of your investment in the Fund’s denominated currency will remained unchanged after the distribution of the additional units. Past performances are not an indication of future performances. There are risks involved with investing in unit trust funds; wholesale funds and/or Private Retirement Schemes. Some of these risks associated with investments in unit trust funds; wholesale funds and/or Private Retirement Schemes are interest rate fluctuation risk, foreign exchange or currency risk, country risk, political risk, credit risk, non-compliance risk, counterparty risk, target fund manager risk, liquidity risk and interest rate risk. For further details on the risk profile of all the funds, please refer to the Risk Factors section in the Offering Documents. The price of units and income distribution may go down as well as up. Investors should compare and consider the fees, charges and costs involved. Investors are advised to conduct own risk assessment and consult the professional advisers if in doubt on the action to be taken.
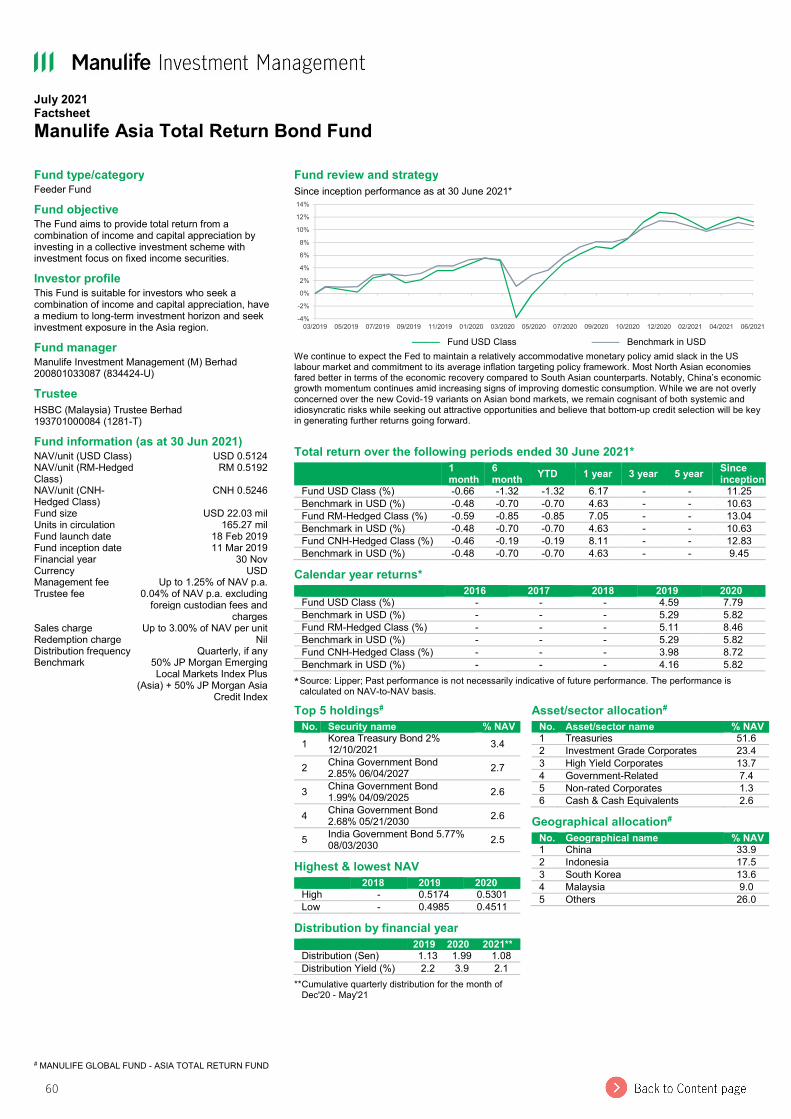
60
July 2021 Factsheet Manulife Asia Total Return Bond Fund
# MANULIFE GLOBAL FUND - ASIA TOTAL RETURN FUND
Fund type/category Feeder Fund Fund objective The Fund aims to provide total return from a combination of income and capital appreciation by investing in a collective investment scheme with investment focus on fixed income securities. Investor profile This Fund is suitable for investors who seek a combination of income and capital appreciation, have a medium to long-term investment horizon and seek investment exposure in the Asia region. Fund manager Manulife Investment Management (M) Berhad 200801033087 (834424-U) Trustee HSBC (Malaysia) Trustee Berhad 193701000084 (1281-T) Fund information (as at 30 Jun 2021) NAV/unit (USD Class) USD 0.5124 NAV/unit (RM-Hedged Class)
RM 0.5192 NAV/unit (CNH-Hedged Class)
CNH 0.5246 Fund size USD 22.03 mil Units in circulation 165.27 mil Fund launch date 18 Feb 2019 Fund inception date 11 Mar 2019 Financial year 30 Nov Currency USD Management fee Up to 1.25% of NAV p.a. Trustee fee 0.04% of NAV p.a. excluding
foreign custodian fees and charges
Sales charge Up to 3.00% of NAV per unit Redemption charge Nil Distribution frequency Quarterly, if any Benchmark 50% JP Morgan Emerging
Local Markets Index Plus (Asia) + 50% JP Morgan Asia
Credit Index
Fund review and strategy Since inception performance as at 30 June 2021*
——— Fund USD Class ——— Benchmark in USD
We continue to expect the Fed to maintain a relatively accommodative monetary policy amid slack in the US labour market and commitment to its average inflation targeting policy framework. Most North Asian economies fared better in terms of the economic recovery compared to South Asian counterparts. Notably, China’s economic growth momentum continues amid increasing signs of improving domestic consumption. While we are not overly concerned over the new Covid-19 variants on Asian bond markets, we remain cognisant of both systemic and idiosyncratic risks while seeking out attractive opportunities and believe that bottom-up credit selection will be key in generating further returns going forward.
Total return over the following periods ended 30 June 2021*
1 month
6 month YTD 1 year 3 year 5 year Since
inception Fund USD Class (%) -0.66 -1.32 -1.32 6.17 - - 11.25 Benchmark in USD (%) -0.48 -0.70 -0.70 4.63 - - 10.63 Fund RM-Hedged Class (%) -0.59 -0.85 -0.85 7.05 - - 13.04 Benchmark in USD (%) -0.48 -0.70 -0.70 4.63 - - 10.63 Fund CNH-Hedged Class (%) -0.46 -0.19 -0.19 8.11 - - 12.83 Benchmark in USD (%) -0.48 -0.70 -0.70 4.63 - - 9.45
Calendar year returns* 2016 2017 2018 2019 2020
Fund USD Class (%) - - - 4.59 7.79 Benchmark in USD (%) - - - 5.29 5.82 Fund RM-Hedged Class (%) - - - 5.11 8.46 Benchmark in USD (%) - - - 5.29 5.82 Fund CNH-Hedged Class (%) - - - 3.98 8.72 Benchmark in USD (%) - - - 4.16 5.82
* Source: Lipper; Past performance is not necessarily indicative of future performance. The performance is calculated on NAV-to-NAV basis.
-4%
-2%
0%
2%
4%
6%
8%
10%
12%
14%
03/2019 05/2019 07/2019 09/2019 11/2019 01/2020 03/2020 05/2020 07/2020 09/2020 10/2020 12/2020 02/2021 04/2021 06/2021
Top 5 holdings# No. Security name % NAV
1 Korea Treasury Bond 2% 12/10/2021 3.4
2 China Government Bond 2.85% 06/04/2027 2.7
3 China Government Bond 1.99% 04/09/2025 2.6
4 China Government Bond 2.68% 05/21/2030 2.6
5 India Government Bond 5.77% 08/03/2030 2.5
Highest & lowest NAV 2018 2019 2020
High - 0.5174 0.5301 Low - 0.4985 0.4511
Distribution by financial year 2019 2020 2021**
Distribution (Sen) 1.13 1.99 1.08 Distribution Yield (%) 2.2 3.9 2.1
** Cumulative quarterly distribution for the month of Dec'20 - May'21
Asset/sector allocation# No. Asset/sector name % NAV
1 Treasuries 51.6 2 Investment Grade Corporates 23.4 3 High Yield Corporates 13.7 4 Government-Related 7.4 5 Non-rated Corporates 1.3 6 Cash & Cash Equivalents 2.6
Geographical allocation# No. Geographical name % NAV
1 China 33.9 2 Indonesia 17.5 3 South Korea 13.6 4 Malaysia 9.0 5 Others 26.0
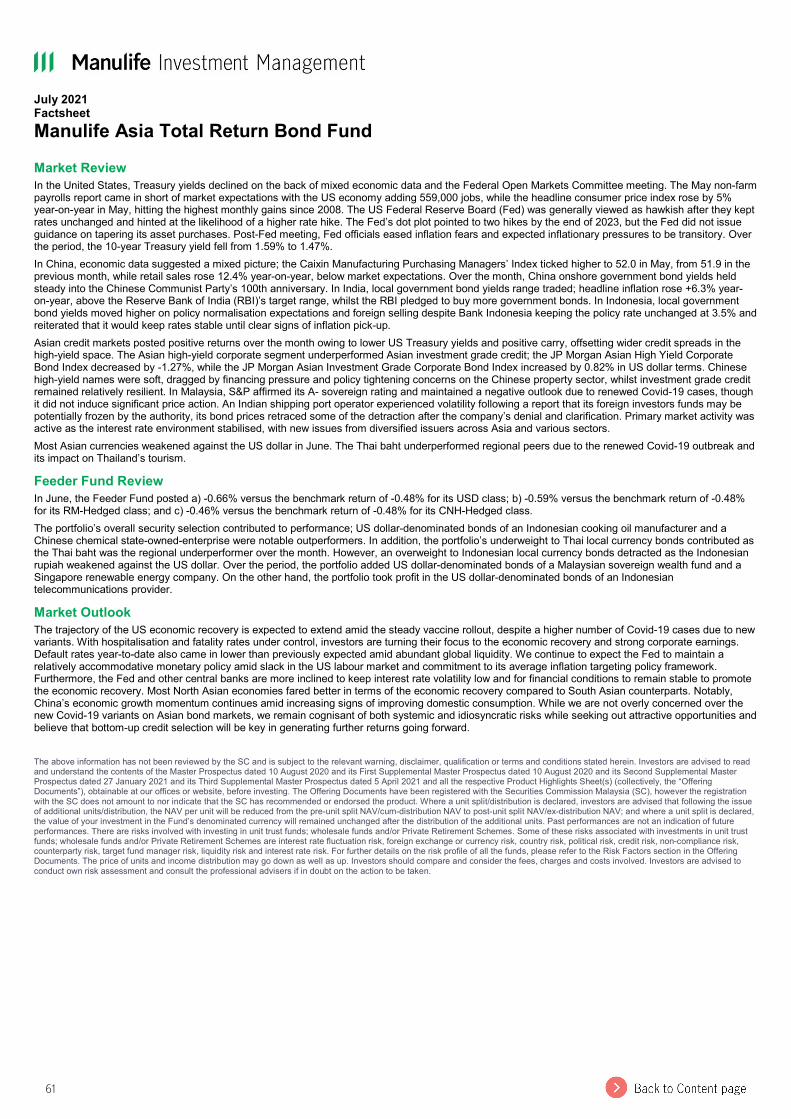
61
July 2021 Factsheet Manulife Asia Total Return Bond Fund Market Review In the United States, Treasury yields declined on the back of mixed economic data and the Federal Open Markets Committee meeting. The May non-farm payrolls report came in short of market expectations with the US economy adding 559,000 jobs, while the headline consumer price index rose by 5% year-on-year in May, hitting the highest monthly gains since 2008. The US Federal Reserve Board (Fed) was generally viewed as hawkish after they kept rates unchanged and hinted at the likelihood of a higher rate hike. The Fed’s dot plot pointed to two hikes by the end of 2023, but the Fed did not issue guidance on tapering its asset purchases. Post-Fed meeting, Fed officials eased inflation fears and expected inflationary pressures to be transitory. Over the period, the 10-year Treasury yield fell from 1.59% to 1.47%. In China, economic data suggested a mixed picture; the Caixin Manufacturing Purchasing Managers’ Index ticked higher to 52.0 in May, from 51.9 in the previous month, while retail sales rose 12.4% year-on-year, below market expectations. Over the month, China onshore government bond yields held steady into the Chinese Communist Party’s 100th anniversary. In India, local government bond yields range traded; headline inflation rose +6.3% year-on-year, above the Reserve Bank of India (RBI)’s target range, whilst the RBI pledged to buy more government bonds. In Indonesia, local government bond yields moved higher on policy normalisation expectations and foreign selling despite Bank Indonesia keeping the policy rate unchanged at 3.5% and reiterated that it would keep rates stable until clear signs of inflation pick-up. Asian credit markets posted positive returns over the month owing to lower US Treasury yields and positive carry, offsetting wider credit spreads in the high-yield space. The Asian high-yield corporate segment underperformed Asian investment grade credit; the JP Morgan Asian High Yield Corporate Bond Index decreased by -1.27%, while the JP Morgan Asian Investment Grade Corporate Bond Index increased by 0.82% in US dollar terms. Chinese high-yield names were soft, dragged by financing pressure and policy tightening concerns on the Chinese property sector, whilst investment grade credit remained relatively resilient. In Malaysia, S&P affirmed its A- sovereign rating and maintained a negative outlook due to renewed Covid-19 cases, though it did not induce significant price action. An Indian shipping port operator experienced volatility following a report that its foreign investors funds may be potentially frozen by the authority, its bond prices retraced some of the detraction after the company’s denial and clarification. Primary market activity was active as the interest rate environment stabilised, with new issues from diversified issuers across Asia and various sectors. Most Asian currencies weakened against the US dollar in June. The Thai baht underperformed regional peers due to the renewed Covid-19 outbreak and its impact on Thailand’s tourism. Feeder Fund Review In June, the Feeder Fund posted a) -0.66% versus the benchmark return of -0.48% for its USD class; b) -0.59% versus the benchmark return of -0.48% for its RM-Hedged class; and c) -0.46% versus the benchmark return of -0.48% for its CNH-Hedged class. The portfolio’s overall security selection contributed to performance; US dollar-denominated bonds of an Indonesian cooking oil manufacturer and a Chinese chemical state-owned-enterprise were notable outperformers. In addition, the portfolio’s underweight to Thai local currency bonds contributed as the Thai baht was the regional underperformer over the month. However, an overweight to Indonesian local currency bonds detracted as the Indonesian rupiah weakened against the US dollar. Over the period, the portfolio added US dollar-denominated bonds of a Malaysian sovereign wealth fund and a Singapore renewable energy company. On the other hand, the portfolio took profit in the US dollar-denominated bonds of an Indonesian telecommunications provider. Market Outlook The trajectory of the US economic recovery is expected to extend amid the steady vaccine rollout, despite a higher number of Covid-19 cases due to new variants. With hospitalisation and fatality rates under control, investors are turning their focus to the economic recovery and strong corporate earnings. Default rates year-to-date also came in lower than previously expected amid abundant global liquidity. We continue to expect the Fed to maintain a relatively accommodative monetary policy amid slack in the US labour market and commitment to its average inflation targeting policy framework. Furthermore, the Fed and other central banks are more inclined to keep interest rate volatility low and for financial conditions to remain stable to promote the economic recovery. Most North Asian economies fared better in terms of the economic recovery compared to South Asian counterparts. Notably, China’s economic growth momentum continues amid increasing signs of improving domestic consumption. While we are not overly concerned over the new Covid-19 variants on Asian bond markets, we remain cognisant of both systemic and idiosyncratic risks while seeking out attractive opportunities and believe that bottom-up credit selection will be key in generating further returns going forward. The above information has not been reviewed by the SC and is subject to the relevant warning, disclaimer, qualification or terms and conditions stated herein. Investors are advised to read and understand the contents of the Master Prospectus dated 10 August 2020 and its First Supplemental Master Prospectus dated 10 August 2020 and its Second Supplemental Master Prospectus dated 27 January 2021 and its Third Supplemental Master Prospectus dated 5 April 2021 and all the respective Product Highlights Sheet(s) (collectively, the “Offering Documents”), obtainable at our offices or website, before investing. The Offering Documents have been registered with the Securities Commission Malaysia (SC), however the registration with the SC does not amount to nor indicate that the SC has recommended or endorsed the product. Where a unit split/distribution is declared, investors are advised that following the issue of additional units/distribution, the NAV per unit will be reduced from the pre-unit split NAV/cum-distribution NAV to post-unit split NAV/ex-distribution NAV; and where a unit split is declared, the value of your investment in the Fund’s denominated currency will remained unchanged after the distribution of the additional units. Past performances are not an indication of future performances. There are risks involved with investing in unit trust funds; wholesale funds and/or Private Retirement Schemes. Some of these risks associated with investments in unit trust funds; wholesale funds and/or Private Retirement Schemes are interest rate fluctuation risk, foreign exchange or currency risk, country risk, political risk, credit risk, non-compliance risk, counterparty risk, target fund manager risk, liquidity risk and interest rate risk. For further details on the risk profile of all the funds, please refer to the Risk Factors section in the Offering Documents. The price of units and income distribution may go down as well as up. Investors should compare and consider the fees, charges and costs involved. Investors are advised to conduct own risk assessment and consult the professional advisers if in doubt on the action to be taken.

62
July 2021 Factsheet Manulife Bond Plus Fund
~ You are advised not to solely rely upon the ratings or rankings disclosed herein in making an investment decision. The ratings or rankings disclosed herein are current; the same may change in the future.
Fund type/category Bond Fund objective The Fund aims to maximize returns from a combination of income* and capital appreciation by investing primarily in fixed income securities. *Note: Income distribution (if any) may be made in the form of cash or additional units reinvested into the Fund. Investor profile This Fund would be suitable for investors who have low to moderate risk tolerance with a medium to long term investment horizon; and seek a steady income stream for their investments. Fund manager Manulife Investment Management (M) Berhad 200801033087 (834424-U) Trustee HSBC (Malaysia) Trustee Berhad 193701000084 (1281-T) Fund information (as at 30 Jun 2021) NAV/unit RM 0.5741 Fund size RM 50.49 mil Units in circulation 87.96 mil Fund launch date 29 Dec 2009 Fund inception date 18 Jan 2010 Financial year 31 Oct Currency RM Management fee Up to 1.00% of NAV p.a. Trustee fee 0.08% of NAV p.a. Subject to
a minimum fee of RM18,000 p.a. excluding foreign
custodian fees and charges. Sales charge Up to 0.50% of NAV per unit Redemption charge Nil Distribution frequency Annually, if any Benchmark Maybank 12-month Fixed
Deposit rate
Fund review and strategy 10-year performance as at 30 June 2021*
——— Fund RM Class ——— Benchmark in RM
The Fund will adopt active tactical strategies for its government bond investments while maintaining fund liquidity.
Total return over the following periods ended 30 June 2021*
1 month
6 month YTD 1 year 3 year 5 year 10 year
Fund RM Class (%) 0.40 -0.03 -0.03 2.37 16.61 24.00 50.04 Benchmark in RM (%) 0.15 0.91 0.91 1.86 8.24 15.17 34.90
Calendar year returns* 2016 2017 2018 2019 2020
Fund RM Class (%) 2.54 4.07 4.21 8.64 4.46 Benchmark in RM (%) 3.22 3.10 3.33 3.20 2.22
* Source: Lipper; Past performance is not necessarily indicative of future performance. The performance is calculated on NAV-to-NAV basis.
0%
10%
20%
30%
40%
50%
60%
06/2011 04/2012 01/2013 10/2013 07/2014 05/2015 02/2016 11/2016 08/2017 06/2018 03/2019 12/2019 09/2020 06/2021
Top 5 holdings No. Security name % NAV
1 Malaysia Government Investment Issue 3.726 03/31/26
15.7
2 Malaysia Government Investment Issue 3.151 05/15/23
11.2
3 Press Metal Aluminium Holdings Bhd 4.3 10/16/29 6.2
4 Country Garden Real Estate Sdn Bhd 6.6 02/23/23 5.3
5 UEM Sunrise Bhd 5.32 12/11/24 5.2
Highest & lowest NAV 2018 2019 2020
High 0.5714 0.5970 0.5973 Low 0.5489 0.5540 0.5672
Distribution by financial year 2018 2019 2020
Distribution (Sen) 2.25 2.85 2.40 Distribution Yield (%) 4.0 5.0 4.0
Asset/sector allocation~ No. Asset/sector name % NAV
1 AAA 6.3 2 AA 48.6 3 A 2.1 4 Government 35.1 5 Cash & Cash Equivalents 8.0
Geographical allocation No. Geographical name % NAV
1 Malaysia 92.0 2 Cash & Cash Equivalents 8.0
RM Class 3-year
Fund Volatility 2.8
Very Low Lipper Analytics
16 Jun 21
63
July 2021 Factsheet Manulife Bond Plus Fund Market Review The US Treasury (UST) yield curve flattened in June 2021; 2-year, 5-year and 10-year UST yields changed 11 bps, 9 bps and -13 bps to close at 0.25%, 0.89% and 1.47% respectively. Federal Reserve in its monetary policy meeting in June decided to move forward their projection for interest rate hike from 2024 to 2023 as inflationary pressure took centre stage. Prior to the meeting, May’s CPI had shot up to 5.0% (April: 4.2%) year-on-year, which is highest level in 13 years. The Malaysia Government Securities (MGS) yield curve steepened during the month. 3-year, 5-year and 10-year MGS yields changed -5 bps, -5 bps and +5 bps respectively to close at 2.26%, 2.54% and 3.28%. The lockdown was imminent following the spike in new Covid-19 cases to nearly 10,000 per day by end of May. Besides the elevated number seen in the daily new cases, the country was also hit by the emergence of the new delta variant of the coronavirus that is more transmissible. Fund Review In June 2021, the fund performance outperformed its benchmark, mainly due to interest income of bond holdings. Market Outlook Even as massive fiscal stimulus and steady vaccine rollout progress buoyed prospects for global economic growth, many countries are still struggling with the spread of the contagious Delta variant of COVID-19. On local shores, one month of nationwide Movement Control Order (MCO) stopped the pandemic from worsening but failed to bring infection down to intended levels. This culminated in an extension of MCO period nationwide and the implementation of Enhanced Movement Control Order (an even stricter form of MCO) in a large swath of the Klang Valley, which increases downside risks to Malaysia’s economic recovery. As a result, risk sentiment remains weak in Malaysia’s financial market. At this juncture, we are still not expecting BNM to cut OPR although downside risks to economic growth strongly underpin the ‘lower for longer’ interest rate theme which should keep short-term yields low. Yield curve is expected to remain steep as long-term yield is pressured upwards by unfavourable supply-demand dynamics and inflation expectation. Over the longer term, we anticipate MGS yields to continue its upward trajectory due to rate normalization as Malaysia gradually overcomes its Covid challenges. In the meantime, we anticipate rangebound MGS yields to continue providing income return and cushion from volatility for investors and market participants. Based on the Fund's portfolio returns as at 31 May 2021 the Volatility Factor (VF) for the Fund is as indicated in the table above and are classified as in the table (source: Lipper). "Very High" includes Funds with VF that are above 17.190, "High" includes Funds with VF that are above 14.310 but not more than 17.190, "Moderate" includes Funds with VF that are above 10.755 but not more than 14.310, "Low" includes Funds with VF that are above 3.645 but not more than 10.755 and "Very Low" includes Funds with VF that are above 0.000 but not more than 3.645 (source:FiMM). The VF means there is a possibility for the Funds in generating an upside return or downside return around this VF. The Volatility Class (VC) is assigned by Lipper based on quintile ranks of VF for qualified Funds. VF and VC are subject to monthly revision or at any interval which may be prescribed by FIMM from time to time. The Fund's portfolio may have changed since this date and there is no guarantee that the Funds will continue to have the same VF or VC in the future. Presently, only Funds launched in the market for at least 36 months will display the VF and its VC. The above information has not been reviewed by the SC and is subject to the relevant warning, disclaimer, qualification or terms and conditions stated herein. Investors are advised to read and understand the contents of the Master Prospectus dated 10 August 2020 and its First Supplemental Master Prospectus dated 10 August 2020 and its Second Supplemental Master Prospectus dated 27 January 2021 and its Third Supplemental Master Prospectus dated 5 April 2021 and all the respective Product Highlights Sheet(s) (collectively, the “Offering Documents”), obtainable at our offices or website, before investing. The Offering Documents have been registered with the Securities Commission Malaysia (SC), however the registration with the SC does not amount to nor indicate that the SC has recommended or endorsed the product. Where a unit split/distribution is declared, investors are advised that following the issue of additional units/distribution, the NAV per unit will be reduced from the pre-unit split NAV/cum-distribution NAV to post-unit split NAV/ex-distribution NAV; and where a unit split is declared, the value of your investment in the Fund’s denominated currency will remained unchanged after the distribution of the additional units. Past performances are not an indication of future performances. There are risks involved with investing in unit trust funds; wholesale funds and/or Private Retirement Schemes. Some of these risks associated with investments in unit trust funds; wholesale funds and/or Private Retirement Schemes are interest rate fluctuation risk, foreign exchange or currency risk, country risk, political risk, credit risk, non-compliance risk, counterparty risk, target fund manager risk, liquidity risk and interest rate risk. For further details on the risk profile of all the funds, please refer to the Risk Factors section in the Offering Documents. The price of units and income distribution may go down as well as up. Investors should compare and consider the fees, charges and costs involved. Investors are advised to conduct own risk assessment and consult the professional advisers if in doubt on the action to be taken.
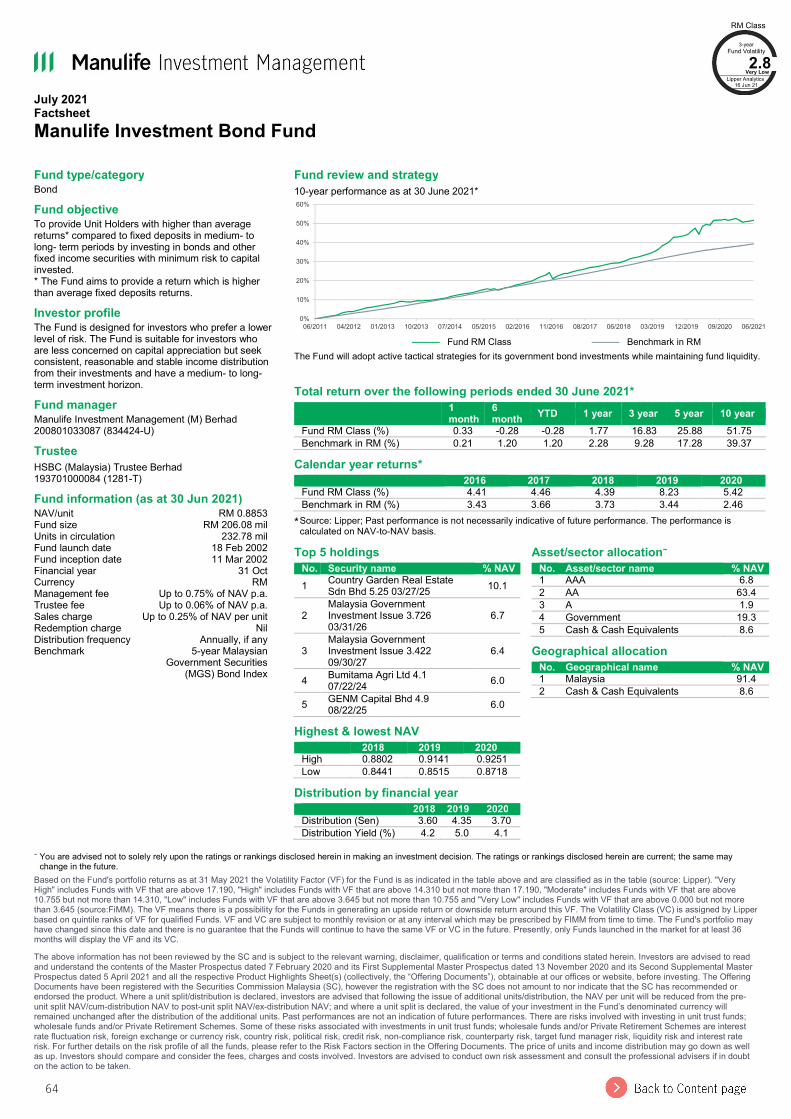
64
July 2021 Factsheet Manulife Investment Bond Fund
~ You are advised not to solely rely upon the ratings or rankings disclosed herein in making an investment decision. The ratings or rankings disclosed herein are current; the same may change in the future.
Based on the Fund's portfolio returns as at 31 May 2021 the Volatility Factor (VF) for the Fund is as indicated in the table above and are classified as in the table (source: Lipper). "Very High" includes Funds with VF that are above 17.190, "High" includes Funds with VF that are above 14.310 but not more than 17.190, "Moderate" includes Funds with VF that are above 10.755 but not more than 14.310, "Low" includes Funds with VF that are above 3.645 but not more than 10.755 and "Very Low" includes Funds with VF that are above 0.000 but not more than 3.645 (source:FiMM). The VF means there is a possibility for the Funds in generating an upside return or downside return around this VF. The Volatility Class (VC) is assigned by Lipper based on quintile ranks of VF for qualified Funds. VF and VC are subject to monthly revision or at any interval which may be prescribed by FIMM from time to time. The Fund's portfolio may have changed since this date and there is no guarantee that the Funds will continue to have the same VF or VC in the future. Presently, only Funds launched in the market for at least 36 months will display the VF and its VC. The above information has not been reviewed by the SC and is subject to the relevant warning, disclaimer, qualification or terms and conditions stated herein. Investors are advised to read and understand the contents of the Master Prospectus dated 7 February 2020 and its First Supplemental Master Prospectus dated 13 November 2020 and its Second Supplemental Master Prospectus dated 5 April 2021 and all the respective Product Highlights Sheet(s) (collectively, the “Offering Documents”), obtainable at our offices or website, before investing. The Offering Documents have been registered with the Securities Commission Malaysia (SC), however the registration with the SC does not amount to nor indicate that the SC has recommended or endorsed the product. Where a unit split/distribution is declared, investors are advised that following the issue of additional units/distribution, the NAV per unit will be reduced from the pre-unit split NAV/cum-distribution NAV to post-unit split NAV/ex-distribution NAV; and where a unit split is declared, the value of your investment in the Fund’s denominated currency will remained unchanged after the distribution of the additional units. Past performances are not an indication of future performances. There are risks involved with investing in unit trust funds; wholesale funds and/or Private Retirement Schemes. Some of these risks associated with investments in unit trust funds; wholesale funds and/or Private Retirement Schemes are interest rate fluctuation risk, foreign exchange or currency risk, country risk, political risk, credit risk, non-compliance risk, counterparty risk, target fund manager risk, liquidity risk and interest rate risk. For further details on the risk profile of all the funds, please refer to the Risk Factors section in the Offering Documents. The price of units and income distribution may go down as well as up. Investors should compare and consider the fees, charges and costs involved. Investors are advised to conduct own risk assessment and consult the professional advisers if in doubt on the action to be taken.
Fund type/category Bond Fund objective To provide Unit Holders with higher than average returns* compared to fixed deposits in medium- to long- term periods by investing in bonds and other fixed income securities with minimum risk to capital invested. * The Fund aims to provide a return which is higher than average fixed deposits returns. Investor profile The Fund is designed for investors who prefer a lower level of risk. The Fund is suitable for investors who are less concerned on capital appreciation but seek consistent, reasonable and stable income distribution from their investments and have a medium- to long-term investment horizon. Fund manager Manulife Investment Management (M) Berhad 200801033087 (834424-U) Trustee HSBC (Malaysia) Trustee Berhad 193701000084 (1281-T) Fund information (as at 30 Jun 2021) NAV/unit RM 0.8853 Fund size RM 206.08 mil Units in circulation 232.78 mil Fund launch date 18 Feb 2002 Fund inception date 11 Mar 2002 Financial year 31 Oct Currency RM Management fee Up to 0.75% of NAV p.a. Trustee fee Up to 0.06% of NAV p.a. Sales charge Up to 0.25% of NAV per unit Redemption charge Nil Distribution frequency Annually, if any Benchmark 5-year Malaysian
Government Securities (MGS) Bond Index
Fund review and strategy 10-year performance as at 30 June 2021*
——— Fund RM Class ——— Benchmark in RM
The Fund will adopt active tactical strategies for its government bond investments while maintaining fund liquidity.
Total return over the following periods ended 30 June 2021*
1 month
6 month YTD 1 year 3 year 5 year 10 year
Fund RM Class (%) 0.33 -0.28 -0.28 1.77 16.83 25.88 51.75 Benchmark in RM (%) 0.21 1.20 1.20 2.28 9.28 17.28 39.37
Calendar year returns* 2016 2017 2018 2019 2020
Fund RM Class (%) 4.41 4.46 4.39 8.23 5.42 Benchmark in RM (%) 3.43 3.66 3.73 3.44 2.46
* Source: Lipper; Past performance is not necessarily indicative of future performance. The performance is calculated on NAV-to-NAV basis.
0%
10%
20%
30%
40%
50%
60%
06/2011 04/2012 01/2013 10/2013 07/2014 05/2015 02/2016 11/2016 08/2017 06/2018 03/2019 12/2019 09/2020 06/2021
Top 5 holdings No. Security name % NAV
1 Country Garden Real Estate Sdn Bhd 5.25 03/27/25 10.1
2 Malaysia Government Investment Issue 3.726 03/31/26
6.7
3 Malaysia Government Investment Issue 3.422 09/30/27
6.4
4 Bumitama Agri Ltd 4.1 07/22/24 6.0
5 GENM Capital Bhd 4.9 08/22/25 6.0
Highest & lowest NAV 2018 2019 2020
High 0.8802 0.9141 0.9251 Low 0.8441 0.8515 0.8718
Distribution by financial year 2018 2019 2020
Distribution (Sen) 3.60 4.35 3.70 Distribution Yield (%) 4.2 5.0 4.1
Asset/sector allocation~ No. Asset/sector name % NAV
1 AAA 6.8 2 AA 63.4 3 A 1.9 4 Government 19.3 5 Cash & Cash Equivalents 8.6
Geographical allocation No. Geographical name % NAV
1 Malaysia 91.4 2 Cash & Cash Equivalents 8.6
RM Class 3-year
Fund Volatility 2.8
Very Low Lipper Analytics
16 Jun 21
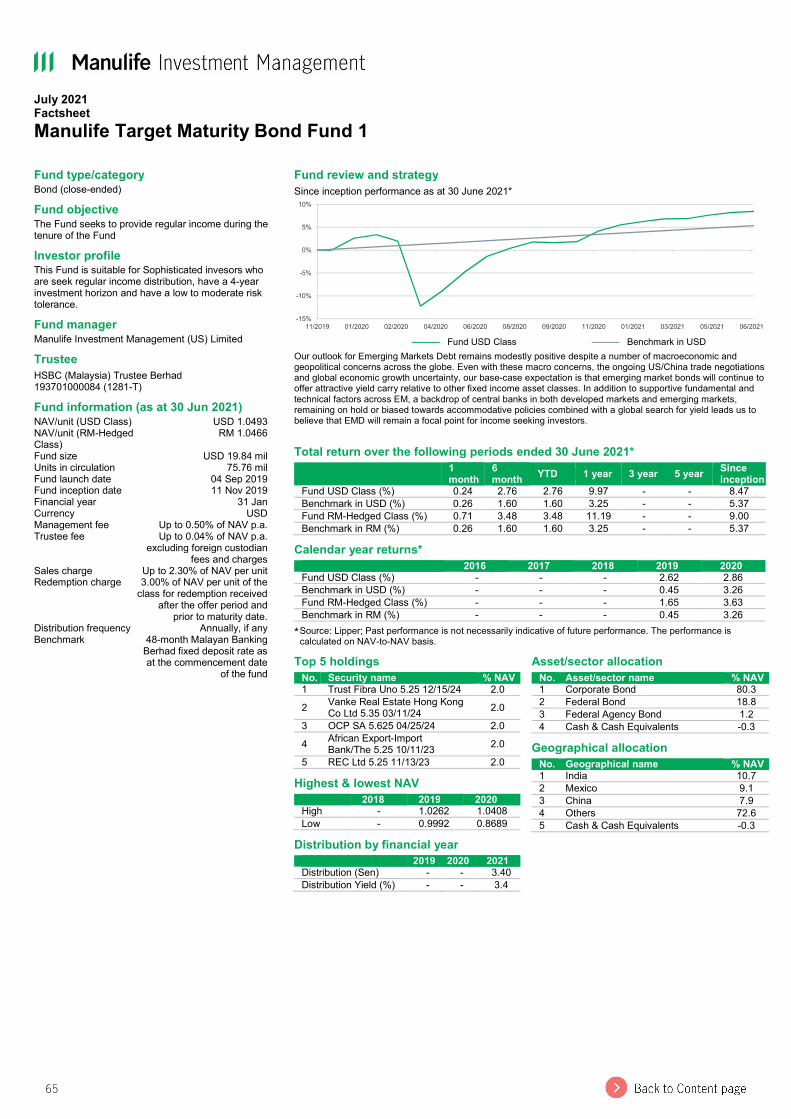
65
July 2021 Factsheet Manulife Target Maturity Bond Fund 1
Fund type/category Bond (close-ended) Fund objective The Fund seeks to provide regular income during the tenure of the Fund Investor profile This Fund is suitable for Sophisticated invesors who are seek regular income distribution, have a 4-year investment horizon and have a low to moderate risk tolerance. Fund manager Manulife Investment Management (US) Limited Trustee HSBC (Malaysia) Trustee Berhad 193701000084 (1281-T) Fund information (as at 30 Jun 2021) NAV/unit (USD Class) USD 1.0493 NAV/unit (RM-Hedged Class)
RM 1.0466 Fund size USD 19.84 mil Units in circulation 75.76 mil Fund launch date 04 Sep 2019 Fund inception date 11 Nov 2019 Financial year 31 Jan Currency USD Management fee Up to 0.50% of NAV p.a. Trustee fee Up to 0.04% of NAV p.a.
excluding foreign custodian fees and charges
Sales charge Up to 2.30% of NAV per unit Redemption charge 3.00% of NAV per unit of the
class for redemption received after the offer period and
prior to maturity date. Distribution frequency Annually, if any Benchmark 48-month Malayan Banking
Berhad fixed deposit rate as at the commencement date
of the fund
Fund review and strategy Since inception performance as at 30 June 2021*
——— Fund USD Class ——— Benchmark in USD
Our outlook for Emerging Markets Debt remains modestly positive despite a number of macroeconomic and geopolitical concerns across the globe. Even with these macro concerns, the ongoing US/China trade negotiations and global economic growth uncertainty, our base-case expectation is that emerging market bonds will continue to offer attractive yield carry relative to other fixed income asset classes. In addition to supportive fundamental and technical factors across EM, a backdrop of central banks in both developed markets and emerging markets, remaining on hold or biased towards accommodative policies combined with a global search for yield leads us to believe that EMD will remain a focal point for income seeking investors.
Total return over the following periods ended 30 June 2021*
1 month
6 month YTD 1 year 3 year 5 year Since
inception Fund USD Class (%) 0.24 2.76 2.76 9.97 - - 8.47 Benchmark in USD (%) 0.26 1.60 1.60 3.25 - - 5.37 Fund RM-Hedged Class (%) 0.71 3.48 3.48 11.19 - - 9.00 Benchmark in RM (%) 0.26 1.60 1.60 3.25 - - 5.37
Calendar year returns* 2016 2017 2018 2019 2020
Fund USD Class (%) - - - 2.62 2.86 Benchmark in USD (%) - - - 0.45 3.26 Fund RM-Hedged Class (%) - - - 1.65 3.63 Benchmark in RM (%) - - - 0.45 3.26
* Source: Lipper; Past performance is not necessarily indicative of future performance. The performance is calculated on NAV-to-NAV basis.
-15%
-10%
-5%
0%
5%
10%
11/2019 01/2020 02/2020 04/2020 06/2020 08/2020 09/2020 11/2020 01/2021 03/2021 05/2021 06/2021
Top 5 holdings No. Security name % NAV
1 Trust Fibra Uno 5.25 12/15/24 2.0 2 Vanke Real Estate Hong Kong
Co Ltd 5.35 03/11/24 2.0 3 OCP SA 5.625 04/25/24 2.0 4 African Export-Import
Bank/The 5.25 10/11/23 2.0 5 REC Ltd 5.25 11/13/23 2.0
Highest & lowest NAV 2018 2019 2020
High - 1.0262 1.0408 Low - 0.9992 0.8689
Distribution by financial year 2019 2020 2021
Distribution (Sen) - - 3.40 Distribution Yield (%) - - 3.4
Asset/sector allocation No. Asset/sector name % NAV
1 Corporate Bond 80.3 2 Federal Bond 18.8 3 Federal Agency Bond 1.2 4 Cash & Cash Equivalents -0.3
Geographical allocation No. Geographical name % NAV
1 India 10.7 2 Mexico 9.1 3 China 7.9 4 Others 72.6 5 Cash & Cash Equivalents -0.3
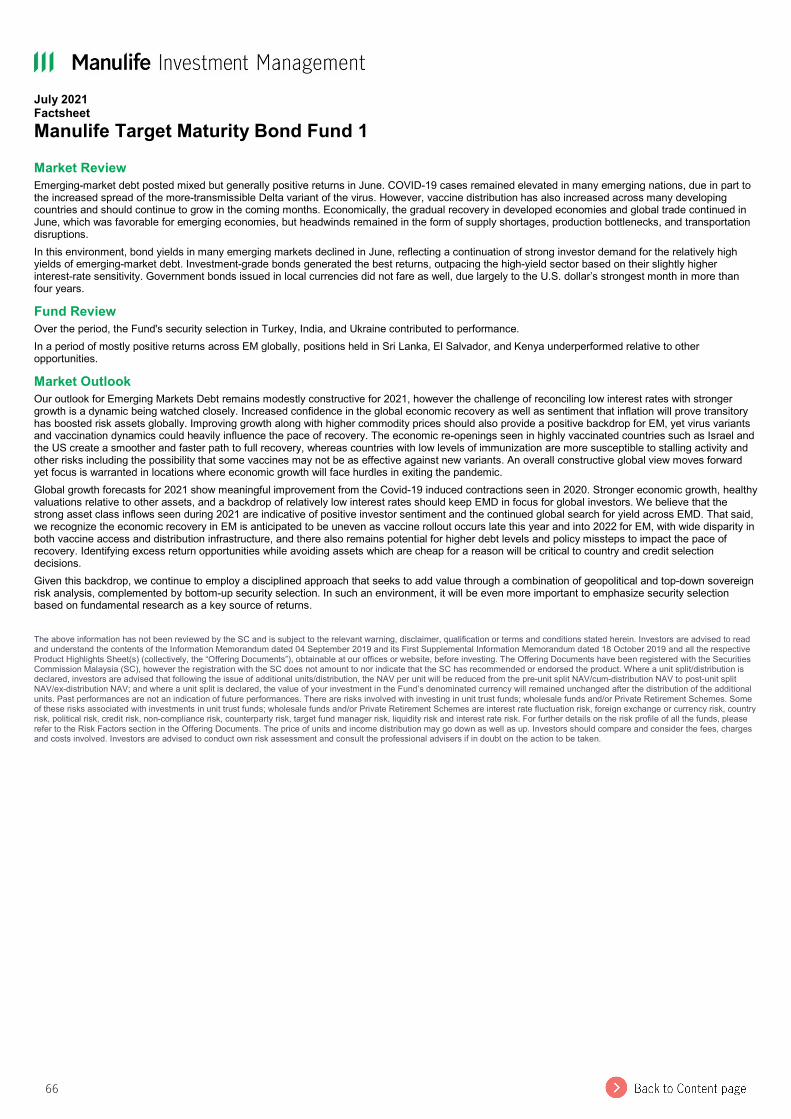
66
July 2021 Factsheet Manulife Target Maturity Bond Fund 1 Market Review Emerging-market debt posted mixed but generally positive returns in June. COVID-19 cases remained elevated in many emerging nations, due in part to the increased spread of the more-transmissible Delta variant of the virus. However, vaccine distribution has also increased across many developing countries and should continue to grow in the coming months. Economically, the gradual recovery in developed economies and global trade continued in June, which was favorable for emerging economies, but headwinds remained in the form of supply shortages, production bottlenecks, and transportation disruptions. In this environment, bond yields in many emerging markets declined in June, reflecting a continuation of strong investor demand for the relatively high yields of emerging-market debt. Investment-grade bonds generated the best returns, outpacing the high-yield sector based on their slightly higher interest-rate sensitivity. Government bonds issued in local currencies did not fare as well, due largely to the U.S. dollar’s strongest month in more than four years. Fund Review Over the period, the Fund's security selection in Turkey, India, and Ukraine contributed to performance. In a period of mostly positive returns across EM globally, positions held in Sri Lanka, El Salvador, and Kenya underperformed relative to other opportunities. Market Outlook Our outlook for Emerging Markets Debt remains modestly constructive for 2021, however the challenge of reconciling low interest rates with stronger growth is a dynamic being watched closely. Increased confidence in the global economic recovery as well as sentiment that inflation will prove transitory has boosted risk assets globally. Improving growth along with higher commodity prices should also provide a positive backdrop for EM, yet virus variants and vaccination dynamics could heavily influence the pace of recovery. The economic re-openings seen in highly vaccinated countries such as Israel and the US create a smoother and faster path to full recovery, whereas countries with low levels of immunization are more susceptible to stalling activity and other risks including the possibility that some vaccines may not be as effective against new variants. An overall constructive global view moves forward yet focus is warranted in locations where economic growth will face hurdles in exiting the pandemic. Global growth forecasts for 2021 show meaningful improvement from the Covid-19 induced contractions seen in 2020. Stronger economic growth, healthy valuations relative to other assets, and a backdrop of relatively low interest rates should keep EMD in focus for global investors. We believe that the strong asset class inflows seen during 2021 are indicative of positive investor sentiment and the continued global search for yield across EMD. That said, we recognize the economic recovery in EM is anticipated to be uneven as vaccine rollout occurs late this year and into 2022 for EM, with wide disparity in both vaccine access and distribution infrastructure, and there also remains potential for higher debt levels and policy missteps to impact the pace of recovery. Identifying excess return opportunities while avoiding assets which are cheap for a reason will be critical to country and credit selection decisions. Given this backdrop, we continue to employ a disciplined approach that seeks to add value through a combination of geopolitical and top-down sovereign risk analysis, complemented by bottom-up security selection. In such an environment, it will be even more important to emphasize security selection based on fundamental research as a key source of returns. The above information has not been reviewed by the SC and is subject to the relevant warning, disclaimer, qualification or terms and conditions stated herein. Investors are advised to read and understand the contents of the Information Memorandum dated 04 September 2019 and its First Supplemental Information Memorandum dated 18 October 2019 and all the respective Product Highlights Sheet(s) (collectively, the “Offering Documents”), obtainable at our offices or website, before investing. The Offering Documents have been registered with the Securities Commission Malaysia (SC), however the registration with the SC does not amount to nor indicate that the SC has recommended or endorsed the product. Where a unit split/distribution is declared, investors are advised that following the issue of additional units/distribution, the NAV per unit will be reduced from the pre-unit split NAV/cum-distribution NAV to post-unit split NAV/ex-distribution NAV; and where a unit split is declared, the value of your investment in the Fund’s denominated currency will remained unchanged after the distribution of the additional units. Past performances are not an indication of future performances. There are risks involved with investing in unit trust funds; wholesale funds and/or Private Retirement Schemes. Some of these risks associated with investments in unit trust funds; wholesale funds and/or Private Retirement Schemes are interest rate fluctuation risk, foreign exchange or currency risk, country risk, political risk, credit risk, non-compliance risk, counterparty risk, target fund manager risk, liquidity risk and interest rate risk. For further details on the risk profile of all the funds, please refer to the Risk Factors section in the Offering Documents. The price of units and income distribution may go down as well as up. Investors should compare and consider the fees, charges and costs involved. Investors are advised to conduct own risk assessment and consult the professional advisers if in doubt on the action to be taken.
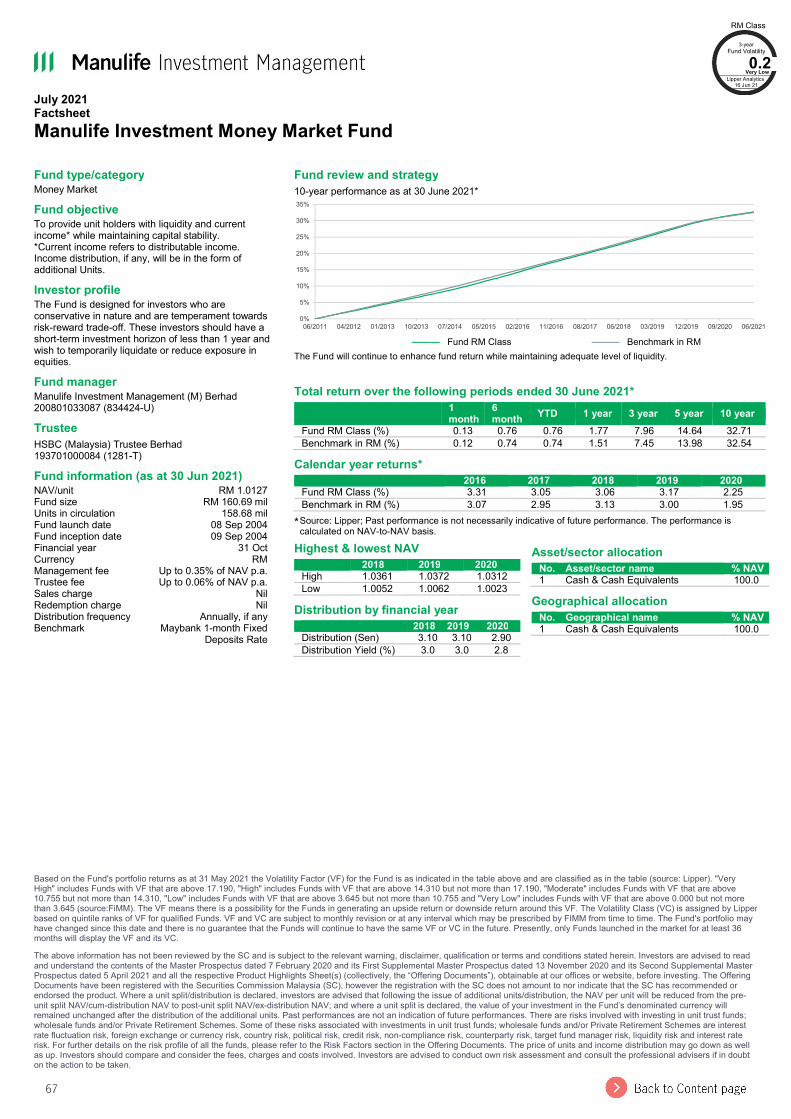
67
July 2021 Factsheet Manulife Investment Money Market Fund
Based on the Fund's portfolio returns as at 31 May 2021 the Volatility Factor (VF) for the Fund is as indicated in the table above and are classified as in the table (source: Lipper). "Very High" includes Funds with VF that are above 17.190, "High" includes Funds with VF that are above 14.310 but not more than 17.190, "Moderate" includes Funds with VF that are above 10.755 but not more than 14.310, "Low" includes Funds with VF that are above 3.645 but not more than 10.755 and "Very Low" includes Funds with VF that are above 0.000 but not more than 3.645 (source:FiMM). The VF means there is a possibility for the Funds in generating an upside return or downside return around this VF. The Volatility Class (VC) is assigned by Lipper based on quintile ranks of VF for qualified Funds. VF and VC are subject to monthly revision or at any interval which may be prescribed by FIMM from time to time. The Fund's portfolio may have changed since this date and there is no guarantee that the Funds will continue to have the same VF or VC in the future. Presently, only Funds launched in the market for at least 36 months will display the VF and its VC. The above information has not been reviewed by the SC and is subject to the relevant warning, disclaimer, qualification or terms and conditions stated herein. Investors are advised to read and understand the contents of the Master Prospectus dated 7 February 2020 and its First Supplemental Master Prospectus dated 13 November 2020 and its Second Supplemental Master Prospectus dated 5 April 2021 and all the respective Product Highlights Sheet(s) (collectively, the “Offering Documents”), obtainable at our offices or website, before investing. The Offering Documents have been registered with the Securities Commission Malaysia (SC), however the registration with the SC does not amount to nor indicate that the SC has recommended or endorsed the product. Where a unit split/distribution is declared, investors are advised that following the issue of additional units/distribution, the NAV per unit will be reduced from the pre-unit split NAV/cum-distribution NAV to post-unit split NAV/ex-distribution NAV; and where a unit split is declared, the value of your investment in the Fund’s denominated currency will remained unchanged after the distribution of the additional units. Past performances are not an indication of future performances. There are risks involved with investing in unit trust funds; wholesale funds and/or Private Retirement Schemes. Some of these risks associated with investments in unit trust funds; wholesale funds and/or Private Retirement Schemes are interest rate fluctuation risk, foreign exchange or currency risk, country risk, political risk, credit risk, non-compliance risk, counterparty risk, target fund manager risk, liquidity risk and interest rate risk. For further details on the risk profile of all the funds, please refer to the Risk Factors section in the Offering Documents. The price of units and income distribution may go down as well as up. Investors should compare and consider the fees, charges and costs involved. Investors are advised to conduct own risk assessment and consult the professional advisers if in doubt on the action to be taken.
Fund type/category Money Market Fund objective To provide unit holders with liquidity and current income* while maintaining capital stability. *Current income refers to distributable income. Income distribution, if any, will be in the form of additional Units. Investor profile The Fund is designed for investors who are conservative in nature and are temperament towards risk-reward trade-off. These investors should have a short-term investment horizon of less than 1 year and wish to temporarily liquidate or reduce exposure in equities. Fund manager Manulife Investment Management (M) Berhad 200801033087 (834424-U) Trustee HSBC (Malaysia) Trustee Berhad 193701000084 (1281-T) Fund information (as at 30 Jun 2021) NAV/unit RM 1.0127 Fund size RM 160.69 mil Units in circulation 158.68 mil Fund launch date 08 Sep 2004 Fund inception date 09 Sep 2004 Financial year 31 Oct Currency RM Management fee Up to 0.35% of NAV p.a. Trustee fee Up to 0.06% of NAV p.a. Sales charge Nil Redemption charge Nil Distribution frequency Annually, if any Benchmark Maybank 1-month Fixed
Deposits Rate
Fund review and strategy 10-year performance as at 30 June 2021*
——— Fund RM Class ——— Benchmark in RM
The Fund will continue to enhance fund return while maintaining adequate level of liquidity.
Total return over the following periods ended 30 June 2021*
1 month
6 month YTD 1 year 3 year 5 year 10 year
Fund RM Class (%) 0.13 0.76 0.76 1.77 7.96 14.64 32.71 Benchmark in RM (%) 0.12 0.74 0.74 1.51 7.45 13.98 32.54
Calendar year returns* 2016 2017 2018 2019 2020
Fund RM Class (%) 3.31 3.05 3.06 3.17 2.25 Benchmark in RM (%) 3.07 2.95 3.13 3.00 1.95
* Source: Lipper; Past performance is not necessarily indicative of future performance. The performance is calculated on NAV-to-NAV basis.
0%
5%
10%
15%
20%
25%
30%
35%
06/2011 04/2012 01/2013 10/2013 07/2014 05/2015 02/2016 11/2016 08/2017 06/2018 03/2019 12/2019 09/2020 06/2021
Highest & lowest NAV 2018 2019 2020
High 1.0361 1.0372 1.0312 Low 1.0052 1.0062 1.0023
Distribution by financial year 2018 2019 2020
Distribution (Sen) 3.10 3.10 2.90 Distribution Yield (%) 3.0 3.0 2.8
Asset/sector allocation No. Asset/sector name % NAV
1 Cash & Cash Equivalents 100.0 Geographical allocation No. Geographical name % NAV
1 Cash & Cash Equivalents 100.0
RM Class 3-year
Fund Volatility 0.2
Very Low Lipper Analytics
16 Jun 21
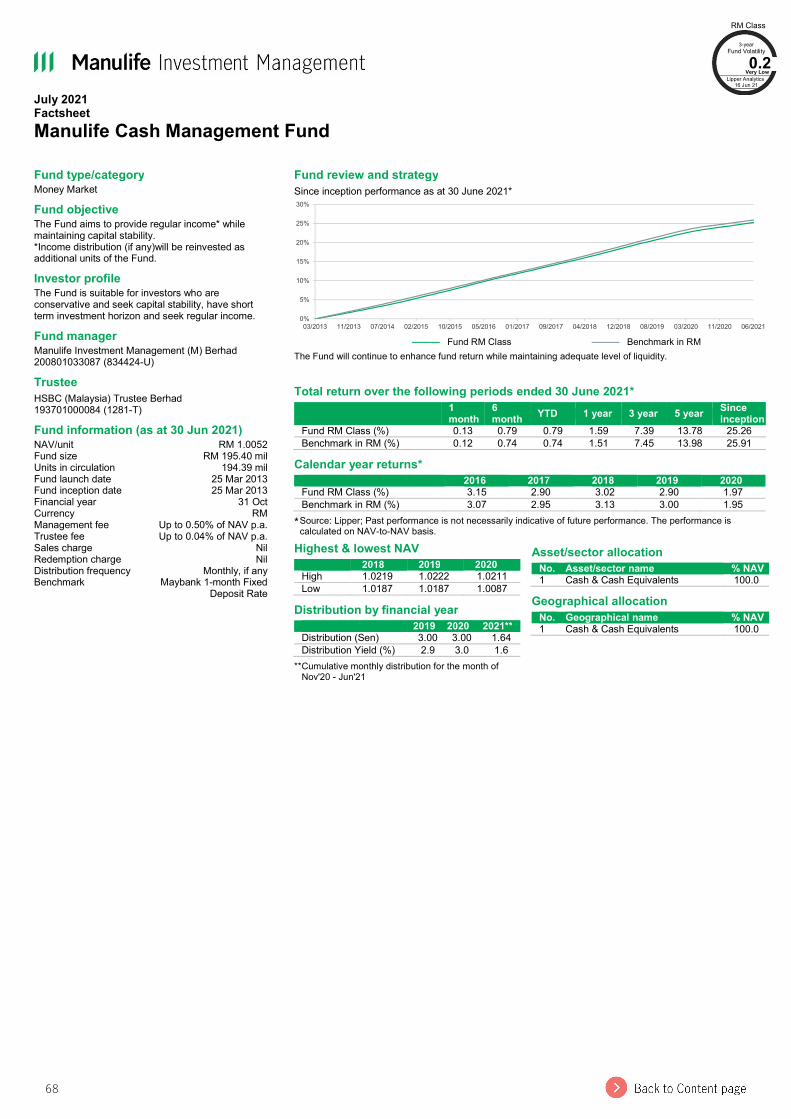
68
July 2021 Factsheet Manulife Cash Management Fund
Fund type/category Money Market Fund objective The Fund aims to provide regular income* while maintaining capital stability. *Income distribution (if any)will be reinvested as additional units of the Fund. Investor profile The Fund is suitable for investors who are conservative and seek capital stability, have short term investment horizon and seek regular income. Fund manager Manulife Investment Management (M) Berhad 200801033087 (834424-U) Trustee HSBC (Malaysia) Trustee Berhad 193701000084 (1281-T) Fund information (as at 30 Jun 2021) NAV/unit RM 1.0052 Fund size RM 195.40 mil Units in circulation 194.39 mil Fund launch date 25 Mar 2013 Fund inception date 25 Mar 2013 Financial year 31 Oct Currency RM Management fee Up to 0.50% of NAV p.a. Trustee fee Up to 0.04% of NAV p.a. Sales charge Nil Redemption charge Nil Distribution frequency Monthly, if any Benchmark Maybank 1-month Fixed
Deposit Rate
Fund review and strategy Since inception performance as at 30 June 2021*
——— Fund RM Class ——— Benchmark in RM
The Fund will continue to enhance fund return while maintaining adequate level of liquidity.
Total return over the following periods ended 30 June 2021*
1 month
6 month YTD 1 year 3 year 5 year Since
inception Fund RM Class (%) 0.13 0.79 0.79 1.59 7.39 13.78 25.26 Benchmark in RM (%) 0.12 0.74 0.74 1.51 7.45 13.98 25.91
Calendar year returns* 2016 2017 2018 2019 2020
Fund RM Class (%) 3.15 2.90 3.02 2.90 1.97 Benchmark in RM (%) 3.07 2.95 3.13 3.00 1.95
* Source: Lipper; Past performance is not necessarily indicative of future performance. The performance is calculated on NAV-to-NAV basis.
0%
5%
10%
15%
20%
25%
30%
03/2013 11/2013 07/2014 02/2015 10/2015 05/2016 01/2017 09/2017 04/2018 12/2018 08/2019 03/2020 11/2020 06/2021
Highest & lowest NAV 2018 2019 2020
High 1.0219 1.0222 1.0211 Low 1.0187 1.0187 1.0087
Distribution by financial year 2019 2020 2021**
Distribution (Sen) 3.00 3.00 1.64 Distribution Yield (%) 2.9 3.0 1.6
** Cumulative monthly distribution for the month of Nov'20 - Jun'21
Asset/sector allocation No. Asset/sector name % NAV
1 Cash & Cash Equivalents 100.0 Geographical allocation No. Geographical name % NAV
1 Cash & Cash Equivalents 100.0
RM Class 3-year
Fund Volatility 0.2
Very Low Lipper Analytics
16 Jun 21
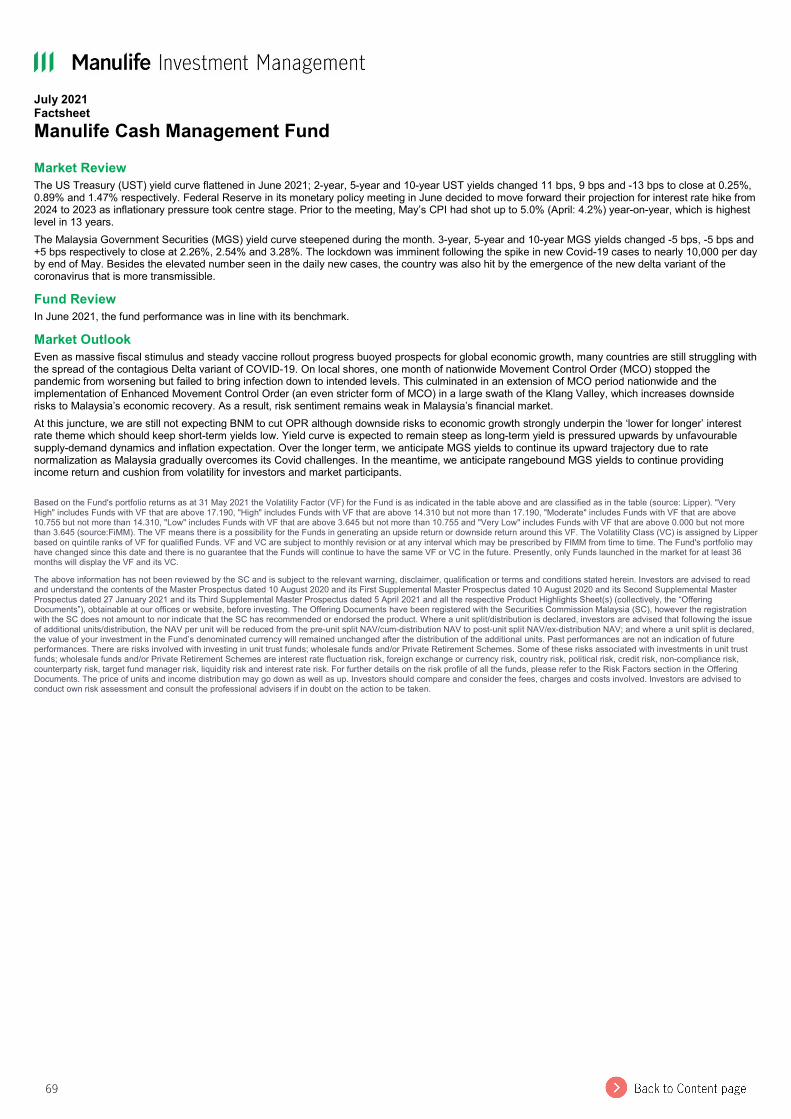
69
July 2021 Factsheet Manulife Cash Management Fund Market Review The US Treasury (UST) yield curve flattened in June 2021; 2-year, 5-year and 10-year UST yields changed 11 bps, 9 bps and -13 bps to close at 0.25%, 0.89% and 1.47% respectively. Federal Reserve in its monetary policy meeting in June decided to move forward their projection for interest rate hike from 2024 to 2023 as inflationary pressure took centre stage. Prior to the meeting, May’s CPI had shot up to 5.0% (April: 4.2%) year-on-year, which is highest level in 13 years. The Malaysia Government Securities (MGS) yield curve steepened during the month. 3-year, 5-year and 10-year MGS yields changed -5 bps, -5 bps and +5 bps respectively to close at 2.26%, 2.54% and 3.28%. The lockdown was imminent following the spike in new Covid-19 cases to nearly 10,000 per day by end of May. Besides the elevated number seen in the daily new cases, the country was also hit by the emergence of the new delta variant of the coronavirus that is more transmissible. Fund Review In June 2021, the fund performance was in line with its benchmark. Market Outlook Even as massive fiscal stimulus and steady vaccine rollout progress buoyed prospects for global economic growth, many countries are still struggling with the spread of the contagious Delta variant of COVID-19. On local shores, one month of nationwide Movement Control Order (MCO) stopped the pandemic from worsening but failed to bring infection down to intended levels. This culminated in an extension of MCO period nationwide and the implementation of Enhanced Movement Control Order (an even stricter form of MCO) in a large swath of the Klang Valley, which increases downside risks to Malaysia’s economic recovery. As a result, risk sentiment remains weak in Malaysia’s financial market. At this juncture, we are still not expecting BNM to cut OPR although downside risks to economic growth strongly underpin the ‘lower for longer’ interest rate theme which should keep short-term yields low. Yield curve is expected to remain steep as long-term yield is pressured upwards by unfavourable supply-demand dynamics and inflation expectation. Over the longer term, we anticipate MGS yields to continue its upward trajectory due to rate normalization as Malaysia gradually overcomes its Covid challenges. In the meantime, we anticipate rangebound MGS yields to continue providing income return and cushion from volatility for investors and market participants. Based on the Fund's portfolio returns as at 31 May 2021 the Volatility Factor (VF) for the Fund is as indicated in the table above and are classified as in the table (source: Lipper). "Very High" includes Funds with VF that are above 17.190, "High" includes Funds with VF that are above 14.310 but not more than 17.190, "Moderate" includes Funds with VF that are above 10.755 but not more than 14.310, "Low" includes Funds with VF that are above 3.645 but not more than 10.755 and "Very Low" includes Funds with VF that are above 0.000 but not more than 3.645 (source:FiMM). The VF means there is a possibility for the Funds in generating an upside return or downside return around this VF. The Volatility Class (VC) is assigned by Lipper based on quintile ranks of VF for qualified Funds. VF and VC are subject to monthly revision or at any interval which may be prescribed by FIMM from time to time. The Fund's portfolio may have changed since this date and there is no guarantee that the Funds will continue to have the same VF or VC in the future. Presently, only Funds launched in the market for at least 36 months will display the VF and its VC. The above information has not been reviewed by the SC and is subject to the relevant warning, disclaimer, qualification or terms and conditions stated herein. Investors are advised to read and understand the contents of the Master Prospectus dated 10 August 2020 and its First Supplemental Master Prospectus dated 10 August 2020 and its Second Supplemental Master Prospectus dated 27 January 2021 and its Third Supplemental Master Prospectus dated 5 April 2021 and all the respective Product Highlights Sheet(s) (collectively, the “Offering Documents”), obtainable at our offices or website, before investing. The Offering Documents have been registered with the Securities Commission Malaysia (SC), however the registration with the SC does not amount to nor indicate that the SC has recommended or endorsed the product. Where a unit split/distribution is declared, investors are advised that following the issue of additional units/distribution, the NAV per unit will be reduced from the pre-unit split NAV/cum-distribution NAV to post-unit split NAV/ex-distribution NAV; and where a unit split is declared, the value of your investment in the Fund’s denominated currency will remained unchanged after the distribution of the additional units. Past performances are not an indication of future performances. There are risks involved with investing in unit trust funds; wholesale funds and/or Private Retirement Schemes. Some of these risks associated with investments in unit trust funds; wholesale funds and/or Private Retirement Schemes are interest rate fluctuation risk, foreign exchange or currency risk, country risk, political risk, credit risk, non-compliance risk, counterparty risk, target fund manager risk, liquidity risk and interest rate risk. For further details on the risk profile of all the funds, please refer to the Risk Factors section in the Offering Documents. The price of units and income distribution may go down as well as up. Investors should compare and consider the fees, charges and costs involved. Investors are advised to conduct own risk assessment and consult the professional advisers if in doubt on the action to be taken.
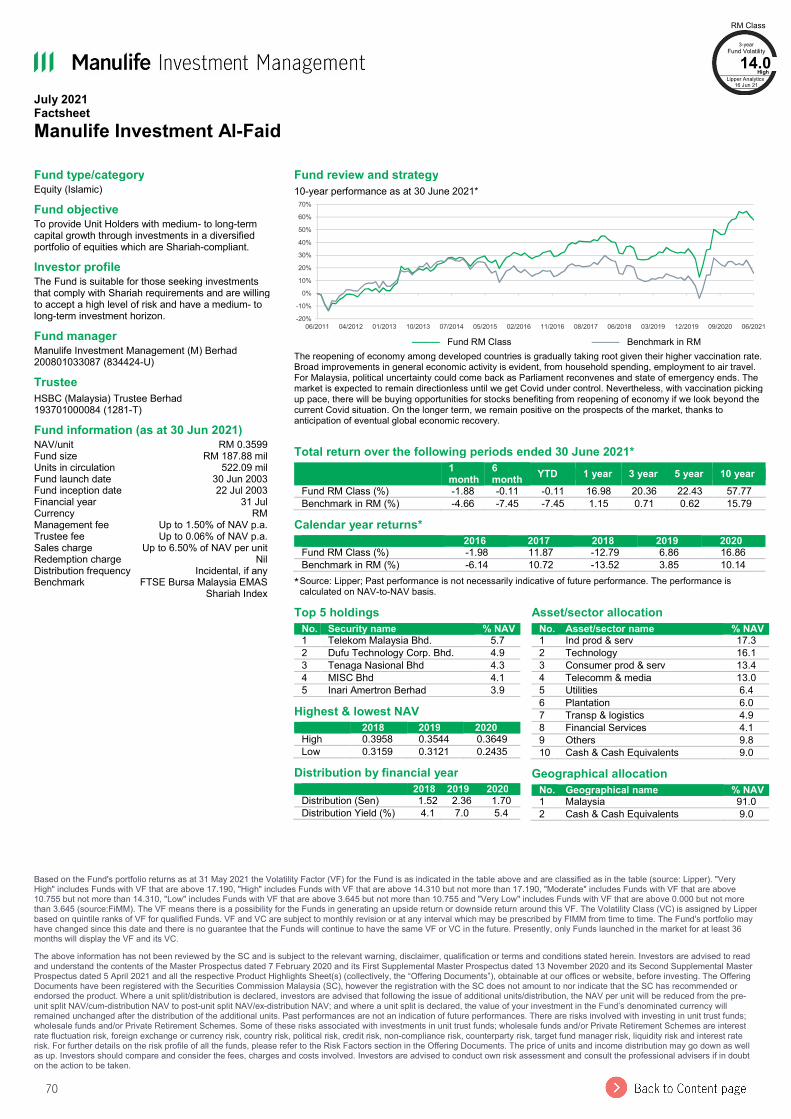
70
July 2021 Factsheet Manulife Investment Al-Faid
Based on the Fund's portfolio returns as at 31 May 2021 the Volatility Factor (VF) for the Fund is as indicated in the table above and are classified as in the table (source: Lipper). "Very High" includes Funds with VF that are above 17.190, "High" includes Funds with VF that are above 14.310 but not more than 17.190, "Moderate" includes Funds with VF that are above 10.755 but not more than 14.310, "Low" includes Funds with VF that are above 3.645 but not more than 10.755 and "Very Low" includes Funds with VF that are above 0.000 but not more than 3.645 (source:FiMM). The VF means there is a possibility for the Funds in generating an upside return or downside return around this VF. The Volatility Class (VC) is assigned by Lipper based on quintile ranks of VF for qualified Funds. VF and VC are subject to monthly revision or at any interval which may be prescribed by FIMM from time to time. The Fund's portfolio may have changed since this date and there is no guarantee that the Funds will continue to have the same VF or VC in the future. Presently, only Funds launched in the market for at least 36 months will display the VF and its VC. The above information has not been reviewed by the SC and is subject to the relevant warning, disclaimer, qualification or terms and conditions stated herein. Investors are advised to read and understand the contents of the Master Prospectus dated 7 February 2020 and its First Supplemental Master Prospectus dated 13 November 2020 and its Second Supplemental Master Prospectus dated 5 April 2021 and all the respective Product Highlights Sheet(s) (collectively, the “Offering Documents”), obtainable at our offices or website, before investing. The Offering Documents have been registered with the Securities Commission Malaysia (SC), however the registration with the SC does not amount to nor indicate that the SC has recommended or endorsed the product. Where a unit split/distribution is declared, investors are advised that following the issue of additional units/distribution, the NAV per unit will be reduced from the pre-unit split NAV/cum-distribution NAV to post-unit split NAV/ex-distribution NAV; and where a unit split is declared, the value of your investment in the Fund’s denominated currency will remained unchanged after the distribution of the additional units. Past performances are not an indication of future performances. There are risks involved with investing in unit trust funds; wholesale funds and/or Private Retirement Schemes. Some of these risks associated with investments in unit trust funds; wholesale funds and/or Private Retirement Schemes are interest rate fluctuation risk, foreign exchange or currency risk, country risk, political risk, credit risk, non-compliance risk, counterparty risk, target fund manager risk, liquidity risk and interest rate risk. For further details on the risk profile of all the funds, please refer to the Risk Factors section in the Offering Documents. The price of units and income distribution may go down as well as up. Investors should compare and consider the fees, charges and costs involved. Investors are advised to conduct own risk assessment and consult the professional advisers if in doubt on the action to be taken.
Fund type/category Equity (Islamic) Fund objective To provide Unit Holders with medium- to long-term capital growth through investments in a diversified portfolio of equities which are Shariah-compliant. Investor profile The Fund is suitable for those seeking investments that comply with Shariah requirements and are willing to accept a high level of risk and have a medium- to long-term investment horizon. Fund manager Manulife Investment Management (M) Berhad 200801033087 (834424-U) Trustee HSBC (Malaysia) Trustee Berhad 193701000084 (1281-T) Fund information (as at 30 Jun 2021) NAV/unit RM 0.3599 Fund size RM 187.88 mil Units in circulation 522.09 mil Fund launch date 30 Jun 2003 Fund inception date 22 Jul 2003 Financial year 31 Jul Currency RM Management fee Up to 1.50% of NAV p.a. Trustee fee Up to 0.06% of NAV p.a. Sales charge Up to 6.50% of NAV per unit Redemption charge Nil Distribution frequency Incidental, if any Benchmark FTSE Bursa Malaysia EMAS
Shariah Index
Fund review and strategy 10-year performance as at 30 June 2021*
——— Fund RM Class ——— Benchmark in RM
The reopening of economy among developed countries is gradually taking root given their higher vaccination rate. Broad improvements in general economic activity is evident, from household spending, employment to air travel. For Malaysia, political uncertainty could come back as Parliament reconvenes and state of emergency ends. The market is expected to remain directionless until we get Covid under control. Nevertheless, with vaccination picking up pace, there will be buying opportunities for stocks benefiting from reopening of economy if we look beyond the current Covid situation. On the longer term, we remain positive on the prospects of the market, thanks to anticipation of eventual global economic recovery.
Total return over the following periods ended 30 June 2021*
1 month
6 month YTD 1 year 3 year 5 year 10 year
Fund RM Class (%) -1.88 -0.11 -0.11 16.98 20.36 22.43 57.77 Benchmark in RM (%) -4.66 -7.45 -7.45 1.15 0.71 0.62 15.79
Calendar year returns* 2016 2017 2018 2019 2020
Fund RM Class (%) -1.98 11.87 -12.79 6.86 16.86 Benchmark in RM (%) -6.14 10.72 -13.52 3.85 10.14
* Source: Lipper; Past performance is not necessarily indicative of future performance. The performance is calculated on NAV-to-NAV basis.
-20%
-10%
0%
10%
20%
30%
40%
50%
60%
70%
06/2011 04/2012 01/2013 10/2013 07/2014 05/2015 02/2016 11/2016 08/2017 06/2018 03/2019 12/2019 09/2020 06/2021
Top 5 holdings No. Security name % NAV
1 Telekom Malaysia Bhd. 5.7 2 Dufu Technology Corp. Bhd. 4.9 3 Tenaga Nasional Bhd 4.3 4 MISC Bhd 4.1 5 Inari Amertron Berhad 3.9
Highest & lowest NAV 2018 2019 2020
High 0.3958 0.3544 0.3649 Low 0.3159 0.3121 0.2435
Distribution by financial year 2018 2019 2020
Distribution (Sen) 1.52 2.36 1.70 Distribution Yield (%) 4.1 7.0 5.4
Asset/sector allocation No. Asset/sector name % NAV
1 Ind prod & serv 17.3 2 Technology 16.1 3 Consumer prod & serv 13.4 4 Telecomm & media 13.0 5 Utilities 6.4 6 Plantation 6.0 7 Transp & logistics 4.9 8 Financial Services 4.1 9 Others 9.8 10 Cash & Cash Equivalents 9.0
Geographical allocation No. Geographical name % NAV
1 Malaysia 91.0 2 Cash & Cash Equivalents 9.0
RM Class 3-year
Fund Volatility 14.0
High Lipper Analytics
16 Jun 21
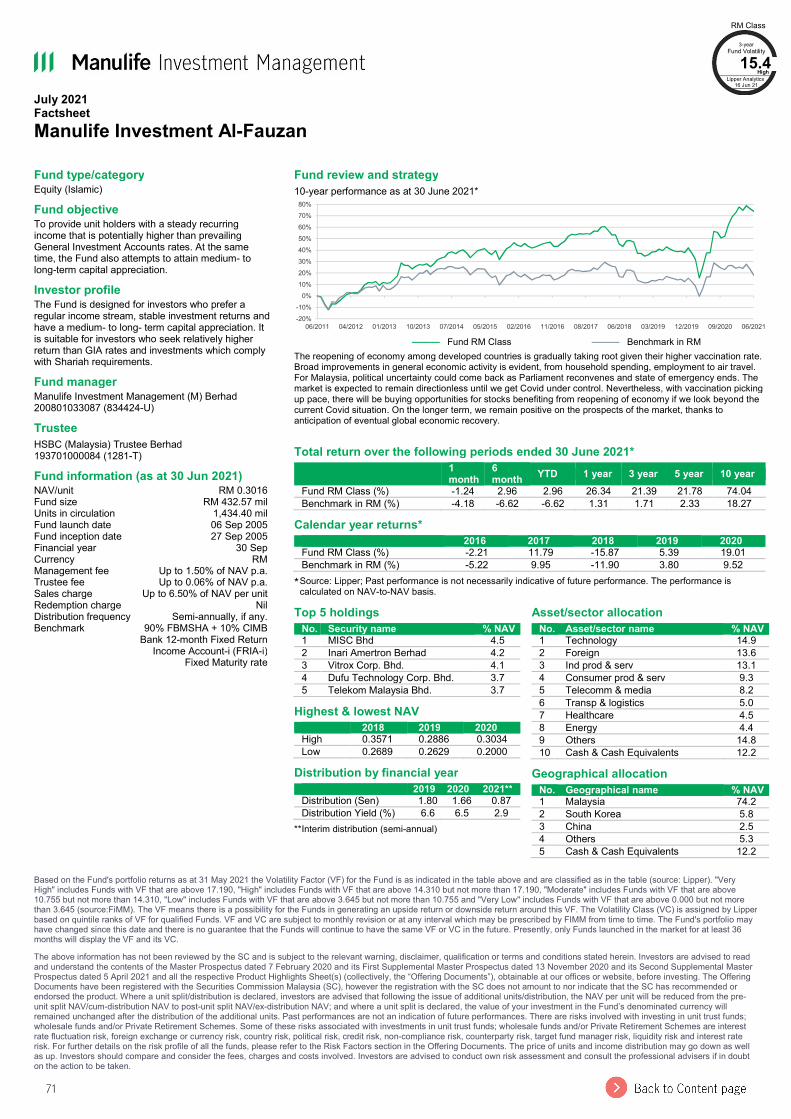
71
July 2021 Factsheet Manulife Investment Al-Fauzan
Based on the Fund's portfolio returns as at 31 May 2021 the Volatility Factor (VF) for the Fund is as indicated in the table above and are classified as in the table (source: Lipper). "Very High" includes Funds with VF that are above 17.190, "High" includes Funds with VF that are above 14.310 but not more than 17.190, "Moderate" includes Funds with VF that are above 10.755 but not more than 14.310, "Low" includes Funds with VF that are above 3.645 but not more than 10.755 and "Very Low" includes Funds with VF that are above 0.000 but not more than 3.645 (source:FiMM). The VF means there is a possibility for the Funds in generating an upside return or downside return around this VF. The Volatility Class (VC) is assigned by Lipper based on quintile ranks of VF for qualified Funds. VF and VC are subject to monthly revision or at any interval which may be prescribed by FIMM from time to time. The Fund's portfolio may have changed since this date and there is no guarantee that the Funds will continue to have the same VF or VC in the future. Presently, only Funds launched in the market for at least 36 months will display the VF and its VC. The above information has not been reviewed by the SC and is subject to the relevant warning, disclaimer, qualification or terms and conditions stated herein. Investors are advised to read and understand the contents of the Master Prospectus dated 7 February 2020 and its First Supplemental Master Prospectus dated 13 November 2020 and its Second Supplemental Master Prospectus dated 5 April 2021 and all the respective Product Highlights Sheet(s) (collectively, the “Offering Documents”), obtainable at our offices or website, before investing. The Offering Documents have been registered with the Securities Commission Malaysia (SC), however the registration with the SC does not amount to nor indicate that the SC has recommended or endorsed the product. Where a unit split/distribution is declared, investors are advised that following the issue of additional units/distribution, the NAV per unit will be reduced from the pre-unit split NAV/cum-distribution NAV to post-unit split NAV/ex-distribution NAV; and where a unit split is declared, the value of your investment in the Fund’s denominated currency will remained unchanged after the distribution of the additional units. Past performances are not an indication of future performances. There are risks involved with investing in unit trust funds; wholesale funds and/or Private Retirement Schemes. Some of these risks associated with investments in unit trust funds; wholesale funds and/or Private Retirement Schemes are interest rate fluctuation risk, foreign exchange or currency risk, country risk, political risk, credit risk, non-compliance risk, counterparty risk, target fund manager risk, liquidity risk and interest rate risk. For further details on the risk profile of all the funds, please refer to the Risk Factors section in the Offering Documents. The price of units and income distribution may go down as well as up. Investors should compare and consider the fees, charges and costs involved. Investors are advised to conduct own risk assessment and consult the professional advisers if in doubt on the action to be taken.
Fund type/category Equity (Islamic) Fund objective To provide unit holders with a steady recurring income that is potentially higher than prevailing General Investment Accounts rates. At the same time, the Fund also attempts to attain medium- to long-term capital appreciation. Investor profile The Fund is designed for investors who prefer a regular income stream, stable investment returns and have a medium- to long- term capital appreciation. It is suitable for investors who seek relatively higher return than GIA rates and investments which comply with Shariah requirements. Fund manager Manulife Investment Management (M) Berhad 200801033087 (834424-U) Trustee HSBC (Malaysia) Trustee Berhad 193701000084 (1281-T) Fund information (as at 30 Jun 2021) NAV/unit RM 0.3016 Fund size RM 432.57 mil Units in circulation 1,434.40 mil Fund launch date 06 Sep 2005 Fund inception date 27 Sep 2005 Financial year 30 Sep Currency RM Management fee Up to 1.50% of NAV p.a. Trustee fee Up to 0.06% of NAV p.a. Sales charge Up to 6.50% of NAV per unit Redemption charge Nil Distribution frequency Semi-annually, if any. Benchmark 90% FBMSHA + 10% CIMB
Bank 12-month Fixed Return Income Account-i (FRIA-i)
Fixed Maturity rate
Fund review and strategy 10-year performance as at 30 June 2021*
——— Fund RM Class ——— Benchmark in RM
The reopening of economy among developed countries is gradually taking root given their higher vaccination rate. Broad improvements in general economic activity is evident, from household spending, employment to air travel. For Malaysia, political uncertainty could come back as Parliament reconvenes and state of emergency ends. The market is expected to remain directionless until we get Covid under control. Nevertheless, with vaccination picking up pace, there will be buying opportunities for stocks benefiting from reopening of economy if we look beyond the current Covid situation. On the longer term, we remain positive on the prospects of the market, thanks to anticipation of eventual global economic recovery.
Total return over the following periods ended 30 June 2021*
1 month
6 month YTD 1 year 3 year 5 year 10 year
Fund RM Class (%) -1.24 2.96 2.96 26.34 21.39 21.78 74.04 Benchmark in RM (%) -4.18 -6.62 -6.62 1.31 1.71 2.33 18.27
Calendar year returns* 2016 2017 2018 2019 2020
Fund RM Class (%) -2.21 11.79 -15.87 5.39 19.01 Benchmark in RM (%) -5.22 9.95 -11.90 3.80 9.52
* Source: Lipper; Past performance is not necessarily indicative of future performance. The performance is calculated on NAV-to-NAV basis.
-20%
-10%
0%10%
20%
30%
40%50%
60%
70%80%
06/2011 04/2012 01/2013 10/2013 07/2014 05/2015 02/2016 11/2016 08/2017 06/2018 03/2019 12/2019 09/2020 06/2021
Top 5 holdings No. Security name % NAV
1 MISC Bhd 4.5 2 Inari Amertron Berhad 4.2 3 Vitrox Corp. Bhd. 4.1 4 Dufu Technology Corp. Bhd. 3.7 5 Telekom Malaysia Bhd. 3.7
Highest & lowest NAV 2018 2019 2020
High 0.3571 0.2886 0.3034 Low 0.2689 0.2629 0.2000
Distribution by financial year 2019 2020 2021**
Distribution (Sen) 1.80 1.66 0.87 Distribution Yield (%) 6.6 6.5 2.9
** Interim distribution (semi-annual)
Asset/sector allocation No. Asset/sector name % NAV
1 Technology 14.9 2 Foreign 13.6 3 Ind prod & serv 13.1 4 Consumer prod & serv 9.3 5 Telecomm & media 8.2 6 Transp & logistics 5.0 7 Healthcare 4.5 8 Energy 4.4 9 Others 14.8 10 Cash & Cash Equivalents 12.2
Geographical allocation No. Geographical name % NAV
1 Malaysia 74.2 2 South Korea 5.8 3 China 2.5 4 Others 5.3 5 Cash & Cash Equivalents 12.2
RM Class 3-year
Fund Volatility 15.4
High Lipper Analytics
16 Jun 21
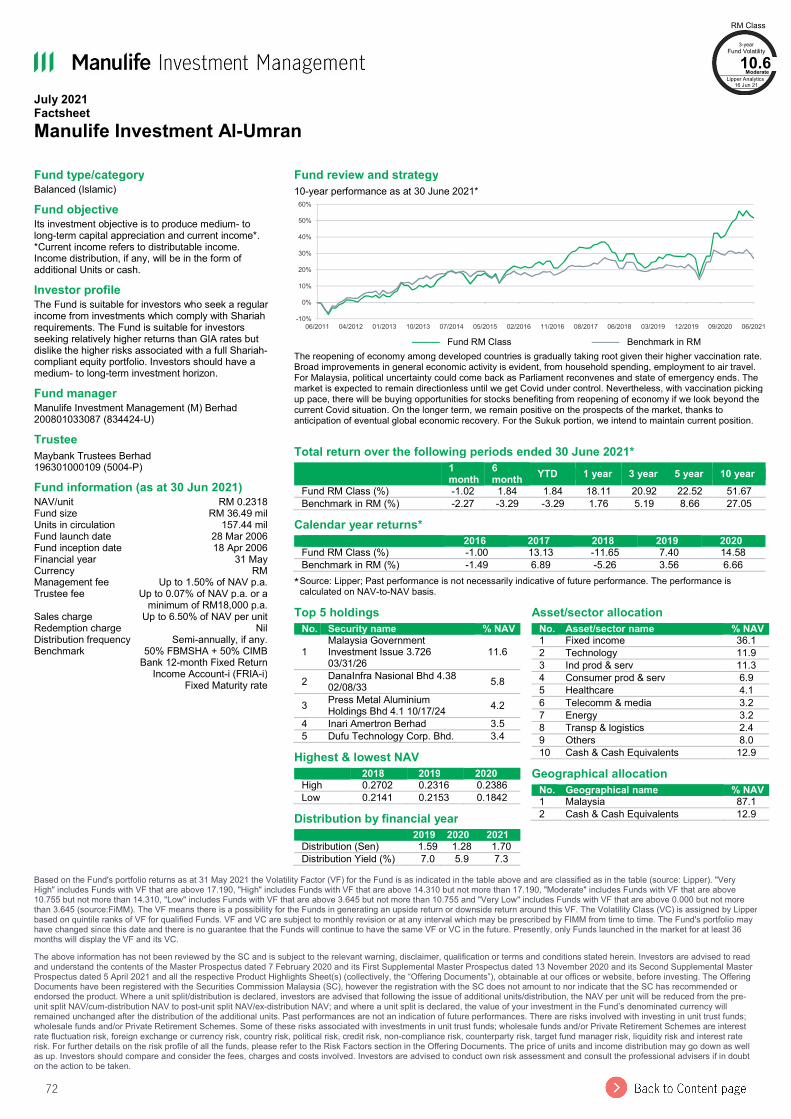
72
July 2021 Factsheet Manulife Investment Al-Umran
Based on the Fund's portfolio returns as at 31 May 2021 the Volatility Factor (VF) for the Fund is as indicated in the table above and are classified as in the table (source: Lipper). "Very High" includes Funds with VF that are above 17.190, "High" includes Funds with VF that are above 14.310 but not more than 17.190, "Moderate" includes Funds with VF that are above 10.755 but not more than 14.310, "Low" includes Funds with VF that are above 3.645 but not more than 10.755 and "Very Low" includes Funds with VF that are above 0.000 but not more than 3.645 (source:FiMM). The VF means there is a possibility for the Funds in generating an upside return or downside return around this VF. The Volatility Class (VC) is assigned by Lipper based on quintile ranks of VF for qualified Funds. VF and VC are subject to monthly revision or at any interval which may be prescribed by FIMM from time to time. The Fund's portfolio may have changed since this date and there is no guarantee that the Funds will continue to have the same VF or VC in the future. Presently, only Funds launched in the market for at least 36 months will display the VF and its VC. The above information has not been reviewed by the SC and is subject to the relevant warning, disclaimer, qualification or terms and conditions stated herein. Investors are advised to read and understand the contents of the Master Prospectus dated 7 February 2020 and its First Supplemental Master Prospectus dated 13 November 2020 and its Second Supplemental Master Prospectus dated 5 April 2021 and all the respective Product Highlights Sheet(s) (collectively, the “Offering Documents”), obtainable at our offices or website, before investing. The Offering Documents have been registered with the Securities Commission Malaysia (SC), however the registration with the SC does not amount to nor indicate that the SC has recommended or endorsed the product. Where a unit split/distribution is declared, investors are advised that following the issue of additional units/distribution, the NAV per unit will be reduced from the pre-unit split NAV/cum-distribution NAV to post-unit split NAV/ex-distribution NAV; and where a unit split is declared, the value of your investment in the Fund’s denominated currency will remained unchanged after the distribution of the additional units. Past performances are not an indication of future performances. There are risks involved with investing in unit trust funds; wholesale funds and/or Private Retirement Schemes. Some of these risks associated with investments in unit trust funds; wholesale funds and/or Private Retirement Schemes are interest rate fluctuation risk, foreign exchange or currency risk, country risk, political risk, credit risk, non-compliance risk, counterparty risk, target fund manager risk, liquidity risk and interest rate risk. For further details on the risk profile of all the funds, please refer to the Risk Factors section in the Offering Documents. The price of units and income distribution may go down as well as up. Investors should compare and consider the fees, charges and costs involved. Investors are advised to conduct own risk assessment and consult the professional advisers if in doubt on the action to be taken.
Fund type/category Balanced (Islamic) Fund objective Its investment objective is to produce medium- to long-term capital appreciation and current income*. *Current income refers to distributable income. Income distribution, if any, will be in the form of additional Units or cash. Investor profile The Fund is suitable for investors who seek a regular income from investments which comply with Shariah requirements. The Fund is suitable for investors seeking relatively higher returns than GIA rates but dislike the higher risks associated with a full Shariah-compliant equity portfolio. Investors should have a medium- to long-term investment horizon. Fund manager Manulife Investment Management (M) Berhad 200801033087 (834424-U) Trustee Maybank Trustees Berhad 196301000109 (5004-P) Fund information (as at 30 Jun 2021) NAV/unit RM 0.2318 Fund size RM 36.49 mil Units in circulation 157.44 mil Fund launch date 28 Mar 2006 Fund inception date 18 Apr 2006 Financial year 31 May Currency RM Management fee Up to 1.50% of NAV p.a. Trustee fee Up to 0.07% of NAV p.a. or a
minimum of RM18,000 p.a. Sales charge Up to 6.50% of NAV per unit Redemption charge Nil Distribution frequency Semi-annually, if any. Benchmark 50% FBMSHA + 50% CIMB
Bank 12-month Fixed Return Income Account-i (FRIA-i)
Fixed Maturity rate
Fund review and strategy 10-year performance as at 30 June 2021*
——— Fund RM Class ——— Benchmark in RM
The reopening of economy among developed countries is gradually taking root given their higher vaccination rate. Broad improvements in general economic activity is evident, from household spending, employment to air travel. For Malaysia, political uncertainty could come back as Parliament reconvenes and state of emergency ends. The market is expected to remain directionless until we get Covid under control. Nevertheless, with vaccination picking up pace, there will be buying opportunities for stocks benefiting from reopening of economy if we look beyond the current Covid situation. On the longer term, we remain positive on the prospects of the market, thanks to anticipation of eventual global economic recovery. For the Sukuk portion, we intend to maintain current position.
Total return over the following periods ended 30 June 2021*
1 month
6 month YTD 1 year 3 year 5 year 10 year
Fund RM Class (%) -1.02 1.84 1.84 18.11 20.92 22.52 51.67 Benchmark in RM (%) -2.27 -3.29 -3.29 1.76 5.19 8.66 27.05
Calendar year returns* 2016 2017 2018 2019 2020
Fund RM Class (%) -1.00 13.13 -11.65 7.40 14.58 Benchmark in RM (%) -1.49 6.89 -5.26 3.56 6.66
* Source: Lipper; Past performance is not necessarily indicative of future performance. The performance is calculated on NAV-to-NAV basis.
-10%
0%
10%
20%
30%
40%
50%
60%
06/2011 04/2012 01/2013 10/2013 07/2014 05/2015 02/2016 11/2016 08/2017 06/2018 03/2019 12/2019 09/2020 06/2021
Top 5 holdings No. Security name % NAV
1 Malaysia Government Investment Issue 3.726 03/31/26
11.6
2 DanaInfra Nasional Bhd 4.38 02/08/33 5.8
3 Press Metal Aluminium Holdings Bhd 4.1 10/17/24 4.2
4 Inari Amertron Berhad 3.5 5 Dufu Technology Corp. Bhd. 3.4
Highest & lowest NAV 2018 2019 2020
High 0.2702 0.2316 0.2386 Low 0.2141 0.2153 0.1842
Distribution by financial year 2019 2020 2021
Distribution (Sen) 1.59 1.28 1.70 Distribution Yield (%) 7.0 5.9 7.3
Asset/sector allocation No. Asset/sector name % NAV
1 Fixed income 36.1 2 Technology 11.9 3 Ind prod & serv 11.3 4 Consumer prod & serv 6.9 5 Healthcare 4.1 6 Telecomm & media 3.2 7 Energy 3.2 8 Transp & logistics 2.4 9 Others 8.0 10 Cash & Cash Equivalents 12.9
Geographical allocation No. Geographical name % NAV
1 Malaysia 87.1 2 Cash & Cash Equivalents 12.9
RM Class 3-year
Fund Volatility 10.6
Moderate Lipper Analytics
16 Jun 21
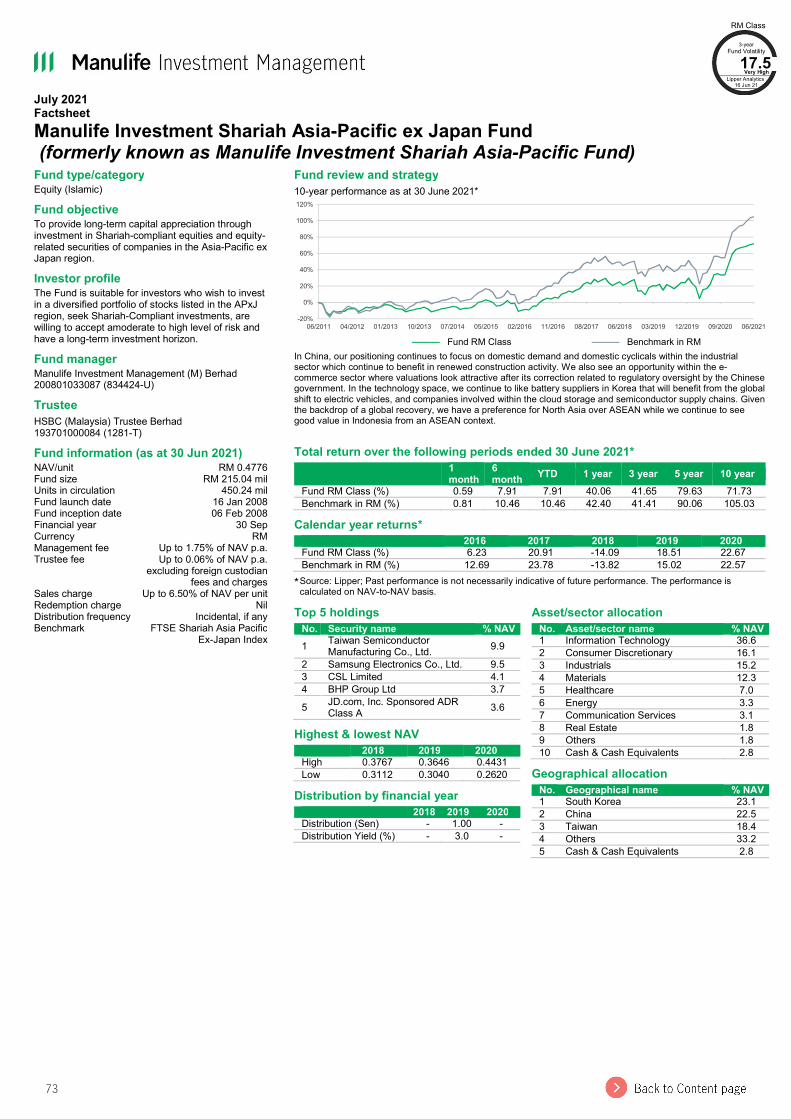
73
July 2021 Factsheet Manulife Investment Shariah Asia-Pacific ex Japan Fund (formerly known as Manulife Investment Shariah Asia-Pacific Fund)
Fund type/category Equity (Islamic) Fund objective To provide long-term capital appreciation through investment in Shariah-compliant equities and equity-related securities of companies in the Asia-Pacific ex Japan region. Investor profile The Fund is suitable for investors who wish to invest in a diversified portfolio of stocks listed in the APxJ region, seek Shariah-Compliant investments, are willing to accept amoderate to high level of risk and have a long-term investment horizon. Fund manager Manulife Investment Management (M) Berhad 200801033087 (834424-U) Trustee HSBC (Malaysia) Trustee Berhad 193701000084 (1281-T) Fund information (as at 30 Jun 2021) NAV/unit RM 0.4776 Fund size RM 215.04 mil Units in circulation 450.24 mil Fund launch date 16 Jan 2008 Fund inception date 06 Feb 2008 Financial year 30 Sep Currency RM Management fee Up to 1.75% of NAV p.a. Trustee fee Up to 0.06% of NAV p.a.
excluding foreign custodian fees and charges
Sales charge Up to 6.50% of NAV per unit Redemption charge Nil Distribution frequency Incidental, if any Benchmark FTSE Shariah Asia Pacific
Ex-Japan Index
Fund review and strategy 10-year performance as at 30 June 2021*
——— Fund RM Class ——— Benchmark in RM
In China, our positioning continues to focus on domestic demand and domestic cyclicals within the industrial sector which continue to benefit in renewed construction activity. We also see an opportunity within the e-commerce sector where valuations look attractive after its correction related to regulatory oversight by the Chinese government. In the technology space, we continue to like battery suppliers in Korea that will benefit from the global shift to electric vehicles, and companies involved within the cloud storage and semiconductor supply chains. Given the backdrop of a global recovery, we have a preference for North Asia over ASEAN while we continue to see good value in Indonesia from an ASEAN context.
Total return over the following periods ended 30 June 2021*
1 month
6 month YTD 1 year 3 year 5 year 10 year
Fund RM Class (%) 0.59 7.91 7.91 40.06 41.65 79.63 71.73 Benchmark in RM (%) 0.81 10.46 10.46 42.40 41.41 90.06 105.03
Calendar year returns* 2016 2017 2018 2019 2020
Fund RM Class (%) 6.23 20.91 -14.09 18.51 22.67 Benchmark in RM (%) 12.69 23.78 -13.82 15.02 22.57
* Source: Lipper; Past performance is not necessarily indicative of future performance. The performance is calculated on NAV-to-NAV basis.
-20%
0%
20%
40%
60%
80%
100%
120%
06/2011 04/2012 01/2013 10/2013 07/2014 05/2015 02/2016 11/2016 08/2017 06/2018 03/2019 12/2019 09/2020 06/2021
Top 5 holdings No. Security name % NAV
1 Taiwan Semiconductor Manufacturing Co., Ltd. 9.9
2 Samsung Electronics Co., Ltd. 9.5 3 CSL Limited 4.1 4 BHP Group Ltd 3.7 5 JD.com, Inc. Sponsored ADR
Class A 3.6 Highest & lowest NAV 2018 2019 2020
High 0.3767 0.3646 0.4431 Low 0.3112 0.3040 0.2620
Distribution by financial year 2018 2019 2020
Distribution (Sen) - 1.00 - Distribution Yield (%) - 3.0 -
Asset/sector allocation No. Asset/sector name % NAV
1 Information Technology 36.6 2 Consumer Discretionary 16.1 3 Industrials 15.2 4 Materials 12.3 5 Healthcare 7.0 6 Energy 3.3 7 Communication Services 3.1 8 Real Estate 1.8 9 Others 1.8 10 Cash & Cash Equivalents 2.8
Geographical allocation No. Geographical name % NAV
1 South Korea 23.1 2 China 22.5 3 Taiwan 18.4 4 Others 33.2 5 Cash & Cash Equivalents 2.8
RM Class 3-year
Fund Volatility 17.5
Very High Lipper Analytics
16 Jun 21
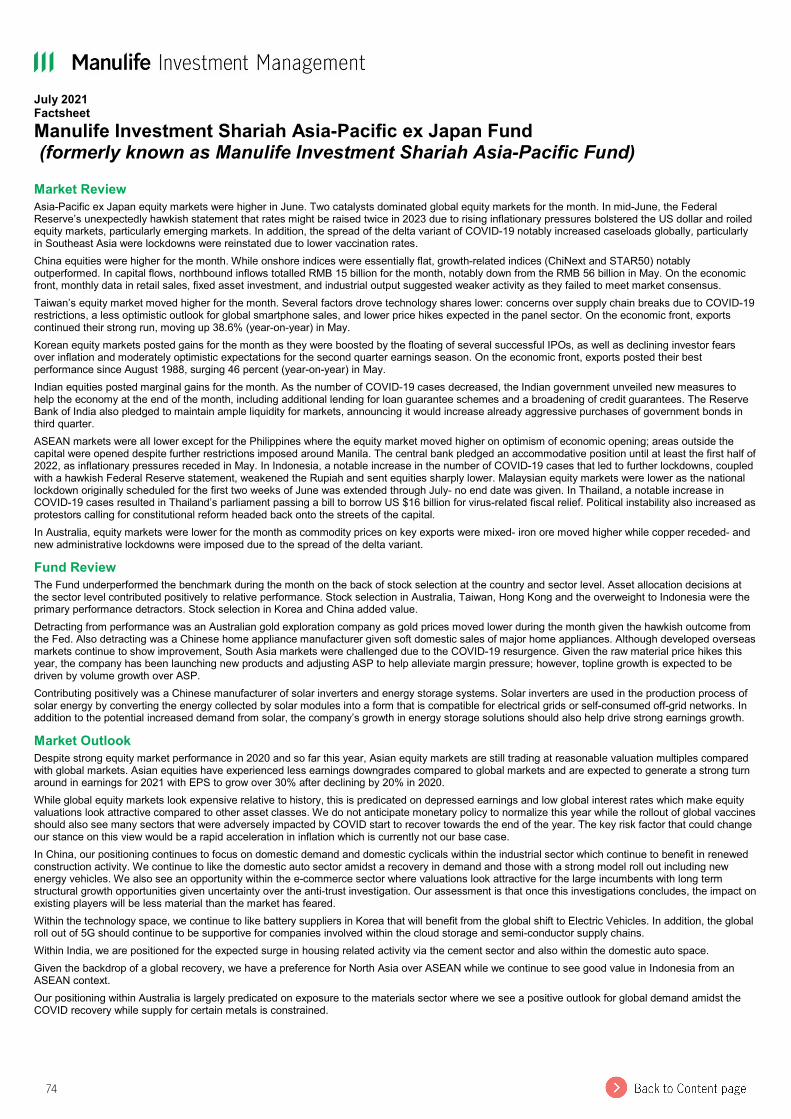
74
July 2021 Factsheet Manulife Investment Shariah Asia-Pacific ex Japan Fund (formerly known as Manulife Investment Shariah Asia-Pacific Fund) Market Review Asia-Pacific ex Japan equity markets were higher in June. Two catalysts dominated global equity markets for the month. In mid-June, the Federal Reserve’s unexpectedly hawkish statement that rates might be raised twice in 2023 due to rising inflationary pressures bolstered the US dollar and roiled equity markets, particularly emerging markets. In addition, the spread of the delta variant of COVID-19 notably increased caseloads globally, particularly in Southeast Asia were lockdowns were reinstated due to lower vaccination rates. China equities were higher for the month. While onshore indices were essentially flat, growth-related indices (ChiNext and STAR50) notably outperformed. In capital flows, northbound inflows totalled RMB 15 billion for the month, notably down from the RMB 56 billion in May. On the economic front, monthly data in retail sales, fixed asset investment, and industrial output suggested weaker activity as they failed to meet market consensus. Taiwan’s equity market moved higher for the month. Several factors drove technology shares lower: concerns over supply chain breaks due to COVID-19 restrictions, a less optimistic outlook for global smartphone sales, and lower price hikes expected in the panel sector. On the economic front, exports continued their strong run, moving up 38.6% (year-on-year) in May. Korean equity markets posted gains for the month as they were boosted by the floating of several successful IPOs, as well as declining investor fears over inflation and moderately optimistic expectations for the second quarter earnings season. On the economic front, exports posted their best performance since August 1988, surging 46 percent (year-on-year) in May. Indian equities posted marginal gains for the month. As the number of COVID-19 cases decreased, the Indian government unveiled new measures to help the economy at the end of the month, including additional lending for loan guarantee schemes and a broadening of credit guarantees. The Reserve Bank of India also pledged to maintain ample liquidity for markets, announcing it would increase already aggressive purchases of government bonds in third quarter. ASEAN markets were all lower except for the Philippines where the equity market moved higher on optimism of economic opening; areas outside the capital were opened despite further restrictions imposed around Manila. The central bank pledged an accommodative position until at least the first half of 2022, as inflationary pressures receded in May. In Indonesia, a notable increase in the number of COVID-19 cases that led to further lockdowns, coupled with a hawkish Federal Reserve statement, weakened the Rupiah and sent equities sharply lower. Malaysian equity markets were lower as the national lockdown originally scheduled for the first two weeks of June was extended through July- no end date was given. In Thailand, a notable increase in COVID-19 cases resulted in Thailand’s parliament passing a bill to borrow US $16 billion for virus-related fiscal relief. Political instability also increased as protestors calling for constitutional reform headed back onto the streets of the capital. In Australia, equity markets were lower for the month as commodity prices on key exports were mixed- iron ore moved higher while copper receded- and new administrative lockdowns were imposed due to the spread of the delta variant. Fund Review The Fund underperformed the benchmark during the month on the back of stock selection at the country and sector level. Asset allocation decisions at the sector level contributed positively to relative performance. Stock selection in Australia, Taiwan, Hong Kong and the overweight to Indonesia were the primary performance detractors. Stock selection in Korea and China added value. Detracting from performance was an Australian gold exploration company as gold prices moved lower during the month given the hawkish outcome from the Fed. Also detracting was a Chinese home appliance manufacturer given soft domestic sales of major home appliances. Although developed overseas markets continue to show improvement, South Asia markets were challenged due to the COVID-19 resurgence. Given the raw material price hikes this year, the company has been launching new products and adjusting ASP to help alleviate margin pressure; however, topline growth is expected to be driven by volume growth over ASP. Contributing positively was a Chinese manufacturer of solar inverters and energy storage systems. Solar inverters are used in the production process of solar energy by converting the energy collected by solar modules into a form that is compatible for electrical grids or self-consumed off-grid networks. In addition to the potential increased demand from solar, the company’s growth in energy storage solutions should also help drive strong earnings growth. Market Outlook Despite strong equity market performance in 2020 and so far this year, Asian equity markets are still trading at reasonable valuation multiples compared with global markets. Asian equities have experienced less earnings downgrades compared to global markets and are expected to generate a strong turn around in earnings for 2021 with EPS to grow over 30% after declining by 20% in 2020. While global equity markets look expensive relative to history, this is predicated on depressed earnings and low global interest rates which make equity valuations look attractive compared to other asset classes. We do not anticipate monetary policy to normalize this year while the rollout of global vaccines should also see many sectors that were adversely impacted by COVID start to recover towards the end of the year. The key risk factor that could change our stance on this view would be a rapid acceleration in inflation which is currently not our base case. In China, our positioning continues to focus on domestic demand and domestic cyclicals within the industrial sector which continue to benefit in renewed construction activity. We continue to like the domestic auto sector amidst a recovery in demand and those with a strong model roll out including new energy vehicles. We also see an opportunity within the e-commerce sector where valuations look attractive for the large incumbents with long term structural growth opportunities given uncertainty over the anti-trust investigation. Our assessment is that once this investigations concludes, the impact on existing players will be less material than the market has feared. Within the technology space, we continue to like battery suppliers in Korea that will benefit from the global shift to Electric Vehicles. In addition, the global roll out of 5G should continue to be supportive for companies involved within the cloud storage and semi-conductor supply chains. Within India, we are positioned for the expected surge in housing related activity via the cement sector and also within the domestic auto space. Given the backdrop of a global recovery, we have a preference for North Asia over ASEAN while we continue to see good value in Indonesia from an ASEAN context. Our positioning within Australia is largely predicated on exposure to the materials sector where we see a positive outlook for global demand amidst the COVID recovery while supply for certain metals is constrained.
75
July 2021 Factsheet Manulife Investment Shariah Asia-Pacific ex Japan Fund (formerly known as Manulife Investment Shariah Asia-Pacific Fund) Based on the Fund's portfolio returns as at 31 May 2021 the Volatility Factor (VF) for the Fund is as indicated in the table above and are classified as in the table (source: Lipper). "Very High" includes Funds with VF that are above 17.190, "High" includes Funds with VF that are above 14.310 but not more than 17.190, "Moderate" includes Funds with VF that are above 10.755 but not more than 14.310, "Low" includes Funds with VF that are above 3.645 but not more than 10.755 and "Very Low" includes Funds with VF that are above 0.000 but not more than 3.645 (source:FiMM). The VF means there is a possibility for the Funds in generating an upside return or downside return around this VF. The Volatility Class (VC) is assigned by Lipper based on quintile ranks of VF for qualified Funds. VF and VC are subject to monthly revision or at any interval which may be prescribed by FIMM from time to time. The Fund's portfolio may have changed since this date and there is no guarantee that the Funds will continue to have the same VF or VC in the future. Presently, only Funds launched in the market for at least 36 months will display the VF and its VC. The above information has not been reviewed by the SC and is subject to the relevant warning, disclaimer, qualification or terms and conditions stated herein. Investors are advised to read and understand the contents of the Master Prospectus dated 10 August 2020 and its First Supplemental Master Prospectus dated 10 August 2020 and its Second Supplemental Master Prospectus dated 27 January 2021 and its Third Supplemental Master Prospectus dated 5 April 2021 and all the respective Product Highlights Sheet(s) (collectively, the “Offering Documents”), obtainable at our offices or website, before investing. The Offering Documents have been registered with the Securities Commission Malaysia (SC), however the registration with the SC does not amount to nor indicate that the SC has recommended or endorsed the product. Where a unit split/distribution is declared, investors are advised that following the issue of additional units/distribution, the NAV per unit will be reduced from the pre-unit split NAV/cum-distribution NAV to post-unit split NAV/ex-distribution NAV; and where a unit split is declared, the value of your investment in the Fund’s denominated currency will remained unchanged after the distribution of the additional units. Past performances are not an indication of future performances. There are risks involved with investing in unit trust funds; wholesale funds and/or Private Retirement Schemes. Some of these risks associated with investments in unit trust funds; wholesale funds and/or Private Retirement Schemes are interest rate fluctuation risk, foreign exchange or currency risk, country risk, political risk, credit risk, non-compliance risk, counterparty risk, target fund manager risk, liquidity risk and interest rate risk. For further details on the risk profile of all the funds, please refer to the Risk Factors section in the Offering Documents. The price of units and income distribution may go down as well as up. Investors should compare and consider the fees, charges and costs involved. Investors are advised to conduct own risk assessment and consult the professional advisers if in doubt on the action to be taken.
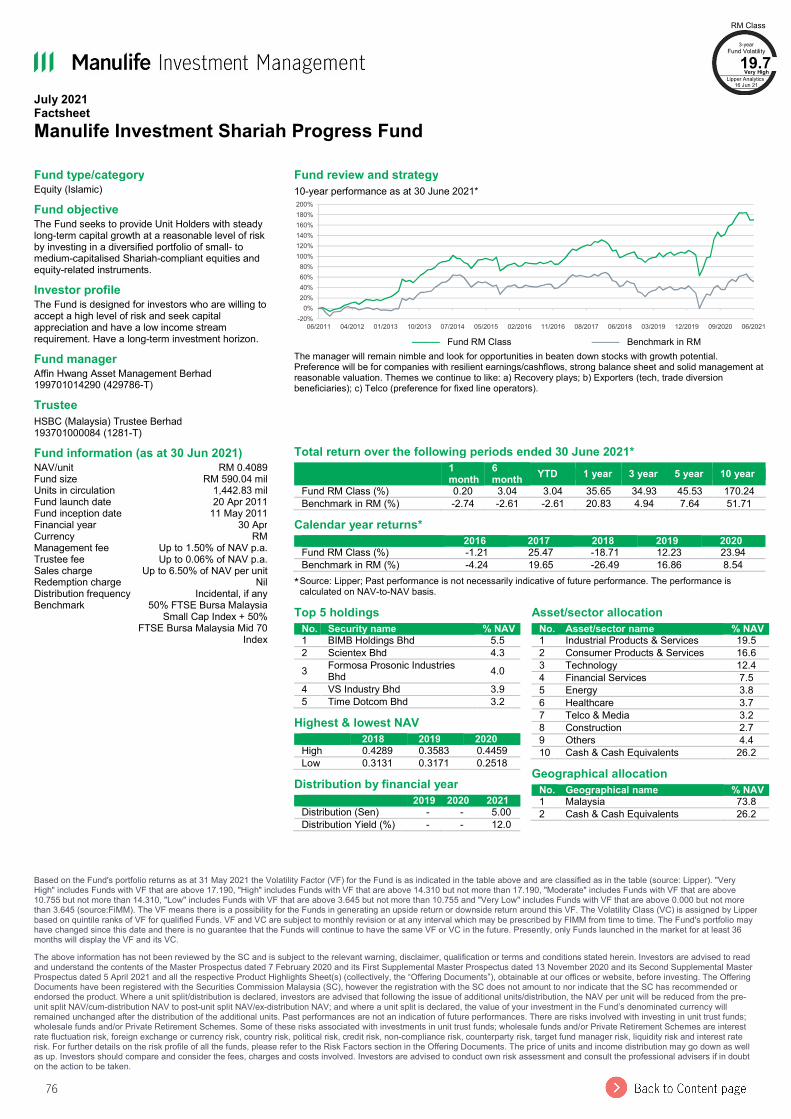
76
July 2021 Factsheet Manulife Investment Shariah Progress Fund
Based on the Fund's portfolio returns as at 31 May 2021 the Volatility Factor (VF) for the Fund is as indicated in the table above and are classified as in the table (source: Lipper). "Very High" includes Funds with VF that are above 17.190, "High" includes Funds with VF that are above 14.310 but not more than 17.190, "Moderate" includes Funds with VF that are above 10.755 but not more than 14.310, "Low" includes Funds with VF that are above 3.645 but not more than 10.755 and "Very Low" includes Funds with VF that are above 0.000 but not more than 3.645 (source:FiMM). The VF means there is a possibility for the Funds in generating an upside return or downside return around this VF. The Volatility Class (VC) is assigned by Lipper based on quintile ranks of VF for qualified Funds. VF and VC are subject to monthly revision or at any interval which may be prescribed by FIMM from time to time. The Fund's portfolio may have changed since this date and there is no guarantee that the Funds will continue to have the same VF or VC in the future. Presently, only Funds launched in the market for at least 36 months will display the VF and its VC. The above information has not been reviewed by the SC and is subject to the relevant warning, disclaimer, qualification or terms and conditions stated herein. Investors are advised to read and understand the contents of the Master Prospectus dated 7 February 2020 and its First Supplemental Master Prospectus dated 13 November 2020 and its Second Supplemental Master Prospectus dated 5 April 2021 and all the respective Product Highlights Sheet(s) (collectively, the “Offering Documents”), obtainable at our offices or website, before investing. The Offering Documents have been registered with the Securities Commission Malaysia (SC), however the registration with the SC does not amount to nor indicate that the SC has recommended or endorsed the product. Where a unit split/distribution is declared, investors are advised that following the issue of additional units/distribution, the NAV per unit will be reduced from the pre-unit split NAV/cum-distribution NAV to post-unit split NAV/ex-distribution NAV; and where a unit split is declared, the value of your investment in the Fund’s denominated currency will remained unchanged after the distribution of the additional units. Past performances are not an indication of future performances. There are risks involved with investing in unit trust funds; wholesale funds and/or Private Retirement Schemes. Some of these risks associated with investments in unit trust funds; wholesale funds and/or Private Retirement Schemes are interest rate fluctuation risk, foreign exchange or currency risk, country risk, political risk, credit risk, non-compliance risk, counterparty risk, target fund manager risk, liquidity risk and interest rate risk. For further details on the risk profile of all the funds, please refer to the Risk Factors section in the Offering Documents. The price of units and income distribution may go down as well as up. Investors should compare and consider the fees, charges and costs involved. Investors are advised to conduct own risk assessment and consult the professional advisers if in doubt on the action to be taken.
Fund type/category Equity (Islamic) Fund objective The Fund seeks to provide Unit Holders with steady long-term capital growth at a reasonable level of risk by investing in a diversified portfolio of small- to medium-capitalised Shariah-compliant equities and equity-related instruments. Investor profile The Fund is designed for investors who are willing to accept a high level of risk and seek capital appreciation and have a low income stream requirement. Have a long-term investment horizon. Fund manager Affin Hwang Asset Management Berhad 199701014290 (429786-T) Trustee HSBC (Malaysia) Trustee Berhad 193701000084 (1281-T) Fund information (as at 30 Jun 2021) NAV/unit RM 0.4089 Fund size RM 590.04 mil Units in circulation 1,442.83 mil Fund launch date 20 Apr 2011 Fund inception date 11 May 2011 Financial year 30 Apr Currency RM Management fee Up to 1.50% of NAV p.a. Trustee fee Up to 0.06% of NAV p.a. Sales charge Up to 6.50% of NAV per unit Redemption charge Nil Distribution frequency Incidental, if any Benchmark 50% FTSE Bursa Malaysia
Small Cap Index + 50% FTSE Bursa Malaysia Mid 70
Index
Fund review and strategy 10-year performance as at 30 June 2021*
——— Fund RM Class ——— Benchmark in RM
The manager will remain nimble and look for opportunities in beaten down stocks with growth potential. Preference will be for companies with resilient earnings/cashflows, strong balance sheet and solid management at reasonable valuation. Themes we continue to like: a) Recovery plays; b) Exporters (tech, trade diversion beneficiaries); c) Telco (preference for fixed line operators).
Total return over the following periods ended 30 June 2021*
1 month
6 month YTD 1 year 3 year 5 year 10 year
Fund RM Class (%) 0.20 3.04 3.04 35.65 34.93 45.53 170.24 Benchmark in RM (%) -2.74 -2.61 -2.61 20.83 4.94 7.64 51.71
Calendar year returns* 2016 2017 2018 2019 2020
Fund RM Class (%) -1.21 25.47 -18.71 12.23 23.94 Benchmark in RM (%) -4.24 19.65 -26.49 16.86 8.54
* Source: Lipper; Past performance is not necessarily indicative of future performance. The performance is calculated on NAV-to-NAV basis.
-20%0%
20%40%60%80%
100%120%140%160%180%200%
06/2011 04/2012 01/2013 10/2013 07/2014 05/2015 02/2016 11/2016 08/2017 06/2018 03/2019 12/2019 09/2020 06/2021
Top 5 holdings No. Security name % NAV
1 BIMB Holdings Bhd 5.5 2 Scientex Bhd 4.3 3 Formosa Prosonic Industries
Bhd 4.0 4 VS Industry Bhd 3.9 5 Time Dotcom Bhd 3.2
Highest & lowest NAV 2018 2019 2020
High 0.4289 0.3583 0.4459 Low 0.3131 0.3171 0.2518
Distribution by financial year 2019 2020 2021
Distribution (Sen) - - 5.00 Distribution Yield (%) - - 12.0
Asset/sector allocation No. Asset/sector name % NAV
1 Industrial Products & Services 19.5 2 Consumer Products & Services 16.6 3 Technology 12.4 4 Financial Services 7.5 5 Energy 3.8 6 Healthcare 3.7 7 Telco & Media 3.2 8 Construction 2.7 9 Others 4.4 10 Cash & Cash Equivalents 26.2
Geographical allocation No. Geographical name % NAV
1 Malaysia 73.8 2 Cash & Cash Equivalents 26.2
RM Class 3-year
Fund Volatility 19.7
Very High Lipper Analytics
16 Jun 21
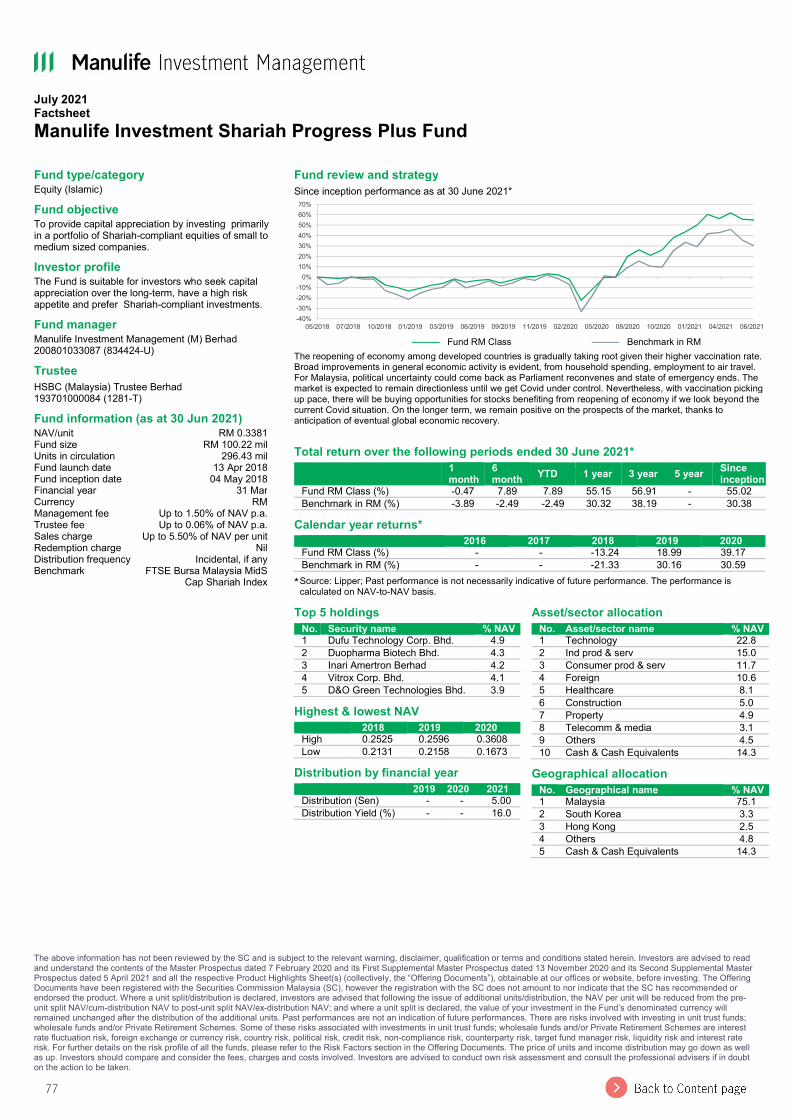
77
July 2021 Factsheet Manulife Investment Shariah Progress Plus Fund
The above information has not been reviewed by the SC and is subject to the relevant warning, disclaimer, qualification or terms and conditions stated herein. Investors are advised to read and understand the contents of the Master Prospectus dated 7 February 2020 and its First Supplemental Master Prospectus dated 13 November 2020 and its Second Supplemental Master Prospectus dated 5 April 2021 and all the respective Product Highlights Sheet(s) (collectively, the “Offering Documents”), obtainable at our offices or website, before investing. The Offering Documents have been registered with the Securities Commission Malaysia (SC), however the registration with the SC does not amount to nor indicate that the SC has recommended or endorsed the product. Where a unit split/distribution is declared, investors are advised that following the issue of additional units/distribution, the NAV per unit will be reduced from the pre-unit split NAV/cum-distribution NAV to post-unit split NAV/ex-distribution NAV; and where a unit split is declared, the value of your investment in the Fund’s denominated currency will remained unchanged after the distribution of the additional units. Past performances are not an indication of future performances. There are risks involved with investing in unit trust funds; wholesale funds and/or Private Retirement Schemes. Some of these risks associated with investments in unit trust funds; wholesale funds and/or Private Retirement Schemes are interest rate fluctuation risk, foreign exchange or currency risk, country risk, political risk, credit risk, non-compliance risk, counterparty risk, target fund manager risk, liquidity risk and interest rate risk. For further details on the risk profile of all the funds, please refer to the Risk Factors section in the Offering Documents. The price of units and income distribution may go down as well as up. Investors should compare and consider the fees, charges and costs involved. Investors are advised to conduct own risk assessment and consult the professional advisers if in doubt on the action to be taken.
Fund type/category Equity (Islamic) Fund objective To provide capital appreciation by investing primarily in a portfolio of Shariah-compliant equities of small to medium sized companies. Investor profile The Fund is suitable for investors who seek capital appreciation over the long-term, have a high risk appetite and prefer Shariah-compliant investments. Fund manager Manulife Investment Management (M) Berhad 200801033087 (834424-U) Trustee HSBC (Malaysia) Trustee Berhad 193701000084 (1281-T) Fund information (as at 30 Jun 2021) NAV/unit RM 0.3381 Fund size RM 100.22 mil Units in circulation 296.43 mil Fund launch date 13 Apr 2018 Fund inception date 04 May 2018 Financial year 31 Mar Currency RM Management fee Up to 1.50% of NAV p.a. Trustee fee Up to 0.06% of NAV p.a. Sales charge Up to 5.50% of NAV per unit Redemption charge Nil Distribution frequency Incidental, if any Benchmark FTSE Bursa Malaysia MidS
Cap Shariah Index
Fund review and strategy Since inception performance as at 30 June 2021*
——— Fund RM Class ——— Benchmark in RM
The reopening of economy among developed countries is gradually taking root given their higher vaccination rate. Broad improvements in general economic activity is evident, from household spending, employment to air travel. For Malaysia, political uncertainty could come back as Parliament reconvenes and state of emergency ends. The market is expected to remain directionless until we get Covid under control. Nevertheless, with vaccination picking up pace, there will be buying opportunities for stocks benefiting from reopening of economy if we look beyond the current Covid situation. On the longer term, we remain positive on the prospects of the market, thanks to anticipation of eventual global economic recovery.
Total return over the following periods ended 30 June 2021*
1 month
6 month YTD 1 year 3 year 5 year Since
inception Fund RM Class (%) -0.47 7.89 7.89 55.15 56.91 - 55.02 Benchmark in RM (%) -3.89 -2.49 -2.49 30.32 38.19 - 30.38
Calendar year returns* 2016 2017 2018 2019 2020
Fund RM Class (%) - - -13.24 18.99 39.17 Benchmark in RM (%) - - -21.33 30.16 30.59
* Source: Lipper; Past performance is not necessarily indicative of future performance. The performance is calculated on NAV-to-NAV basis.
-40%-30%-20%-10%
0%10%20%30%40%50%60%70%
05/2018 07/2018 10/2018 01/2019 03/2019 06/2019 09/2019 11/2019 02/2020 05/2020 08/2020 10/2020 01/2021 04/2021 06/2021
Top 5 holdings No. Security name % NAV
1 Dufu Technology Corp. Bhd. 4.9 2 Duopharma Biotech Bhd. 4.3 3 Inari Amertron Berhad 4.2 4 Vitrox Corp. Bhd. 4.1 5 D&O Green Technologies Bhd. 3.9
Highest & lowest NAV 2018 2019 2020
High 0.2525 0.2596 0.3608 Low 0.2131 0.2158 0.1673
Distribution by financial year 2019 2020 2021
Distribution (Sen) - - 5.00 Distribution Yield (%) - - 16.0
Asset/sector allocation No. Asset/sector name % NAV
1 Technology 22.8 2 Ind prod & serv 15.0 3 Consumer prod & serv 11.7 4 Foreign 10.6 5 Healthcare 8.1 6 Construction 5.0 7 Property 4.9 8 Telecomm & media 3.1 9 Others 4.5 10 Cash & Cash Equivalents 14.3
Geographical allocation No. Geographical name % NAV
1 Malaysia 75.1 2 South Korea 3.3 3 Hong Kong 2.5 4 Others 4.8 5 Cash & Cash Equivalents 14.3
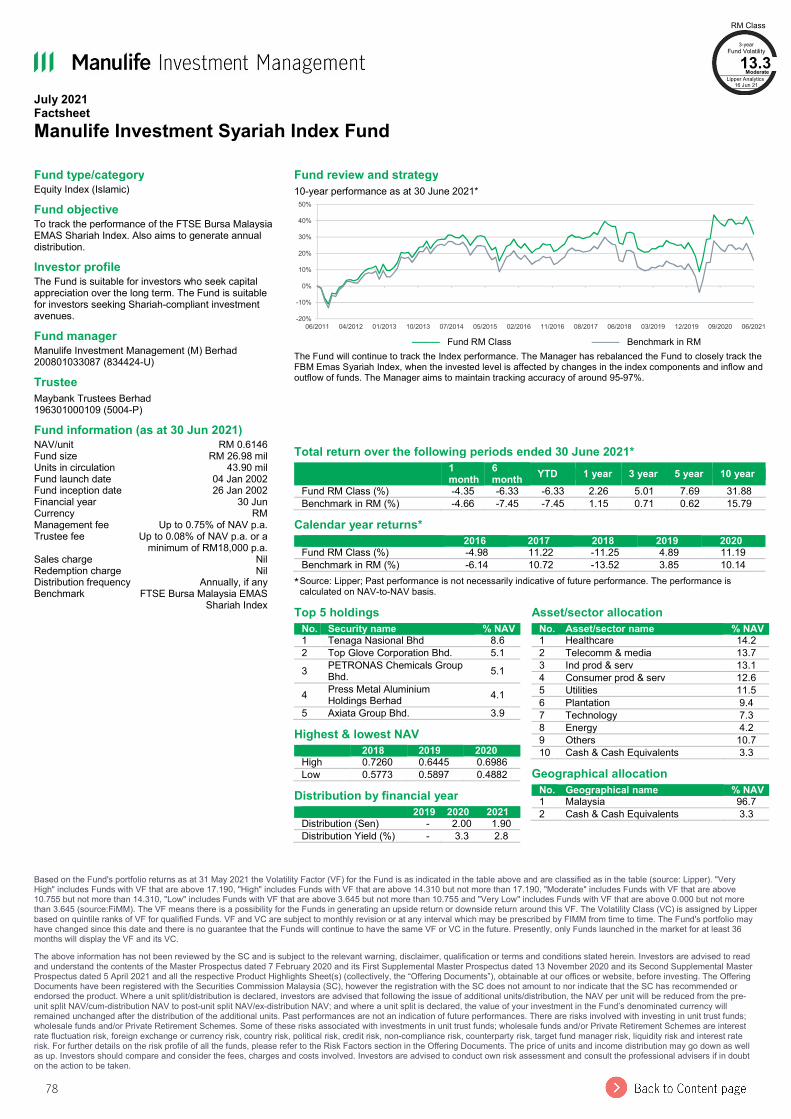
78
July 2021 Factsheet Manulife Investment Syariah Index Fund
Based on the Fund's portfolio returns as at 31 May 2021 the Volatility Factor (VF) for the Fund is as indicated in the table above and are classified as in the table (source: Lipper). "Very High" includes Funds with VF that are above 17.190, "High" includes Funds with VF that are above 14.310 but not more than 17.190, "Moderate" includes Funds with VF that are above 10.755 but not more than 14.310, "Low" includes Funds with VF that are above 3.645 but not more than 10.755 and "Very Low" includes Funds with VF that are above 0.000 but not more than 3.645 (source:FiMM). The VF means there is a possibility for the Funds in generating an upside return or downside return around this VF. The Volatility Class (VC) is assigned by Lipper based on quintile ranks of VF for qualified Funds. VF and VC are subject to monthly revision or at any interval which may be prescribed by FIMM from time to time. The Fund's portfolio may have changed since this date and there is no guarantee that the Funds will continue to have the same VF or VC in the future. Presently, only Funds launched in the market for at least 36 months will display the VF and its VC. The above information has not been reviewed by the SC and is subject to the relevant warning, disclaimer, qualification or terms and conditions stated herein. Investors are advised to read and understand the contents of the Master Prospectus dated 7 February 2020 and its First Supplemental Master Prospectus dated 13 November 2020 and its Second Supplemental Master Prospectus dated 5 April 2021 and all the respective Product Highlights Sheet(s) (collectively, the “Offering Documents”), obtainable at our offices or website, before investing. The Offering Documents have been registered with the Securities Commission Malaysia (SC), however the registration with the SC does not amount to nor indicate that the SC has recommended or endorsed the product. Where a unit split/distribution is declared, investors are advised that following the issue of additional units/distribution, the NAV per unit will be reduced from the pre-unit split NAV/cum-distribution NAV to post-unit split NAV/ex-distribution NAV; and where a unit split is declared, the value of your investment in the Fund’s denominated currency will remained unchanged after the distribution of the additional units. Past performances are not an indication of future performances. There are risks involved with investing in unit trust funds; wholesale funds and/or Private Retirement Schemes. Some of these risks associated with investments in unit trust funds; wholesale funds and/or Private Retirement Schemes are interest rate fluctuation risk, foreign exchange or currency risk, country risk, political risk, credit risk, non-compliance risk, counterparty risk, target fund manager risk, liquidity risk and interest rate risk. For further details on the risk profile of all the funds, please refer to the Risk Factors section in the Offering Documents. The price of units and income distribution may go down as well as up. Investors should compare and consider the fees, charges and costs involved. Investors are advised to conduct own risk assessment and consult the professional advisers if in doubt on the action to be taken.
Fund type/category Equity Index (Islamic) Fund objective To track the performance of the FTSE Bursa Malaysia EMAS Shariah Index. Also aims to generate annual distribution. Investor profile The Fund is suitable for investors who seek capital appreciation over the long term. The Fund is suitable for investors seeking Shariah-compliant investment avenues. Fund manager Manulife Investment Management (M) Berhad 200801033087 (834424-U) Trustee Maybank Trustees Berhad 196301000109 (5004-P) Fund information (as at 30 Jun 2021) NAV/unit RM 0.6146 Fund size RM 26.98 mil Units in circulation 43.90 mil Fund launch date 04 Jan 2002 Fund inception date 26 Jan 2002 Financial year 30 Jun Currency RM Management fee Up to 0.75% of NAV p.a. Trustee fee Up to 0.08% of NAV p.a. or a
minimum of RM18,000 p.a. Sales charge Nil Redemption charge Nil Distribution frequency Annually, if any Benchmark FTSE Bursa Malaysia EMAS
Shariah Index
Fund review and strategy 10-year performance as at 30 June 2021*
——— Fund RM Class ——— Benchmark in RM
The Fund will continue to track the Index performance. The Manager has rebalanced the Fund to closely track the FBM Emas Syariah Index, when the invested level is affected by changes in the index components and inflow and outflow of funds. The Manager aims to maintain tracking accuracy of around 95-97%.
Total return over the following periods ended 30 June 2021*
1 month
6 month YTD 1 year 3 year 5 year 10 year
Fund RM Class (%) -4.35 -6.33 -6.33 2.26 5.01 7.69 31.88 Benchmark in RM (%) -4.66 -7.45 -7.45 1.15 0.71 0.62 15.79
Calendar year returns* 2016 2017 2018 2019 2020
Fund RM Class (%) -4.98 11.22 -11.25 4.89 11.19 Benchmark in RM (%) -6.14 10.72 -13.52 3.85 10.14
* Source: Lipper; Past performance is not necessarily indicative of future performance. The performance is calculated on NAV-to-NAV basis.
-20%
-10%
0%
10%
20%
30%
40%
50%
06/2011 04/2012 01/2013 10/2013 07/2014 05/2015 02/2016 11/2016 08/2017 06/2018 03/2019 12/2019 09/2020 06/2021
Top 5 holdings No. Security name % NAV
1 Tenaga Nasional Bhd 8.6 2 Top Glove Corporation Bhd. 5.1 3 PETRONAS Chemicals Group
Bhd. 5.1
4 Press Metal Aluminium Holdings Berhad 4.1
5 Axiata Group Bhd. 3.9 Highest & lowest NAV 2018 2019 2020
High 0.7260 0.6445 0.6986 Low 0.5773 0.5897 0.4882
Distribution by financial year 2019 2020 2021
Distribution (Sen) - 2.00 1.90 Distribution Yield (%) - 3.3 2.8
Asset/sector allocation No. Asset/sector name % NAV
1 Healthcare 14.2 2 Telecomm & media 13.7 3 Ind prod & serv 13.1 4 Consumer prod & serv 12.6 5 Utilities 11.5 6 Plantation 9.4 7 Technology 7.3 8 Energy 4.2 9 Others 10.7 10 Cash & Cash Equivalents 3.3
Geographical allocation No. Geographical name % NAV
1 Malaysia 96.7 2 Cash & Cash Equivalents 3.3
RM Class 3-year
Fund Volatility 13.3
Moderate Lipper Analytics
16 Jun 21
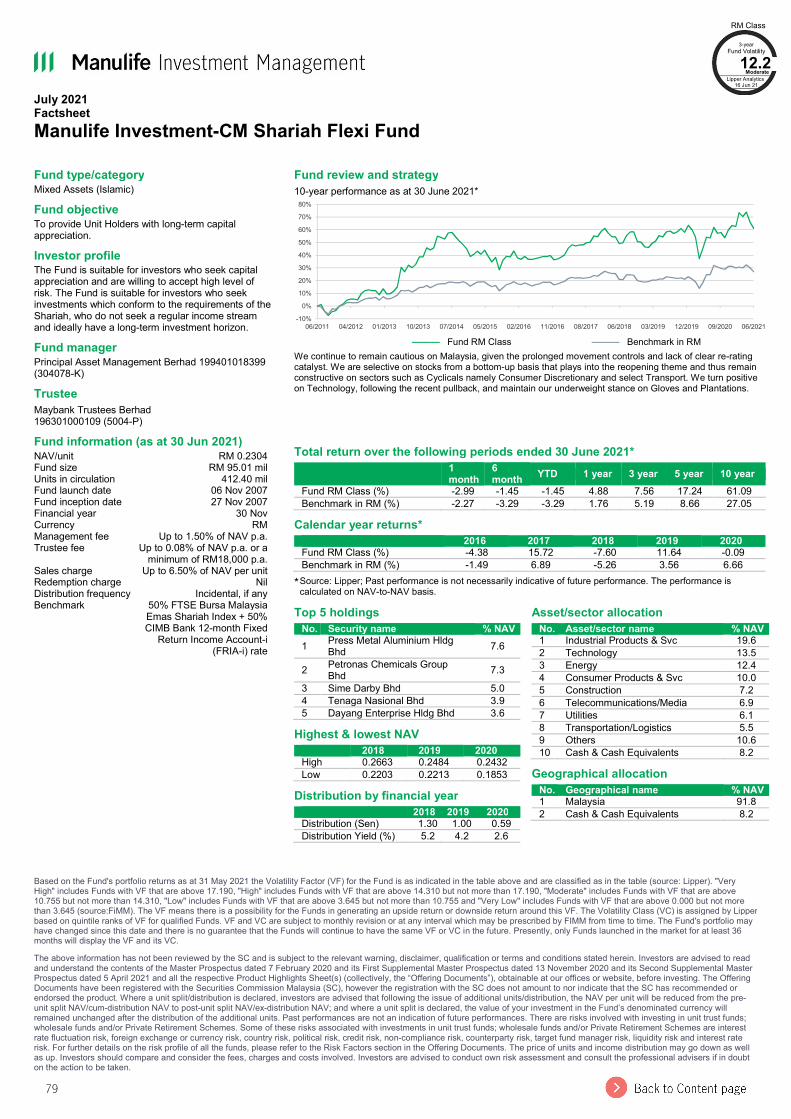
79
July 2021 Factsheet Manulife Investment-CM Shariah Flexi Fund
Based on the Fund's portfolio returns as at 31 May 2021 the Volatility Factor (VF) for the Fund is as indicated in the table above and are classified as in the table (source: Lipper). "Very High" includes Funds with VF that are above 17.190, "High" includes Funds with VF that are above 14.310 but not more than 17.190, "Moderate" includes Funds with VF that are above 10.755 but not more than 14.310, "Low" includes Funds with VF that are above 3.645 but not more than 10.755 and "Very Low" includes Funds with VF that are above 0.000 but not more than 3.645 (source:FiMM). The VF means there is a possibility for the Funds in generating an upside return or downside return around this VF. The Volatility Class (VC) is assigned by Lipper based on quintile ranks of VF for qualified Funds. VF and VC are subject to monthly revision or at any interval which may be prescribed by FIMM from time to time. The Fund's portfolio may have changed since this date and there is no guarantee that the Funds will continue to have the same VF or VC in the future. Presently, only Funds launched in the market for at least 36 months will display the VF and its VC. The above information has not been reviewed by the SC and is subject to the relevant warning, disclaimer, qualification or terms and conditions stated herein. Investors are advised to read and understand the contents of the Master Prospectus dated 7 February 2020 and its First Supplemental Master Prospectus dated 13 November 2020 and its Second Supplemental Master Prospectus dated 5 April 2021 and all the respective Product Highlights Sheet(s) (collectively, the “Offering Documents”), obtainable at our offices or website, before investing. The Offering Documents have been registered with the Securities Commission Malaysia (SC), however the registration with the SC does not amount to nor indicate that the SC has recommended or endorsed the product. Where a unit split/distribution is declared, investors are advised that following the issue of additional units/distribution, the NAV per unit will be reduced from the pre-unit split NAV/cum-distribution NAV to post-unit split NAV/ex-distribution NAV; and where a unit split is declared, the value of your investment in the Fund’s denominated currency will remained unchanged after the distribution of the additional units. Past performances are not an indication of future performances. There are risks involved with investing in unit trust funds; wholesale funds and/or Private Retirement Schemes. Some of these risks associated with investments in unit trust funds; wholesale funds and/or Private Retirement Schemes are interest rate fluctuation risk, foreign exchange or currency risk, country risk, political risk, credit risk, non-compliance risk, counterparty risk, target fund manager risk, liquidity risk and interest rate risk. For further details on the risk profile of all the funds, please refer to the Risk Factors section in the Offering Documents. The price of units and income distribution may go down as well as up. Investors should compare and consider the fees, charges and costs involved. Investors are advised to conduct own risk assessment and consult the professional advisers if in doubt on the action to be taken.
Fund type/category Mixed Assets (Islamic) Fund objective To provide Unit Holders with long-term capital appreciation. Investor profile The Fund is suitable for investors who seek capital appreciation and are willing to accept high level of risk. The Fund is suitable for investors who seek investments which conform to the requirements of the Shariah, who do not seek a regular income stream and ideally have a long-term investment horizon. Fund manager Principal Asset Management Berhad 199401018399 (304078-K) Trustee Maybank Trustees Berhad 196301000109 (5004-P) Fund information (as at 30 Jun 2021) NAV/unit RM 0.2304 Fund size RM 95.01 mil Units in circulation 412.40 mil Fund launch date 06 Nov 2007 Fund inception date 27 Nov 2007 Financial year 30 Nov Currency RM Management fee Up to 1.50% of NAV p.a. Trustee fee Up to 0.08% of NAV p.a. or a
minimum of RM18,000 p.a. Sales charge Up to 6.50% of NAV per unit Redemption charge Nil Distribution frequency Incidental, if any Benchmark 50% FTSE Bursa Malaysia
Emas Shariah Index + 50% CIMB Bank 12-month Fixed
Return Income Account-i (FRIA-i) rate
Fund review and strategy 10-year performance as at 30 June 2021*
——— Fund RM Class ——— Benchmark in RM
We continue to remain cautious on Malaysia, given the prolonged movement controls and lack of clear re-rating catalyst. We are selective on stocks from a bottom-up basis that plays into the reopening theme and thus remain constructive on sectors such as Cyclicals namely Consumer Discretionary and select Transport. We turn positive on Technology, following the recent pullback, and maintain our underweight stance on Gloves and Plantations.
Total return over the following periods ended 30 June 2021*
1 month
6 month YTD 1 year 3 year 5 year 10 year
Fund RM Class (%) -2.99 -1.45 -1.45 4.88 7.56 17.24 61.09 Benchmark in RM (%) -2.27 -3.29 -3.29 1.76 5.19 8.66 27.05
Calendar year returns* 2016 2017 2018 2019 2020
Fund RM Class (%) -4.38 15.72 -7.60 11.64 -0.09 Benchmark in RM (%) -1.49 6.89 -5.26 3.56 6.66
* Source: Lipper; Past performance is not necessarily indicative of future performance. The performance is calculated on NAV-to-NAV basis.
-10%
0%
10%
20%
30%
40%
50%
60%
70%
80%
06/2011 04/2012 01/2013 10/2013 07/2014 05/2015 02/2016 11/2016 08/2017 06/2018 03/2019 12/2019 09/2020 06/2021
Top 5 holdings No. Security name % NAV
1 Press Metal Aluminium Hldg Bhd 7.6
2 Petronas Chemicals Group Bhd 7.3
3 Sime Darby Bhd 5.0 4 Tenaga Nasional Bhd 3.9 5 Dayang Enterprise Hldg Bhd 3.6
Highest & lowest NAV 2018 2019 2020
High 0.2663 0.2484 0.2432 Low 0.2203 0.2213 0.1853
Distribution by financial year 2018 2019 2020
Distribution (Sen) 1.30 1.00 0.59 Distribution Yield (%) 5.2 4.2 2.6
Asset/sector allocation No. Asset/sector name % NAV
1 Industrial Products & Svc 19.6 2 Technology 13.5 3 Energy 12.4 4 Consumer Products & Svc 10.0 5 Construction 7.2 6 Telecommunications/Media 6.9 7 Utilities 6.1 8 Transportation/Logistics 5.5 9 Others 10.6 10 Cash & Cash Equivalents 8.2
Geographical allocation No. Geographical name % NAV
1 Malaysia 91.8 2 Cash & Cash Equivalents 8.2
RM Class 3-year
Fund Volatility 12.2
Moderate Lipper Analytics
16 Jun 21
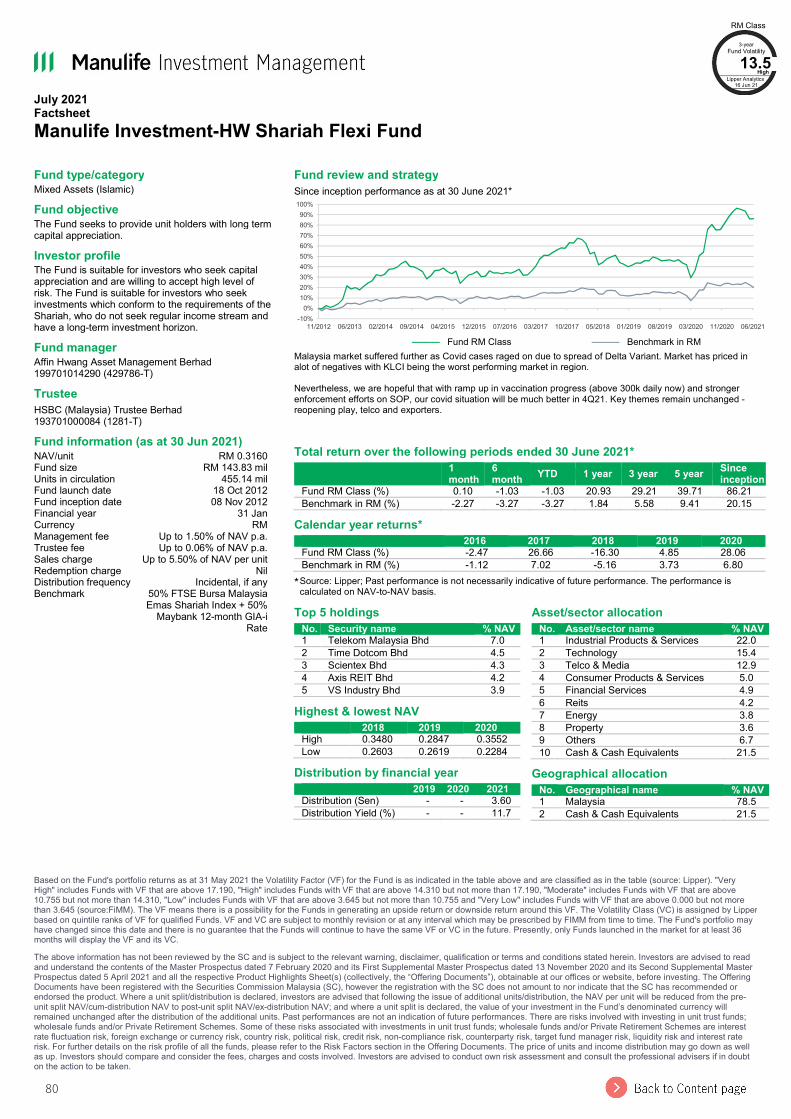
80
July 2021 Factsheet Manulife Investment-HW Shariah Flexi Fund
Based on the Fund's portfolio returns as at 31 May 2021 the Volatility Factor (VF) for the Fund is as indicated in the table above and are classified as in the table (source: Lipper). "Very High" includes Funds with VF that are above 17.190, "High" includes Funds with VF that are above 14.310 but not more than 17.190, "Moderate" includes Funds with VF that are above 10.755 but not more than 14.310, "Low" includes Funds with VF that are above 3.645 but not more than 10.755 and "Very Low" includes Funds with VF that are above 0.000 but not more than 3.645 (source:FiMM). The VF means there is a possibility for the Funds in generating an upside return or downside return around this VF. The Volatility Class (VC) is assigned by Lipper based on quintile ranks of VF for qualified Funds. VF and VC are subject to monthly revision or at any interval which may be prescribed by FIMM from time to time. The Fund's portfolio may have changed since this date and there is no guarantee that the Funds will continue to have the same VF or VC in the future. Presently, only Funds launched in the market for at least 36 months will display the VF and its VC. The above information has not been reviewed by the SC and is subject to the relevant warning, disclaimer, qualification or terms and conditions stated herein. Investors are advised to read and understand the contents of the Master Prospectus dated 7 February 2020 and its First Supplemental Master Prospectus dated 13 November 2020 and its Second Supplemental Master Prospectus dated 5 April 2021 and all the respective Product Highlights Sheet(s) (collectively, the “Offering Documents”), obtainable at our offices or website, before investing. The Offering Documents have been registered with the Securities Commission Malaysia (SC), however the registration with the SC does not amount to nor indicate that the SC has recommended or endorsed the product. Where a unit split/distribution is declared, investors are advised that following the issue of additional units/distribution, the NAV per unit will be reduced from the pre-unit split NAV/cum-distribution NAV to post-unit split NAV/ex-distribution NAV; and where a unit split is declared, the value of your investment in the Fund’s denominated currency will remained unchanged after the distribution of the additional units. Past performances are not an indication of future performances. There are risks involved with investing in unit trust funds; wholesale funds and/or Private Retirement Schemes. Some of these risks associated with investments in unit trust funds; wholesale funds and/or Private Retirement Schemes are interest rate fluctuation risk, foreign exchange or currency risk, country risk, political risk, credit risk, non-compliance risk, counterparty risk, target fund manager risk, liquidity risk and interest rate risk. For further details on the risk profile of all the funds, please refer to the Risk Factors section in the Offering Documents. The price of units and income distribution may go down as well as up. Investors should compare and consider the fees, charges and costs involved. Investors are advised to conduct own risk assessment and consult the professional advisers if in doubt on the action to be taken.
Fund type/category Mixed Assets (Islamic) Fund objective The Fund seeks to provide unit holders with long term capital appreciation. Investor profile The Fund is suitable for investors who seek capital appreciation and are willing to accept high level of risk. The Fund is suitable for investors who seek investments which conform to the requirements of the Shariah, who do not seek regular income stream and have a long-term investment horizon. Fund manager Affin Hwang Asset Management Berhad 199701014290 (429786-T) Trustee HSBC (Malaysia) Trustee Berhad 193701000084 (1281-T) Fund information (as at 30 Jun 2021) NAV/unit RM 0.3160 Fund size RM 143.83 mil Units in circulation 455.14 mil Fund launch date 18 Oct 2012 Fund inception date 08 Nov 2012 Financial year 31 Jan Currency RM Management fee Up to 1.50% of NAV p.a. Trustee fee Up to 0.06% of NAV p.a. Sales charge Up to 5.50% of NAV per unit Redemption charge Nil Distribution frequency Incidental, if any Benchmark 50% FTSE Bursa Malaysia
Emas Shariah Index + 50% Maybank 12-month GIA-i
Rate
Fund review and strategy Since inception performance as at 30 June 2021*
——— Fund RM Class ——— Benchmark in RM
Malaysia market suffered further as Covid cases raged on due to spread of Delta Variant. Market has priced in alot of negatives with KLCI being the worst performing market in region. Nevertheless, we are hopeful that with ramp up in vaccination progress (above 300k daily now) and stronger enforcement efforts on SOP, our covid situation will be much better in 4Q21. Key themes remain unchanged - reopening play, telco and exporters.
Total return over the following periods ended 30 June 2021*
1 month
6 month YTD 1 year 3 year 5 year Since
inception Fund RM Class (%) 0.10 -1.03 -1.03 20.93 29.21 39.71 86.21 Benchmark in RM (%) -2.27 -3.27 -3.27 1.84 5.58 9.41 20.15
Calendar year returns* 2016 2017 2018 2019 2020
Fund RM Class (%) -2.47 26.66 -16.30 4.85 28.06 Benchmark in RM (%) -1.12 7.02 -5.16 3.73 6.80
* Source: Lipper; Past performance is not necessarily indicative of future performance. The performance is calculated on NAV-to-NAV basis.
-10%0%
10%20%30%40%50%60%70%80%90%
100%
11/2012 06/2013 02/2014 09/2014 04/2015 12/2015 07/2016 03/2017 10/2017 05/2018 01/2019 08/2019 03/2020 11/2020 06/2021
Top 5 holdings No. Security name % NAV
1 Telekom Malaysia Bhd 7.0 2 Time Dotcom Bhd 4.5 3 Scientex Bhd 4.3 4 Axis REIT Bhd 4.2 5 VS Industry Bhd 3.9
Highest & lowest NAV 2018 2019 2020
High 0.3480 0.2847 0.3552 Low 0.2603 0.2619 0.2284
Distribution by financial year 2019 2020 2021
Distribution (Sen) - - 3.60 Distribution Yield (%) - - 11.7
Asset/sector allocation No. Asset/sector name % NAV
1 Industrial Products & Services 22.0 2 Technology 15.4 3 Telco & Media 12.9 4 Consumer Products & Services 5.0 5 Financial Services 4.9 6 Reits 4.2 7 Energy 3.8 8 Property 3.6 9 Others 6.7 10 Cash & Cash Equivalents 21.5
Geographical allocation No. Geographical name % NAV
1 Malaysia 78.5 2 Cash & Cash Equivalents 21.5
RM Class 3-year
Fund Volatility 13.5
High Lipper Analytics
16 Jun 21
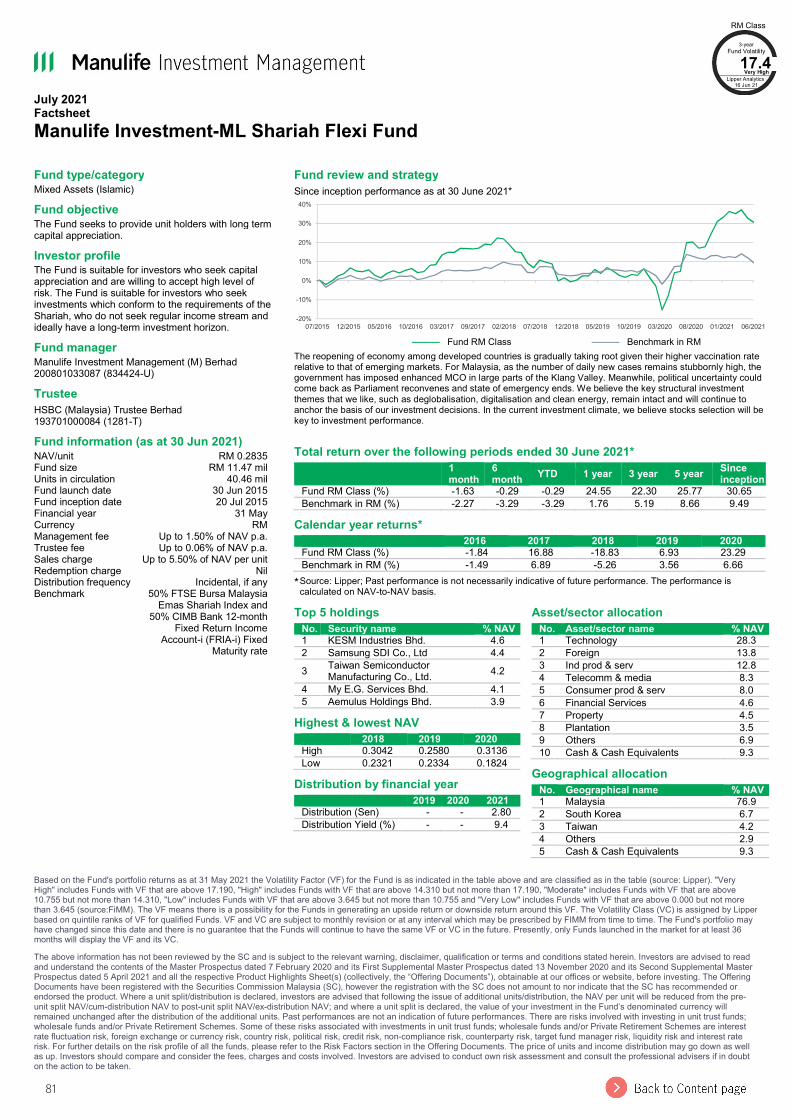
81
July 2021 Factsheet Manulife Investment-ML Shariah Flexi Fund
Based on the Fund's portfolio returns as at 31 May 2021 the Volatility Factor (VF) for the Fund is as indicated in the table above and are classified as in the table (source: Lipper). "Very High" includes Funds with VF that are above 17.190, "High" includes Funds with VF that are above 14.310 but not more than 17.190, "Moderate" includes Funds with VF that are above 10.755 but not more than 14.310, "Low" includes Funds with VF that are above 3.645 but not more than 10.755 and "Very Low" includes Funds with VF that are above 0.000 but not more than 3.645 (source:FiMM). The VF means there is a possibility for the Funds in generating an upside return or downside return around this VF. The Volatility Class (VC) is assigned by Lipper based on quintile ranks of VF for qualified Funds. VF and VC are subject to monthly revision or at any interval which may be prescribed by FIMM from time to time. The Fund's portfolio may have changed since this date and there is no guarantee that the Funds will continue to have the same VF or VC in the future. Presently, only Funds launched in the market for at least 36 months will display the VF and its VC. The above information has not been reviewed by the SC and is subject to the relevant warning, disclaimer, qualification or terms and conditions stated herein. Investors are advised to read and understand the contents of the Master Prospectus dated 7 February 2020 and its First Supplemental Master Prospectus dated 13 November 2020 and its Second Supplemental Master Prospectus dated 5 April 2021 and all the respective Product Highlights Sheet(s) (collectively, the “Offering Documents”), obtainable at our offices or website, before investing. The Offering Documents have been registered with the Securities Commission Malaysia (SC), however the registration with the SC does not amount to nor indicate that the SC has recommended or endorsed the product. Where a unit split/distribution is declared, investors are advised that following the issue of additional units/distribution, the NAV per unit will be reduced from the pre-unit split NAV/cum-distribution NAV to post-unit split NAV/ex-distribution NAV; and where a unit split is declared, the value of your investment in the Fund’s denominated currency will remained unchanged after the distribution of the additional units. Past performances are not an indication of future performances. There are risks involved with investing in unit trust funds; wholesale funds and/or Private Retirement Schemes. Some of these risks associated with investments in unit trust funds; wholesale funds and/or Private Retirement Schemes are interest rate fluctuation risk, foreign exchange or currency risk, country risk, political risk, credit risk, non-compliance risk, counterparty risk, target fund manager risk, liquidity risk and interest rate risk. For further details on the risk profile of all the funds, please refer to the Risk Factors section in the Offering Documents. The price of units and income distribution may go down as well as up. Investors should compare and consider the fees, charges and costs involved. Investors are advised to conduct own risk assessment and consult the professional advisers if in doubt on the action to be taken.
Fund type/category Mixed Assets (Islamic) Fund objective The Fund seeks to provide unit holders with long term capital appreciation. Investor profile The Fund is suitable for investors who seek capital appreciation and are willing to accept high level of risk. The Fund is suitable for investors who seek investments which conform to the requirements of the Shariah, who do not seek regular income stream and ideally have a long-term investment horizon. Fund manager Manulife Investment Management (M) Berhad 200801033087 (834424-U) Trustee HSBC (Malaysia) Trustee Berhad 193701000084 (1281-T) Fund information (as at 30 Jun 2021) NAV/unit RM 0.2835 Fund size RM 11.47 mil Units in circulation 40.46 mil Fund launch date 30 Jun 2015 Fund inception date 20 Jul 2015 Financial year 31 May Currency RM Management fee Up to 1.50% of NAV p.a. Trustee fee Up to 0.06% of NAV p.a. Sales charge Up to 5.50% of NAV per unit Redemption charge Nil Distribution frequency Incidental, if any Benchmark 50% FTSE Bursa Malaysia
Emas Shariah Index and 50% CIMB Bank 12-month
Fixed Return Income Account-i (FRIA-i) Fixed
Maturity rate
Fund review and strategy Since inception performance as at 30 June 2021*
——— Fund RM Class ——— Benchmark in RM
The reopening of economy among developed countries is gradually taking root given their higher vaccination rate relative to that of emerging markets. For Malaysia, as the number of daily new cases remains stubbornly high, the government has imposed enhanced MCO in large parts of the Klang Valley. Meanwhile, political uncertainty could come back as Parliament reconvenes and state of emergency ends. We believe the key structural investment themes that we like, such as deglobalisation, digitalisation and clean energy, remain intact and will continue to anchor the basis of our investment decisions. In the current investment climate, we believe stocks selection will be key to investment performance.
Total return over the following periods ended 30 June 2021*
1 month
6 month YTD 1 year 3 year 5 year Since
inception Fund RM Class (%) -1.63 -0.29 -0.29 24.55 22.30 25.77 30.65 Benchmark in RM (%) -2.27 -3.29 -3.29 1.76 5.19 8.66 9.49
Calendar year returns* 2016 2017 2018 2019 2020
Fund RM Class (%) -1.84 16.88 -18.83 6.93 23.29 Benchmark in RM (%) -1.49 6.89 -5.26 3.56 6.66
* Source: Lipper; Past performance is not necessarily indicative of future performance. The performance is calculated on NAV-to-NAV basis.
-20%
-10%
0%
10%
20%
30%
40%
07/2015 12/2015 05/2016 10/2016 03/2017 09/2017 02/2018 07/2018 12/2018 05/2019 10/2019 03/2020 08/2020 01/2021 06/2021
Top 5 holdings No. Security name % NAV
1 KESM Industries Bhd. 4.6 2 Samsung SDI Co., Ltd 4.4 3 Taiwan Semiconductor
Manufacturing Co., Ltd. 4.2 4 My E.G. Services Bhd. 4.1 5 Aemulus Holdings Bhd. 3.9
Highest & lowest NAV 2018 2019 2020
High 0.3042 0.2580 0.3136 Low 0.2321 0.2334 0.1824
Distribution by financial year 2019 2020 2021
Distribution (Sen) - - 2.80 Distribution Yield (%) - - 9.4
Asset/sector allocation No. Asset/sector name % NAV
1 Technology 28.3 2 Foreign 13.8 3 Ind prod & serv 12.8 4 Telecomm & media 8.3 5 Consumer prod & serv 8.0 6 Financial Services 4.6 7 Property 4.5 8 Plantation 3.5 9 Others 6.9 10 Cash & Cash Equivalents 9.3
Geographical allocation No. Geographical name % NAV
1 Malaysia 76.9 2 South Korea 6.7 3 Taiwan 4.2 4 Others 2.9 5 Cash & Cash Equivalents 9.3
RM Class 3-year
Fund Volatility 17.4
Very High Lipper Analytics
16 Jun 21
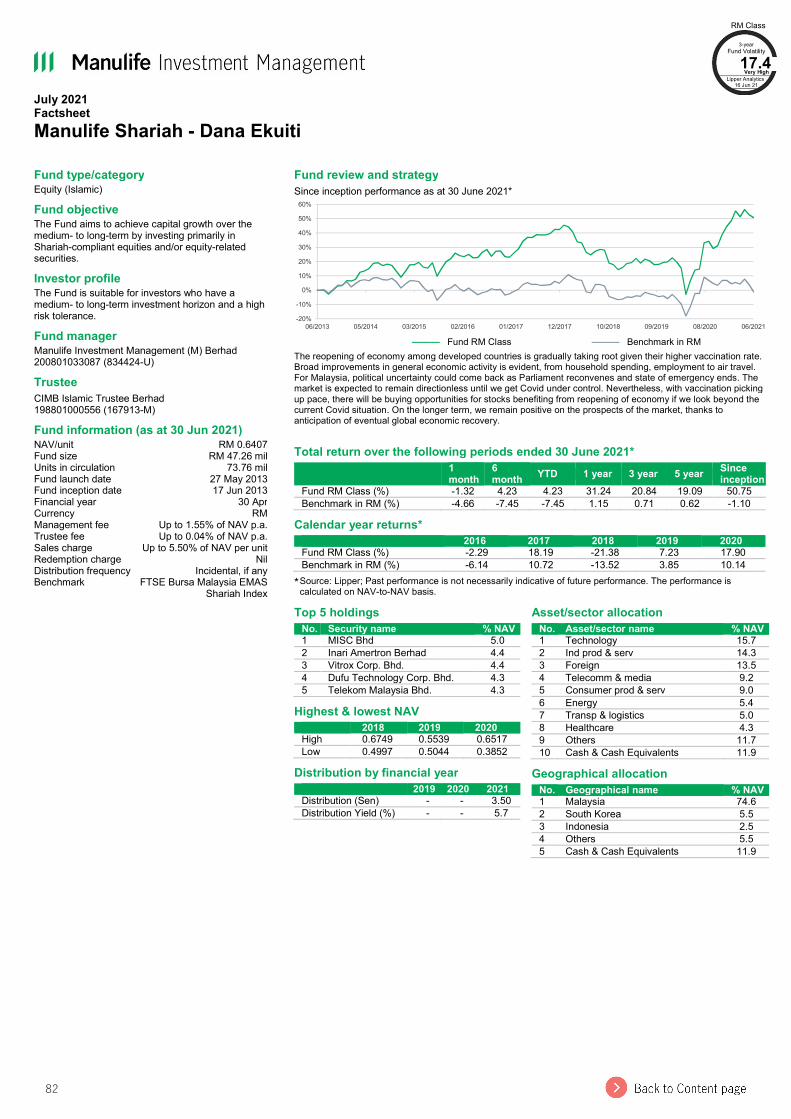
82
July 2021 Factsheet Manulife Shariah - Dana Ekuiti
Fund type/category Equity (Islamic) Fund objective The Fund aims to achieve capital growth over the medium- to long-term by investing primarily in Shariah-compliant equities and/or equity-related securities. Investor profile The Fund is suitable for investors who have a medium- to long-term investment horizon and a high risk tolerance. Fund manager Manulife Investment Management (M) Berhad 200801033087 (834424-U) Trustee CIMB Islamic Trustee Berhad 198801000556 (167913-M) Fund information (as at 30 Jun 2021) NAV/unit RM 0.6407 Fund size RM 47.26 mil Units in circulation 73.76 mil Fund launch date 27 May 2013 Fund inception date 17 Jun 2013 Financial year 30 Apr Currency RM Management fee Up to 1.55% of NAV p.a. Trustee fee Up to 0.04% of NAV p.a. Sales charge Up to 5.50% of NAV per unit Redemption charge Nil Distribution frequency Incidental, if any Benchmark FTSE Bursa Malaysia EMAS
Shariah Index
Fund review and strategy Since inception performance as at 30 June 2021*
——— Fund RM Class ——— Benchmark in RM
The reopening of economy among developed countries is gradually taking root given their higher vaccination rate. Broad improvements in general economic activity is evident, from household spending, employment to air travel. For Malaysia, political uncertainty could come back as Parliament reconvenes and state of emergency ends. The market is expected to remain directionless until we get Covid under control. Nevertheless, with vaccination picking up pace, there will be buying opportunities for stocks benefiting from reopening of economy if we look beyond the current Covid situation. On the longer term, we remain positive on the prospects of the market, thanks to anticipation of eventual global economic recovery.
Total return over the following periods ended 30 June 2021*
1 month
6 month YTD 1 year 3 year 5 year Since
inception Fund RM Class (%) -1.32 4.23 4.23 31.24 20.84 19.09 50.75 Benchmark in RM (%) -4.66 -7.45 -7.45 1.15 0.71 0.62 -1.10
Calendar year returns* 2016 2017 2018 2019 2020
Fund RM Class (%) -2.29 18.19 -21.38 7.23 17.90 Benchmark in RM (%) -6.14 10.72 -13.52 3.85 10.14
* Source: Lipper; Past performance is not necessarily indicative of future performance. The performance is calculated on NAV-to-NAV basis.
-20%
-10%
0%
10%
20%
30%
40%
50%
60%
06/2013 05/2014 03/2015 02/2016 01/2017 12/2017 10/2018 09/2019 08/2020 06/2021
Top 5 holdings No. Security name % NAV
1 MISC Bhd 5.0 2 Inari Amertron Berhad 4.4 3 Vitrox Corp. Bhd. 4.4 4 Dufu Technology Corp. Bhd. 4.3 5 Telekom Malaysia Bhd. 4.3
Highest & lowest NAV 2018 2019 2020
High 0.6749 0.5539 0.6517 Low 0.4997 0.5044 0.3852
Distribution by financial year 2019 2020 2021
Distribution (Sen) - - 3.50 Distribution Yield (%) - - 5.7
Asset/sector allocation No. Asset/sector name % NAV
1 Technology 15.7 2 Ind prod & serv 14.3 3 Foreign 13.5 4 Telecomm & media 9.2 5 Consumer prod & serv 9.0 6 Energy 5.4 7 Transp & logistics 5.0 8 Healthcare 4.3 9 Others 11.7 10 Cash & Cash Equivalents 11.9
Geographical allocation No. Geographical name % NAV
1 Malaysia 74.6 2 South Korea 5.5 3 Indonesia 2.5 4 Others 5.5 5 Cash & Cash Equivalents 11.9
RM Class 3-year
Fund Volatility 17.4
Very High Lipper Analytics
16 Jun 21
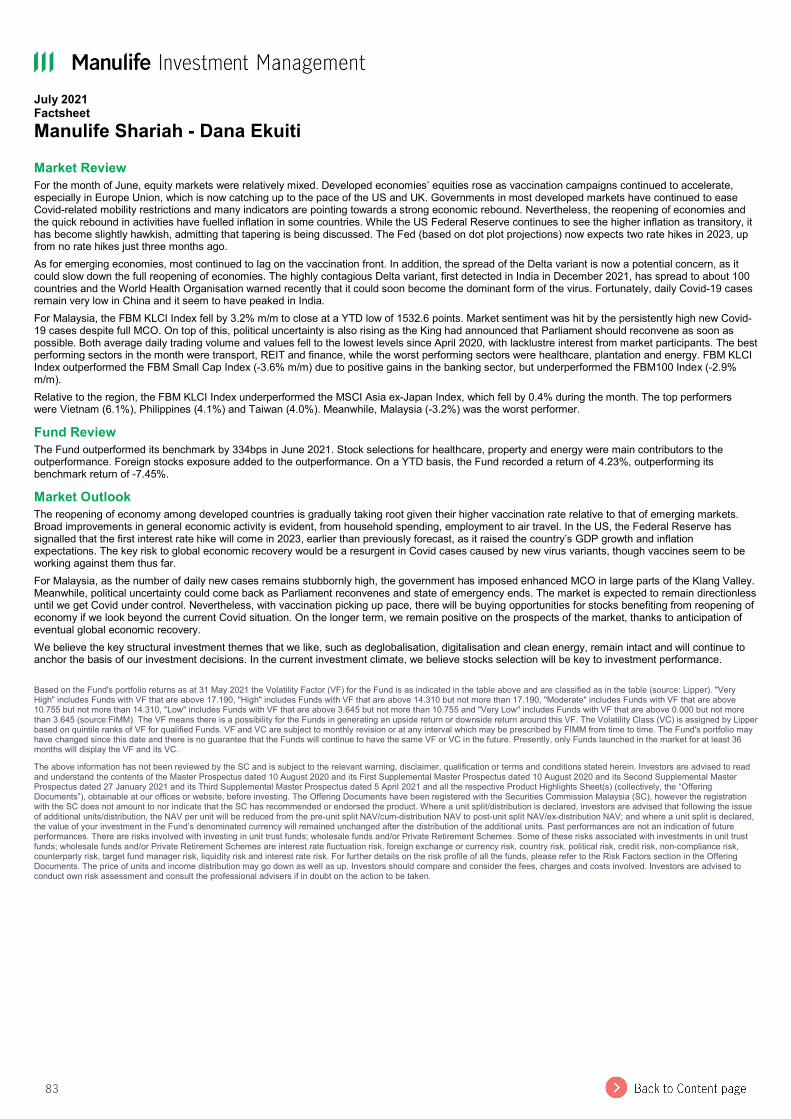
83
July 2021 Factsheet Manulife Shariah - Dana Ekuiti Market Review For the month of June, equity markets were relatively mixed. Developed economies’ equities rose as vaccination campaigns continued to accelerate, especially in Europe Union, which is now catching up to the pace of the US and UK. Governments in most developed markets have continued to ease Covid-related mobility restrictions and many indicators are pointing towards a strong economic rebound. Nevertheless, the reopening of economies and the quick rebound in activities have fuelled inflation in some countries. While the US Federal Reserve continues to see the higher inflation as transitory, it has become slightly hawkish, admitting that tapering is being discussed. The Fed (based on dot plot projections) now expects two rate hikes in 2023, up from no rate hikes just three months ago. As for emerging economies, most continued to lag on the vaccination front. In addition, the spread of the Delta variant is now a potential concern, as it could slow down the full reopening of economies. The highly contagious Delta variant, first detected in India in December 2021, has spread to about 100 countries and the World Health Organisation warned recently that it could soon become the dominant form of the virus. Fortunately, daily Covid-19 cases remain very low in China and it seem to have peaked in India. For Malaysia, the FBM KLCI Index fell by 3.2% m/m to close at a YTD low of 1532.6 points. Market sentiment was hit by the persistently high new Covid-19 cases despite full MCO. On top of this, political uncertainty is also rising as the King had announced that Parliament should reconvene as soon as possible. Both average daily trading volume and values fell to the lowest levels since April 2020, with lacklustre interest from market participants. The best performing sectors in the month were transport, REIT and finance, while the worst performing sectors were healthcare, plantation and energy. FBM KLCI Index outperformed the FBM Small Cap Index (-3.6% m/m) due to positive gains in the banking sector, but underperformed the FBM100 Index (-2.9% m/m). Relative to the region, the FBM KLCI Index underperformed the MSCI Asia ex-Japan Index, which fell by 0.4% during the month. The top performers were Vietnam (6.1%), Philippines (4.1%) and Taiwan (4.0%). Meanwhile, Malaysia (-3.2%) was the worst performer. Fund Review The Fund outperformed its benchmark by 334bps in June 2021. Stock selections for healthcare, property and energy were main contributors to the outperformance. Foreign stocks exposure added to the outperformance. On a YTD basis, the Fund recorded a return of 4.23%, outperforming its benchmark return of -7.45%. Market Outlook The reopening of economy among developed countries is gradually taking root given their higher vaccination rate relative to that of emerging markets. Broad improvements in general economic activity is evident, from household spending, employment to air travel. In the US, the Federal Reserve has signalled that the first interest rate hike will come in 2023, earlier than previously forecast, as it raised the country’s GDP growth and inflation expectations. The key risk to global economic recovery would be a resurgent in Covid cases caused by new virus variants, though vaccines seem to be working against them thus far. For Malaysia, as the number of daily new cases remains stubbornly high, the government has imposed enhanced MCO in large parts of the Klang Valley. Meanwhile, political uncertainty could come back as Parliament reconvenes and state of emergency ends. The market is expected to remain directionless until we get Covid under control. Nevertheless, with vaccination picking up pace, there will be buying opportunities for stocks benefiting from reopening of economy if we look beyond the current Covid situation. On the longer term, we remain positive on the prospects of the market, thanks to anticipation of eventual global economic recovery. We believe the key structural investment themes that we like, such as deglobalisation, digitalisation and clean energy, remain intact and will continue to anchor the basis of our investment decisions. In the current investment climate, we believe stocks selection will be key to investment performance. Based on the Fund's portfolio returns as at 31 May 2021 the Volatility Factor (VF) for the Fund is as indicated in the table above and are classified as in the table (source: Lipper). "Very High" includes Funds with VF that are above 17.190, "High" includes Funds with VF that are above 14.310 but not more than 17.190, "Moderate" includes Funds with VF that are above 10.755 but not more than 14.310, "Low" includes Funds with VF that are above 3.645 but not more than 10.755 and "Very Low" includes Funds with VF that are above 0.000 but not more than 3.645 (source:FiMM). The VF means there is a possibility for the Funds in generating an upside return or downside return around this VF. The Volatility Class (VC) is assigned by Lipper based on quintile ranks of VF for qualified Funds. VF and VC are subject to monthly revision or at any interval which may be prescribed by FIMM from time to time. The Fund's portfolio may have changed since this date and there is no guarantee that the Funds will continue to have the same VF or VC in the future. Presently, only Funds launched in the market for at least 36 months will display the VF and its VC. The above information has not been reviewed by the SC and is subject to the relevant warning, disclaimer, qualification or terms and conditions stated herein. Investors are advised to read and understand the contents of the Master Prospectus dated 10 August 2020 and its First Supplemental Master Prospectus dated 10 August 2020 and its Second Supplemental Master Prospectus dated 27 January 2021 and its Third Supplemental Master Prospectus dated 5 April 2021 and all the respective Product Highlights Sheet(s) (collectively, the “Offering Documents”), obtainable at our offices or website, before investing. The Offering Documents have been registered with the Securities Commission Malaysia (SC), however the registration with the SC does not amount to nor indicate that the SC has recommended or endorsed the product. Where a unit split/distribution is declared, investors are advised that following the issue of additional units/distribution, the NAV per unit will be reduced from the pre-unit split NAV/cum-distribution NAV to post-unit split NAV/ex-distribution NAV; and where a unit split is declared, the value of your investment in the Fund’s denominated currency will remained unchanged after the distribution of the additional units. Past performances are not an indication of future performances. There are risks involved with investing in unit trust funds; wholesale funds and/or Private Retirement Schemes. Some of these risks associated with investments in unit trust funds; wholesale funds and/or Private Retirement Schemes are interest rate fluctuation risk, foreign exchange or currency risk, country risk, political risk, credit risk, non-compliance risk, counterparty risk, target fund manager risk, liquidity risk and interest rate risk. For further details on the risk profile of all the funds, please refer to the Risk Factors section in the Offering Documents. The price of units and income distribution may go down as well as up. Investors should compare and consider the fees, charges and costs involved. Investors are advised to conduct own risk assessment and consult the professional advisers if in doubt on the action to be taken.
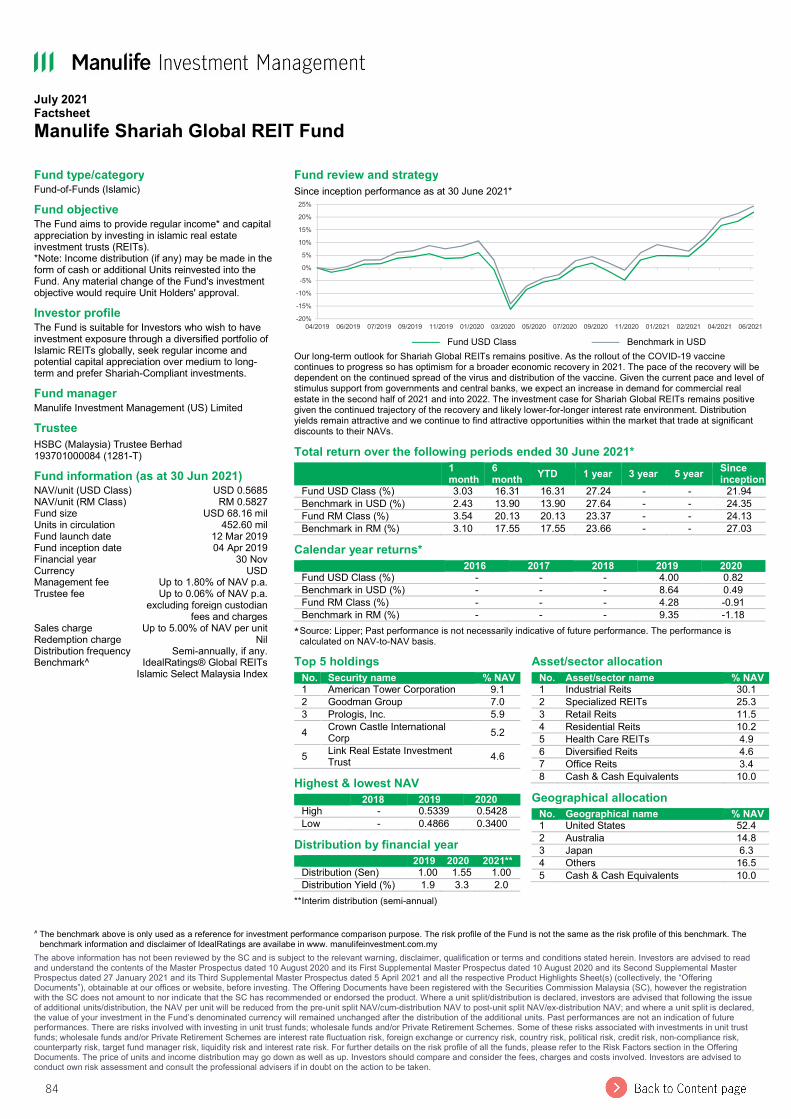
84
July 2021 Factsheet Manulife Shariah Global REIT Fund
^ The benchmark above is only used as a reference for investment performance comparison purpose. The risk profile of the Fund is not the same as the risk profile of this benchmark. The benchmark information and disclaimer of IdealRatings are availabe in www. manulifeinvestment.com.my
The above information has not been reviewed by the SC and is subject to the relevant warning, disclaimer, qualification or terms and conditions stated herein. Investors are advised to read and understand the contents of the Master Prospectus dated 10 August 2020 and its First Supplemental Master Prospectus dated 10 August 2020 and its Second Supplemental Master Prospectus dated 27 January 2021 and its Third Supplemental Master Prospectus dated 5 April 2021 and all the respective Product Highlights Sheet(s) (collectively, the “Offering Documents”), obtainable at our offices or website, before investing. The Offering Documents have been registered with the Securities Commission Malaysia (SC), however the registration with the SC does not amount to nor indicate that the SC has recommended or endorsed the product. Where a unit split/distribution is declared, investors are advised that following the issue of additional units/distribution, the NAV per unit will be reduced from the pre-unit split NAV/cum-distribution NAV to post-unit split NAV/ex-distribution NAV; and where a unit split is declared, the value of your investment in the Fund’s denominated currency will remained unchanged after the distribution of the additional units. Past performances are not an indication of future performances. There are risks involved with investing in unit trust funds; wholesale funds and/or Private Retirement Schemes. Some of these risks associated with investments in unit trust funds; wholesale funds and/or Private Retirement Schemes are interest rate fluctuation risk, foreign exchange or currency risk, country risk, political risk, credit risk, non-compliance risk, counterparty risk, target fund manager risk, liquidity risk and interest rate risk. For further details on the risk profile of all the funds, please refer to the Risk Factors section in the Offering Documents. The price of units and income distribution may go down as well as up. Investors should compare and consider the fees, charges and costs involved. Investors are advised to conduct own risk assessment and consult the professional advisers if in doubt on the action to be taken.
Fund type/category Fund-of-Funds (Islamic) Fund objective The Fund aims to provide regular income* and capital appreciation by investing in islamic real estate investment trusts (REITs). *Note: Income distribution (if any) may be made in the form of cash or additional Units reinvested into the Fund. Any material change of the Fund's investment objective would require Unit Holders' approval. Investor profile The Fund is suitable for Investors who wish to have investment exposure through a diversified portfolio of Islamic REITs globally, seek regular income and potential capital appreciation over medium to long-term and prefer Shariah-Compliant investments. Fund manager Manulife Investment Management (US) Limited Trustee HSBC (Malaysia) Trustee Berhad 193701000084 (1281-T) Fund information (as at 30 Jun 2021) NAV/unit (USD Class) USD 0.5685 NAV/unit (RM Class) RM 0.5827 Fund size USD 68.16 mil Units in circulation 452.60 mil Fund launch date 12 Mar 2019 Fund inception date 04 Apr 2019 Financial year 30 Nov Currency USD Management fee Up to 1.80% of NAV p.a. Trustee fee Up to 0.06% of NAV p.a.
excluding foreign custodian fees and charges
Sales charge Up to 5.00% of NAV per unit Redemption charge Nil Distribution frequency Semi-annually, if any. Benchmark^ IdealRatings® Global REITs
Islamic Select Malaysia Index
Fund review and strategy Since inception performance as at 30 June 2021*
——— Fund USD Class ——— Benchmark in USD
Our long-term outlook for Shariah Global REITs remains positive. As the rollout of the COVID-19 vaccine continues to progress so has optimism for a broader economic recovery in 2021. The pace of the recovery will be dependent on the continued spread of the virus and distribution of the vaccine. Given the current pace and level of stimulus support from governments and central banks, we expect an increase in demand for commercial real estate in the second half of 2021 and into 2022. The investment case for Shariah Global REITs remains positive given the continued trajectory of the recovery and likely lower-for-longer interest rate environment. Distribution yields remain attractive and we continue to find attractive opportunities within the market that trade at significant discounts to their NAVs. Total return over the following periods ended 30 June 2021*
1 month
6 month YTD 1 year 3 year 5 year Since
inception Fund USD Class (%) 3.03 16.31 16.31 27.24 - - 21.94 Benchmark in USD (%) 2.43 13.90 13.90 27.64 - - 24.35 Fund RM Class (%) 3.54 20.13 20.13 23.37 - - 24.13 Benchmark in RM (%) 3.10 17.55 17.55 23.66 - - 27.03
Calendar year returns* 2016 2017 2018 2019 2020
Fund USD Class (%) - - - 4.00 0.82 Benchmark in USD (%) - - - 8.64 0.49 Fund RM Class (%) - - - 4.28 -0.91 Benchmark in RM (%) - - - 9.35 -1.18
* Source: Lipper; Past performance is not necessarily indicative of future performance. The performance is calculated on NAV-to-NAV basis.
-20%
-15%
-10%
-5%
0%
5%
10%
15%
20%
25%
04/2019 06/2019 07/2019 09/2019 11/2019 01/2020 03/2020 05/2020 07/2020 09/2020 11/2020 01/2021 02/2021 04/2021 06/2021
Top 5 holdings No. Security name % NAV
1 American Tower Corporation 9.1 2 Goodman Group 7.0 3 Prologis, Inc. 5.9 4 Crown Castle International
Corp 5.2
5 Link Real Estate Investment Trust 4.6
Highest & lowest NAV 2018 2019 2020
High - 0.5339 0.5428 Low - 0.4866 0.3400
Distribution by financial year 2019 2020 2021**
Distribution (Sen) 1.00 1.55 1.00 Distribution Yield (%) 1.9 3.3 2.0
** Interim distribution (semi-annual)
Asset/sector allocation No. Asset/sector name % NAV
1 Industrial Reits 30.1 2 Specialized REITs 25.3 3 Retail Reits 11.5 4 Residential Reits 10.2 5 Health Care REITs 4.9 6 Diversified Reits 4.6 7 Office Reits 3.4 8 Cash & Cash Equivalents 10.0
Geographical allocation No. Geographical name % NAV
1 United States 52.4 2 Australia 14.8 3 Japan 6.3 4 Others 16.5 5 Cash & Cash Equivalents 10.0

85
July 2021 Factsheet Manulife Investment As-Saad
~ You are advised not to solely rely upon the ratings or rankings disclosed herein in making an investment decision. The ratings or rankings disclosed herein are current; the same may change in the future.
Based on the Fund's portfolio returns as at 31 May 2021 the Volatility Factor (VF) for the Fund is as indicated in the table above and are classified as in the table (source: Lipper). "Very High" includes Funds with VF that are above 17.190, "High" includes Funds with VF that are above 14.310 but not more than 17.190, "Moderate" includes Funds with VF that are above 10.755 but not more than 14.310, "Low" includes Funds with VF that are above 3.645 but not more than 10.755 and "Very Low" includes Funds with VF that are above 0.000 but not more than 3.645 (source:FiMM). The VF means there is a possibility for the Funds in generating an upside return or downside return around this VF. The Volatility Class (VC) is assigned by Lipper based on quintile ranks of VF for qualified Funds. VF and VC are subject to monthly revision or at any interval which may be prescribed by FIMM from time to time. The Fund's portfolio may have changed since this date and there is no guarantee that the Funds will continue to have the same VF or VC in the future. Presently, only Funds launched in the market for at least 36 months will display the VF and its VC. The above information has not been reviewed by the SC and is subject to the relevant warning, disclaimer, qualification or terms and conditions stated herein. Investors are advised to read and understand the contents of the Master Prospectus dated 7 February 2020 and its First Supplemental Master Prospectus dated 13 November 2020 and its Second Supplemental Master Prospectus dated 5 April 2021 and all the respective Product Highlights Sheet(s) (collectively, the “Offering Documents”), obtainable at our offices or website, before investing. The Offering Documents have been registered with the Securities Commission Malaysia (SC), however the registration with the SC does not amount to nor indicate that the SC has recommended or endorsed the product. Where a unit split/distribution is declared, investors are advised that following the issue of additional units/distribution, the NAV per unit will be reduced from the pre-unit split NAV/cum-distribution NAV to post-unit split NAV/ex-distribution NAV; and where a unit split is declared, the value of your investment in the Fund’s denominated currency will remained unchanged after the distribution of the additional units. Past performances are not an indication of future performances. There are risks involved with investing in unit trust funds; wholesale funds and/or Private Retirement Schemes. Some of these risks associated with investments in unit trust funds; wholesale funds and/or Private Retirement Schemes are interest rate fluctuation risk, foreign exchange or currency risk, country risk, political risk, credit risk, non-compliance risk, counterparty risk, target fund manager risk, liquidity risk and interest rate risk. For further details on the risk profile of all the funds, please refer to the Risk Factors section in the Offering Documents. The price of units and income distribution may go down as well as up. Investors should compare and consider the fees, charges and costs involved. Investors are advised to conduct own risk assessment and consult the professional advisers if in doubt on the action to be taken.
Fund type/category Sukuk Fund objective To provide Unit Holders with higher than average returns compared to fixed deposits in medium- to long-term periods by investing in bonds* and other fixed income securities* which are Shariah-compliant. * Refer to sukuk and other Islamic fixed income securities. Investor profile The Fund is suitable for investors who prefer to invest in sukuk with a lower level of risk. The Fund is suitable for investors who are less concerned on capital appreciation but seek consistent, reasonable and stable income distribution from their investments that comply with Shariah requirements and have a medium- to long-term investment horizon. Fund manager Manulife Investment Management (M) Berhad 200801033087 (834424-U) Trustee HSBC (Malaysia) Trustee Berhad 193701000084 (1281-T) Fund information (as at 30 Jun 2021) NAV/unit RM 1.1619 Fund size RM 150.61 mil Units in circulation 129.62 mil Fund launch date 30 Jun 2003 Fund inception date 22 Jul 2003 Financial year 31 Oct Currency RM Management fee Up to 0.75% of NAV p.a. Trustee fee Up to 0.06% of NAV p.a. Sales charge Up to 0.25% of NAV per unit Redemption charge Nil Distribution frequency Annually, if any Benchmark 5-year MGS Bond Index
Fund review and strategy 10-year performance as at 30 June 2021*
——— Fund RM Class ——— Benchmark in RM
The Fund will adopt active tactical strategies for its government Sukuk investments while maintaining fund liquidity. Total return over the following periods ended 30 June 2021*
1 month
6 month YTD 1 year 3 year 5 year 10 year
Fund RM Class (%) 0.32 -0.22 -0.22 1.80 17.72 24.69 49.05 Benchmark in RM (%) 0.21 1.20 1.20 2.28 9.28 17.28 39.37
Calendar year returns* 2016 2017 2018 2019 2020
Fund RM Class (%) 3.17 4.32 4.40 8.44 5.80 Benchmark in RM (%) 3.43 3.66 3.73 3.44 2.46
* Source: Lipper; Past performance is not necessarily indicative of future performance. The performance is calculated on NAV-to-NAV basis.
0%
5%
10%15%
20%
25%
30%35%
40%
45%50%
06/2011 04/2012 01/2013 10/2013 07/2014 05/2015 02/2016 11/2016 08/2017 06/2018 03/2019 12/2019 09/2020 06/2021
Top 5 holdings No. Security name % NAV
1 Malaysia Government Investment Issue 3.422 09/30/27
9.4
2 Malaysia Government Investment Issue 3.151 05/15/23
7.5
3 Malaysia Government Investment Issue 3.655 10/15/24
7.0
4 Country Garden Real Estate Sdn Bhd 5.25 03/27/25 6.2
5 Malaysia Government Investment Issue 3.726 03/31/26
5.6
Highest & lowest NAV 2018 2019 2020
High 1.1485 1.1929 1.2143 Low 1.1011 1.1100 1.1406
Distribution by financial year 2018 2019 2020
Distribution (Sen) 4.65 5.65 4.80 Distribution Yield (%) 4.2 4.9 4.1
Asset/sector allocation~ No. Asset/sector name % NAV
1 AAA 7.3 2 AA 41.1 3 A 6.2 4 Quasi Government 1.4 5 Government 29.5 6 Cash & Cash Equivalents 14.4
Geographical allocation No. Geographical name % NAV
1 Malaysia 85.6 2 Cash & Cash Equivalents 14.4
RM Class 3-year
Fund Volatility 2.7
Very Low Lipper Analytics
16 Jun 21
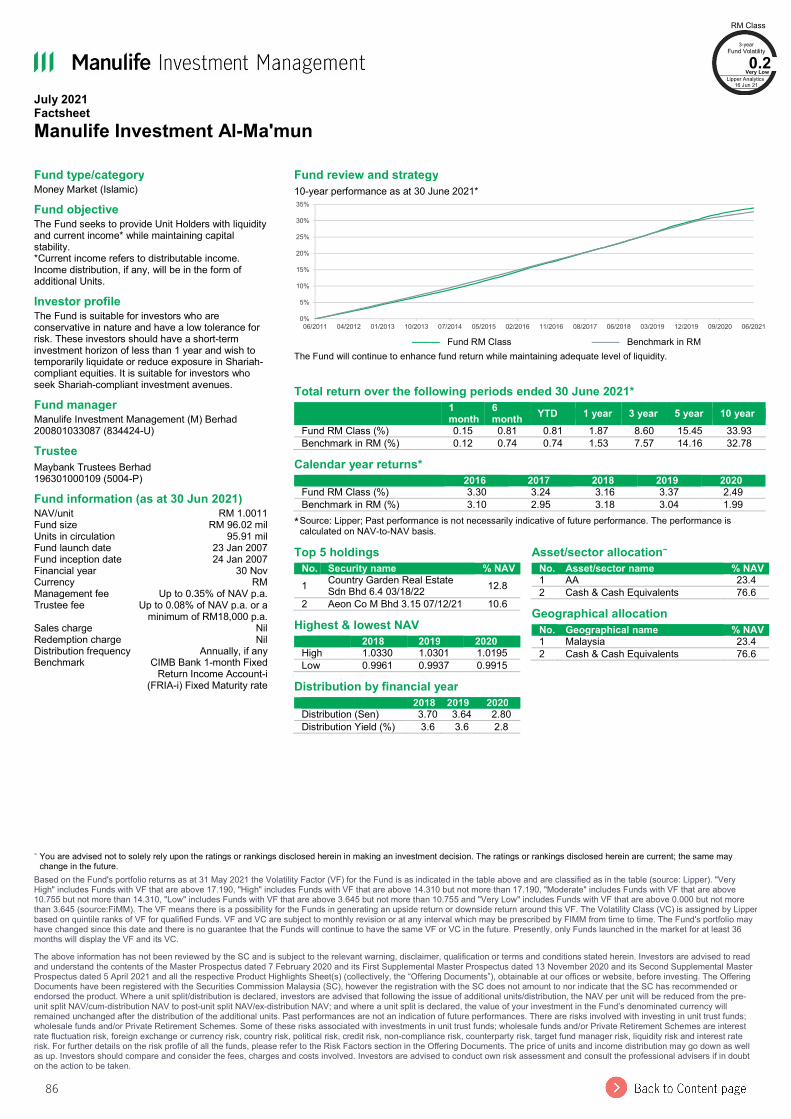
86
July 2021 Factsheet Manulife Investment Al-Ma'mun
~ You are advised not to solely rely upon the ratings or rankings disclosed herein in making an investment decision. The ratings or rankings disclosed herein are current; the same may change in the future.
Based on the Fund's portfolio returns as at 31 May 2021 the Volatility Factor (VF) for the Fund is as indicated in the table above and are classified as in the table (source: Lipper). "Very High" includes Funds with VF that are above 17.190, "High" includes Funds with VF that are above 14.310 but not more than 17.190, "Moderate" includes Funds with VF that are above 10.755 but not more than 14.310, "Low" includes Funds with VF that are above 3.645 but not more than 10.755 and "Very Low" includes Funds with VF that are above 0.000 but not more than 3.645 (source:FiMM). The VF means there is a possibility for the Funds in generating an upside return or downside return around this VF. The Volatility Class (VC) is assigned by Lipper based on quintile ranks of VF for qualified Funds. VF and VC are subject to monthly revision or at any interval which may be prescribed by FIMM from time to time. The Fund's portfolio may have changed since this date and there is no guarantee that the Funds will continue to have the same VF or VC in the future. Presently, only Funds launched in the market for at least 36 months will display the VF and its VC. The above information has not been reviewed by the SC and is subject to the relevant warning, disclaimer, qualification or terms and conditions stated herein. Investors are advised to read and understand the contents of the Master Prospectus dated 7 February 2020 and its First Supplemental Master Prospectus dated 13 November 2020 and its Second Supplemental Master Prospectus dated 5 April 2021 and all the respective Product Highlights Sheet(s) (collectively, the “Offering Documents”), obtainable at our offices or website, before investing. The Offering Documents have been registered with the Securities Commission Malaysia (SC), however the registration with the SC does not amount to nor indicate that the SC has recommended or endorsed the product. Where a unit split/distribution is declared, investors are advised that following the issue of additional units/distribution, the NAV per unit will be reduced from the pre-unit split NAV/cum-distribution NAV to post-unit split NAV/ex-distribution NAV; and where a unit split is declared, the value of your investment in the Fund’s denominated currency will remained unchanged after the distribution of the additional units. Past performances are not an indication of future performances. There are risks involved with investing in unit trust funds; wholesale funds and/or Private Retirement Schemes. Some of these risks associated with investments in unit trust funds; wholesale funds and/or Private Retirement Schemes are interest rate fluctuation risk, foreign exchange or currency risk, country risk, political risk, credit risk, non-compliance risk, counterparty risk, target fund manager risk, liquidity risk and interest rate risk. For further details on the risk profile of all the funds, please refer to the Risk Factors section in the Offering Documents. The price of units and income distribution may go down as well as up. Investors should compare and consider the fees, charges and costs involved. Investors are advised to conduct own risk assessment and consult the professional advisers if in doubt on the action to be taken.
Fund type/category Money Market (Islamic) Fund objective The Fund seeks to provide Unit Holders with liquidity and current income* while maintaining capital stability. *Current income refers to distributable income. Income distribution, if any, will be in the form of additional Units. Investor profile The Fund is suitable for investors who are conservative in nature and have a low tolerance for risk. These investors should have a short-term investment horizon of less than 1 year and wish to temporarily liquidate or reduce exposure in Shariah-compliant equities. It is suitable for investors who seek Shariah-compliant investment avenues. Fund manager Manulife Investment Management (M) Berhad 200801033087 (834424-U) Trustee Maybank Trustees Berhad 196301000109 (5004-P) Fund information (as at 30 Jun 2021) NAV/unit RM 1.0011 Fund size RM 96.02 mil Units in circulation 95.91 mil Fund launch date 23 Jan 2007 Fund inception date 24 Jan 2007 Financial year 30 Nov Currency RM Management fee Up to 0.35% of NAV p.a. Trustee fee Up to 0.08% of NAV p.a. or a
minimum of RM18,000 p.a. Sales charge Nil Redemption charge Nil Distribution frequency Annually, if any Benchmark CIMB Bank 1-month Fixed
Return Income Account-i (FRIA-i) Fixed Maturity rate
Fund review and strategy 10-year performance as at 30 June 2021*
——— Fund RM Class ——— Benchmark in RM
The Fund will continue to enhance fund return while maintaining adequate level of liquidity.
Total return over the following periods ended 30 June 2021*
1 month
6 month YTD 1 year 3 year 5 year 10 year
Fund RM Class (%) 0.15 0.81 0.81 1.87 8.60 15.45 33.93 Benchmark in RM (%) 0.12 0.74 0.74 1.53 7.57 14.16 32.78
Calendar year returns* 2016 2017 2018 2019 2020
Fund RM Class (%) 3.30 3.24 3.16 3.37 2.49 Benchmark in RM (%) 3.10 2.95 3.18 3.04 1.99
* Source: Lipper; Past performance is not necessarily indicative of future performance. The performance is calculated on NAV-to-NAV basis.
0%
5%
10%
15%
20%
25%
30%
35%
06/2011 04/2012 01/2013 10/2013 07/2014 05/2015 02/2016 11/2016 08/2017 06/2018 03/2019 12/2019 09/2020 06/2021
Top 5 holdings No. Security name % NAV
1 Country Garden Real Estate Sdn Bhd 6.4 03/18/22 12.8
2 Aeon Co M Bhd 3.15 07/12/21 10.6 Highest & lowest NAV 2018 2019 2020
High 1.0330 1.0301 1.0195 Low 0.9961 0.9937 0.9915
Distribution by financial year 2018 2019 2020
Distribution (Sen) 3.70 3.64 2.80 Distribution Yield (%) 3.6 3.6 2.8
Asset/sector allocation~ No. Asset/sector name % NAV
1 AA 23.4 2 Cash & Cash Equivalents 76.6
Geographical allocation No. Geographical name % NAV
1 Malaysia 23.4 2 Cash & Cash Equivalents 76.6
RM Class 3-year
Fund Volatility 0.2
Very Low Lipper Analytics
16 Jun 21
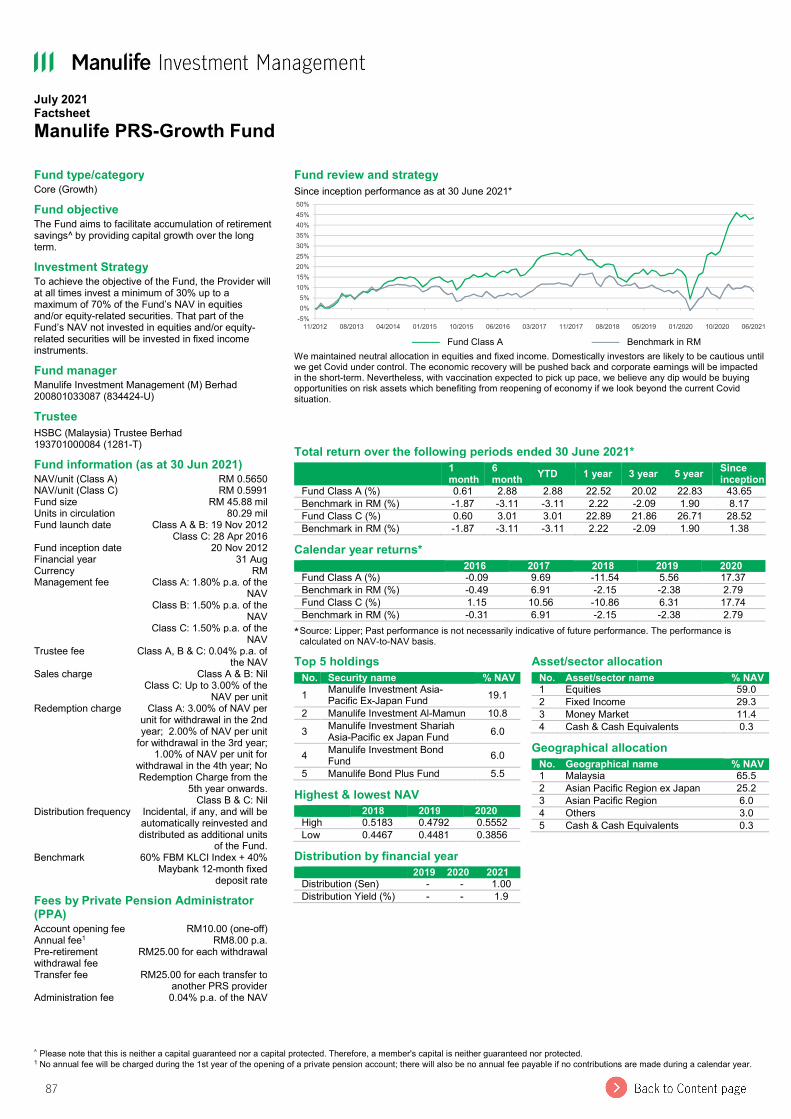
87
July 2021 Factsheet Manulife PRS-Growth Fund
^ Please note that this is neither a capital guaranteed nor a capital protected. Therefore, a member's capital is neither guaranteed nor protected. 1 No annual fee will be charged during the 1st year of the opening of a private pension account; there will also be no annual fee payable if no contributions are made during a calendar year.
Fund type/category Core (Growth) Fund objective The Fund aims to facilitate accumulation of retirement savings^ by providing capital growth over the long term. Investment Strategy To achieve the objective of the Fund, the Provider will at all times invest a minimum of 30% up to a maximum of 70% of the Fund’s NAV in equities and/or equity-related securities. That part of the Fund’s NAV not invested in equities and/or equity-related securities will be invested in fixed income instruments. Fund manager Manulife Investment Management (M) Berhad 200801033087 (834424-U) Trustee HSBC (Malaysia) Trustee Berhad 193701000084 (1281-T) Fund information (as at 30 Jun 2021) NAV/unit (Class A) RM 0.5650 NAV/unit (Class C) RM 0.5991 Fund size RM 45.88 mil Units in circulation 80.29 mil Fund launch date Class A & B: 19 Nov 2012
Class C: 28 Apr 2016 Fund inception date 20 Nov 2012 Financial year 31 Aug Currency RM Management fee Class A: 1.80% p.a. of the
NAV Class B: 1.50% p.a. of the
NAV Class C: 1.50% p.a. of the
NAV Trustee fee Class A, B & C: 0.04% p.a. of
the NAV Sales charge Class A & B: Nil
Class C: Up to 3.00% of the NAV per unit
Redemption charge Class A: 3.00% of NAV per unit for withdrawal in the 2nd year; 2.00% of NAV per unit
for withdrawal in the 3rd year; 1.00% of NAV per unit for
withdrawal in the 4th year; No Redemption Charge from the
5th year onwards. Class B & C: Nil
Distribution frequency Incidental, if any, and will be automatically reinvested and distributed as additional units
of the Fund. Benchmark 60% FBM KLCI Index + 40%
Maybank 12-month fixed deposit rate
Fees by Private Pension Administrator (PPA) Account opening fee RM10.00 (one-off) Annual fee1 RM8.00 p.a. Pre-retirement withdrawal fee
RM25.00 for each withdrawal Transfer fee RM25.00 for each transfer to
another PRS provider Administration fee 0.04% p.a. of the NAV
Fund review and strategy Since inception performance as at 30 June 2021*
——— Fund Class A ——— Benchmark in RM
We maintained neutral allocation in equities and fixed income. Domestically investors are likely to be cautious until we get Covid under control. The economic recovery will be pushed back and corporate earnings will be impacted in the short-term. Nevertheless, with vaccination expected to pick up pace, we believe any dip would be buying opportunities on risk assets which benefiting from reopening of economy if we look beyond the current Covid situation.
Total return over the following periods ended 30 June 2021*
1 month
6 month YTD 1 year 3 year 5 year Since
inception Fund Class A (%) 0.61 2.88 2.88 22.52 20.02 22.83 43.65 Benchmark in RM (%) -1.87 -3.11 -3.11 2.22 -2.09 1.90 8.17 Fund Class C (%) 0.60 3.01 3.01 22.89 21.86 26.71 28.52 Benchmark in RM (%) -1.87 -3.11 -3.11 2.22 -2.09 1.90 1.38
Calendar year returns* 2016 2017 2018 2019 2020
Fund Class A (%) -0.09 9.69 -11.54 5.56 17.37 Benchmark in RM (%) -0.49 6.91 -2.15 -2.38 2.79 Fund Class C (%) 1.15 10.56 -10.86 6.31 17.74 Benchmark in RM (%) -0.31 6.91 -2.15 -2.38 2.79
* Source: Lipper; Past performance is not necessarily indicative of future performance. The performance is calculated on NAV-to-NAV basis.
-5%0%5%
10%15%20%25%30%35%40%45%50%
11/2012 08/2013 04/2014 01/2015 10/2015 06/2016 03/2017 11/2017 08/2018 05/2019 01/2020 10/2020 06/2021
Top 5 holdings No. Security name % NAV
1 Manulife Investment Asia-Pacific Ex-Japan Fund 19.1
2 Manulife Investment Al-Mamun 10.8 3 Manulife Investment Shariah
Asia-Pacific ex Japan Fund 6.0
4 Manulife Investment Bond Fund 6.0
5 Manulife Bond Plus Fund 5.5 Highest & lowest NAV 2018 2019 2020
High 0.5183 0.4792 0.5552 Low 0.4467 0.4481 0.3856
Distribution by financial year 2019 2020 2021
Distribution (Sen) - - 1.00 Distribution Yield (%) - - 1.9
Asset/sector allocation No. Asset/sector name % NAV
1 Equities 59.0 2 Fixed Income 29.3 3 Money Market 11.4 4 Cash & Cash Equivalents 0.3
Geographical allocation No. Geographical name % NAV
1 Malaysia 65.5 2 Asian Pacific Region ex Japan 25.2 3 Asian Pacific Region 6.0 4 Others 3.0 5 Cash & Cash Equivalents 0.3

88
July 2021 Factsheet Manulife PRS-Growth Fund Market Review Equity For the month of June, equity markets were relatively mixed. Developed economies’ equities rose as vaccination campaigns continued to accelerate, especially in Europe Union, which is now catching up to the pace of the US and UK. Governments in most developed markets have continued to ease Covid-related mobility restrictions and many indicators are pointing towards a strong economic rebound. Nevertheless, the reopening of economies and the quick rebound in activities have fuelled inflation in some countries. While the US Federal Reserve continues to see the higher inflation as transitory, it has become slightly hawkish, admitting that tapering is being discussed. The Fed (based on dot plot projections) now expects two rate hikes in 2023, up from no rate hikes just three months ago. As for emerging economies, most continued to lag on the vaccination front. In addition, the spread of the Delta variant is now a potential concern, as it could slow down the full reopening of economies. The highly contagious Delta variant, first detected in India in December 2021, has spread to about 100 countries and the World Health Organization warned recently that it could soon become the dominant form of the virus. Fortunately, daily Covid-19 cases remain very low in China and it seem to have peaked in India. For Malaysia, the FBM KLCI Index fell by 3.2% m/m to close at a YTD low of 1532.6 points. Market sentiment was hit by the persistently high new Covid-19 cases despite full MCO. On top of this, political uncertainty is also rising as the King had announced that Parliament should reconvene as soon as possible. Both average daily trading volume and values fell to the lowest levels since April 2020, with lackluster interest from market participants. The best performing sectors in the month were transport, REIT and finance, while the worst performing sectors were healthcare, plantation and energy. FBM KLCI Index outperformed the FBM Small Cap Index (-3.6% m/m) due to positive gains in the banking sector, but underperformed the FBM100 Index (-2.9% m/m). Relative to the region, the FBM KLCI Index underperformed the MSCI Asia ex-Japan Index, which fell by 0.4% during the month. The top performers were Vietnam (6.1%), Philippines (4.1%) and Taiwan (4.0%). Meanwhile, Malaysia (-3.2%) was the worst performer. Fixed Income The US Treasury (UST) yield curve flattened in June 2021; 2-year, 5-year and 10-year UST yields changed 11 bps, 9 bps and -13 bps to close at 0.25%, 0.89% and 1.47% respectively. Federal Reserve in its monetary policy meeting in June decided to move forward their projection for interest rate hike from 2024 to 2023 as inflationary pressure took centre stage. Prior to the meeting, May’s CPI had shot up to 5.0% (April: 4.2%) year-on-year, which is highest level in 13 years. The Malaysia Government Securities (MGS) yield curve steepened during the month. 3-year, 5-year and 10-year MGS yields changed -5 bps, -5 bps and +5 bps respectively to close at 2.26%, 2.54% and 3.28%. The lockdown was imminent following the spike in new Covid-19 cases to nearly 10,000 per day by end of May. Besides the elevated number seen in the daily new cases, the country was also hit by the emergence of the new delta variant of the coronavirus that is more transmissible. Fund Review In June 2021, the Fund generated a return of 0.61%, outperforming its benchmark return of -1.87%. The performance was mainly due to better stock selection in local equity and the underlying fund selection in Manulife Investment Asia Pacific Ex Japan Fund. On a year-to-date basis, the Fund registered a return of 2.88%, outperforming its benchmark return of -3.11%. Market Outlook Equity The reopening of economy among developed countries is gradually taking root given their higher vaccination rate relative to that of emerging markets. Broad improvements in general economic activity is evident, from household spending, employment to air travel. In the US, the Federal Reserve has signalled that the first interest rate hike will come in 2023, earlier than previously forecast, as it raised the country’s GDP growth and inflation expectations. The key risk to global economic recovery would be a resurgent in Covid cases caused by new virus variants, though vaccines seem to be working against them thus far. For Malaysia, as the number of daily new cases remains stubbornly high, the government has imposed enhanced MCO in large parts of Klang Valley. Meanwhile, political uncertainty could come back as Parliament reconvenes and state of emergency ends. The market is expected to remain directionless until we get Covid under control. Nevertheless, with vaccination picking up pace, there will be buying opportunities for stocks benefiting from reopening of economy if we look beyond the current Covid situation. On the longer term, we remain positive on the prospects of the market, thanks to anticipation of eventual global economic recovery. We believe the key structural investment themes that we like, such as deglobalisation, digitalisation and clean energy, remain intact and will continue to anchor the basis of our investment decisions. In the current investment climate, we believe stocks selection will be key to investment performance. Fixed Income Even as massive fiscal stimulus and steady vaccine rollout progress buoyed prospects for global economic growth, many countries are still struggling with the spread of the contagious Delta variant of COVID-19. On local shores, one month of nationwide Movement Control Order (MCO) stopped the pandemic from worsening but failed to bring infection down to intended levels. This culminated in an extension of MCO period nationwide and the implementation of Enhanced Movement Control Order (an even stricter form of MCO) in a large swath of the Klang Valley, which increases downside risks to Malaysia’s economic recovery. As a result, risk sentiment remains weak in Malaysia’s financial market. At this juncture, we are still not expecting BNM to cut OPR although downside risks to economic growth strongly underpin the ‘lower for longer’ interest rate theme which should keep short-term yields low. Yield curve is expected to remain steep as long-term yield is pressured upwards by unfavourable supply-demand dynamics and inflation expectation. Over the longer term, we anticipate MGS yields to continue its upward trajectory due to rate normalization as Malaysia gradually overcomes its Covid challenges. In the meantime, we anticipate rangebound MGS yields to continue providing income return and cushion from volatility for investors and market participants.
89
July 2021 Factsheet Manulife PRS-Growth Fund The above information has not been reviewed by the SC and is subject to the relevant warning, disclaimer, qualification or terms and conditions stated herein. Investors are advised to read and understand the contents of the Manulife PRS NESTEGG Series Disclosure Document dated 29 November 2019 and its First Supplemental Disclosure Document dated 10 February 2021 and all the respective Product Highlights Sheet(s) (collectively, the “Offering Documents”), obtainable at our offices or website, before investing. The Offering Documents have been registered with the Securities Commission Malaysia (SC), however the registration with the SC does not amount to nor indicate that the SC has recommended or endorsed the product. Where a unit split/distribution is declared, investors are advised that following the issue of additional units/distribution, the NAV per unit will be reduced from the pre-unit split NAV/cum-distribution NAV to post-unit split NAV/ex-distribution NAV; and where a unit split is declared, the value of your investment in the Fund’s denominated currency will remained unchanged after the distribution of the additional units. Past performances are not an indication of future performances. There are risks involved with investing in unit trust funds; wholesale funds and/or Private Retirement Schemes. Some of these risks associated with investments in unit trust funds; wholesale funds and/or Private Retirement Schemes are interest rate fluctuation risk, foreign exchange or currency risk, country risk, political risk, credit risk, non-compliance risk, counterparty risk, target fund manager risk, liquidity risk and interest rate risk. For further details on the risk profile of all the funds, please refer to the Risk Factors section in the Offering Documents. The price of units and income distribution may go down as well as up. Investors should compare and consider the fees, charges and costs involved. Investors are advised to conduct own risk assessment and consult the professional advisers if in doubt on the action to be taken.

90
July 2021 Factsheet Manulife PRS-Moderate Fund
^ Please note that this is neither a capital guaranteed nor a capital protected. Therefore, a member's capital is neither guaranteed nor protected. ##Income declared will be reinvested in the form of additional Units issued to Members. 1 No annual fee will be charged during the 1st year of the opening of a private pension account; there will also be no annual fee payable if no contributions are made during a calendar year.
Fund type/category Core (Moderate) Fund objective The Fund aims to facilitate accumulation of retirement savings^ through a combination of income## and capital growth over the long term. Investment Strategy To achieve the objective of the Fund, the Provider will at all times invest a minimum of 40% up to a maximum of 60% of the Fund’s NAV in equities and/or equity-related securities. That part of the Fund’s NAV not invested in equities and/or equity-related securities will be invested in fixed income instruments. Fund manager Manulife Investment Management (M) Berhad 200801033087 (834424-U) Trustee HSBC (Malaysia) Trustee Berhad 193701000084 (1281-T) Fund information (as at 30 Jun 2021) NAV/unit (Class A) RM 0.5635 NAV/unit (Class C) RM 0.5986 Fund size RM 12.99 mil Units in circulation 22.88 mil Fund launch date Class A & B: 19 Nov 2012
Class C: 28 Apr 2016 Fund inception date 20 Nov 2012 Financial year 31 Aug Currency RM Management fee Class A: 1.50% p.a. of the
NAV Class B: 1.25% p.a. of the
NAV Class C: 1.25% p.a. of the
NAV Trustee fee Class A, B & C: 0.04% p.a. of
the NAV Sales charge Class A & B: Nil
Class C: Up to 3.00% of the NAV per unit
Redemption charge Class A: 3.00% of NAV per unit for withdrawal in the 2nd year; 2.00% of NAV per unit
for withdrawal in the 3rd year; 1.00% of NAV per unit for
withdrawal in the 4th year; No Redemption Charge from the
5th year onwards. Class B & C: Nil
Distribution frequency Annually, if any, and will be automatically reinvested and distributed as additional units
of the Fund. Benchmark 50% FBM KLCI Index + 50%
Maybank 12-month fixed deposit rate
Fees by Private Pension Administrator (PPA) Account opening fee RM10.00 (one-off) Annual fee1 RM8.00 p.a. Pre-retirement withdrawal fee
RM25.00 for each withdrawal Transfer fee RM25.00 for each transfer to
another PRS provider Administration fee 0.04% p.a. of the NAV
Fund review and strategy Since inception performance as at 30 June 2021*
——— Fund Class A ——— Benchmark in RM
Strategy of staying balanced between equity and fixed income remains as part of products differentiation.
Total return over the following periods ended 30 June 2021*
1 month
6 month YTD 1 year 3 year 5 year Since
inception Fund Class A (%) 0.18 2.25 2.25 18.47 18.99 21.37 37.27 Benchmark in RM (%) -1.53 -2.47 -2.47 2.19 -0.45 4.03 11.51 Fund Class C (%) 0.20 2.38 2.38 18.78 20.73 25.08 26.74 Benchmark in RM (%) -1.53 -2.47 -2.47 2.19 -0.45 4.03 3.69
Calendar year returns* 2016 2017 2018 2019 2020
Fund Class A (%) -0.23 7.74 -9.12 5.51 15.89 Benchmark in RM (%) 0.13 6.27 -1.23 -1.47 2.69 Fund Class C (%) 0.85 8.55 -8.43 6.28 16.18 Benchmark in RM (%) 0.10 6.27 -1.23 -1.47 2.69
* Source: Lipper; Past performance is not necessarily indicative of future performance. The performance is calculated on NAV-to-NAV basis.
-5%
0%
5%
10%
15%
20%
25%
30%
35%
40%
11/2012 08/2013 04/2014 01/2015 10/2015 06/2016 03/2017 11/2017 08/2018 05/2019 01/2020 10/2020 06/2021
Top 5 holdings No. Security name % NAV
1 Manulife Investment Asia-Pacific Ex-Japan Fund 17.0
2 Manulife Investment Al-Mamun 9.8 3 Southern Power Generation
Sdn Bhd 5.02 10/28/27 7.0
4 Fortune Premiere Sdn Bhd 5.05 10/31/25 6.8
5 Cahya Mata Sarawak Bhd 4.8 05/05/22 6.3
Highest & lowest NAV 2018 2019 2020
High 0.5110 0.4864 0.5571 Low 0.4556 0.4564 0.4051
Distribution by financial year 2019 2020 2021
Distribution (Sen) - - 1.03 Distribution Yield (%) - - 1.9
Asset/sector allocation No. Asset/sector name % NAV
1 Equities 50.1 2 Fixed Income 39.7 3 Money Market 9.8 4 Cash & Cash Equivalents 0.4
Geographical allocation No. Geographical name % NAV
1 Malaysia 73.6 2 Asian Pacific Region ex Japan 20.0 3 Asian Pacific Region 6.0 4 Cash & Cash Equivalents 0.4
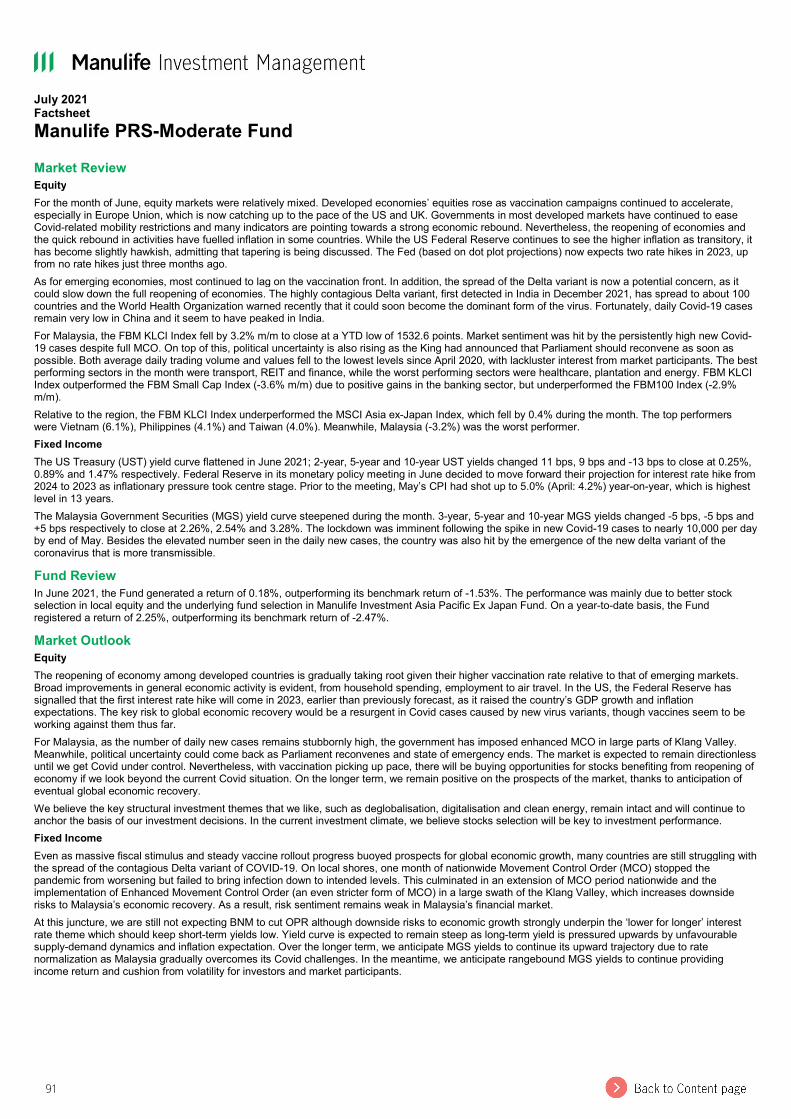
91
July 2021 Factsheet Manulife PRS-Moderate Fund Market Review Equity For the month of June, equity markets were relatively mixed. Developed economies’ equities rose as vaccination campaigns continued to accelerate, especially in Europe Union, which is now catching up to the pace of the US and UK. Governments in most developed markets have continued to ease Covid-related mobility restrictions and many indicators are pointing towards a strong economic rebound. Nevertheless, the reopening of economies and the quick rebound in activities have fuelled inflation in some countries. While the US Federal Reserve continues to see the higher inflation as transitory, it has become slightly hawkish, admitting that tapering is being discussed. The Fed (based on dot plot projections) now expects two rate hikes in 2023, up from no rate hikes just three months ago. As for emerging economies, most continued to lag on the vaccination front. In addition, the spread of the Delta variant is now a potential concern, as it could slow down the full reopening of economies. The highly contagious Delta variant, first detected in India in December 2021, has spread to about 100 countries and the World Health Organization warned recently that it could soon become the dominant form of the virus. Fortunately, daily Covid-19 cases remain very low in China and it seem to have peaked in India. For Malaysia, the FBM KLCI Index fell by 3.2% m/m to close at a YTD low of 1532.6 points. Market sentiment was hit by the persistently high new Covid-19 cases despite full MCO. On top of this, political uncertainty is also rising as the King had announced that Parliament should reconvene as soon as possible. Both average daily trading volume and values fell to the lowest levels since April 2020, with lackluster interest from market participants. The best performing sectors in the month were transport, REIT and finance, while the worst performing sectors were healthcare, plantation and energy. FBM KLCI Index outperformed the FBM Small Cap Index (-3.6% m/m) due to positive gains in the banking sector, but underperformed the FBM100 Index (-2.9% m/m). Relative to the region, the FBM KLCI Index underperformed the MSCI Asia ex-Japan Index, which fell by 0.4% during the month. The top performers were Vietnam (6.1%), Philippines (4.1%) and Taiwan (4.0%). Meanwhile, Malaysia (-3.2%) was the worst performer. Fixed Income The US Treasury (UST) yield curve flattened in June 2021; 2-year, 5-year and 10-year UST yields changed 11 bps, 9 bps and -13 bps to close at 0.25%, 0.89% and 1.47% respectively. Federal Reserve in its monetary policy meeting in June decided to move forward their projection for interest rate hike from 2024 to 2023 as inflationary pressure took centre stage. Prior to the meeting, May’s CPI had shot up to 5.0% (April: 4.2%) year-on-year, which is highest level in 13 years. The Malaysia Government Securities (MGS) yield curve steepened during the month. 3-year, 5-year and 10-year MGS yields changed -5 bps, -5 bps and +5 bps respectively to close at 2.26%, 2.54% and 3.28%. The lockdown was imminent following the spike in new Covid-19 cases to nearly 10,000 per day by end of May. Besides the elevated number seen in the daily new cases, the country was also hit by the emergence of the new delta variant of the coronavirus that is more transmissible. Fund Review In June 2021, the Fund generated a return of 0.18%, outperforming its benchmark return of -1.53%. The performance was mainly due to better stock selection in local equity and the underlying fund selection in Manulife Investment Asia Pacific Ex Japan Fund. On a year-to-date basis, the Fund registered a return of 2.25%, outperforming its benchmark return of -2.47%. Market Outlook Equity The reopening of economy among developed countries is gradually taking root given their higher vaccination rate relative to that of emerging markets. Broad improvements in general economic activity is evident, from household spending, employment to air travel. In the US, the Federal Reserve has signalled that the first interest rate hike will come in 2023, earlier than previously forecast, as it raised the country’s GDP growth and inflation expectations. The key risk to global economic recovery would be a resurgent in Covid cases caused by new virus variants, though vaccines seem to be working against them thus far. For Malaysia, as the number of daily new cases remains stubbornly high, the government has imposed enhanced MCO in large parts of Klang Valley. Meanwhile, political uncertainty could come back as Parliament reconvenes and state of emergency ends. The market is expected to remain directionless until we get Covid under control. Nevertheless, with vaccination picking up pace, there will be buying opportunities for stocks benefiting from reopening of economy if we look beyond the current Covid situation. On the longer term, we remain positive on the prospects of the market, thanks to anticipation of eventual global economic recovery. We believe the key structural investment themes that we like, such as deglobalisation, digitalisation and clean energy, remain intact and will continue to anchor the basis of our investment decisions. In the current investment climate, we believe stocks selection will be key to investment performance. Fixed Income Even as massive fiscal stimulus and steady vaccine rollout progress buoyed prospects for global economic growth, many countries are still struggling with the spread of the contagious Delta variant of COVID-19. On local shores, one month of nationwide Movement Control Order (MCO) stopped the pandemic from worsening but failed to bring infection down to intended levels. This culminated in an extension of MCO period nationwide and the implementation of Enhanced Movement Control Order (an even stricter form of MCO) in a large swath of the Klang Valley, which increases downside risks to Malaysia’s economic recovery. As a result, risk sentiment remains weak in Malaysia’s financial market. At this juncture, we are still not expecting BNM to cut OPR although downside risks to economic growth strongly underpin the ‘lower for longer’ interest rate theme which should keep short-term yields low. Yield curve is expected to remain steep as long-term yield is pressured upwards by unfavourable supply-demand dynamics and inflation expectation. Over the longer term, we anticipate MGS yields to continue its upward trajectory due to rate normalization as Malaysia gradually overcomes its Covid challenges. In the meantime, we anticipate rangebound MGS yields to continue providing income return and cushion from volatility for investors and market participants.

92
July 2021 Factsheet Manulife PRS-Moderate Fund The above information has not been reviewed by the SC and is subject to the relevant warning, disclaimer, qualification or terms and conditions stated herein. Investors are advised to read and understand the contents of the Manulife PRS NESTEGG Series Disclosure Document dated 29 November 2019 and its First Supplemental Disclosure Document dated 10 February 2021 and all the respective Product Highlights Sheet(s) (collectively, the “Offering Documents”), obtainable at our offices or website, before investing. The Offering Documents have been registered with the Securities Commission Malaysia (SC), however the registration with the SC does not amount to nor indicate that the SC has recommended or endorsed the product. Where a unit split/distribution is declared, investors are advised that following the issue of additional units/distribution, the NAV per unit will be reduced from the pre-unit split NAV/cum-distribution NAV to post-unit split NAV/ex-distribution NAV; and where a unit split is declared, the value of your investment in the Fund’s denominated currency will remained unchanged after the distribution of the additional units. Past performances are not an indication of future performances. There are risks involved with investing in unit trust funds; wholesale funds and/or Private Retirement Schemes. Some of these risks associated with investments in unit trust funds; wholesale funds and/or Private Retirement Schemes are interest rate fluctuation risk, foreign exchange or currency risk, country risk, political risk, credit risk, non-compliance risk, counterparty risk, target fund manager risk, liquidity risk and interest rate risk. For further details on the risk profile of all the funds, please refer to the Risk Factors section in the Offering Documents. The price of units and income distribution may go down as well as up. Investors should compare and consider the fees, charges and costs involved. Investors are advised to conduct own risk assessment and consult the professional advisers if in doubt on the action to be taken.
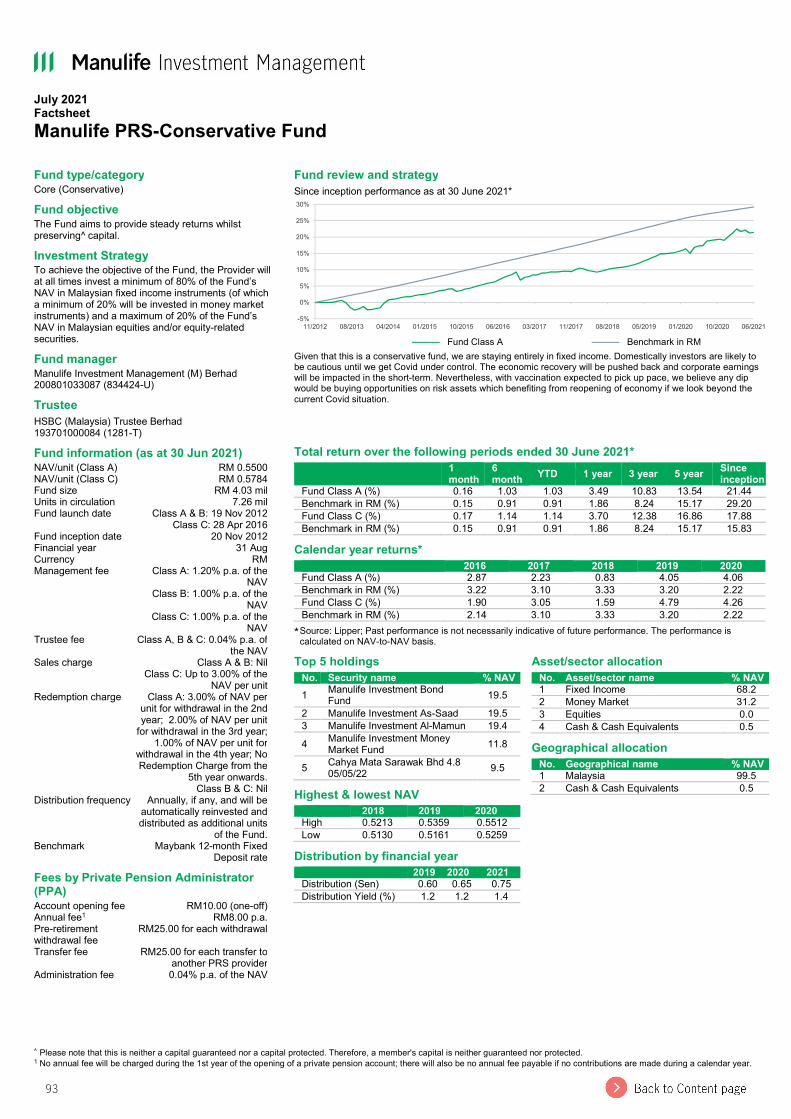
93
July 2021 Factsheet Manulife PRS-Conservative Fund
^ Please note that this is neither a capital guaranteed nor a capital protected. Therefore, a member's capital is neither guaranteed nor protected. 1 No annual fee will be charged during the 1st year of the opening of a private pension account; there will also be no annual fee payable if no contributions are made during a calendar year.
Fund type/category Core (Conservative) Fund objective The Fund aims to provide steady returns whilst preserving^ capital. Investment Strategy To achieve the objective of the Fund, the Provider will at all times invest a minimum of 80% of the Fund’s NAV in Malaysian fixed income instruments (of which a minimum of 20% will be invested in money market instruments) and a maximum of 20% of the Fund’s NAV in Malaysian equities and/or equity-related securities. Fund manager Manulife Investment Management (M) Berhad 200801033087 (834424-U) Trustee HSBC (Malaysia) Trustee Berhad 193701000084 (1281-T) Fund information (as at 30 Jun 2021) NAV/unit (Class A) RM 0.5500 NAV/unit (Class C) RM 0.5784 Fund size RM 4.03 mil Units in circulation 7.26 mil Fund launch date Class A & B: 19 Nov 2012
Class C: 28 Apr 2016 Fund inception date 20 Nov 2012 Financial year 31 Aug Currency RM Management fee Class A: 1.20% p.a. of the
NAV Class B: 1.00% p.a. of the
NAV Class C: 1.00% p.a. of the
NAV Trustee fee Class A, B & C: 0.04% p.a. of
the NAV Sales charge Class A & B: Nil
Class C: Up to 3.00% of the NAV per unit
Redemption charge Class A: 3.00% of NAV per unit for withdrawal in the 2nd year; 2.00% of NAV per unit
for withdrawal in the 3rd year; 1.00% of NAV per unit for
withdrawal in the 4th year; No Redemption Charge from the
5th year onwards. Class B & C: Nil
Distribution frequency Annually, if any, and will be automatically reinvested and distributed as additional units
of the Fund. Benchmark Maybank 12-month Fixed
Deposit rate Fees by Private Pension Administrator (PPA) Account opening fee RM10.00 (one-off) Annual fee1 RM8.00 p.a. Pre-retirement withdrawal fee
RM25.00 for each withdrawal Transfer fee RM25.00 for each transfer to
another PRS provider Administration fee 0.04% p.a. of the NAV
Fund review and strategy Since inception performance as at 30 June 2021*
——— Fund Class A ——— Benchmark in RM
Given that this is a conservative fund, we are staying entirely in fixed income. Domestically investors are likely to be cautious until we get Covid under control. The economic recovery will be pushed back and corporate earnings will be impacted in the short-term. Nevertheless, with vaccination expected to pick up pace, we believe any dip would be buying opportunities on risk assets which benefiting from reopening of economy if we look beyond the current Covid situation.
Total return over the following periods ended 30 June 2021*
1 month
6 month YTD 1 year 3 year 5 year Since
inception Fund Class A (%) 0.16 1.03 1.03 3.49 10.83 13.54 21.44 Benchmark in RM (%) 0.15 0.91 0.91 1.86 8.24 15.17 29.20 Fund Class C (%) 0.17 1.14 1.14 3.70 12.38 16.86 17.88 Benchmark in RM (%) 0.15 0.91 0.91 1.86 8.24 15.17 15.83
Calendar year returns* 2016 2017 2018 2019 2020
Fund Class A (%) 2.87 2.23 0.83 4.05 4.06 Benchmark in RM (%) 3.22 3.10 3.33 3.20 2.22 Fund Class C (%) 1.90 3.05 1.59 4.79 4.26 Benchmark in RM (%) 2.14 3.10 3.33 3.20 2.22
* Source: Lipper; Past performance is not necessarily indicative of future performance. The performance is calculated on NAV-to-NAV basis.
-5%
0%
5%
10%
15%
20%
25%
30%
11/2012 08/2013 04/2014 01/2015 10/2015 06/2016 03/2017 11/2017 08/2018 05/2019 01/2020 10/2020 06/2021
Top 5 holdings No. Security name % NAV
1 Manulife Investment Bond Fund 19.5
2 Manulife Investment As-Saad 19.5 3 Manulife Investment Al-Mamun 19.4 4 Manulife Investment Money
Market Fund 11.8
5 Cahya Mata Sarawak Bhd 4.8 05/05/22 9.5
Highest & lowest NAV 2018 2019 2020
High 0.5213 0.5359 0.5512 Low 0.5130 0.5161 0.5259
Distribution by financial year 2019 2020 2021
Distribution (Sen) 0.60 0.65 0.75 Distribution Yield (%) 1.2 1.2 1.4
Asset/sector allocation No. Asset/sector name % NAV
1 Fixed Income 68.2 2 Money Market 31.2 3 Equities 0.0 4 Cash & Cash Equivalents 0.5
Geographical allocation No. Geographical name % NAV
1 Malaysia 99.5 2 Cash & Cash Equivalents 0.5

94
July 2021 Factsheet Manulife PRS-Conservative Fund Market Review Equity For the month of June, equity markets were relatively mixed. Developed economies’ equities rose as vaccination campaigns continued to accelerate, especially in Europe Union, which is now catching up to the pace of the US and UK. Governments in most developed markets have continued to ease Covid-related mobility restrictions and many indicators are pointing towards a strong economic rebound. Nevertheless, the reopening of economies and the quick rebound in activities have fuelled inflation in some countries. While the US Federal Reserve continues to see the higher inflation as transitory, it has become slightly hawkish, admitting that tapering is being discussed. The Fed (based on dot plot projections) now expects two rate hikes in 2023, up from no rate hikes just three months ago. As for emerging economies, most continued to lag on the vaccination front. In addition, the spread of the Delta variant is now a potential concern, as it could slow down the full reopening of economies. The highly contagious Delta variant, first detected in India in December 2021, has spread to about 100 countries and the World Health Organization warned recently that it could soon become the dominant form of the virus. Fortunately, daily Covid-19 cases remain very low in China and it seem to have peaked in India. For Malaysia, the FBM KLCI Index fell by 3.2% m/m to close at a YTD low of 1532.6 points. Market sentiment was hit by the persistently high new Covid-19 cases despite full MCO. On top of this, political uncertainty is also rising as the King had announced that Parliament should reconvene as soon as possible. Both average daily trading volume and values fell to the lowest levels since April 2020, with lackluster interest from market participants. The best performing sectors in the month were transport, REIT and finance, while the worst performing sectors were healthcare, plantation and energy. FBM KLCI Index outperformed the FBM Small Cap Index (-3.6% m/m) due to positive gains in the banking sector, but underperformed the FBM100 Index (-2.9% m/m). Relative to the region, the FBM KLCI Index underperformed the MSCI Asia ex-Japan Index, which fell by 0.4% during the month. The top performers were Vietnam (6.1%), Philippines (4.1%) and Taiwan (4.0%). Meanwhile, Malaysia (-3.2%) was the worst performer. Fixed Income The US Treasury (UST) yield curve flattened in June 2021; 2-year, 5-year and 10-year UST yields changed 11 bps, 9 bps and -13 bps to close at 0.25%, 0.89% and 1.47% respectively. Federal Reserve in its monetary policy meeting in June decided to move forward their projection for interest rate hike from 2024 to 2023 as inflationary pressure took centre stage. Prior to the meeting, May’s CPI had shot up to 5.0% (April: 4.2%) year-on-year, which is highest level in 13 years. The Malaysia Government Securities (MGS) yield curve steepened during the month. 3-year, 5-year and 10-year MGS yields changed -5 bps, -5 bps and +5 bps respectively to close at 2.26%, 2.54% and 3.28%. The lockdown was imminent following the spike in new Covid-19 cases to nearly 10,000 per day by end of May. Besides the elevated number seen in the daily new cases, the country was also hit by the emergence of the new delta variant of the coronavirus that is more transmissible. Fund Review In the month of June 2021, the fund outperformed its benchmark, mainly due to running yield of underlying fixed income. Market Outlook Equity The reopening of economy among developed countries is gradually taking root given their higher vaccination rate relative to that of emerging markets. Broad improvements in general economic activity is evident, from household spending, employment to air travel. In the US, the Federal Reserve has signalled that the first interest rate hike will come in 2023, earlier than previously forecast, as it raised the country’s GDP growth and inflation expectations. The key risk to global economic recovery would be a resurgent in Covid cases caused by new virus variants, though vaccines seem to be working against them thus far. For Malaysia, as the number of daily new cases remains stubbornly high, the government has imposed enhanced MCO in large parts of Klang Valley. Meanwhile, political uncertainty could come back as Parliament reconvenes and state of emergency ends. The market is expected to remain directionless until we get Covid under control. Nevertheless, with vaccination picking up pace, there will be buying opportunities for stocks benefiting from reopening of economy if we look beyond the current Covid situation. On the longer term, we remain positive on the prospects of the market, thanks to anticipation of eventual global economic recovery. We believe the key structural investment themes that we like, such as deglobalisation, digitalisation and clean energy, remain intact and will continue to anchor the basis of our investment decisions. In the current investment climate, we believe stocks selection will be key to investment performance. Fixed Income Even as massive fiscal stimulus and steady vaccine rollout progress buoyed prospects for global economic growth, many countries are still struggling with the spread of the contagious Delta variant of COVID-19. On local shores, one month of nationwide Movement Control Order (MCO) stopped the pandemic from worsening but failed to bring infection down to intended levels. This culminated in an extension of MCO period nationwide and the implementation of Enhanced Movement Control Order (an even stricter form of MCO) in a large swath of the Klang Valley, which increases downside risks to Malaysia’s economic recovery. As a result, risk sentiment remains weak in Malaysia’s financial market. At this juncture, we are still not expecting BNM to cut OPR although downside risks to economic growth strongly underpin the ‘lower for longer’ interest rate theme which should keep short-term yields low. Yield curve is expected to remain steep as long-term yield is pressured upwards by unfavourable supply-demand dynamics and inflation expectation. Over the longer term, we anticipate MGS yields to continue its upward trajectory due to rate normalization as Malaysia gradually overcomes its Covid challenges. In the meantime, we anticipate rangebound MGS yields to continue providing income return and cushion from volatility for investors and market participants.

95
July 2021 Factsheet Manulife PRS-Conservative Fund The above information has not been reviewed by the SC and is subject to the relevant warning, disclaimer, qualification or terms and conditions stated herein. Investors are advised to read and understand the contents of the Manulife PRS NESTEGG Series Disclosure Document dated 29 November 2019 and its First Supplemental Disclosure Document dated 10 February 2021 and all the respective Product Highlights Sheet(s) (collectively, the “Offering Documents”), obtainable at our offices or website, before investing. The Offering Documents have been registered with the Securities Commission Malaysia (SC), however the registration with the SC does not amount to nor indicate that the SC has recommended or endorsed the product. Where a unit split/distribution is declared, investors are advised that following the issue of additional units/distribution, the NAV per unit will be reduced from the pre-unit split NAV/cum-distribution NAV to post-unit split NAV/ex-distribution NAV; and where a unit split is declared, the value of your investment in the Fund’s denominated currency will remained unchanged after the distribution of the additional units. Past performances are not an indication of future performances. There are risks involved with investing in unit trust funds; wholesale funds and/or Private Retirement Schemes. Some of these risks associated with investments in unit trust funds; wholesale funds and/or Private Retirement Schemes are interest rate fluctuation risk, foreign exchange or currency risk, country risk, political risk, credit risk, non-compliance risk, counterparty risk, target fund manager risk, liquidity risk and interest rate risk. For further details on the risk profile of all the funds, please refer to the Risk Factors section in the Offering Documents. The price of units and income distribution may go down as well as up. Investors should compare and consider the fees, charges and costs involved. Investors are advised to conduct own risk assessment and consult the professional advisers if in doubt on the action to be taken.
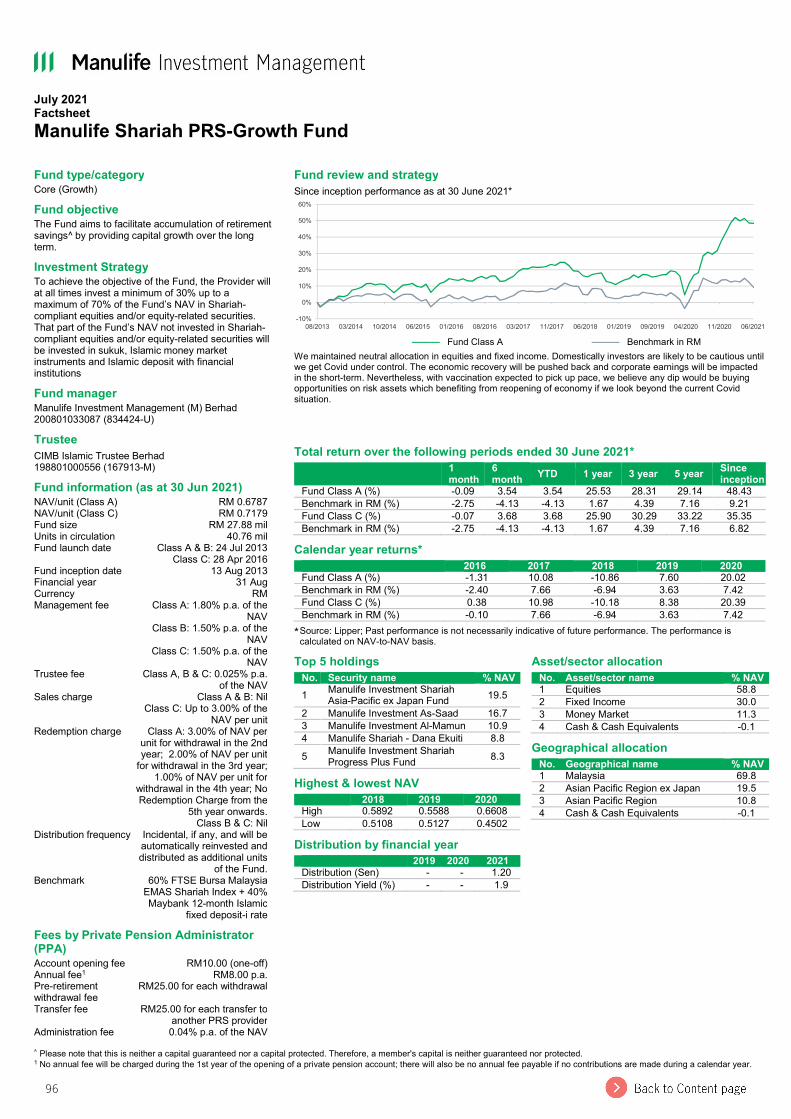
96
July 2021 Factsheet Manulife Shariah PRS-Growth Fund
^ Please note that this is neither a capital guaranteed nor a capital protected. Therefore, a member's capital is neither guaranteed nor protected. 1 No annual fee will be charged during the 1st year of the opening of a private pension account; there will also be no annual fee payable if no contributions are made during a calendar year.
Fund type/category Core (Growth) Fund objective The Fund aims to facilitate accumulation of retirement savings^ by providing capital growth over the long term. Investment Strategy To achieve the objective of the Fund, the Provider will at all times invest a minimum of 30% up to a maximum of 70% of the Fund’s NAV in Shariah-compliant equities and/or equity-related securities. That part of the Fund’s NAV not invested in Shariah-compliant equities and/or equity-related securities will be invested in sukuk, Islamic money market instruments and Islamic deposit with financial institutions Fund manager Manulife Investment Management (M) Berhad 200801033087 (834424-U) Trustee CIMB Islamic Trustee Berhad 198801000556 (167913-M) Fund information (as at 30 Jun 2021) NAV/unit (Class A) RM 0.6787 NAV/unit (Class C) RM 0.7179 Fund size RM 27.88 mil Units in circulation 40.76 mil Fund launch date Class A & B: 24 Jul 2013
Class C: 28 Apr 2016 Fund inception date 13 Aug 2013 Financial year 31 Aug Currency RM Management fee Class A: 1.80% p.a. of the
NAV Class B: 1.50% p.a. of the
NAV Class C: 1.50% p.a. of the
NAV Trustee fee Class A, B & C: 0.025% p.a.
of the NAV Sales charge Class A & B: Nil
Class C: Up to 3.00% of the NAV per unit
Redemption charge Class A: 3.00% of NAV per unit for withdrawal in the 2nd year; 2.00% of NAV per unit
for withdrawal in the 3rd year; 1.00% of NAV per unit for
withdrawal in the 4th year; No Redemption Charge from the
5th year onwards. Class B & C: Nil
Distribution frequency Incidental, if any, and will be automatically reinvested and distributed as additional units
of the Fund. Benchmark 60% FTSE Bursa Malaysia
EMAS Shariah Index + 40% Maybank 12-month Islamic
fixed deposit-i rate Fees by Private Pension Administrator (PPA) Account opening fee RM10.00 (one-off) Annual fee1 RM8.00 p.a. Pre-retirement withdrawal fee
RM25.00 for each withdrawal Transfer fee RM25.00 for each transfer to
another PRS provider Administration fee 0.04% p.a. of the NAV
Fund review and strategy Since inception performance as at 30 June 2021*
——— Fund Class A ——— Benchmark in RM
We maintained neutral allocation in equities and fixed income. Domestically investors are likely to be cautious until we get Covid under control. The economic recovery will be pushed back and corporate earnings will be impacted in the short-term. Nevertheless, with vaccination expected to pick up pace, we believe any dip would be buying opportunities on risk assets which benefiting from reopening of economy if we look beyond the current Covid situation.
Total return over the following periods ended 30 June 2021*
1 month
6 month YTD 1 year 3 year 5 year Since
inception Fund Class A (%) -0.09 3.54 3.54 25.53 28.31 29.14 48.43 Benchmark in RM (%) -2.75 -4.13 -4.13 1.67 4.39 7.16 9.21 Fund Class C (%) -0.07 3.68 3.68 25.90 30.29 33.22 35.35 Benchmark in RM (%) -2.75 -4.13 -4.13 1.67 4.39 7.16 6.82
Calendar year returns* 2016 2017 2018 2019 2020
Fund Class A (%) -1.31 10.08 -10.86 7.60 20.02 Benchmark in RM (%) -2.40 7.66 -6.94 3.63 7.42 Fund Class C (%) 0.38 10.98 -10.18 8.38 20.39 Benchmark in RM (%) -0.10 7.66 -6.94 3.63 7.42
* Source: Lipper; Past performance is not necessarily indicative of future performance. The performance is calculated on NAV-to-NAV basis.
-10%
0%
10%
20%
30%
40%
50%
60%
08/2013 03/2014 10/2014 06/2015 01/2016 08/2016 03/2017 11/2017 06/2018 01/2019 09/2019 04/2020 11/2020 06/2021
Top 5 holdings No. Security name % NAV
1 Manulife Investment Shariah Asia-Pacific ex Japan Fund 19.5
2 Manulife Investment As-Saad 16.7 3 Manulife Investment Al-Mamun 10.9 4 Manulife Shariah - Dana Ekuiti 8.8 5 Manulife Investment Shariah
Progress Plus Fund 8.3 Highest & lowest NAV 2018 2019 2020
High 0.5892 0.5588 0.6608 Low 0.5108 0.5127 0.4502
Distribution by financial year 2019 2020 2021
Distribution (Sen) - - 1.20 Distribution Yield (%) - - 1.9
Asset/sector allocation No. Asset/sector name % NAV
1 Equities 58.8 2 Fixed Income 30.0 3 Money Market 11.3 4 Cash & Cash Equivalents -0.1
Geographical allocation No. Geographical name % NAV
1 Malaysia 69.8 2 Asian Pacific Region ex Japan 19.5 3 Asian Pacific Region 10.8 4 Cash & Cash Equivalents -0.1

97
July 2021 Factsheet Manulife Shariah PRS-Growth Fund Market Review Equity For the month of June, equity markets were relatively mixed. Developed economies’ equities rose as vaccination campaigns continued to accelerate, especially in Europe Union, which is now catching up to the pace of the US and UK. Governments in most developed markets have continued to ease Covid-related mobility restrictions and many indicators are pointing towards a strong economic rebound. Nevertheless, the reopening of economies and the quick rebound in activities have fuelled inflation in some countries. While the US Federal Reserve continues to see the higher inflation as transitory, it has become slightly hawkish, admitting that tapering is being discussed. The Fed (based on dot plot projections) now expects two rate hikes in 2023, up from no rate hikes just three months ago. As for emerging economies, most continued to lag on the vaccination front. In addition, the spread of the Delta variant is now a potential concern, as it could slow down the full reopening of economies. The highly contagious Delta variant, first detected in India in December 2021, has spread to about 100 countries and the World Health Organization warned recently that it could soon become the dominant form of the virus. Fortunately, daily Covid-19 cases remain very low in China and it seem to have peaked in India. For Malaysia, the FBM KLCI Index fell by 3.2% m/m to close at a YTD low of 1532.6 points. Market sentiment was hit by the persistently high new Covid-19 cases despite full MCO. On top of this, political uncertainty is also rising as the King had announced that Parliament should reconvene as soon as possible. Both average daily trading volume and values fell to the lowest levels since April 2020, with lackluster interest from market participants. The best performing sectors in the month were transport, REIT and finance, while the worst performing sectors were healthcare, plantation and energy. FBM KLCI Index outperformed the FBM Small Cap Index (-3.6% m/m) due to positive gains in the banking sector, but underperformed the FBM100 Index (-2.9% m/m). Relative to the region, the FBM KLCI Index underperformed the MSCI Asia ex-Japan Index, which fell by 0.4% during the month. The top performers were Vietnam (6.1%), Philippines (4.1%) and Taiwan (4.0%). Meanwhile, Malaysia (-3.2%) was the worst performer. Fixed Income The US Treasury (UST) yield curve flattened in June 2021; 2-year, 5-year and 10-year UST yields changed 11 bps, 9 bps and -13 bps to close at 0.25%, 0.89% and 1.47% respectively. Federal Reserve in its monetary policy meeting in June decided to move forward their projection for interest rate hike from 2024 to 2023 as inflationary pressure took centre stage. Prior to the meeting, May’s CPI had shot up to 5.0% (April: 4.2%) year-on-year, which is highest level in 13 years. The Malaysia Government Securities (MGS) yield curve steepened during the month. 3-year, 5-year and 10-year MGS yields changed -5 bps, -5 bps and +5 bps respectively to close at 2.26%, 2.54% and 3.28%. The lockdown was imminent following the spike in new Covid-19 cases to nearly 10,000 per day by end of May. Besides the elevated number seen in the daily new cases, the country was also hit by the emergence of the new delta variant of the coronavirus that is more transmissible. Fund Review In June 2021, the Fund generated a return of -0.09%, outperforming its benchmark return of -2.75%. The performance was mainly due to better stock selection in local equity and the underlying fund selection in Manulife Investment Shariah Asia Pacific Fund. On a year-to-date basis, the Fund registered a return of 3.54%, outperforming its benchmark return of -4.13%. Market Outlook Equity The reopening of economy among developed countries is gradually taking root given their higher vaccination rate relative to that of emerging markets. Broad improvements in general economic activity is evident, from household spending, employment to air travel. In the US, the Federal Reserve has signalled that the first interest rate hike will come in 2023, earlier than previously forecast, as it raised the country’s GDP growth and inflation expectations. The key risk to global economic recovery would be a resurgent in Covid cases caused by new virus variants, though vaccines seem to be working against them thus far. For Malaysia, as the number of daily new cases remains stubbornly high, the government has imposed enhanced MCO in large parts of Klang Valley. Meanwhile, political uncertainty could come back as Parliament reconvenes and state of emergency ends. The market is expected to remain directionless until we get Covid under control. Nevertheless, with vaccination picking up pace, there will be buying opportunities for stocks benefiting from reopening of economy if we look beyond the current Covid situation. On the longer term, we remain positive on the prospects of the market, thanks to anticipation of eventual global economic recovery. We believe the key structural investment themes that we like, such as deglobalisation, digitalisation and clean energy, remain intact and will continue to anchor the basis of our investment decisions. In the current investment climate, we believe stocks selection will be key to investment performance. Fixed Income Even as massive fiscal stimulus and steady vaccine rollout progress buoyed prospects for global economic growth, many countries are still struggling with the spread of the contagious Delta variant of COVID-19. On local shores, one month of nationwide Movement Control Order (MCO) stopped the pandemic from worsening but failed to bring infection down to intended levels. This culminated in an extension of MCO period nationwide and the implementation of Enhanced Movement Control Order (an even stricter form of MCO) in a large swath of the Klang Valley, which increases downside risks to Malaysia’s economic recovery. As a result, risk sentiment remains weak in Malaysia’s financial market. At this juncture, we are still not expecting BNM to cut OPR although downside risks to economic growth strongly underpin the ‘lower for longer’ interest rate theme which should keep short-term yields low. Yield curve is expected to remain steep as long-term yield is pressured upwards by unfavourable supply-demand dynamics and inflation expectation. Over the longer term, we anticipate MGS yields to continue its upward trajectory due to rate normalization as Malaysia gradually overcomes its Covid challenges. In the meantime, we anticipate rangebound MGS yields to continue providing income return and cushion from volatility for investors and market participants.

98
July 2021 Factsheet Manulife Shariah PRS-Growth Fund The above information has not been reviewed by the SC and is subject to the relevant warning, disclaimer, qualification or terms and conditions stated herein. Investors are advised to read and understand the contents of the Manulife Shariah PRS NESTEGG Series Disclosure Document dated 29 November 2019 and its First Supplemental Disclosure Document dated 10 February 2021 and all the respective Product Highlights Sheet(s) (collectively, the “Offering Documents”), obtainable at our offices or website, before investing. The Offering Documents have been registered with the Securities Commission Malaysia (SC), however the registration with the SC does not amount to nor indicate that the SC has recommended or endorsed the product. Where a unit split/distribution is declared, investors are advised that following the issue of additional units/distribution, the NAV per unit will be reduced from the pre-unit split NAV/cum-distribution NAV to post-unit split NAV/ex-distribution NAV; and where a unit split is declared, the value of your investment in the Fund’s denominated currency will remained unchanged after the distribution of the additional units. Past performances are not an indication of future performances. There are risks involved with investing in unit trust funds; wholesale funds and/or Private Retirement Schemes. Some of these risks associated with investments in unit trust funds; wholesale funds and/or Private Retirement Schemes are interest rate fluctuation risk, foreign exchange or currency risk, country risk, political risk, credit risk, non-compliance risk, counterparty risk, target fund manager risk, liquidity risk and interest rate risk. For further details on the risk profile of all the funds, please refer to the Risk Factors section in the Offering Documents. The price of units and income distribution may go down as well as up. Investors should compare and consider the fees, charges and costs involved. Investors are advised to conduct own risk assessment and consult the professional advisers if in doubt on the action to be taken.
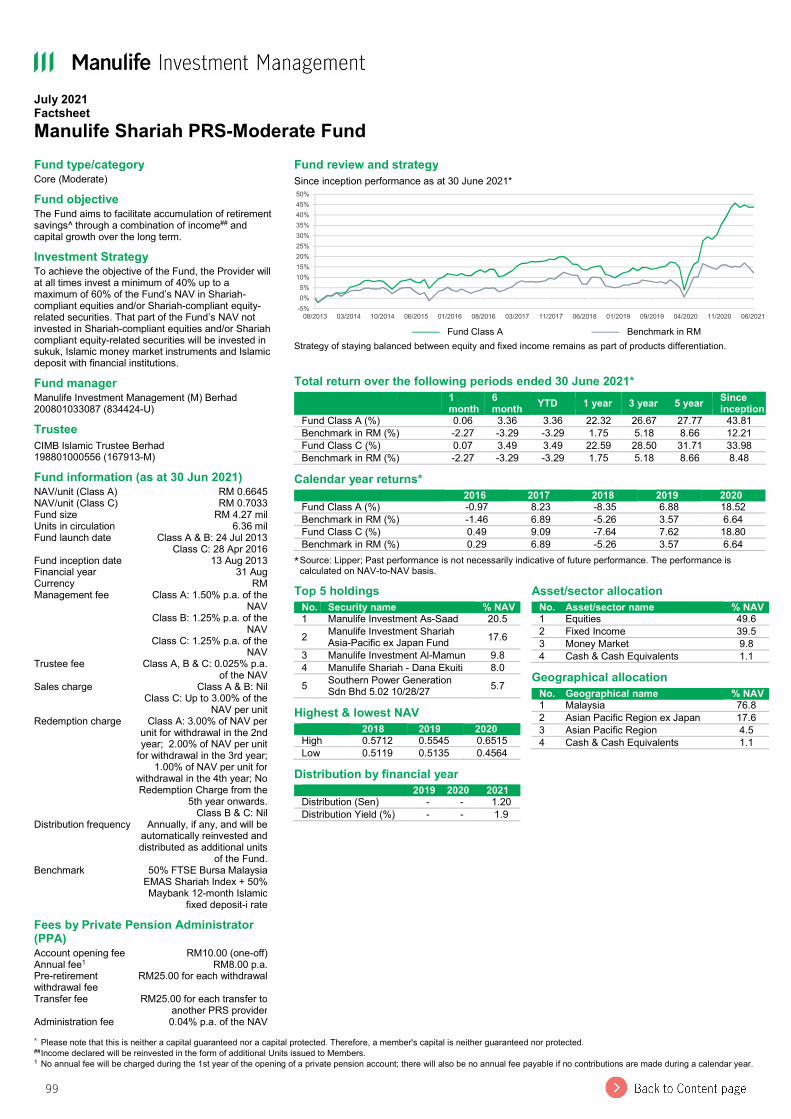
99
July 2021 Factsheet Manulife Shariah PRS-Moderate Fund
^ Please note that this is neither a capital guaranteed nor a capital protected. Therefore, a member's capital is neither guaranteed nor protected. ##Income declared will be reinvested in the form of additional Units issued to Members. 1 No annual fee will be charged during the 1st year of the opening of a private pension account; there will also be no annual fee payable if no contributions are made during a calendar year.
Fund type/category Core (Moderate) Fund objective The Fund aims to facilitate accumulation of retirement savings^ through a combination of income## and capital growth over the long term. Investment Strategy To achieve the objective of the Fund, the Provider will at all times invest a minimum of 40% up to a maximum of 60% of the Fund’s NAV in Shariah-compliant equities and/or Shariah-compliant equity-related securities. That part of the Fund’s NAV not invested in Shariah-compliant equities and/or Shariah compliant equity-related securities will be invested in sukuk, Islamic money market instruments and Islamic deposit with financial institutions. Fund manager Manulife Investment Management (M) Berhad 200801033087 (834424-U) Trustee CIMB Islamic Trustee Berhad 198801000556 (167913-M) Fund information (as at 30 Jun 2021) NAV/unit (Class A) RM 0.6645 NAV/unit (Class C) RM 0.7033 Fund size RM 4.27 mil Units in circulation 6.36 mil Fund launch date Class A & B: 24 Jul 2013
Class C: 28 Apr 2016 Fund inception date 13 Aug 2013 Financial year 31 Aug Currency RM Management fee Class A: 1.50% p.a. of the
NAV Class B: 1.25% p.a. of the
NAV Class C: 1.25% p.a. of the
NAV Trustee fee Class A, B & C: 0.025% p.a.
of the NAV Sales charge Class A & B: Nil
Class C: Up to 3.00% of the NAV per unit
Redemption charge Class A: 3.00% of NAV per unit for withdrawal in the 2nd year; 2.00% of NAV per unit
for withdrawal in the 3rd year; 1.00% of NAV per unit for
withdrawal in the 4th year; No Redemption Charge from the
5th year onwards. Class B & C: Nil
Distribution frequency Annually, if any, and will be automatically reinvested and distributed as additional units
of the Fund. Benchmark 50% FTSE Bursa Malaysia
EMAS Shariah Index + 50% Maybank 12-month Islamic
fixed deposit-i rate Fees by Private Pension Administrator (PPA) Account opening fee RM10.00 (one-off) Annual fee1 RM8.00 p.a. Pre-retirement withdrawal fee
RM25.00 for each withdrawal Transfer fee RM25.00 for each transfer to
another PRS provider Administration fee 0.04% p.a. of the NAV
Fund review and strategy Since inception performance as at 30 June 2021*
——— Fund Class A ——— Benchmark in RM
Strategy of staying balanced between equity and fixed income remains as part of products differentiation.
Total return over the following periods ended 30 June 2021*
1 month
6 month YTD 1 year 3 year 5 year Since
inception Fund Class A (%) 0.06 3.36 3.36 22.32 26.67 27.77 43.81 Benchmark in RM (%) -2.27 -3.29 -3.29 1.75 5.18 8.66 12.21 Fund Class C (%) 0.07 3.49 3.49 22.59 28.50 31.71 33.98 Benchmark in RM (%) -2.27 -3.29 -3.29 1.75 5.18 8.66 8.48
Calendar year returns* 2016 2017 2018 2019 2020
Fund Class A (%) -0.97 8.23 -8.35 6.88 18.52 Benchmark in RM (%) -1.46 6.89 -5.26 3.57 6.64 Fund Class C (%) 0.49 9.09 -7.64 7.62 18.80 Benchmark in RM (%) 0.29 6.89 -5.26 3.57 6.64
* Source: Lipper; Past performance is not necessarily indicative of future performance. The performance is calculated on NAV-to-NAV basis.
-5%0%5%
10%15%20%25%30%35%40%45%50%
08/2013 03/2014 10/2014 06/2015 01/2016 08/2016 03/2017 11/2017 06/2018 01/2019 09/2019 04/2020 11/2020 06/2021
Top 5 holdings No. Security name % NAV
1 Manulife Investment As-Saad 20.5 2 Manulife Investment Shariah
Asia-Pacific ex Japan Fund 17.6 3 Manulife Investment Al-Mamun 9.8 4 Manulife Shariah - Dana Ekuiti 8.0 5 Southern Power Generation
Sdn Bhd 5.02 10/28/27 5.7 Highest & lowest NAV 2018 2019 2020
High 0.5712 0.5545 0.6515 Low 0.5119 0.5135 0.4564
Distribution by financial year 2019 2020 2021
Distribution (Sen) - - 1.20 Distribution Yield (%) - - 1.9
Asset/sector allocation No. Asset/sector name % NAV
1 Equities 49.6 2 Fixed Income 39.5 3 Money Market 9.8 4 Cash & Cash Equivalents 1.1
Geographical allocation No. Geographical name % NAV
1 Malaysia 76.8 2 Asian Pacific Region ex Japan 17.6 3 Asian Pacific Region 4.5 4 Cash & Cash Equivalents 1.1
100
July 2021 Factsheet Manulife Shariah PRS-Moderate Fund Market Review Equity For the month of June, equity markets were relatively mixed. Developed economies’ equities rose as vaccination campaigns continued to accelerate, especially in Europe Union, which is now catching up to the pace of the US and UK. Governments in most developed markets have continued to ease Covid-related mobility restrictions and many indicators are pointing towards a strong economic rebound. Nevertheless, the reopening of economies and the quick rebound in activities have fuelled inflation in some countries. While the US Federal Reserve continues to see the higher inflation as transitory, it has become slightly hawkish, admitting that tapering is being discussed. The Fed (based on dot plot projections) now expects two rate hikes in 2023, up from no rate hikes just three months ago. As for emerging economies, most continued to lag on the vaccination front. In addition, the spread of the Delta variant is now a potential concern, as it could slow down the full reopening of economies. The highly contagious Delta variant, first detected in India in December 2021, has spread to about 100 countries and the World Health Organization warned recently that it could soon become the dominant form of the virus. Fortunately, daily Covid-19 cases remain very low in China and it seem to have peaked in India. For Malaysia, the FBM KLCI Index fell by 3.2% m/m to close at a YTD low of 1532.6 points. Market sentiment was hit by the persistently high new Covid-19 cases despite full MCO. On top of this, political uncertainty is also rising as the King had announced that Parliament should reconvene as soon as possible. Both average daily trading volume and values fell to the lowest levels since April 2020, with lackluster interest from market participants. The best performing sectors in the month were transport, REIT and finance, while the worst performing sectors were healthcare, plantation and energy. FBM KLCI Index outperformed the FBM Small Cap Index (-3.6% m/m) due to positive gains in the banking sector, but underperformed the FBM100 Index (-2.9% m/m). Relative to the region, the FBM KLCI Index underperformed the MSCI Asia ex-Japan Index, which fell by 0.4% during the month. The top performers were Vietnam (6.1%), Philippines (4.1%) and Taiwan (4.0%). Meanwhile, Malaysia (-3.2%) was the worst performer. Fixed Income The US Treasury (UST) yield curve flattened in June 2021; 2-year, 5-year and 10-year UST yields changed 11 bps, 9 bps and -13 bps to close at 0.25%, 0.89% and 1.47% respectively. Federal Reserve in its monetary policy meeting in June decided to move forward their projection for interest rate hike from 2024 to 2023 as inflationary pressure took centre stage. Prior to the meeting, May’s CPI had shot up to 5.0% (April: 4.2%) year-on-year, which is highest level in 13 years. The Malaysia Government Securities (MGS) yield curve steepened during the month. 3-year, 5-year and 10-year MGS yields changed -5 bps, -5 bps and +5 bps respectively to close at 2.26%, 2.54% and 3.28%. The lockdown was imminent following the spike in new Covid-19 cases to nearly 10,000 per day by end of May. Besides the elevated number seen in the daily new cases, the country was also hit by the emergence of the new delta variant of the coronavirus that is more transmissible. Fund Review In June 2021, the Fund generated a return of 0.06%, outperforming its benchmark return of -2.27%. The performance was mainly due to better stock selection in local equity and the underlying fund selection in Manulife Investment Shariah Asia Pacific Fund. On a year-to-date basis, the Fund registered a return of 3.36%, outperforming its benchmark return of -3.29%. Market Outlook Equity The reopening of economy among developed countries is gradually taking root given their higher vaccination rate relative to that of emerging markets. Broad improvements in general economic activity is evident, from household spending, employment to air travel. In the US, the Federal Reserve has signalled that the first interest rate hike will come in 2023, earlier than previously forecast, as it raised the country’s GDP growth and inflation expectations. The key risk to global economic recovery would be a resurgent in Covid cases caused by new virus variants, though vaccines seem to be working against them thus far. For Malaysia, as the number of daily new cases remains stubbornly high, the government has imposed enhanced MCO in large parts of Klang Valley. Meanwhile, political uncertainty could come back as Parliament reconvenes and state of emergency ends. The market is expected to remain directionless until we get Covid under control. Nevertheless, with vaccination picking up pace, there will be buying opportunities for stocks benefiting from reopening of economy if we look beyond the current Covid situation. On the longer term, we remain positive on the prospects of the market, thanks to anticipation of eventual global economic recovery. We believe the key structural investment themes that we like, such as deglobalisation, digitalisation and clean energy, remain intact and will continue to anchor the basis of our investment decisions. In the current investment climate, we believe stocks selection will be key to investment performance. Fixed Income Even as massive fiscal stimulus and steady vaccine rollout progress buoyed prospects for global economic growth, many countries are still struggling with the spread of the contagious Delta variant of COVID-19. On local shores, one month of nationwide Movement Control Order (MCO) stopped the pandemic from worsening but failed to bring infection down to intended levels. This culminated in an extension of MCO period nationwide and the implementation of Enhanced Movement Control Order (an even stricter form of MCO) in a large swath of the Klang Valley, which increases downside risks to Malaysia’s economic recovery. As a result, risk sentiment remains weak in Malaysia’s financial market. At this juncture, we are still not expecting BNM to cut OPR although downside risks to economic growth strongly underpin the ‘lower for longer’ interest rate theme which should keep short-term yields low. Yield curve is expected to remain steep as long-term yield is pressured upwards by unfavourable supply-demand dynamics and inflation expectation. Over the longer term, we anticipate MGS yields to continue its upward trajectory due to rate normalization as Malaysia gradually overcomes its Covid challenges. In the meantime, we anticipate rangebound MGS yields to continue providing income return and cushion from volatility for investors and market participants.

101
July 2021 Factsheet Manulife Shariah PRS-Moderate Fund The above information has not been reviewed by the SC and is subject to the relevant warning, disclaimer, qualification or terms and conditions stated herein. Investors are advised to read and understand the contents of the Manulife Shariah PRS NESTEGG Series Disclosure Document dated 29 November 2019 and its First Supplemental Disclosure Document dated 10 February 2021 and all the respective Product Highlights Sheet(s) (collectively, the “Offering Documents”), obtainable at our offices or website, before investing. The Offering Documents have been registered with the Securities Commission Malaysia (SC), however the registration with the SC does not amount to nor indicate that the SC has recommended or endorsed the product. Where a unit split/distribution is declared, investors are advised that following the issue of additional units/distribution, the NAV per unit will be reduced from the pre-unit split NAV/cum-distribution NAV to post-unit split NAV/ex-distribution NAV; and where a unit split is declared, the value of your investment in the Fund’s denominated currency will remained unchanged after the distribution of the additional units. Past performances are not an indication of future performances. There are risks involved with investing in unit trust funds; wholesale funds and/or Private Retirement Schemes. Some of these risks associated with investments in unit trust funds; wholesale funds and/or Private Retirement Schemes are interest rate fluctuation risk, foreign exchange or currency risk, country risk, political risk, credit risk, non-compliance risk, counterparty risk, target fund manager risk, liquidity risk and interest rate risk. For further details on the risk profile of all the funds, please refer to the Risk Factors section in the Offering Documents. The price of units and income distribution may go down as well as up. Investors should compare and consider the fees, charges and costs involved. Investors are advised to conduct own risk assessment and consult the professional advisers if in doubt on the action to be taken.

102
July 2021 Factsheet Manulife Shariah PRS-Conservative Fund
^ Please note that this is neither a capital guaranteed nor a capital protected. Therefore, a member's capital is neither guaranteed nor protected. 1 No annual fee will be charged during the 1st year of the opening of a private pension account; there will also be no annual fee payable if no contributions are made during a calendar year.
Fund type/category Core (Conservative) Fund objective The Fund aims to provide steady returns whilst preserving^ capital. Investment Strategy To achieve the objective of the Fund, the Provider will at all times invest a minimum of 80% of the Fund’s NAV in Malaysian sukuk (of which a minimum of 20% will be invested in Islamic money market instruments) and a maximum of 20% of the Fund’s NAV in Malaysian Shariah-compliant equities and/or equity-related securities. Fund manager Manulife Investment Management (M) Berhad 200801033087 (834424-U) Trustee CIMB Islamic Trustee Berhad 198801000556 (167913-M) Fund information (as at 30 Jun 2021) NAV/unit (Class A) RM 0.5393 NAV/unit (Class C) RM 0.5638 Fund size RM 1.01 mil Units in circulation 1.86 mil Fund launch date Class A & B: 24 Jul 2013
Class C: 28 Apr 2016 Fund inception date 13 Aug 2013 Financial year 31 Aug Currency RM Management fee Class A: 1.20% p.a. of the
NAV Class B: 1.00% p.a. of the
NAV Class C: 1.00% p.a. of the
NAV Trustee fee Class A, B & C: 0.025% p.a.
of the NAV Sales charge Class A & B: Nil
Class C: Up to 3.00% of the NAV per unit
Redemption charge Class A: 3.00% of NAV per unit for withdrawal in the 2nd year; 2.00% of NAV per unit
for withdrawal in the 3rd year; 1.00% of NAV per unit for
withdrawal in the 4th year; No Redemption Charge from the
5th year onwards. Class B & C: Nil
Distribution frequency Annually, if any, and will be automatically reinvested and distributed as additional units
of the Fund. Benchmark Maybank 12-month Islamic
fixed deposit-i rate Fees by Private Pension Administrator (PPA) Account opening fee RM10.00 (one-off) Annual fee1 RM8.00 p.a. Pre-retirement withdrawal fee
RM25.00 for each withdrawal Transfer fee RM25.00 for each transfer to
another PRS provider Administration fee 0.04% p.a. of the NAV
Fund review and strategy Since inception performance as at 30 June 2021*
——— Fund Class A ——— Benchmark in RM
Given that this is a conservative fund, we are staying entirely in fixed income. Domestically investors are likely to be cautious until we get Covid under control. The economic recovery will be pushed back and corporate earnings will be impacted in the short-term. Nevertheless, with vaccination expected to pick up pace, we believe any dip would be buying opportunities on risk assets which benefiting from reopening of economy if we look beyond the current Covid situation.
Total return over the following periods ended 30 June 2021*
1 month
6 month YTD 1 year 3 year 5 year Since
inception Fund Class A (%) 0.17 1.11 1.11 3.46 10.95 12.62 18.70 Benchmark in RM (%) 0.15 0.91 0.91 1.86 8.23 15.24 26.60 Fund Class C (%) 0.18 1.20 1.20 3.68 12.49 15.77 16.61 Benchmark in RM (%) 0.15 0.91 0.91 1.86 8.23 15.24 15.91
Calendar year returns* 2016 2017 2018 2019 2020
Fund Class A (%) 1.79 2.48 0.44 4.45 4.12 Benchmark in RM (%) 3.32 3.12 3.33 3.19 2.22 Fund Class C (%) 0.41 3.30 1.21 5.19 4.34 Benchmark in RM (%) 2.20 3.12 3.33 3.19 2.22
* Source: Lipper; Past performance is not necessarily indicative of future performance. The performance is calculated on NAV-to-NAV basis.
-5%
0%
5%
10%
15%
20%
25%
30%
08/2013 03/2014 10/2014 06/2015 01/2016 08/2016 03/2017 11/2017 06/2018 01/2019 09/2019 04/2020 11/2020 06/2021
Top 5 holdings No. Security name % NAV
1 Manulife Investment As-Saad 37.9 2 Manulife Investment Al-Mamun 19.4 3 CIMB Islamic Bank Bhd 1.7
07/01/21 13.1
4 Country Garden Real Estate Sdn Bhd 6.4 05/06/22 9.1
5 Fortune Premiere Sdn Bhd 5.05 10/31/25 7.4
Highest & lowest NAV 2018 2019 2020
High 0.5093 0.5246 0.5396 Low 0.5026 0.5033 0.5161
Distribution by financial year 2019 2020 2021
Distribution (Sen) 0.59 0.60 0.76 Distribution Yield (%) 1.2 1.2 1.4
Asset/sector allocation No. Asset/sector name % NAV
1 Fixed Income 67.8 2 Money Market 32.6 3 Equities 0.0 4 Cash & Cash Equivalents -0.4
Geographical allocation No. Geographical name % NAV
1 Malaysia 100.4 2 Cash & Cash Equivalents -0.4

103
July 2021 Factsheet Manulife Shariah PRS-Conservative Fund Market Review Equity For the month of June, equity markets were relatively mixed. Developed economies’ equities rose as vaccination campaigns continued to accelerate, especially in Europe Union, which is now catching up to the pace of the US and UK. Governments in most developed markets have continued to ease Covid-related mobility restrictions and many indicators are pointing towards a strong economic rebound. Nevertheless, the reopening of economies and the quick rebound in activities have fuelled inflation in some countries. While the US Federal Reserve continues to see the higher inflation as transitory, it has become slightly hawkish, admitting that tapering is being discussed. The Fed (based on dot plot projections) now expects two rate hikes in 2023, up from no rate hikes just three months ago. As for emerging economies, most continued to lag on the vaccination front. In addition, the spread of the Delta variant is now a potential concern, as it could slow down the full reopening of economies. The highly contagious Delta variant, first detected in India in December 2021, has spread to about 100 countries and the World Health Organization warned recently that it could soon become the dominant form of the virus. Fortunately, daily Covid-19 cases remain very low in China and it seem to have peaked in India. For Malaysia, the FBM KLCI Index fell by 3.2% m/m to close at a YTD low of 1532.6 points. Market sentiment was hit by the persistently high new Covid-19 cases despite full MCO. On top of this, political uncertainty is also rising as the King had announced that Parliament should reconvene as soon as possible. Both average daily trading volume and values fell to the lowest levels since April 2020, with lackluster interest from market participants. The best performing sectors in the month were transport, REIT and finance, while the worst performing sectors were healthcare, plantation and energy. FBM KLCI Index outperformed the FBM Small Cap Index (-3.6% m/m) due to positive gains in the banking sector, but underperformed the FBM100 Index (-2.9% m/m). Relative to the region, the FBM KLCI Index underperformed the MSCI Asia ex-Japan Index, which fell by 0.4% during the month. The top performers were Vietnam (6.1%), Philippines (4.1%) and Taiwan (4.0%). Meanwhile, Malaysia (-3.2%) was the worst performer. Fixed Income The US Treasury (UST) yield curve flattened in June 2021; 2-year, 5-year and 10-year UST yields changed 11 bps, 9 bps and -13 bps to close at 0.25%, 0.89% and 1.47% respectively. Federal Reserve in its monetary policy meeting in June decided to move forward their projection for interest rate hike from 2024 to 2023 as inflationary pressure took centre stage. Prior to the meeting, May’s CPI had shot up to 5.0% (April: 4.2%) year-on-year, which is highest level in 13 years. The Malaysia Government Securities (MGS) yield curve steepened during the month. 3-year, 5-year and 10-year MGS yields changed -5 bps, -5 bps and +5 bps respectively to close at 2.26%, 2.54% and 3.28%. The lockdown was imminent following the spike in new Covid-19 cases to nearly 10,000 per day by end of May. Besides the elevated number seen in the daily new cases, the country was also hit by the emergence of the new delta variant of the coronavirus that is more transmissible. Fund Review In the month of June 2021, the fund outperformed its benchmark, mainly due to running return of underlying Sukuk asset. Market Outlook Equity The reopening of economy among developed countries is gradually taking root given their higher vaccination rate relative to that of emerging markets. Broad improvements in general economic activity is evident, from household spending, employment to air travel. In the US, the Federal Reserve has signalled that the first interest rate hike will come in 2023, earlier than previously forecast, as it raised the country’s GDP growth and inflation expectations. The key risk to global economic recovery would be a resurgent in Covid cases caused by new virus variants, though vaccines seem to be working against them thus far. For Malaysia, as the number of daily new cases remains stubbornly high, the government has imposed enhanced MCO in large parts of Klang Valley. Meanwhile, political uncertainty could come back as Parliament reconvenes and state of emergency ends. The market is expected to remain directionless until we get Covid under control. Nevertheless, with vaccination picking up pace, there will be buying opportunities for stocks benefiting from reopening of economy if we look beyond the current Covid situation. On the longer term, we remain positive on the prospects of the market, thanks to anticipation of eventual global economic recovery. We believe the key structural investment themes that we like, such as deglobalisation, digitalisation and clean energy, remain intact and will continue to anchor the basis of our investment decisions. In the current investment climate, we believe stocks selection will be key to investment performance. Fixed Income Even as massive fiscal stimulus and steady vaccine rollout progress buoyed prospects for global economic growth, many countries are still struggling with the spread of the contagious Delta variant of COVID-19. On local shores, one month of nationwide Movement Control Order (MCO) stopped the pandemic from worsening but failed to bring infection down to intended levels. This culminated in an extension of MCO period nationwide and the implementation of Enhanced Movement Control Order (an even stricter form of MCO) in a large swath of the Klang Valley, which increases downside risks to Malaysia’s economic recovery. As a result, risk sentiment remains weak in Malaysia’s financial market. At this juncture, we are still not expecting BNM to cut OPR although downside risks to economic growth strongly underpin the ‘lower for longer’ interest rate theme which should keep short-term yields low. Yield curve is expected to remain steep as long-term yield is pressured upwards by unfavourable supply-demand dynamics and inflation expectation. Over the longer term, we anticipate MGS yields to continue its upward trajectory due to rate normalization as Malaysia gradually overcomes its Covid challenges. In the meantime, we anticipate rangebound MGS yields to continue providing income return and cushion from volatility for investors and market participants.
104
July 2021 Factsheet Manulife Shariah PRS-Conservative Fund The above information has not been reviewed by the SC and is subject to the relevant warning, disclaimer, qualification or terms and conditions stated herein. Investors are advised to read and understand the contents of the Manulife Shariah PRS NESTEGG Series Disclosure Document dated 29 November 2019 and its First Supplemental Disclosure Document dated 10 February 2021 and all the respective Product Highlights Sheet(s) (collectively, the “Offering Documents”), obtainable at our offices or website, before investing. The Offering Documents have been registered with the Securities Commission Malaysia (SC), however the registration with the SC does not amount to nor indicate that the SC has recommended or endorsed the product. Where a unit split/distribution is declared, investors are advised that following the issue of additional units/distribution, the NAV per unit will be reduced from the pre-unit split NAV/cum-distribution NAV to post-unit split NAV/ex-distribution NAV; and where a unit split is declared, the value of your investment in the Fund’s denominated currency will remained unchanged after the distribution of the additional units. Past performances are not an indication of future performances. There are risks involved with investing in unit trust funds; wholesale funds and/or Private Retirement Schemes. Some of these risks associated with investments in unit trust funds; wholesale funds and/or Private Retirement Schemes are interest rate fluctuation risk, foreign exchange or currency risk, country risk, political risk, credit risk, non-compliance risk, counterparty risk, target fund manager risk, liquidity risk and interest rate risk. For further details on the risk profile of all the funds, please refer to the Risk Factors section in the Offering Documents. The price of units and income distribution may go down as well as up. Investors should compare and consider the fees, charges and costs involved. Investors are advised to conduct own risk assessment and consult the professional advisers if in doubt on the action to be taken.
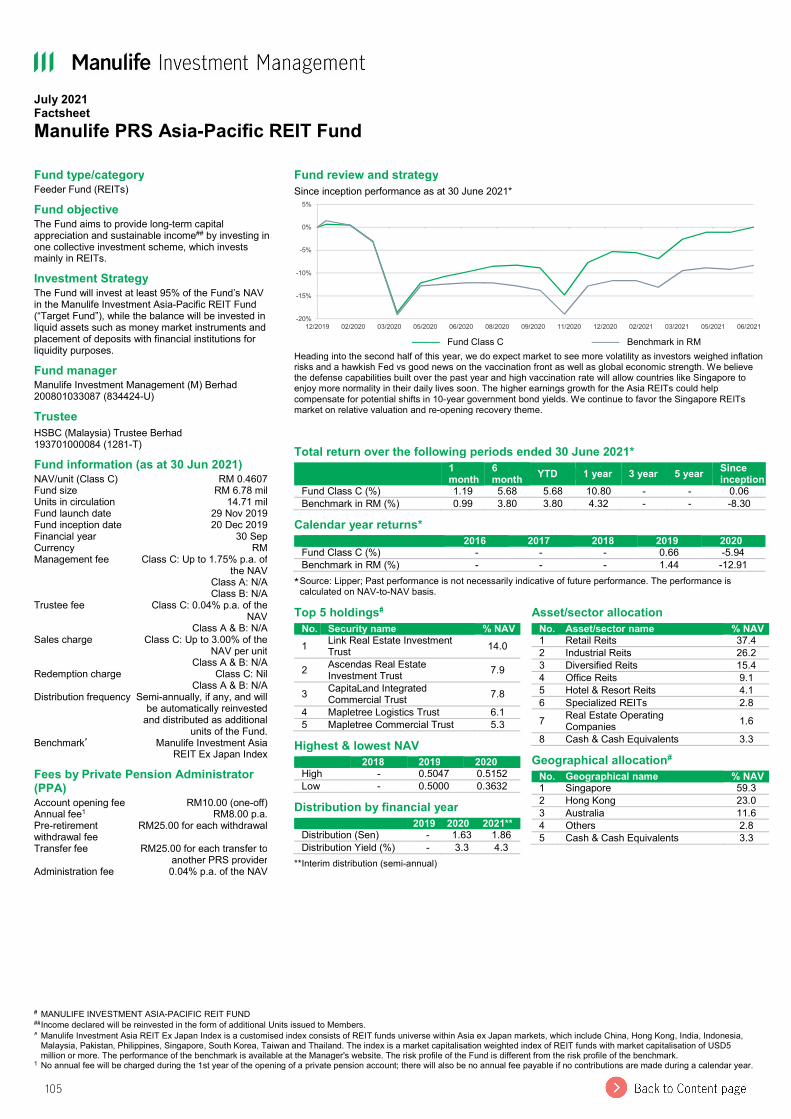
105
July 2021 Factsheet Manulife PRS Asia-Pacific REIT Fund
# MANULIFE INVESTMENT ASIA-PACIFIC REIT FUND ##Income declared will be reinvested in the form of additional Units issued to Members. ^ Manulife Investment Asia REIT Ex Japan Index is a customised index consists of REIT funds universe within Asia ex Japan markets, which include China, Hong Kong, India, Indonesia,
Malaysia, Pakistan, Philippines, Singapore, South Korea, Taiwan and Thailand. The index is a market capitalisation weighted index of REIT funds with market capitalisation of USD5 million or more. The performance of the benchmark is available at the Manager's website. The risk profile of the Fund is different from the risk profile of the benchmark.
1 No annual fee will be charged during the 1st year of the opening of a private pension account; there will also be no annual fee payable if no contributions are made during a calendar year.
Fund type/category Feeder Fund (REITs) Fund objective The Fund aims to provide long-term capital appreciation and sustainable income## by investing in one collective investment scheme, which invests mainly in REITs. Investment Strategy The Fund will invest at least 95% of the Fund’s NAV in the Manulife Investment Asia-Pacific REIT Fund (“Target Fund”), while the balance will be invested in liquid assets such as money market instruments and placement of deposits with financial institutions for liquidity purposes. Fund manager Manulife Investment Management (M) Berhad 200801033087 (834424-U) Trustee HSBC (Malaysia) Trustee Berhad 193701000084 (1281-T) Fund information (as at 30 Jun 2021) NAV/unit (Class C) RM 0.4607 Fund size RM 6.78 mil Units in circulation 14.71 mil Fund launch date 29 Nov 2019 Fund inception date 20 Dec 2019 Financial year 30 Sep Currency RM Management fee Class C: Up to 1.75% p.a. of
the NAV Class A: N/A Class B: N/A
Trustee fee Class C: 0.04% p.a. of the NAV
Class A & B: N/A Sales charge Class C: Up to 3.00% of the
NAV per unit Class A & B: N/A
Redemption charge Class C: Nil Class A & B: N/A
Distribution frequency Semi-annually, if any, and will be automatically reinvested
and distributed as additional units of the Fund.
Benchmark^ Manulife Investment Asia REIT Ex Japan Index
Fees by Private Pension Administrator (PPA) Account opening fee RM10.00 (one-off) Annual fee1 RM8.00 p.a. Pre-retirement withdrawal fee
RM25.00 for each withdrawal Transfer fee RM25.00 for each transfer to
another PRS provider Administration fee 0.04% p.a. of the NAV
Fund review and strategy Since inception performance as at 30 June 2021*
——— Fund Class C ——— Benchmark in RM
Heading into the second half of this year, we do expect market to see more volatility as investors weighed inflation risks and a hawkish Fed vs good news on the vaccination front as well as global economic strength. We believe the defense capabilities built over the past year and high vaccination rate will allow countries like Singapore to enjoy more normality in their daily lives soon. The higher earnings growth for the Asia REITs could help compensate for potential shifts in 10-year government bond yields. We continue to favor the Singapore REITs market on relative valuation and re-opening recovery theme.
Total return over the following periods ended 30 June 2021*
1 month
6 month YTD 1 year 3 year 5 year Since
inception Fund Class C (%) 1.19 5.68 5.68 10.80 - - 0.06 Benchmark in RM (%) 0.99 3.80 3.80 4.32 - - -8.30
Calendar year returns* 2016 2017 2018 2019 2020
Fund Class C (%) - - - 0.66 -5.94 Benchmark in RM (%) - - - 1.44 -12.91
* Source: Lipper; Past performance is not necessarily indicative of future performance. The performance is calculated on NAV-to-NAV basis.
-20%
-15%
-10%
-5%
0%
5%
12/2019 02/2020 03/2020 05/2020 06/2020 08/2020 09/2020 11/2020 12/2020 02/2021 03/2021 05/2021 06/2021
Top 5 holdings# No. Security name % NAV
1 Link Real Estate Investment Trust 14.0
2 Ascendas Real Estate Investment Trust 7.9
3 CapitaLand Integrated Commercial Trust 7.8
4 Mapletree Logistics Trust 6.1 5 Mapletree Commercial Trust 5.3
Highest & lowest NAV 2018 2019 2020
High - 0.5047 0.5152 Low - 0.5000 0.3632
Distribution by financial year 2019 2020 2021**
Distribution (Sen) - 1.63 1.86 Distribution Yield (%) - 3.3 4.3
** Interim distribution (semi-annual)
Asset/sector allocation No. Asset/sector name % NAV
1 Retail Reits 37.4 2 Industrial Reits 26.2 3 Diversified Reits 15.4 4 Office Reits 9.1 5 Hotel & Resort Reits 4.1 6 Specialized REITs 2.8 7 Real Estate Operating
Companies 1.6 8 Cash & Cash Equivalents 3.3
Geographical allocation# No. Geographical name % NAV
1 Singapore 59.3 2 Hong Kong 23.0 3 Australia 11.6 4 Others 2.8 5 Cash & Cash Equivalents 3.3
106
July 2021 Factsheet Manulife PRS Asia-Pacific REIT Fund Market Review Major Asia ex Japan REITs markets managed to close the month in positive territory in June despite more hawkish statements from the latest US Federal Reserve meeting. Buying sentiment was underpinned by a retreat in global bond yields. On the global Covid-19 front, we saw more countries being affected by rising cases due to the Delta variant, but investors appeared to look past that and focused on the strengthening of US and global economy. Australia REITs market continued its strong performance as the Australian 10-year bond tightened 18bps across the month in the sharpest monthly compression since Sep-20, providing a tailwind for the yield-sensitive sector. Gains were broad-based with fund managers, Charter Hall Group and Goodman Group among the top performers. A majority of AREITs have announced Jun-21 revaluations, with assets revalued 5% higher for the six months to Jun-21 and cap rates tightening 25bps on average. Industrial, unsurprisingly, led the way up a very strong 12% following exceptional transaction activity. Hong Kong REITS market lagged the region with relatively flat returns for June. Heavyweight Link REIT reported full year results that were in line with expectations and guided for a more optimistic outlook. The REIT shared that HK retail rental reversions recovered to positive levels in the 4QFY21 as tenant sales are recovering with the relaxation of social distancing measures. On the other hand, office REIT, Champion REIT, underperformed as central office rental recovery is expected to lag behind retail in HK. Singapore REITs market recovered in June as the country accelerates the vaccination program from Saturday (June 26) and administers up to 80,000 vaccine doses daily. Re-opening plays saw buying interest returning as social distancing restrictions were gradually relaxed from middle of June with dining-in resuming from 21 June. More than half of Singapore’s population is targeted to be fully vaccinated by the end of July and the government has guided that it will move to treating Covid-19 as an endemic disease by the end of the year. Fund Review The Fund outperformed its benchmark for the month. This reflects performance of the underlying fund at country and stock levels. A combination of allocation and stock selection in Australia and Hong Kong, with Industrial, Diversified and Office REITs, being the main contributors. Our underweights are mainly in Thailand, India, Malaysia, and Taiwan; and overweight in Australia and Singapore and Hong Kong, with Industrial and hospitality REITs remain key overweight. Market Outlook Heading into the second half of this year, we do expect market to see more volatility as investors weighed inflation risks and a hawkish Fed vs good news on the vaccination front as well as global economic strength. We believe the defense capabilities built over the past year and high vaccination rate will allow countries like Singapore to enjoy more normality in their daily lives soon. The higher earnings growth for the Asia REITs could help compensate for potential shifts in 10-year government bond yields. We continue to favor the Singapore REITs market on relative valuation and re-opening recovery theme. The above information has not been reviewed by the SC and is subject to the relevant warning, disclaimer, qualification or terms and conditions stated herein. Investors are advised to read and understand the contents of the Manulife PRS NESTEGG Series Disclosure Document dated 29 November 2019 and its First Supplemental Disclosure Document dated 10 February 2021 and all the respective Product Highlights Sheet(s) (collectively, the “Offering Documents”), obtainable at our offices or website, before investing. The Offering Documents have been registered with the Securities Commission Malaysia (SC), however the registration with the SC does not amount to nor indicate that the SC has recommended or endorsed the product. Where a unit split/distribution is declared, investors are advised that following the issue of additional units/distribution, the NAV per unit will be reduced from the pre-unit split NAV/cum-distribution NAV to post-unit split NAV/ex-distribution NAV; and where a unit split is declared, the value of your investment in the Fund’s denominated currency will remained unchanged after the distribution of the additional units. Past performances are not an indication of future performances. There are risks involved with investing in unit trust funds; wholesale funds and/or Private Retirement Schemes. Some of these risks associated with investments in unit trust funds; wholesale funds and/or Private Retirement Schemes are interest rate fluctuation risk, foreign exchange or currency risk, country risk, political risk, credit risk, non-compliance risk, counterparty risk, target fund manager risk, liquidity risk and interest rate risk. For further details on the risk profile of all the funds, please refer to the Risk Factors section in the Offering Documents. The price of units and income distribution may go down as well as up. Investors should compare and consider the fees, charges and costs involved. Investors are advised to conduct own risk assessment and consult the professional advisers if in doubt on the action to be taken.
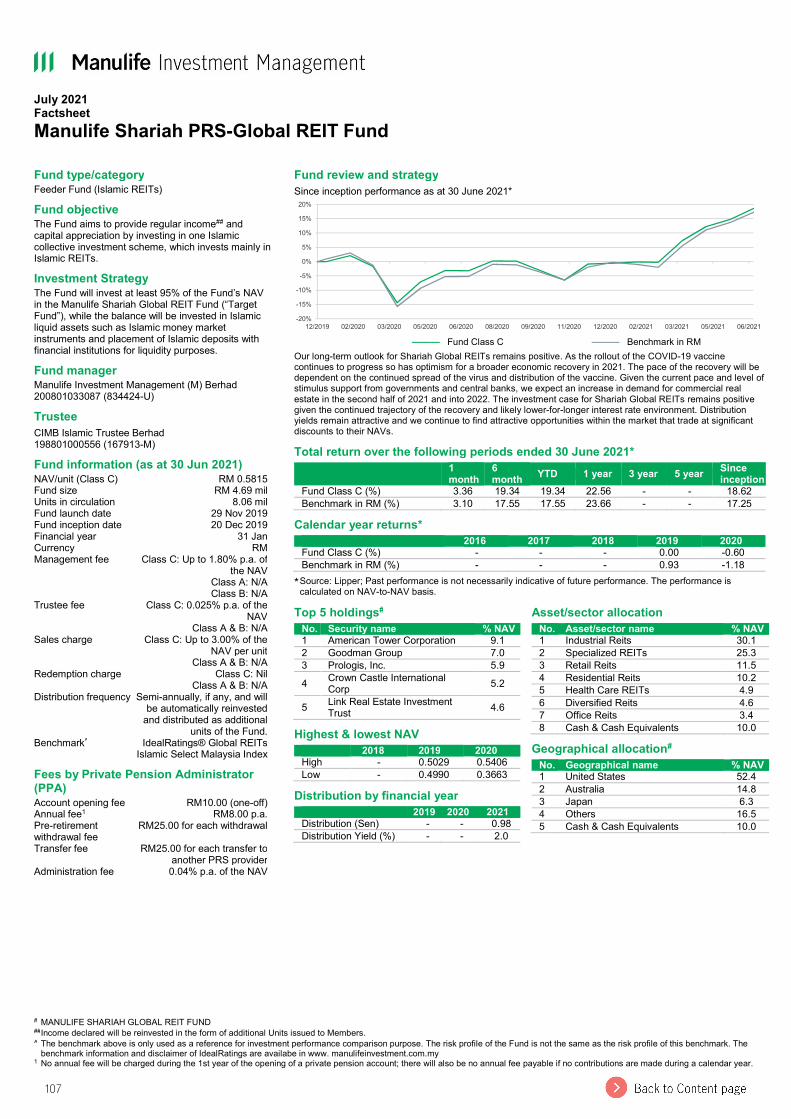
107
July 2021 Factsheet Manulife Shariah PRS-Global REIT Fund
# MANULIFE SHARIAH GLOBAL REIT FUND ##Income declared will be reinvested in the form of additional Units issued to Members. ^ The benchmark above is only used as a reference for investment performance comparison purpose. The risk profile of the Fund is not the same as the risk profile of this benchmark. The
benchmark information and disclaimer of IdealRatings are availabe in www. manulifeinvestment.com.my 1 No annual fee will be charged during the 1st year of the opening of a private pension account; there will also be no annual fee payable if no contributions are made during a calendar year.
Fund type/category Feeder Fund (Islamic REITs) Fund objective The Fund aims to provide regular income## and capital appreciation by investing in one Islamic collective investment scheme, which invests mainly in Islamic REITs. Investment Strategy The Fund will invest at least 95% of the Fund’s NAV in the Manulife Shariah Global REIT Fund (“Target Fund”), while the balance will be invested in Islamic liquid assets such as Islamic money market instruments and placement of Islamic deposits with financial institutions for liquidity purposes. Fund manager Manulife Investment Management (M) Berhad 200801033087 (834424-U) Trustee CIMB Islamic Trustee Berhad 198801000556 (167913-M) Fund information (as at 30 Jun 2021) NAV/unit (Class C) RM 0.5815 Fund size RM 4.69 mil Units in circulation 8.06 mil Fund launch date 29 Nov 2019 Fund inception date 20 Dec 2019 Financial year 31 Jan Currency RM Management fee Class C: Up to 1.80% p.a. of
the NAV Class A: N/A Class B: N/A
Trustee fee Class C: 0.025% p.a. of the NAV
Class A & B: N/A Sales charge Class C: Up to 3.00% of the
NAV per unit Class A & B: N/A
Redemption charge Class C: Nil Class A & B: N/A
Distribution frequency Semi-annually, if any, and will be automatically reinvested
and distributed as additional units of the Fund.
Benchmark^ IdealRatings® Global REITs Islamic Select Malaysia Index
Fees by Private Pension Administrator (PPA) Account opening fee RM10.00 (one-off) Annual fee1 RM8.00 p.a. Pre-retirement withdrawal fee
RM25.00 for each withdrawal Transfer fee RM25.00 for each transfer to
another PRS provider Administration fee 0.04% p.a. of the NAV
Fund review and strategy Since inception performance as at 30 June 2021*
——— Fund Class C ——— Benchmark in RM
Our long-term outlook for Shariah Global REITs remains positive. As the rollout of the COVID-19 vaccine continues to progress so has optimism for a broader economic recovery in 2021. The pace of the recovery will be dependent on the continued spread of the virus and distribution of the vaccine. Given the current pace and level of stimulus support from governments and central banks, we expect an increase in demand for commercial real estate in the second half of 2021 and into 2022. The investment case for Shariah Global REITs remains positive given the continued trajectory of the recovery and likely lower-for-longer interest rate environment. Distribution yields remain attractive and we continue to find attractive opportunities within the market that trade at significant discounts to their NAVs. Total return over the following periods ended 30 June 2021*
1 month
6 month YTD 1 year 3 year 5 year Since
inception Fund Class C (%) 3.36 19.34 19.34 22.56 - - 18.62 Benchmark in RM (%) 3.10 17.55 17.55 23.66 - - 17.25
Calendar year returns* 2016 2017 2018 2019 2020
Fund Class C (%) - - - 0.00 -0.60 Benchmark in RM (%) - - - 0.93 -1.18
* Source: Lipper; Past performance is not necessarily indicative of future performance. The performance is calculated on NAV-to-NAV basis.
-20%
-15%
-10%
-5%
0%
5%
10%
15%
20%
12/2019 02/2020 03/2020 05/2020 06/2020 08/2020 09/2020 11/2020 12/2020 02/2021 03/2021 05/2021 06/2021
Top 5 holdings# No. Security name % NAV
1 American Tower Corporation 9.1 2 Goodman Group 7.0 3 Prologis, Inc. 5.9 4 Crown Castle International
Corp 5.2
5 Link Real Estate Investment Trust 4.6
Highest & lowest NAV 2018 2019 2020
High - 0.5029 0.5406 Low - 0.4990 0.3663
Distribution by financial year 2019 2020 2021
Distribution (Sen) - - 0.98 Distribution Yield (%) - - 2.0
Asset/sector allocation No. Asset/sector name % NAV
1 Industrial Reits 30.1 2 Specialized REITs 25.3 3 Retail Reits 11.5 4 Residential Reits 10.2 5 Health Care REITs 4.9 6 Diversified Reits 4.6 7 Office Reits 3.4 8 Cash & Cash Equivalents 10.0
Geographical allocation# No. Geographical name % NAV
1 United States 52.4 2 Australia 14.8 3 Japan 6.3 4 Others 16.5 5 Cash & Cash Equivalents 10.0
108
July 2021 Factsheet Manulife Shariah PRS-Global REIT Fund Market Review The Shariah Global Real Estate sector posted positive returns for the month of June outperforming the broader global equity markets. The global equity markets gained ground in the second quarter, adding to their strong returns of the previous 12 months. Stocks remained well supported by the combination of accelerating economic growth, the gradual rollback of the coronavirus lockdowns, and robust corporate earnings. Although concerns about inflation led to a brief stretch of volatility mid-way through the quarter, the U.S. Federal Reserve and other world central banks reassured the markets that monetary policy would remain accommodative for an extended period. Leadership changed at the style level, with growth stocks—which had lagged considerably in late 2020 and the first quarter of this year—reasserting their dominance. North America was the top performing region, with both Canada and the United States outpacing their global peers. Fund Review In June, the Fund slightly outperformed its benchmark driven by security selection in the U.S. and the U.K. The fund also benefitted from an underweight in the U.K. and an overweight in the U.S. From a sub-sector perspective, the Fund had strong security selection within the specialized, retail and healthcare sub-sectors. Our underweight and security selection within Japan were the key detractors from performance during the past month. Market Outlook The Shariah global REIT sector continues to perform well in 2021 with year-to-date performance outperforming the broader global equity markets. Global REITs have remained resilient and have become more attractive in the current interest rate environment given the sector’s favourable distribution yields and steady cash flow. Although there is continued pressure in some parts of the world as COVID-19 cases and mitigation measures remain persistent, we remain optimistic that we are in the early stages of a global economic recovery. We believe as the pace of vaccine distribution accelerates, we will see further evidence of pent-up demand that will lead to stronger economic growth as we progress through the rest of the year and into 2022. While we have seen select countries experience an increase in COVID-19 cases, we do note that most of the world including some major economies are seeing a continued reduction in active COVID-19 cases. This has led to favourable market conditions that has benefited the global equity market and especially global REITs. Despite this positive view we constantly monitor potential risks across global REITs, including geopolitical risks that could weigh on global markets. Select sub-sectors and regions within global REITs may continue to see some earnings pressure until COVID-19 related restrictions are fully lifted, and we have positioned the Fund accordingly. We believe near-term pressure on real estate fundamentals will ease in the coming quarters as the global economy continues to recover, especially in the Office and Residential sub-sectors. From a regional perspective we continue to favour the U.S., Australia and Singapore owing to a combination of attractive valuations and distribution yields. Within these countries, and from a global perspective, we see investment opportunities within Industrial, Retail and technology-related REITs. We have minimised our exposure to the Japanese and U.K. REIT markets based on their relative distribution yields and valuations. We see additional developments that will have a positive impact on the sector. In 2020, some REITs took a conservative approach and reduced their dividends, however, we expect REITs with stable and growing cash flow to increase their dividends as the economy recovers. In addition, REIT valuations trading below their respective net asset values may lead to an increase in merger-and-acquisition (M&A) activity. M&A is also supported by a large amount of institutional capital that is designated to real estate investments. Overall, we believe the long-term outlook for Shariah Global REITs remains positive given the continued trajectory of the recovery and likely lower-for-longer interest rate environment. Distribution yields within the sector remain attractive compared to other yield-oriented investments. The spread between the yields of REITs and fixed income securities is well above historical averages. We continue to find attractive opportunities within the REIT market that trade at significant discounts to what we view as their intrinsic net asset values. The above information has not been reviewed by the SC and is subject to the relevant warning, disclaimer, qualification or terms and conditions stated herein. Investors are advised to read and understand the contents of the Manulife Shariah PRS NESTEGG Series Disclosure Document dated 29 November 2019 and its First Supplemental Disclosure Document dated 10 February 2021 and all the respective Product Highlights Sheet(s) (collectively, the “Offering Documents”), obtainable at our offices or website, before investing. The Offering Documents have been registered with the Securities Commission Malaysia (SC), however the registration with the SC does not amount to nor indicate that the SC has recommended or endorsed the product. Where a unit split/distribution is declared, investors are advised that following the issue of additional units/distribution, the NAV per unit will be reduced from the pre-unit split NAV/cum-distribution NAV to post-unit split NAV/ex-distribution NAV; and where a unit split is declared, the value of your investment in the Fund’s denominated currency will remained unchanged after the distribution of the additional units. Past performances are not an indication of future performances. There are risks involved with investing in unit trust funds; wholesale funds and/or Private Retirement Schemes. Some of these risks associated with investments in unit trust funds; wholesale funds and/or Private Retirement Schemes are interest rate fluctuation risk, foreign exchange or currency risk, country risk, political risk, credit risk, non-compliance risk, counterparty risk, target fund manager risk, liquidity risk and interest rate risk. For further details on the risk profile of all the funds, please refer to the Risk Factors section in the Offering Documents. The price of units and income distribution may go down as well as up. Investors should compare and consider the fees, charges and costs involved. Investors are advised to conduct own risk assessment and consult the professional advisers if in doubt on the action to be taken.
Fund name Currency Current payout (Gross distribution - sen per unit)
Current payout (Gross yield)
Type of distribution
Entitlement date
Ex-date For the financial year/Period ended
Financial year total payout (Gross yield)
Manulife SGD Income Fund (SGD Class)
SGD 0.98 1.0%1 1st quarter
8 April 2021
9 April 2021
31 January 2022
1.0%1
Manulife SGD Income Fund (RM Class)
MYR 1.04 1.0%1 1st quarter
8 April 2021
9 April 2021
31 January 2022
1.0%1
Manulife SGD Income Fund (RM Hedged-Class)
MYR 1.01 1.0%1 1st quarter
8 April 2021
9 April 2021
31 January 2022
1.0%1
Manulife SGD Income Fund (EUR Hedged-Class)
EUR 1.42 1.5%1 1st quarter
8 April 2021
9 April 2021
31 January 2022
1.5%1
Manulife SGD Income Fund (CNH Hedged-Class)
CNH 1.04 1.0%1 1st quarter
8 April 2021
9 April 2021
31 January 2022
1.0%1
Manulife Investment Dividend Fund
MYR 0.80 2.9%2 Final 26 April 2021
27 April 2021
30 April 2021
5.3%3
Manulife Investment Shariah Progress Fund
MYR 5.00 12.0%3 Annual 26 April 2021
27 April 2021
30 April 2021
12.0%3
Manulife Shariah - Dana Ekuiti
MYR 3.50 5.7%3 Annual 26 April 2021
27 April 2021
30 April 2021
5.7%3
1 Based on average NAV from 1/2/2021 to 30/4/20212 Based on average NAV from 1/11/2020 to 30/4/20213 Based on average NAV from 1/5/2020 to 30/4/2021
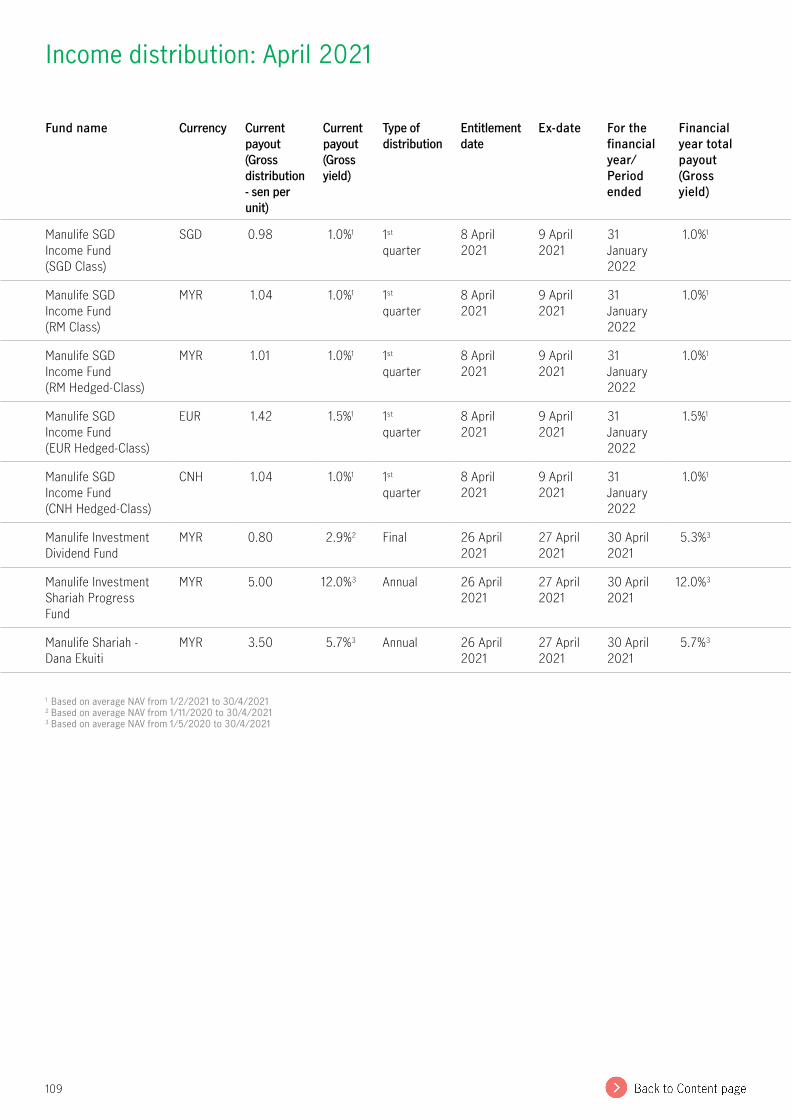
109
Fund name Currency Current payout (Gross distribution - sen per unit)
Current payout (Gross yield)
Type of distribution
Entitlement date
Ex-date For the financial year/Period ended
Financial year total payout (Gross yield)
Manulife SGD Income Fund (SGD Class)
SGD 0.98 1.0%1 1st quarter
8 April 2021
9 April 2021
31 January 2022
1.0%1
Manulife SGD Income Fund (RM Class)
MYR 1.04 1.0%1 1st quarter
8 April 2021
9 April 2021
31 January 2022
1.0%1
Manulife SGD Income Fund (RM Hedged-Class)
MYR 1.01 1.0%1 1st quarter
8 April 2021
9 April 2021
31 January 2022
1.0%1
Manulife SGD Income Fund (EUR Hedged-Class)
EUR 1.42 1.5%1 1st quarter
8 April 2021
9 April 2021
31 January 2022
1.5%1
Manulife SGD Income Fund (CNH Hedged-Class)
CNH 1.04 1.0%1 1st quarter
8 April 2021
9 April 2021
31 January 2022
1.0%1
Manulife Investment Dividend Fund
MYR 0.80 2.9%2 Final 26 April 2021
27 April 2021
30 April 2021
5.3%3
Manulife Investment Shariah Progress Fund
MYR 5.00 12.0%3 Annual 26 April 2021
27 April 2021
30 April 2021
12.0%3
Manulife Shariah - Dana Ekuiti
MYR 3.50 5.7%3 Annual 26 April 2021
27 April 2021
30 April 2021
5.7%3
1 Based on average NAV from 1/2/2021 to 30/4/20212 Based on average NAV from 1/11/2020 to 30/4/20213 Based on average NAV from 1/5/2020 to 30/4/2021
Income distribution: April 2021
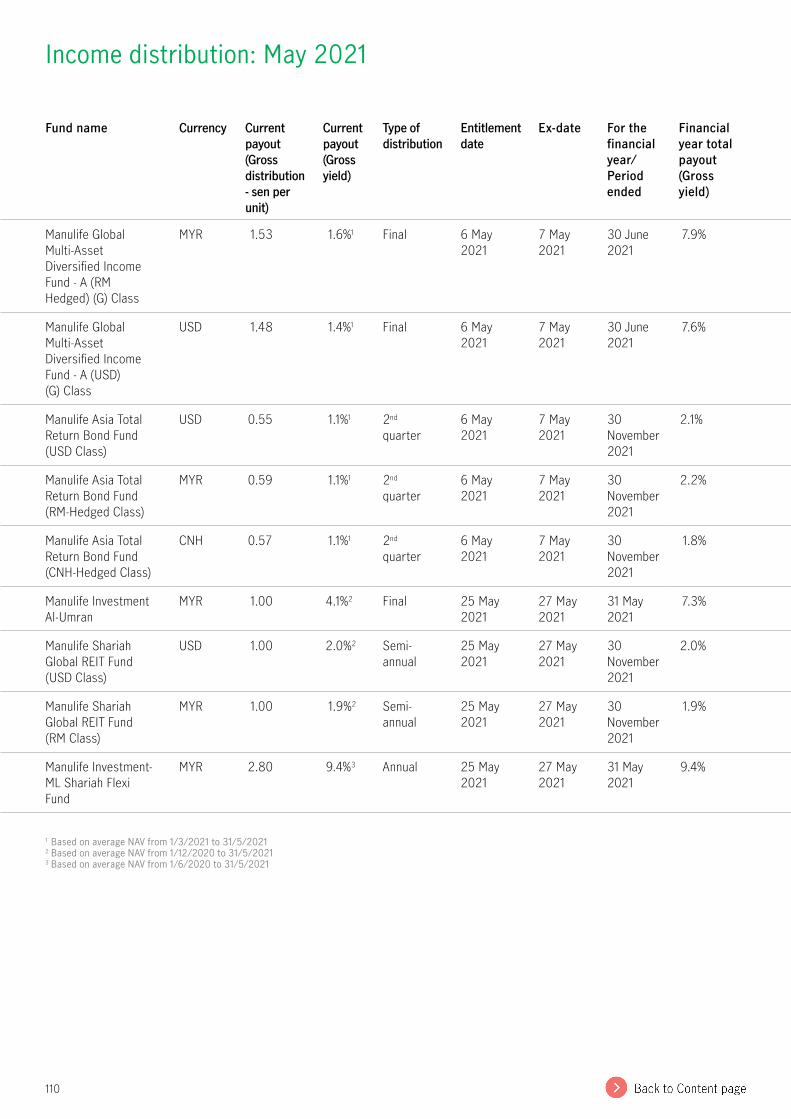
110
Fund name Currency Current payout (Gross distribution - sen per unit)
Current payout (Gross yield)
Type of distribution
Entitlement date
Ex-date For the financial year/Period ended
Financial year total payout (Gross yield)
Manulife Global Multi-Asset Diversified Income Fund - A (RM Hedged) (G) Class
MYR 1.53 1.6%1 Final 6 May 2021
7 May 2021
30 June 2021
7.9%
Manulife Global Multi-Asset Diversified Income Fund - A (USD) (G) Class
USD 1.48 1.4%1 Final 6 May 2021
7 May 2021
30 June 2021
7.6%
Manulife Asia Total Return Bond Fund (USD Class)
USD 0.55 1.1%1 2nd quarter
6 May 2021
7 May 2021
30 November 2021
2.1%
Manulife Asia Total Return Bond Fund (RM-Hedged Class)
MYR 0.59 1.1%1 2nd quarter
6 May 2021
7 May 2021
30 November 2021
2.2%
Manulife Asia Total Return Bond Fund (CNH-Hedged Class)
CNH 0.57 1.1%1 2nd quarter
6 May 2021
7 May 2021
30 November 2021
1.8%
Manulife Investment Al-Umran
MYR 1.00 4.1%2 Final 25 May 2021
27 May 2021
31 May 2021
7.3%
Manulife Shariah Global REIT Fund (USD Class)
USD 1.00 2.0%2 Semi-annual
25 May 2021
27 May 2021
30 November 2021
2.0%
Manulife Shariah Global REIT Fund (RM Class)
MYR 1.00 1.9%2 Semi-annual
25 May 2021
27 May 2021
30 November 2021
1.9%
Manulife Investment-ML Shariah Flexi Fund
MYR 2.80 9.4%3 Annual 25 May 2021
27 May 2021
31 May 2021
9.4%
1 Based on average NAV from 1/3/2021 to 31/5/20212 Based on average NAV from 1/12/2020 to 31/5/20213 Based on average NAV from 1/6/2020 to 31/5/2021
Income distribution: May 2021
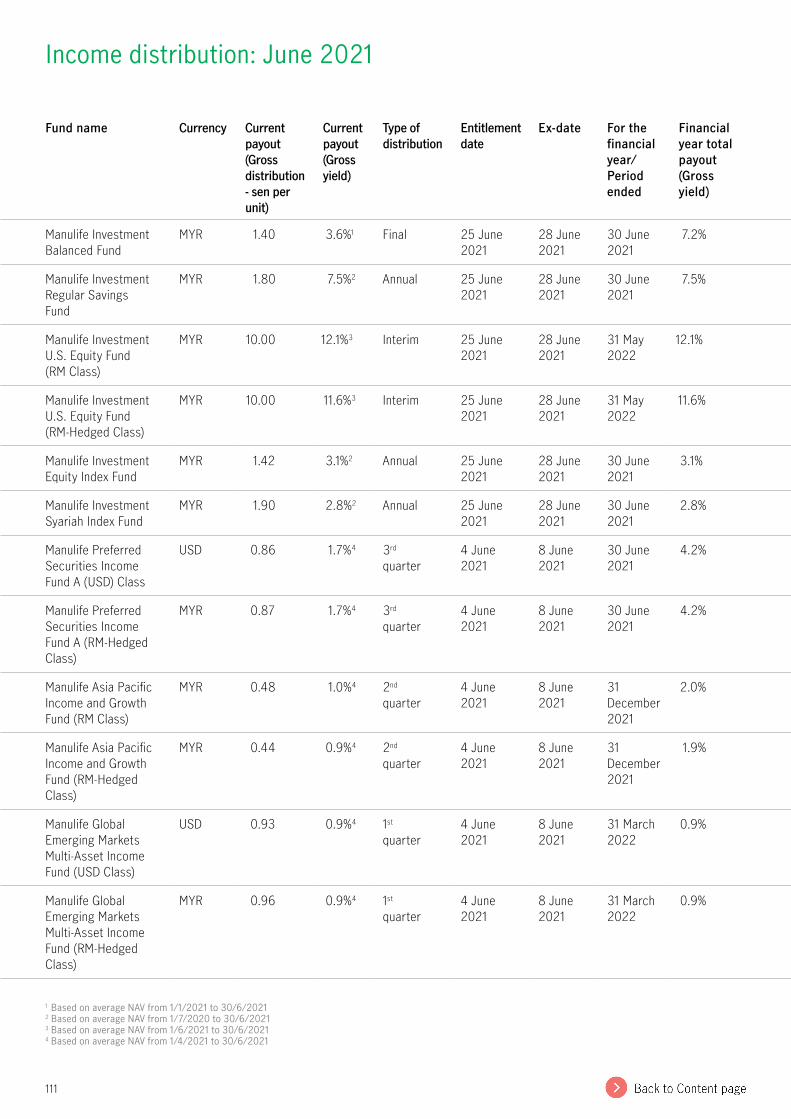
111
Fund name Currency Current payout (Gross distribution - sen per unit)
Current payout (Gross yield)
Type of distribution
Entitlement date
Ex-date For the financial year/Period ended
Financial year total payout (Gross yield)
Manulife Investment Balanced Fund
MYR 1.40 3.6%1 Final 25 June 2021
28 June 2021
30 June 2021
7.2%
Manulife Investment Regular Savings Fund
MYR 1.80 7.5%2 Annual 25 June 2021
28 June 2021
30 June 2021
7.5%
Manulife Investment U.S. Equity Fund (RM Class)
MYR 10.00 12.1%3 Interim 25 June 2021
28 June 2021
31 May 2022
12.1%
Manulife Investment U.S. Equity Fund (RM-Hedged Class)
MYR 10.00 11.6%3 Interim 25 June 2021
28 June 2021
31 May 2022
11.6%
Manulife Investment Equity Index Fund
MYR 1.42 3.1%2 Annual 25 June 2021
28 June 2021
30 June 2021
3.1%
Manulife Investment Syariah Index Fund
MYR 1.90 2.8%2 Annual 25 June 2021
28 June 2021
30 June 2021
2.8%
Manulife Preferred Securities Income Fund A (USD) Class
USD 0.86 1.7%4 3rd quarter
4 June 2021
8 June 2021
30 June 2021
4.2%
Manulife Preferred Securities Income Fund A (RM-Hedged Class)
MYR 0.87 1.7%4 3rd quarter
4 June 2021
8 June 2021
30 June 2021
4.2%
Manulife Asia Pacific Income and Growth Fund (RM Class)
MYR 0.48 1.0%4 2nd quarter
4 June 2021
8 June 2021
31 December 2021
2.0%
Manulife Asia Pacific Income and Growth Fund (RM-Hedged Class)
MYR 0.44 0.9%4 2nd quarter
4 June 2021
8 June 2021
31 December 2021
1.9%
Manulife Global Emerging Markets Multi-Asset Income Fund (USD Class)
USD 0.93 0.9%4 1st quarter
4 June 2021
8 June 2021
31 March 2022
0.9%
Manulife Global Emerging Markets Multi-Asset Income Fund (RM-Hedged Class)
MYR 0.96 0.9%4 1st quarter
4 June 2021
8 June 2021
31 March 2022
0.9%
1 Based on average NAV from 1/1/2021 to 30/6/20212 Based on average NAV from 1/7/2020 to 30/6/20213 Based on average NAV from 1/6/2021 to 30/6/20214 Based on average NAV from 1/4/2021 to 30/6/2021
Income distribution: June 2021
Disclaimer
The above information has not been reviewed by the SC and is subject to the relevant warning, disclaimer, qualification or terms and conditions stated herein. Investors are advised to read and understand the contents of the Master Prospectus dated 7 February 2020, its First Supplemental Master Prospectus dated 13 November 2020 and its Second Supplemental Master Prospectus dated 5 April 2021; Master Prospectus dated 10 August 2020, its First Supplemental Master Prospectus dated 10 August 2020, its Second Supplemental Master Prospectus dated 27 January 2021 and its Third Supplemental Master Prospectus dated 5 April 2021; Prospectus of Manulife Global Low Volatility Equity Fund dated 29 July 2020 and its First Supplemental Prospectus dated 27 November 2020; Prospectus of Manulife Preferred Securities Income Fund dated 7 October 2020 and its First Supplemental Prospectus dated 9 February 2021; Information Memorandum of Manulife Target Maturity Bond Fund 1 dated 4 September 2019 and its First Supplemental Information Memorandum dated 18 October 2019; Information Memorandum of Manulife Global Multi-Asset Diversified Income Fund dated 3 February 2020; Information Memorandum of Manulife Dragon Growth Fund dated 11 February 2020; Information Memorandum of Manulife Asian Small Cap Equity Fund dated 11 February 2020; Information Memorandum of Manulife SGD Income Fund dated 11 February 2020; Information Memorandum of Manulife Global Emerging Markets Multi-Asset Income Fund dated 11 February 2020; Information Memorandum of Manulife ASEAN Equity Fund dated 11 February 2020; Manulife PRS NESTEGG Series Disclosure Document dated 29 November 2019 and its First Supplemental Disclosure Document dated 10 February 2021; Manulife Shariah PRS NESTEGG Series Disclosure Document dated 29 November 2019 and its First Supplemental Disclosure Document dated 10 February 2021 and all the respective Product Highlights Sheet(s) (collectively, the “Offering Documents”), obtainable at our offices or website, before investing. The Offering Documents have been registered with the Securities Commission Malaysia (SC), however the registration with the SC does not amount to nor indicate that the SC has recommended or endorsed the product. There are risks involved with investing in unit trust funds; wholesale funds and/or Private Retirement Schemes. Some of these risks associated with investments in unit trust funds; wholesale funds and/or Private Retirement Schemes are interest rate fluctuation risk, foreign exchange or currency risk, country risk, political risk, credit risk, non-compliance risk, counterparty risk, target fund manager risk, liquidity risk and interest rate risk. For further details on the risk profile of all the funds, please refer to the Risk Factors section in the Offering Documents. The price of units and income distribution may go down as well as up. Investors should compare and consider the fees, charges and costs involved. Investors are advised to conduct own risk assessment and consult the professional advisers if in doubt on the action to be taken. Where a unit split/distribution is declared, investors are advised that following the issue of additional units/distribution, the NAV per unit will be reduced from the pre-unit split NAV/cum-distribution NAV to post-unit split NAV/ex-distribution NAV; and where a unit split is declared, the value of your investment in the Fund’s denominated currency will remained unchanged after the distribution of the additional units.
This material was prepared by Manulife Investment Management (M) Berhad (Registration No: 200801033087 (834424-U) (hereinafter referred to as “Manulife IM (Malaysia)”) is solely for informational purposes and does not constitute a recommendation, professional advice, an offer, solicitation or an invitation by or on behalf of Manulife IM (Malaysia) to any person to buy or sell any security. Nothing in this material constitutes financial, investment, legal, accounting or tax advice, or a representation that any investment or strategy is suitable or appropriate to any individual circumstances, or otherwise constitutes a personal recommendation to anyone.
A widespread health crisis such as a global pandemic could cause substantial market volatility, exchange trading suspensions and closures, and affect portfolio performance. For example, the novel coronavirus disease (COVID-19) has resulted in significant disruptions to global business activity. The impact of a health crisis and other epidemics and pandemics that may arise in the future could affect the global economy in ways that cannot necessarily be foreseen at the present time. A health crisis may exacerbate other pre-existing political, social and economic risks. Any such impact could adversely affect the portfolio’s performance, resulting in losses to your investment.
Investing involves risks, including the potential loss of principal. Financial markets are volatile and can fluctuate significantly in response to company, industry, political, regulatory, market, or economic developments. These risks are magnified for investments made in emerging markets. Currency risk is the risk that fluctuations in exchange rates may adversely affect the value of a portfolio’s investments.
The information provided does not take into account the suitability, investment objectives, financial situation, or particular needs of any specific person. You should consider the suitability of any type of investment for your circumstances and, if necessary, seek professional advice.
This material, intended for the exclusive use by the recipients who are allowable to receive this document under the applicable laws and regulations of the relevant jurisdictions, was produced by, and the opinions expressed are those of, Manulife Investment Management as of the date of this publication, and are subject to change based on market and other conditions. The information and/or analysis contained in this material have been compiled or arrived at from sources believed to be reliable, but Manulife Investment Management does not make any representation as to their accuracy, correctness, usefulness, or completeness and does not accept liability for any loss arising from the use of the information and/or analysis contained. The information in this material may contain projections or other forward-looking statements regarding future events, targets, management discipline, or other expectations, and is only as current as of the date indicated. The information in this document, including statements concerning financial market trends, are based on current market conditions, which will fluctuate and may be superseded by subsequent market events or for other reasons. Manulife Investment Management disclaims any responsibility to update such information.
Neither Manulife Investment Management or its affiliates, nor any of their directors, officers or employees shall assume any liability or responsibility for any direct or indirect loss or damage or any other consequence of any person acting or not acting in reliance on the information contained herein. All overviews and commentary are intended to be general in nature and for current interest. While helpful, these overviews are no substitute for professional tax, investment or legal advice. Clients should seek professional advice for their particular situation. Neither Manulife, Manulife Investment Management, nor any of their affiliates or representatives is providing tax, investment or legal advice. Past performance does not guarantee future results. This material was prepared solely for informational purposes, does not constitute a recommendation, professional advice, an offer or an invitation by or on behalf of Manulife Investment Management to any person to buy or sell any security or adopt any investment strategy, and is no indication of trading intent in any fund or account managed by Manulife Investment Management. No investment strategy or risk management technique can guarantee returns or eliminate risk in any market environment. Diversification or asset allocation does not guarantee a profit nor protect against loss in any market. Unless otherwise specified, all data is sourced from Manulife Investment Management.
Manulife Investment Management
Manulife Investment Management is the global wealth and asset management segment of Manulife Financial Corporation. We draw on more than a century of financial stewardship to partner with clients across our institutional, retail, and retirement businesses globally. Our specialist approach to money management includes the highly differentiated strategies of our fixed-income, specialised equity, multi-asset solutions, and private markets teams—along with access to specialised, unaffiliated asset managers from around the world through our multimanager model.
These materials have not been reviewed by, are not registered with any securities or other regulatory authority, and may, where appropriate, be distributed by the following Manulife entities in their respective jurisdictions.
Additional information about Manulife Investment Management may be found at www.manulifeim.com/institutional.
Australia: Hancock Natural Resource Group Australasia Pty Limited., Manulife Investment Management (Hong Kong) Limited. Brazil: Hancock Asset Management Brasil Ltda. Canada: Manulife Investment Management Limited, Manulife Investment Management Distributors Inc., Manulife Investment Management (North America) Limited, Manulife Investment Management Private Markets (Canada) Corp. China: Manulife Overseas Investment Fund Management (Shanghai) Limited Company. European Economic Area and United Kingdom: Manulife Investment Management (Europe) Ltd. which is authorised and regulated by the Financial Conduct Authority, Manulife Investment Management (Ireland) Ltd. which is authorised and regulated by the Central Bank of Ireland. Hong Kong: Manulife Investment Management (Hong Kong) Limited. Indonesia: PT Manulife Aset Manajemen Indonesia. Japan: Manulife Asset Investment Management (Japan) Limited. Malaysia: Manulife Investment Management (M) Berhad 200801033087 (834424-U). Philippines: Manulife Asset Management and Trust Corporation. Singapore: Manulife Investment Management (Singapore) Pte. Ltd. (Company Registration No. 200709952G). South Korea: Manulife Investment Management (Hong Kong) Limited. Switzerland: Manulife IM (Switzerland) LLC. Taiwan: Manulife Investment Management (Taiwan) Co. Ltd. United States: John Hancock Investment Management LLC, Manulife Investment Management (US) LLC, Manulife Investment Management Private Markets (US) LLC and Hancock Natural Resource Group, Inc. Vietnam: Manulife Investment Fund Management (Vietnam) Company Limited.
Manulife Investment Management, the Stylised M Design, and Manulife Investment Management & Stylized M Design are trademarks of The Manufacturers Life Insurance Company and are used by it, and by its affiliates under license.

Manulife iFUNDS is our online fund investment platform that allows you to manage your portfolio, anytime, anywhere – seamlessly.
Portfolio management at your fingertips
Learn more about Manulife iFUNDSVisit our web page at https://asia.manulifeam.com/ifunds-my.html
Open an online accountQuick, convenient and paperless
Portfolio dashboardYour investment, at a glance
Fund switchingSeize market opportunities and meet your investment goals
Fund screenerHelp to narrow down the list of funds that meet your criteria
Fund pricesAvailable daily
What if analysisCompare the performance of various funds
Regular Savings PlanBuild your investments over time
Capture investment opportunitiesWith faster fund top up and switching