2q2021 opportunity day
TRANSCRIPT

2Q2021 Opportunity Day
August 16, 2021

2
Agenda
Business Overview
Business Direction
2Q2021 Operating Results

FSMART Vision
3

The Pride Awards
Best MAI Public
Company of the Year
2021
Private Sector Collective Action
against Corruption
(CAC)
4
“Excellent Rating from the CGR”
(4 consecutive years, 2017 2018, 2019, 2021)

Dividend & Yield
Remark: Dividend Yield Based on the Closing Price as of the Performance Period of Dividend Declaration, XD on 23 August 2021
Year 2018 2019 2020 1H2021
Revenue (Bt mn) 3,602 3,419 3,123 1,543
Net Profit (Bt mn) 583 584 464 224
EPS (Bt per share) 0.74 0.75 0.61 0.30
IBD/E 0.99 0.70 0.87 0.36
0.17 0.25 0.30 0.32 0.30 0.26
0.25
0.30 0.32 0.34 0.30
2.2% 3.1%10.6% 10.3% 8.5%
-50.0%
-40.0%
-30.0%
-20.0%
-10.0%
0.0 %
10. 0%
20. 0%
-
0.10
0.20
0.30
0.40
0.50
0.60
0.70
2016 2017 2018 2019 2020 2021
1H Dividend per Share 2H Dividend per Share Dividend Yield
0.55 0.62 0.66 0.600.42
FSMART Overview: High Dividend Yield with Strong Balance Sheet
Symbol FSMART
Market for Alternative Investment (MAI)
Industry Service
Registered Capital
Market Capitalization
400 Million Baht (800 million Shares)
8,320 Million Baht (as of 13 August 2021)
P/E Ratio (x)
CGR Score
Dividend
Excellent
Policy: Not Less than 40% Net Profit
17.12 (as of 13 August 2021)
Shareholder Structure (as of 10 March 2021)
Amtanon Group 6.62%
FSMART (Treasury Stock)
5.86%
Funds (Foreign/Local)
3.23%
FORTH Corporation PCL.49.52%
Free Float (Ex. Funds)34.77%
0.26
5

Customers
Boonterm Kiosks
Business Partners
Use servicesat Boonterm Kiosks
Provide servicesto Boonterm Kiosks
A Platform to Connect Customers and Service Operators with Total of
129,724 Boonterm Kiosks owned by FSMART
6
FSMART is a Platform Delivering Convenience
Pay commissionto FSMART
Pay service chargeto FSMART
3+ Government Sectors
18 Million Active Subscribers
1.3 Million Transactions per Day
9,621 Million Baht for Total Quarterly
Transaction Value7+ E-Wallets
5+ Mobile Operators
3+ Insurance Brokers
5+ Others
As of June 2021
6+ Banks
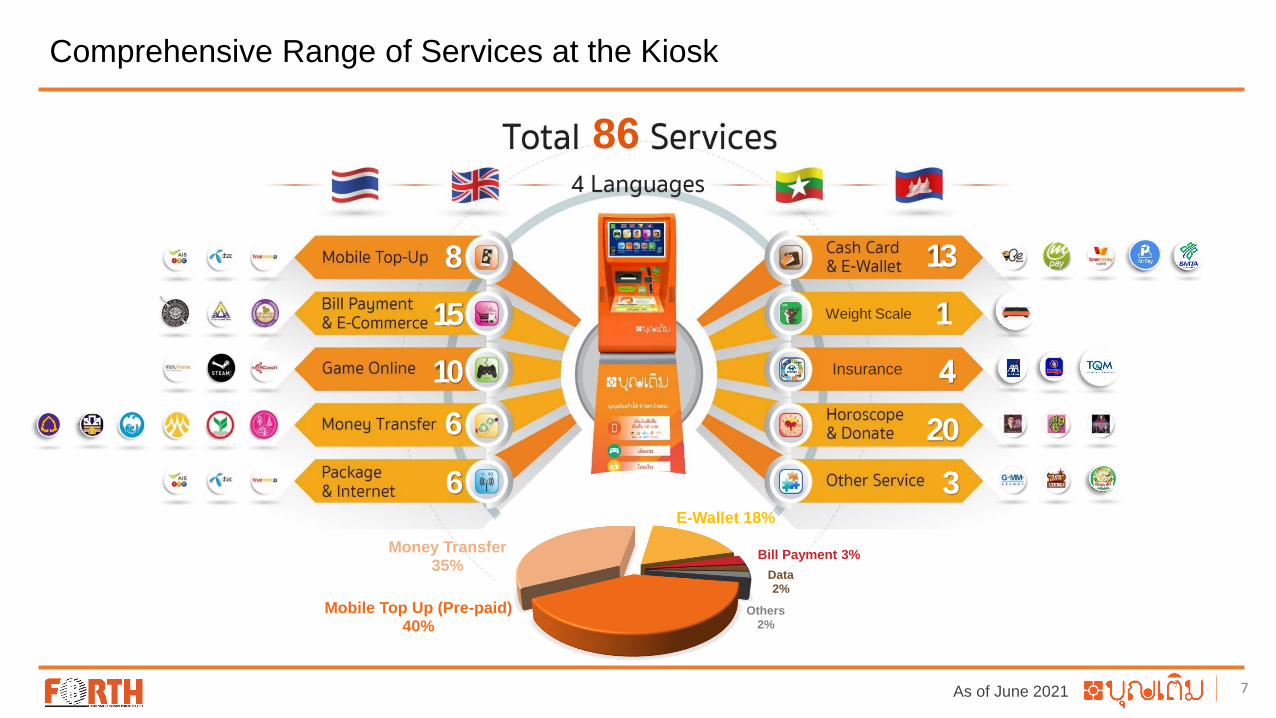
86
8
15
10
6
6
13
4
20
3
Mobile Top Up (Pre-paid)40%
Money Transfer35%
E-Wallet 18%
Bill Payment 3%
Data2%
Others2%
7
Comprehensive Range of Services at the Kiosk
1Weight Scale
Insurance
As of June 2021 7
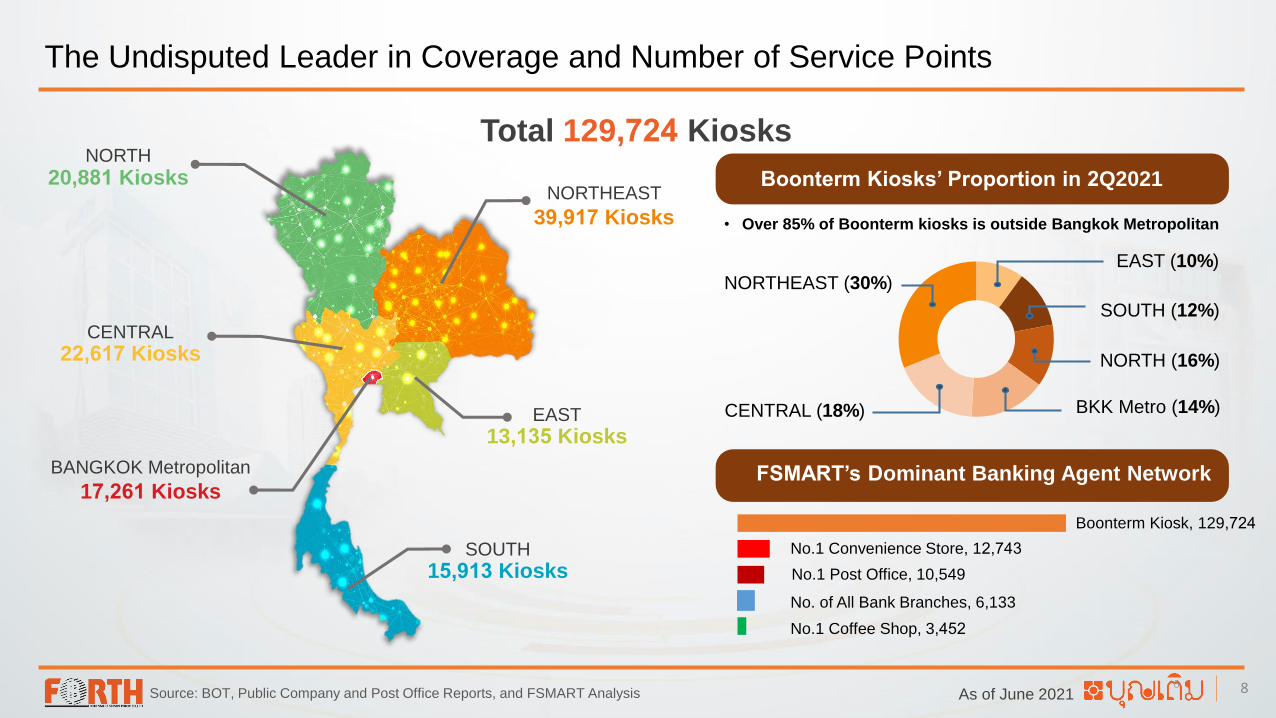
8
Total 129,724 Kiosks
The Undisputed Leader in Coverage and Number of Service Points
NORTH (16%)
CENTRAL (18%)
NORTHEAST (30%)
BKK Metro (14%)
SOUTH (12%)
EAST (10%)
NORTHEAST
39,917 Kiosks
NORTH
20,881 Kiosks
CENTRAL
22,617 Kiosks
BANGKOK Metropolitan
17,261 Kiosks
SOUTH
15,913 Kiosks
EAST
13,135 Kiosks
Source: BOT, Public Company and Post Office Reports, and FSMART Analysis
FSMART’s Dominant Banking Agent Network
Boonterm Kiosks’ Proportion in 2Q2021
• Over 85% of Boonterm kiosks is outside Bangkok Metropolitan
Boonterm Kiosk, 129,724
No.1 Convenience Store, 12,743
No.1 Coffee Shop, 3,452
No.1 Post Office, 10,549
No. of All Bank Branches, 6,133
As of June 2021 8

9
Mom and Pop Shop
68,222
Residence
31,591
Convenience Store14,108
Office Building4,959
Service Business
Area 2,792
Educational Institution
1,756
Petrol Station1,642
Temple1,441
Market1,155
Department Store 1,117
Government Office 595Transportation Station
346
Deep Penetration to the Grassroots Level
• Over 75% of Boonterm kiosks Locates at Mom and Pop Shop and Residence
10.9%
3.8%
2.2%
1.4%
1.3%
1.1%
0.9%
0.9%
0.5%0.3%
52.6%
24.4%
As of June 2021 9

AGENT• 160 Agents, 69 Partners
• Identify best locations
• Manage daily groundwork
operation
FSMART• Listed Company
• Provide superior hardware
and IT services
Boonterm Kiosk• 129,724 located nationwide
• 86 services
• 24 hours 7 daysMoney
CollectedMoney
Transfer
Get Commission
Service Provided
Sustainable and Recurring Business Model by Revenue Sharing
10

11
• Thailand Population: 17 Million Cashless Society People vs 51+3.5 Million Cash Society People
1st Tier Customers – 21 mn People
• 9 mn People: Rev/mth < Bt9,400 with Saving < Bt3,200
• 12 mn People: Rev/mth < Bt6,900 with Saving < Bt500
2nd Tier Customers – 30 mn People
• Rev/mth < Bt3,700 with No Saving
Cashless Society – 17 mn People
(Higher Revenue and Saving)
Source: Deposit Protection Agency, NESDB, BOT, Department of Employment,
Voice TV, MoneyChat, Foreign Worker Administration Office, FSMART Analysis
Foreign Workers – 2.5 mn People (Official)
– 3.5 mn People (All Estimated)
• Difficult to access financial services
Over 51+3.5 Million “Cash Society” People to Serve
3.5 Million People
174 170
188
175 185 183
190 192 190 197 195
206
190 193 190
156
186
197 202 198
193 199
190 197
179 175
192
172 176
Jan
-19
Feb
-19
Mar
-19
Ap
r-1
9
May
-19
Jun
-19
Jul-
19
Au
g-1
9
Sep
-19
Oct
-19
No
v-1
9
Dec
-19
Jan
-20
Feb
-20
Mar
-20
Ap
r-2
0
May
-20
Jun
-20
Jul-
20
Au
g-2
0
Sep
-20
Oct
-20
No
v-2
0
Dec
-20
Jan
-21
Feb
-21
Mar
-21
Ap
r-2
1
May
-21
ATM/Debit Card Mobile Banking Total Cash Withdrawal
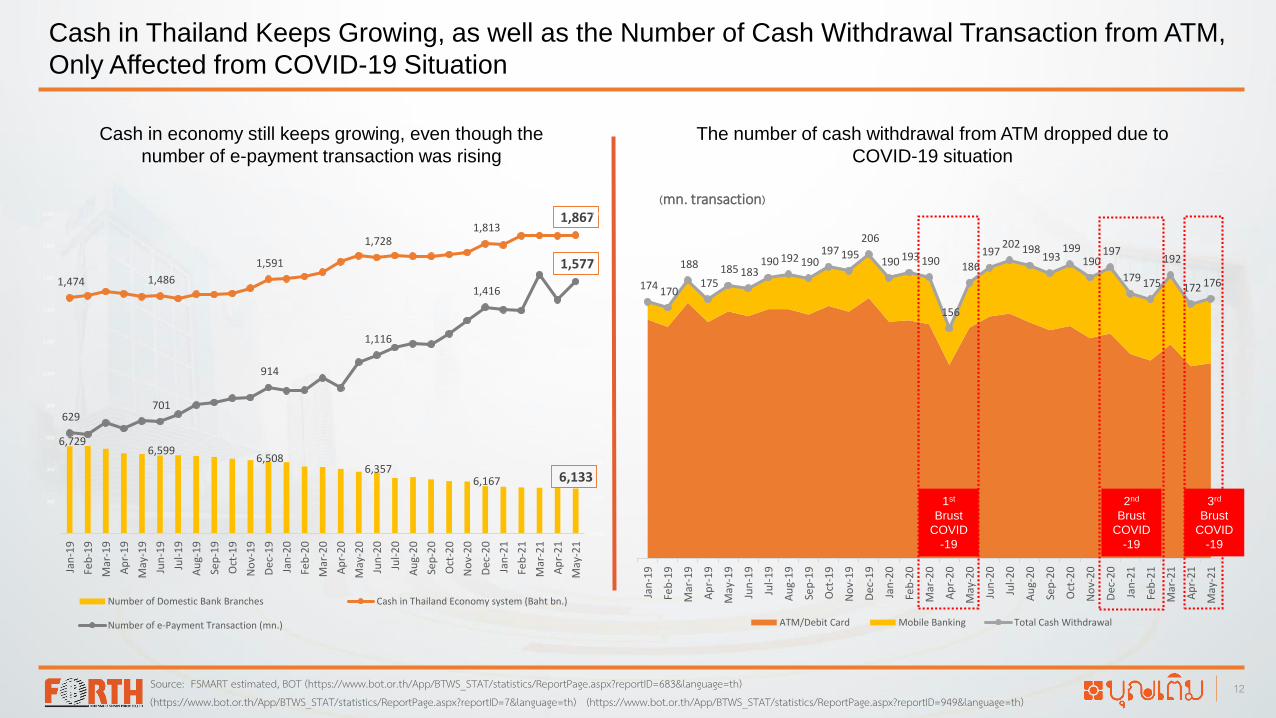
Source: FSMART estimated, BOT (https://www.bot.or.th/App/BTWS_STAT/statistics/ReportPage.aspx?reportID=683&language=th) (https://www.bot.or.th/App/BTWS_STAT/statistics/ReportPage.aspx?reportID=7&language=th) (https://www.bot.or.th/App/BTWS_STAT/statistics/ReportPage.aspx?reportID=949&language=th)
Cash in Thailand Keeps Growing, as well as the Number of Cash Withdrawal Transaction from ATM,
Only Affected from COVID-19 Situation
Cash in economy still keeps growing, even though the
number of e-payment transaction was rising
The number of cash withdrawal from ATM dropped due to
COVID-19 situation
(mn. transaction)
6,729 6,599
6,508 6,357
6,167 6,133
1,474 1,486
1,591
1,728 1,813
1,867
629 701
914
1,116
1,416
1,577
5,500
6,000
6,500
7,000
7,500
8,000
8,500
9,000
9,500
10,000
-
200
400
600
800
1,000
1,200
1,400
1,600
1,800
2,000
Jan
-19
Feb
-19
Mar
-19
Ap
r-1
9
May
-19
Jun
-19
Jul-
19
Au
g-1
9
Sep
-19
Oct
-19
No
v-1
9
Dec
-19
Jan
-20
Feb
-20
Mar
-20
Ap
r-2
0
May
-20
Jun
-20
Jul-
20
Au
g-2
0
Sep
-20
Oct
-20
No
v-2
0
Dec
-20
Jan
-21
Feb
-21
Mar
-21
Ap
r-2
1
May
-21
Number of Domestic Bank Branches Cash in Thailand Economy system (Baht bn.)
Number of e-Payment Transaction (mn.)
12
1st
Brust
COVID
-19
2nd
Brust
COVID
-19
3rd
Brust
COVID
-19

13
Agenda
Business Overview
Business Direction
2Q2021 Operating Results
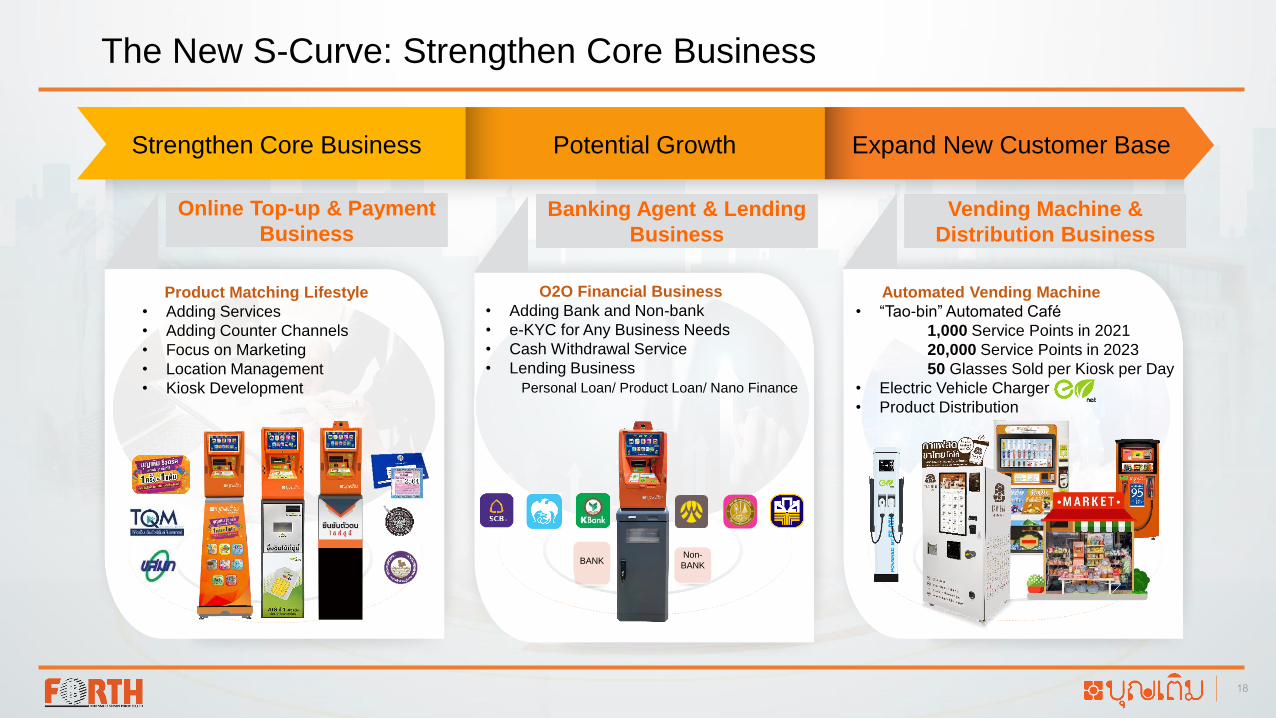
The New S-Curve: Strengthen Core Business
Online Top-up & Payment
Business
Banking Agent & Lending
Business
Vending Machine &
Distribution Business
Product Matching Lifestyle
• Adding Services
• Adding Counter Channels
• Focus on Marketing
• Location Management
• Kiosk Development
O2O Financial Business
• Adding Bank and Non-bank
• e-KYC for Any Business Needs
• Cash Withdrawal Service
• Lending Business
Personal Loan/ Product Loan/ Nano Finance
Automated Vending Machine
• “Tao-bin” Automated Café
1,000 Service Points in 2021
20,000 Service Points in 2023
50 Glasses Sold per Kiosk per Day
• Electric Vehicle Charger
• Product Distribution
BANKNon-
BANK
Strengthen Core Business Potential Growth Expand New Customer Base
18

28,795
28,592
28,211
33,699
34,027
33,907
32,501
32,742
33,249
32,702
30,944
30,705
31,667
31,485
29,558
28,902
27,948
25,890
27,841
27,529
27,087
100 00
300 00
500 00
700 00
900 00
110 000
130 000
-
2,000
4,000
6,000
8,000
10,000
12,000
1Q14 2Q14 3Q14 4Q14 1Q15 2Q15 3Q15 4Q15 1Q16 2Q16 3Q16 4Q16 1Q17 2Q17 3Q17 4Q17 1Q18 2Q18 3Q18 4Q18 1Q19 2Q19 3Q19 4Q19 1Q20 2Q20 3Q20 4Q20 1Q21 2Q21 3Q21 4Q21
2014 2015 2016 2017 2018 2019 2020 2021
Actual
Forecast
Actual in 2Q21
ARPU > 6M Operating Kiosks
Baht 9,621 million in 2Q2021
Avg. Baht 105.7 million per day
2014 2015 2016 2017 2018 2019 2020 2021
Total Transaction Value in 2021 affected by COVID-19 since the Beginning of the year
24,859Kiosks
124,563Kiosks
130,053Kiosks
130,481Kiosks
129,934Kiosks
65,867Kiosks
92,082Kiosks
131,000Kiosks
(Target)
14
COVID-19 COVID-19 COVID-19

40,04568,332166,810
318,226
439,968
602,638
723,983
846,320
821,548
891,968
925,191
975,436
954,173
983,456
1,159,3511,407,181
1,650,528
1,734,915
1,912,918
2,064,715
1,923,248
0
500,000
1,000,000
1,500,000
2,000,000
2,500,000
0
1,000
2,000
3,000
4,000
5,000
2Q
16
3Q
16
4Q
16
1Q
17
2Q
17
3Q
17
4Q
17
1Q
18
2Q
18
3Q
18
4Q
18
1Q
19
2Q
19
3Q
19
4Q
19
1Q
20
2Q
20
3Q
20
4Q
20
1Q
21
2Q
21
3Q
21
4Q
21
Actual Transfer Value Monthly Transaction Number at the End of Quarter
16
Money Transfer Transaction Number Dropped Due to the Ongoing COVID-19 Pandemic Causing
Economic Activities and Income of Populations and Foreign Workers Decreased.
Actual Transfer Value in 4Q20 Forecast Transfer Value
TransactionsBaht million(Total 6 Banks)
1,923,248 Transactions per Month in 2Q21
16.5% YoY
(KTB&KBANK&BAY&GSB)13.3% YoY
COVID-19COVID-19COVID-19
6.9% QoQ
7.2% QoQ

20%
10%
70%
1Q21
Value Share Maintained and Kiosk Leading Position Expanded in 2021
Prepaid
Market Value
Value Share
by Channels
Total Kiosk
Numbers
Source: Mobile Operators Public Information (MD&A), Industry Information, and FSMART Analysis
Number of
Kiosk Share
Bt25,415mn.
56%44%2021F
236K Kiosks(+1K New Boonterm Kiosks)
FSMART expected to be
the only player who
expands more kiosks
and substitutes others’
due to capability to implement new services
19%
9%
72%
2Q21
All Kiosks
Other Channel
Mobile bankingand App
Bt26,033mn.
55%45%
Boonterm Others
2Q21
236K Kiosks
As of June 2021
55%45%1Q21
236K Kiosks
16

2017 2018 2019 2020 2021F 2022F 2023F
18
Depreciation Saving Expected Going onward
Accumulated Fully Depreciated Kiosks Number
Depreciation Costs Saving (Bt mn) 26.7 27.5
516
12,488
19,042
28,526
38,779
64,574
26.7 59.5
5,063

Customer Relationship Management
• “Boonterm Reward” campaign to
retain 20 million Boonterm customers
• Building customer awareness to use
Boonterm’s other service (Currently, 90%
Customers use only 1 service)
To Know – To Use – To Repeat
Adding New Service
Location Management
Upgrading Boonterm kiosks by installing
camera and card reader
To add new services matching lifestyle
• Internet data
• E-wallet
• Sim card distribution
To emphasize on services to maintain
customer numbers and increase the usage according to new normal trend
• Insurance
• Top-up BMTA for public transportation
Superior Automated Kiosk
Efficient kiosk location management and
adding new services in order to increase
ARPU
Online Top-up & Payment Business Focusing on Serving New Services and Strategic Marketing
To add counter channels with new partners
• Services over the counter
19

20
New Channels Providing Services through Counters Over 1,700 Service Points Nationwide
Significant Revenue Growth with Minimal Infra Costs
• All Service from Kiosks to Counters
• 10-15% (Post COVID-19) Top-up Growth
• Minimal Infrastructure Investment
More Services to Come
New Customer Base
• New Services that require Printed
Slips or Face-to-Face Transactions
• Higher Income Group
• New Customer Data
All Services from Kiosks to Counters

NEW
526 559 630
730 793
1,091
1,302
1,471 1,568
1,730
1Q19 2Q19 3Q19 4Q19 1Q20 2Q20 3Q20 4Q20 1Q21 2Q21
E-Wallet Service Expected to Keep Growing Significantly
Total usage amount of E-Wallet service has increased increasing 58.5% YoY, from such change in
customer behavior as well as the use of electronic money and online shopping.
+58.5% YoY
CAGR +14.1% QoQ
As of June 2021 21
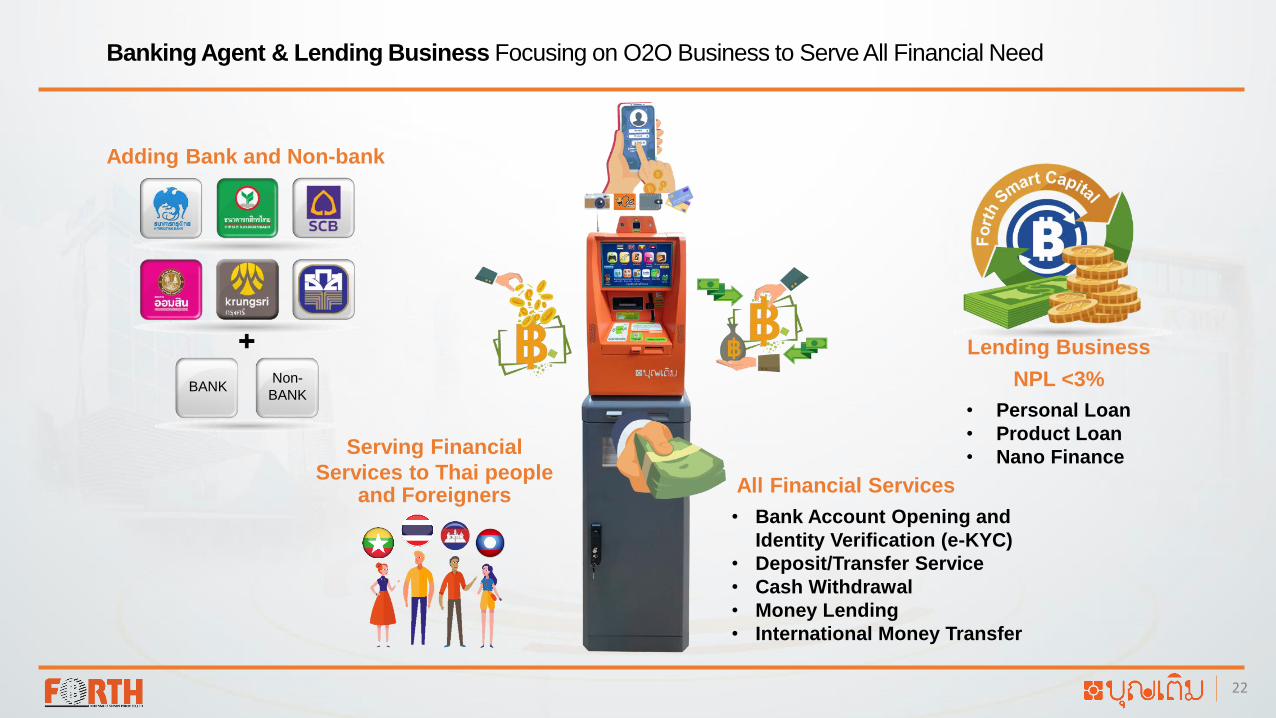
Serving Financial
Services to Thai people and Foreigners
Non-
BANKBANK
Adding Bank and Non-bank
• Bank Account Opening and
Identity Verification (e-KYC)
• Deposit/Transfer Service
• Cash Withdrawal
• Money Lending
• International Money Transfer
Lending Business
NPL <3%
All Financial Services
Banking Agent & Lending Business Focusing on O2O Business to Serve All Financial Need
• Personal Loan
• Product Loan
• Nano Finance
22

FSMART has cooperated with KBANK
to launch money withdrawal service
Boonterm Mini ATM Expected to Have at Least 1% of Withdrawal Market Due to Being Able to
Withdrawal Small Amount and Placed in Prime Locations Analyzed from Big Data
Boonterm Mini ATM
23
Number of Kiosks (in thousand)
Money Deposit and Withdrawal Market (mn txn./month)
Money withdrawal is 8 times more frequent than money deposit
Starts from 20 Baht
(Collecting fee Bt.30 per txn.)
Money Withdrawal Service
Mini ATMs expected to expand 200 kiosks in 2021 and 10,000
kiosks onward and located in places in rural area, which are
convenient and easy to access
Service Market Boonterm %
Deposit 20 1.9 10%
Withdrawal 180 1.8-2 1%
Kiosk Market Boonterm
CDM
58
130
ATM 10
BANKNon-
BANK
Withdrawal Service of All Banks and Non-Banks

0.98
1.16
1.41
1.651.73
1.91
2.06 1.92
3Q19 4Q19 1Q20 2Q20 3Q20 4Q20 1Q21 2Q21 2019 2020 2021F
63.1%
24
e-KYC
Money Withdrawal
Banking Agent
16.5% YoY
19.4 mn
11.9 mn
30%+
Further Transaction Numbers Growth by Becoming Full Automated Banking Agent
Average Transaction Number per Month Transaction Number per Year
Foreigners
Remark: The number of transaction dropped in 2Q2021 due to the ongoing COVID-19 pandemic and government travel restriction causing economic activity decreased and negatively impacts both incomes and household debt of middle-to-low-income populations and foreign workers.

25
Lending Business to Provide 250 Million Baht Credit in 2021 and Synergy with Strong Partners to
Expand Customer Base in Lending Market
151183
204
89
163
250
93 88 95
2Q20 1Q21 2Q21 2019 2020 2021F
Lending Amount (Bt mn)
Loan Amount Credit Outstanding Loan Amount (Forcast)
35.1% YoY
11.5% QoQ
NPL 2.9% (Target NPL< 3%)
As of June 2021
Cooperating with new partners by using big data
to launch new services
Product Loan

100+ Beverage Menu• Water heater
• Ice and soda maker• 20+ Ingredient slots
100% Consistency
Tasty Drinks
Drink Customization
• Created by expert barista
• Sweetness choice
• Extra coffee shot
• Weighing and measuring
ingredient every glass
Payment Method
Online Real-time Management• Collecting points for promotion• All-time ingredient refilled and kiosk maintained
• Customer data analyzed for new products and
CRM for marketing plan
• Coin and banknote accepted
• All electronic payment methods (QR code
payment system, e-money, e-coupon)
Camera and Card Reader
Service in Every Kiosk
Tao Bin Automatic Café Ready to Expand to Serve Everyone with Superior Competitive Advantages
26

100+ Beverage Menu
Tao Bin Serving Happiness to Everyone 24/7 without Curfew with 100+ Fantastic Drinks and Being
Clean and Safe from Making a Contact with Others
27
Energy Drink
Hemp Beverage
Ginger DrinkDirty Coffee

60% Gross Margin
10 Billion Baht per year
30 Million Baht per day
1 Million Glasses per day
20,000 Kiosks
in 2023
50 Glasses per Kiosk per Day
Revenue on Avg.30Bt. per Glass
Significant Revenue
Revenue – Material Cost
Collecting Management Fee
Boonterm Service Point
Dividend from Net Profit,
19.34% of FVD
Tao Bin Automatic Café Having its Competitiveness to Compete Bt.200 billion Beverage Market and
Expect to Have 5% of Market
28

Hospital
( 7 service points )Office Building
( 6 service points )Condominium
( 85 service points )Canteen
( 2 service points )
High Market Acceptant with Over 100 Locations and 50 Glasses per Day per Location
Revenue by Segment Contribution(Over 50%* of Revenues is from Coffee and Tea)
Tao Bin automatic cafés located in many places
Coffee Protein
Milk Soda
Fruity
Tea
33%
21%20%
19%
4%3%
100
29
0.4 2.7
49,535 52,297
200 00
250 00
300 00
350 00
400 00
450 00
500 00
550 00
600 00
-
0.5
1.0
1.5
2.0
2.5
3.0
3.5
4.0
4.5
5.0
1Q21 2Q21
Sales (mn) No. of Service Points ARPU (Bt per month) *As of August 2021
Today
12 64

129,934 131,000 136,000
4,300 5,30015,300
38,632 39,00042,000
2020 2021F 2022F
No. Of Kiosks No. Of Vending Machine Top-up Value
30
Sustainable Growth from New Businesses Contribution
No. of Kiosks and
Top-up Value (Bt mn.)
Contribution 2020 2021F 2022F
Top-up and Payment 69% 59% 50-55%
Banking Agent and Lending 30% 40% 40-45%
Distribution Platform 1% 1% 5-10%
+1-5% YoY+ 5-10% YoY

Updated 2021 CAPEX of 300 Million Baht
31
New Boonterm Kiosk Boonterm Mini ATM
Incremental Lending Automatic Café “Tao Bin”
200 KiosksIn 2021
10,000 Kiosks Onward
100-200
Million Baht
1,000 KiosksIn 2021
(Investment in Joint Venture)
20,000 Kiosks in 3 Years
1,000 KiosksIn 2021

32
Agenda
Business Overview
Business Direction
2Q2021 Operating Results

41,981 40,496 38,632
32
4,631 4,229 3,889
174 209
198
1,091 1,568 1,730
257 250 259
2,741 3,209 3,384
180 162 161
2Q2020 1Q2021 2Q2021
Total Transaction Value was Bt9,621mn with the Covid-19 pandemic since the beginning of this quarter. The Online Top-up and Payment Business has
been pressured by the decrease of pre-paid market size and customers’ behavior to stay at their home. However, e-Wallet top-up was Bt1,730mn, increasing
58.5% yoy and money transfer service was Bt3,384mn, increasing 23.5% yoy.
Remark : Usage Amount = Service Amount + Service Charge
Baht Million
0.0% QoQ
9,074 9,627 9,621
Transaction Value by Service – Covid-19 Pandemic
30,674 27,129
19,804
412
833
794
1,760
2,445
4,657
1,470
1,595
1,254
7,111 7,833
11,425
553 660
698
2018 2019 2020
67%
51%
40%
2%
2%
2%
6%
12%
18%
4%
3%
3%
19%
30%35%
2% 2% 2%
2019 2020 1H2021
Other
Money Transfer
Bill Payment
E-Wallet
Vas (Data)
Mobile Top-ip
4.6% YoY 6.0% YoY
Total transaction Value

3,3393,147
2,859
667 707 716
2018 2019 2020 2Q20 1Q21 2Q21
34
Financial Performance – Covid-19 Pandemic
Revenue (Bt mn)
57.1%48.2% 45.4%
2.2%
2.7% 2.6%
17.1% 23.2% 25.3%
2.3% 2.0% 0.8%
19.5% 22.8% 23.9%
1.1% 2.3% 2.0%
2Q20 1Q21 2Q21
Mobile Top up VAS (Data) E-Wallet
Bill payment Money Transfer Others
% Revenue by Services
• Revenue increasing 7.4% yoy due to increase in total usage amount. Revenue from money transfer transactions and e-wallet has grown continually, accounted
for 23.9% and 25.3% respectively.
9.2% yoy
7.4% yoy
1.3% qoq
33
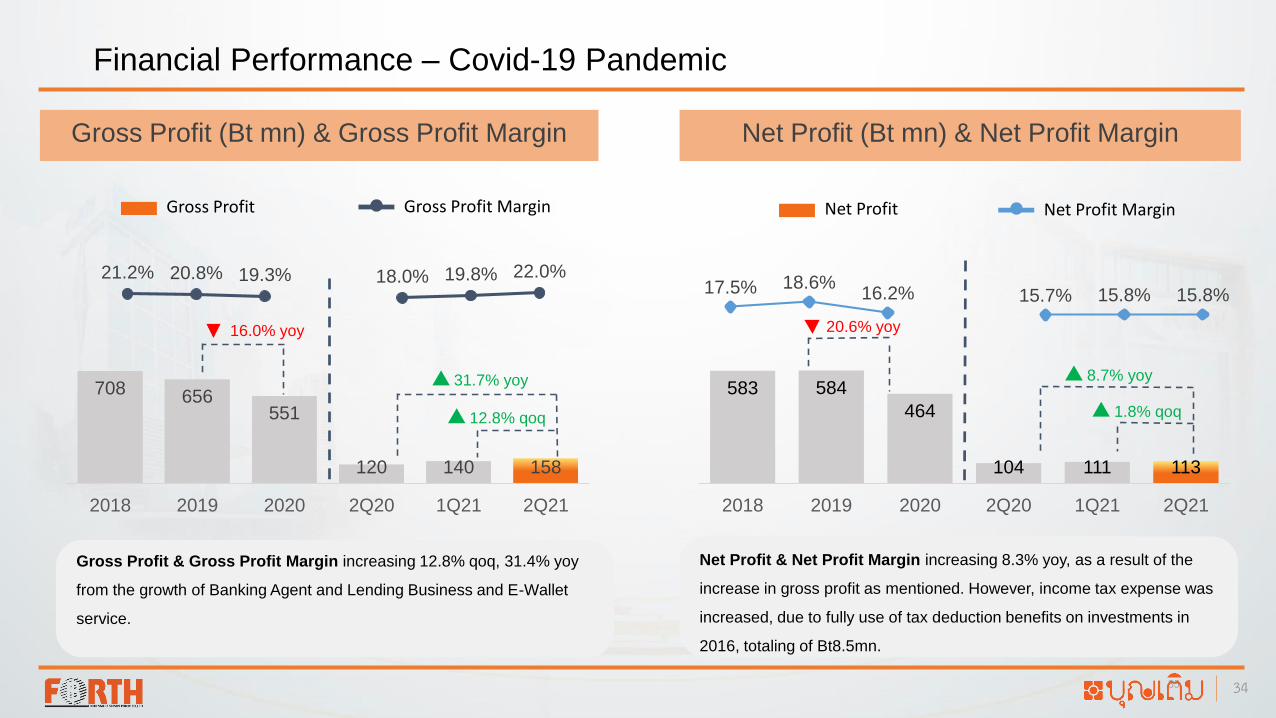
708 656551
120 140 158
2018 2019 2020 2Q20 1Q21 2Q21
12.8% qoq
35
583 584
464
104 111 113
2018 2019 2020 2Q20 1Q21 2Q21
17.5% 18.6%16.2% 15.7% 15.8% 15.8%
Net Profit
Net Profit (Bt mn) & Net Profit Margin
Net Profit Margin Gross Profit
Gross Profit (Bt mn) & Gross Profit Margin
Gross Profit Margin
Gross Profit & Gross Profit Margin increasing 12.8% qoq, 31.4% yoy
from the growth of Banking Agent and Lending Business and E-Wallet
service.
Net Profit & Net Profit Margin increasing 8.3% yoy, as a result of the
increase in gross profit as mentioned. However, income tax expense was
increased, due to fully use of tax deduction benefits on investments in
2016, totaling of Bt8.5mn.
21.2% 20.8% 19.3% 18.0% 19.8% 22.0%
Financial Performance – Covid-19 Pandemic
16.0% yoy 20.6% yoy
8.7% yoy31.7% yoy
1.8% qoq
34

36
1,251 1,336 1,149 1,142 1,260 1,147
1,245 941 1,003 974 451 547
1,4201,243 1,302 1,210
1,293 1,274
2018 2019 2020 2Q20 1Q21 2Q21
Asset (Bt mn) Liabilities and Equity (Bt mn)
Other liabilities EquityIBD
3,9163,520 3,454 3,326
3,004 2,968
2018 2019 2020 2Q20 1Q21 2Q21
Asset decreased due to cash decreased from debt repayment by
Bt456mn and fully depreciated assets.
Liabilities decreased due to:
• a result of interest bearing debt decreased by bt456mn from the
end of 2020
Equity decreased due to:
• dividend payment, totaling Bt226mn.
Financial Performance
1.2% qoq
35

37
45.1% 45.2%
37.4%42.0%
37.3% 39.8%
14.3% 15.7% 13.3% 15.2% 13.9% 14.2%
2018 2019 2020 2Q20 1Q21 2Q21
ROE ROA
2.12
1.64
2.01 1.91
1.381.59
0.990.70
0.87 0.85
0.36 0.48
2018 2019 2020 2Q20 1Q21 2Q21D/E IBD/E
ROE / ROA Debt to Equity & Interest Bearing Debt to Equity
ROA was 14.2%, decreasing yoy from the decrease in LTM net profit. The
Company still focuses on managing assets to increase the asset utilization
efficiency.
ROE was 39.8% decreasing yoy from the decrease in LTM net profit. The
Company still manage to pay dividends to shareholders 2 times a year
continuously.
Debt to Equity ratio was 1.59x, decreasing yoy from the decrease in the interest-
bearing debt from the end of 2020.
Financial Performance
Interest Bearing Debt to Equity was 0.48x, decreasing from the decrease of
interest-bearing debt from the end of 2020.
36

Financial Performance
Operating Cash Flow 694 Investment in Fixed Assets 72
Interest Earned and Other 6 Investment in Forth Vending 35
Cash Decrease 129 Liability and Interest Payments 466
Dividend Paid 226
Income Tax Paid 30
Total 829 829
Source of Fund Use of Fund
37

Thank YouWebsite : www.boonterm.comFacebook : บุญเติม ตู้เติมเงินออนไลน์Line : @boonterm.thYoutube : boonterm.official