functional barriers against mineral oil from paper and ... · pdf filedlg expert report...
TRANSCRIPT
www.DLG.org
DLG Expert report 10/2016Functional barriers against mineral oil from paper and cardboard packaging materials
2
DLG Expert report 10/2016
Introduction
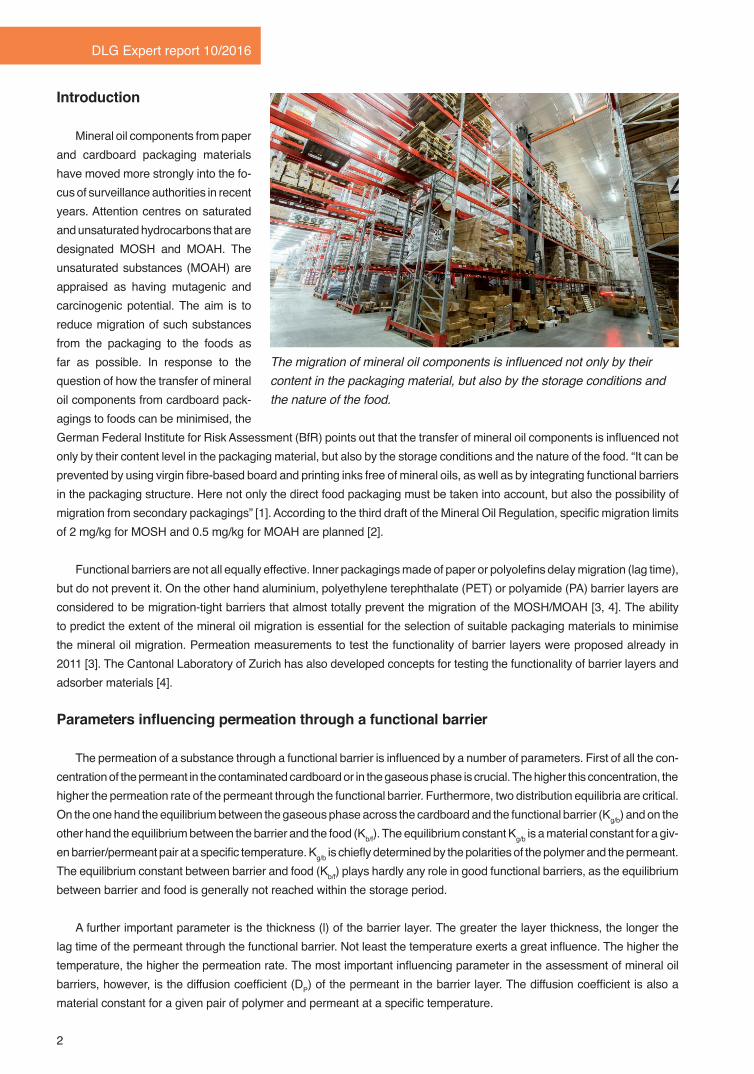
Mineral oil components from paper and cardboard packaging materials have moved more strongly into the fo-cus of surveillance authorities in recent years. Attention centres on saturated and unsaturated hydrocarbons that are designated MOSH and MOAH. The unsaturated substances (MOAH) are appraised as having mutagenic and carcinogenic potential. The aim is to reduce migration of such substances from the packaging to the foods as far as possible. In response to the question of how the transfer of mineral oil components from cardboard pack-agings to foods can be minimised, the German Federal Institute for Risk Assessment (BfR) points out that the transfer of mineral oil components is influenced not only by their content level in the packaging material, but also by the storage conditions and the nature of the food. “It can be prevented by using virgin fibre-based board and printing inks free of mineral oils, as well as by integrating functional barriers in the packaging structure. Here not only the direct food packaging must be taken into account, but also the possibility of migration from secondary packagings” [1]. According to the third draft of the Mineral Oil Regulation, specific migration limits of 2 mg/kg for MOSH and 0.5 mg/kg for MOAH are planned [2].
Functional barriers are not all equally effective. Inner packagings made of paper or polyolefins delay migration (lag time), but do not prevent it. On the other hand aluminium, polyethylene terephthalate (PET) or polyamide (PA) barrier layers are considered to be migration-tight barriers that almost totally prevent the migration of the MOSH/MOAH [3, 4]. The ability to predict the extent of the mineral oil migration is essential for the selection of suitable packaging materials to minimise the mineral oil migration. Permeation measurements to test the functionality of barrier layers were proposed already in 2011 [3]. The Cantonal Laboratory of Zurich has also developed concepts for testing the functionality of barrier layers and adsorber materials [4].
Parameters influencing permeation through a functional barrier
The permeation of a substance through a functional barrier is influenced by a number of parameters. First of all the con-centration of the permeant in the contaminated cardboard or in the gaseous phase is crucial. The higher this concentration, the higher the permeation rate of the permeant through the functional barrier. Furthermore, two distribution equilibria are critical. On the one hand the equilibrium between the gaseous phase across the cardboard and the functional barrier (Kg/b) and on the other hand the equilibrium between the barrier and the food (Kb/f). The equilibrium constant Kg/b is a material constant for a giv-en barrier/permeant pair at a specific temperature. Kg/b is chiefly determined by the polarities of the polymer and the permeant. The equilibrium constant between barrier and food (Kb/f) plays hardly any role in good functional barriers, as the equilibrium between barrier and food is generally not reached within the storage period.
A further important parameter is the thickness (l) of the barrier layer. The greater the layer thickness, the longer the lag time of the permeant through the functional barrier. Not least the temperature exerts a great influence. The higher the temperature, the higher the permeation rate. The most important influencing parameter in the assessment of mineral oil barriers, however, is the diffusion coefficient (DP) of the permeant in the barrier layer. The diffusion coefficient is also a material constant for a given pair of polymer and permeant at a specific temperature.
The migration of mineral oil components is influenced not only by their content in the packaging material, but also by the storage conditions and the nature of the food.
3
Functional barriers against mineral oil from paper and cardboard packaging materials
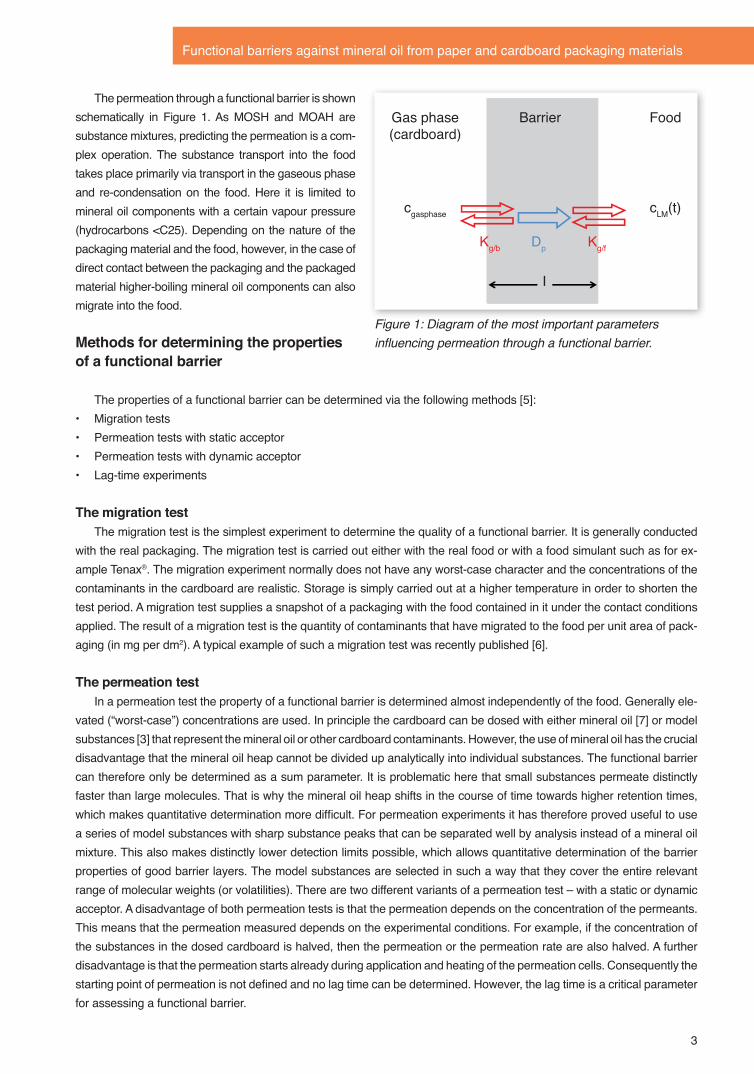
The permeation through a functional barrier is shown schematically in Figure 1. As MOSH and MOAH are substance mixtures, predicting the permeation is a com-plex operation. The substance transport into the food takes place primarily via transport in the gaseous phase and re-condensation on the food. Here it is limited to mineral oil components with a certain vapour pressure (hydrocarbons <C25). Depending on the nature of the packaging material and the food, however, in the case of direct contact between the packaging and the packaged material higher-boiling mineral oil components can also migrate into the food.
Methods for determining the properties of a functional barrier
The properties of a functional barrier can be determined via the following methods [5]:• Migration tests• Permeation tests with static acceptor • Permeation tests with dynamic acceptor• Lag-time experiments
The migration testThe migration test is the simplest experiment to determine the quality of a functional barrier. It is generally conducted
with the real packaging. The migration test is carried out either with the real food or with a food simulant such as for ex-ample Tenax®. The migration experiment normally does not have any worst-case character and the concentrations of the contaminants in the cardboard are realistic. Storage is simply carried out at a higher temperature in order to shorten the test period. A migration test supplies a snapshot of a packaging with the food contained in it under the contact conditions applied. The result of a migration test is the quantity of contaminants that have migrated to the food per unit area of pack-aging (in mg per dm2). A typical example of such a migration test was recently published [6].
The permeation testIn a permeation test the property of a functional barrier is determined almost independently of the food. Generally ele-
vated (“worst-case”) concentrations are used. In principle the cardboard can be dosed with either mineral oil [7] or model substances [3] that represent the mineral oil or other cardboard contaminants. However, the use of mineral oil has the crucial disadvantage that the mineral oil heap cannot be divided up analytically into individual substances. The functional barrier can therefore only be determined as a sum parameter. It is problematic here that small substances permeate distinctly faster than large molecules. That is why the mineral oil heap shifts in the course of time towards higher retention times, which makes quantitative determination more difficult. For permeation experiments it has therefore proved useful to use a series of model substances with sharp substance peaks that can be separated well by analysis instead of a mineral oil mixture. This also makes distinctly lower detection limits possible, which allows quantitative determination of the barrier properties of good barrier layers. The model substances are selected in such a way that they cover the entire relevant range of molecular weights (or volatilities). There are two different variants of a permeation test – with a static or dynamic acceptor. A disadvantage of both permeation tests is that the permeation depends on the concentration of the permeants. This means that the permeation measured depends on the experimental conditions. For example, if the concentration of the substances in the dosed cardboard is halved, then the permeation or the permeation rate are also halved. A further disadvantage is that the permeation starts already during application and heating of the permeation cells. Consequently the starting point of permeation is not defined and no lag time can be determined. However, the lag time is a critical parameter for assessing a functional barrier.
Figure 1: Diagram of the most important parameters influencing permeation through a functional barrier.
Gas phase(cardboard)
Barrier
I
Food
cgasphase cLM(t)
Kg/b Dp Kg/f

4
DLG Expert report 10/2016
Permeation test with static acceptorIn this permeation test the functional barrier is located between a dosed reservoir and an acceptor material. The entire
permeated quantity is caught on the acceptor material. A small quantity of the acceptor material is removed at regular inter-vals and examined for the permeant content. Based on the increase of the permeant over time, a permeation kinetic profile can be drawn up [3, 8, 9]. The actual measured value is the cumulative quantity of permeants per unit area packaging (in mg/dm2). There are two distribution equilibria in the permeation test with a static acceptor, on the one hand between the dosed cardboard or the gaseous phase across it and the barrier material (Kg/b), and on the other hand between the barrier and the acceptor (Kb/f). The latter depends on the acceptor material (e.g. silicone paper, polyethylene film or simply a filter paper) and is not necessarily just as large as in the case of a food.
Permeation test with dynamic acceptorIn this permeation test a continuous gas flow replaces the acceptor material. The gas flow carries the permeated quantity
along with it and catches this on a strongly cooled analytical trap. At short intervals the analytical trap is therefore desorbed quickly and injected directly into the gas chromatograph. The result supplied by this method is the permeation rate, in other words the permeated quantity per unit of time and area of packaging (in µg/d dm2). By comparison with the method using a static acceptor, this method does not detect the cumulative quantity of permeants, but instead the quantity per measuring interval. The advantage of this is that it is possible to ascertain very simply when the stationary condition is reached. The permeated quantity per measuring interval (or the permeation rates) are then constant [3]. No equilibrium develops between the barrier material and the acceptor in the permeation test with dynamic acceptor. The partition coefficient between the barrier and the acceptor (Kb/f) can therefore be neglected.
The lag time experimentThe lag time experiment is a continuation of the permeation test with a dynamic acceptor. The apparatus design is
almost the same, however it does not work with dosed cardboard but instead with a constant concentration in the gas-eous phase. This means that the complete system can be built up and conditioned at the measuring temperature. At a pre-defined time the measurement is then started either by changing over to a dosed gas flow or by injecting the permeant through a septum. Consequently the starting point of permeation is established precisely and the lag time can be deter-mined. Then the diffusion coefficient DP can be determined from the lag time [10]. Furthermore, the partition coefficient Kg/b can be determined from the rise of the permeation curve over time. As both DP and Kg/b are material constants that are no longer dependent on the concentration of the substances used, the concentration of the permeants can be set in an optimal concentration range. As in the permeation test with a dynamic acceptor, the value actually measured in the lag time experiment is the permeation rate.
Evaluation of the functional barrier
First of all it should be noted that neither the lag time determined nor the permeation rate determined possess any general informative value. A short lag time (high diffusion coefficient) combined with a very low permeation rate (favourable partition coefficient) supplies a passable barrier despite the fast breakthrough because ultimately the concentration in the food is critical. On the other hand, in the case of a long lag time (low diffusion coefficient) the boundary value for perme-ation can be exceeded despite this if the permeation rate (unfavourable partition coefficient) is correspondingly high after the breakthrough. For evaluation of a functional barrier, therefore, the diffusion coefficient (DP) and the partition coefficient between the gaseous phase and the functional barrier (Kg/b) are crucial.
A further problem in evaluating a functional barrier is that mineral oil contaminants represent complex mixtures that cannot be divided up into individual substances in experiments. Therefore in principle it is not possible to determine the permeation rates or the diffusion or partition coefficients. One possible solution here lies in segmenting the mineral oil heap. For this the mineral oil heap is overlaid by individual model substances, for example alkanes, and their permeation rates, diffusion coefficients or partition coefficients are determined in each case. The diffusion data determined experimentally for the respective previous model substance are used for the sum of the following undissolved mineral oil substances (Figure

5
Functional barriers against mineral oil from paper and cardboard packaging materials
2). With the help of this segmentation it is possible to produce a description of the permeation behaviour of a complex substance mixture.
Evaluation criterion 1 % breakthroughOne simple evaluation criterion is the percentage quantity that permeates through a functional barrier [4]. Here the per-
meation in per cent of the available (dosed) quantity in the cardboard is stated. A maximum transfer of 1% of the available quantity of mineral oil in the cardboard was fixed as maximum permeation. The storage period at which a breakthrough of 1% of the dosed quantity of the contaminants occurs is accordingly determined with the experimental tests. When fixing this criterion, it is assumed that the typical mass ratio between cardboard and food is about 1: 10. The total quantity of a (model) contaminant is transferred into the food. If a concentration of 10 µg of a permeant per kg in the food is accepted as uncritical, then there can thus be a maximum of 0.1 mg/kg mineral oil in the cardboard. If a functional barrier now only allows 1% of the total quantity of contaminants through under the given storage conditions, the maximum concentration in the cardboard can now be 10 mg/kg. The advantage of this evaluation method is that the concentration in the cardboard can be used as monitoring parameter. The goal is therefore to keep the concentration of contaminants below 10 mg/kg. Here, though, the evaluation only applies for the test conditions applied. The results can however be converted to other temperatures with the help of the Arrhenius equation.
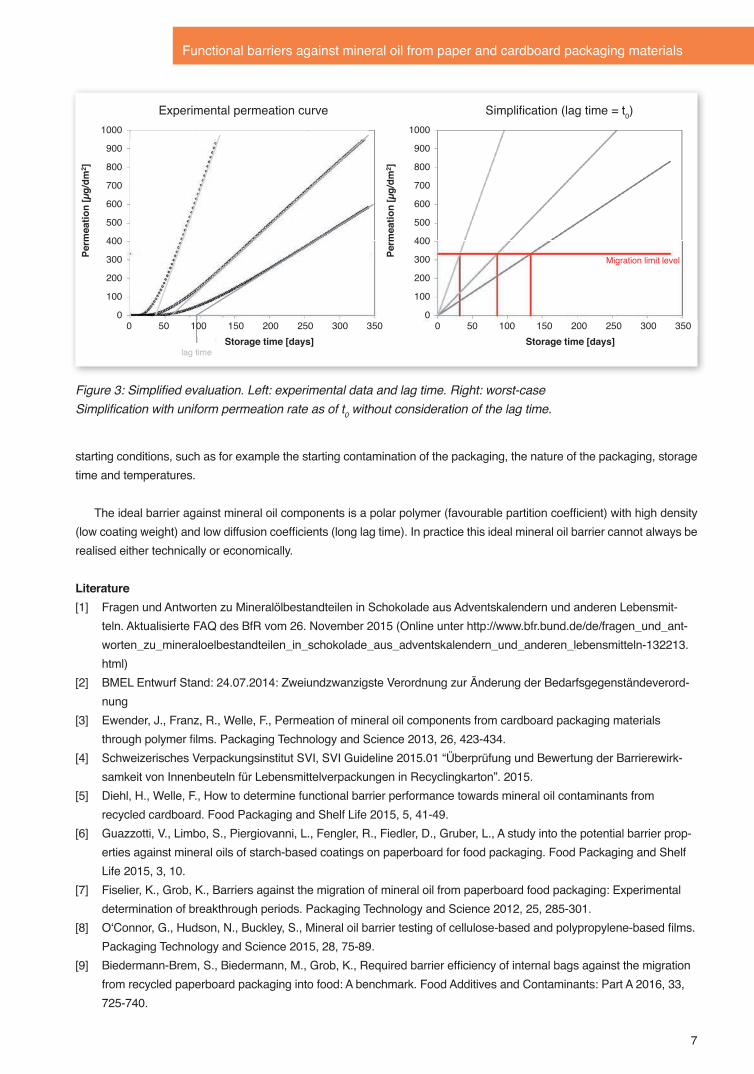
Evaluation of the permeation rate neglecting the lag timeA further simple evaluation method is based on experimentally determined permeation rates [11] and uses the specific
migration limit levels, for example 2 mg/kg MOSH or 0.5 mg/kg MOAH [2]. In this evaluation method it is assumed that the permeation takes place from the first minute onwards at a constant permeation rate (no lag time). This results in over-esti-mation of the permeation. If the permeation rate for a permeant and a barrier is known, the time up to reaching the specific migration limit level tSML can be calculated in accordance with the following equation. However, here too the evaluation is only valid for the test conditions applied.
Figure 2: Example of the segmentation of the MOSH mineral oil heap measured (blue) by means of model substances (red, alkanes C10-C40)
C10
C14
C40
n-Alkane StandardsMOSH fraction
1000
900
800
700
600
500
400
300
200
100
06 8 10 12 14 16 18 20 22 24 26

6
DLG Expert report 10/2016
Equation 1: tSML = SML mLM
P A
tSML: Time up to reaching SML (in days) SML: Specific migration limit (in µg/kg food)mLM: Weight of the food (in kg)P: Permeation rate (determined by experiment in µg/d dm2)A: Contact area of the packaging material (in dm2)
Evaluation via diffusion and partition coefficientThe permeation of a contaminant into a food can be calculated directly from experimentally determined diffusion
coefficients and partition coefficients. As both the diffusion coefficient and the partition coefficient represent material con-stants at a given temperature, these parameters can be determined once for a barrier polymer. After this, the permeation can be calculated for all possible barrier thicknesses and packaging geometries. The more precisely the diffusion and partition coefficients were determined, the more precisely a prediction can be made. As no worst case scenario is applied for this system, an additional safety factor should be included in the calculation. Shorter storage periods (minimum shelf life) than those calculated can be applied, or the diffusion coefficient can be increased slightly for the calculation. Diffu-sion coefficients can be estimated from the molecular volume in the case of substances that can no longer be captured by measurement [10].
Conclusions
Predicting the extent of the mineral oil permeation through a functional barrier is essential for selecting appropriate packaging materials. However, migration and permeation experiments can only be used for generally valid assessment of the properties of a barrier to a limited extent, because the results depend on the framework conditions applied (concentra-tion of the model substances, temperature, packaging area). This limits the informative value of the evaluation of functional barriers and makes comparisons between the results obtained by different laboratories difficult. On the other hand the material constants – diffusion and partition coefficients – obtained through the lag time experiment make it possible, to describe the properties of a functional barrier extensively via a mathematical evaluation. For real packaging scenarios the contamination limit level of foods with mineral oil components following a certain time can be predicted on the basis of the
Table 1: Experimentally determined permeation rates at 40 °C [11]
Compound Model component for
b.p.[°C]
Permeation rate [µg/d dm2]
BOPP 20 µm BOPP 20 µm metallised
EVOH 20 µm
Acrylic 31 µm
PVDC/Acrylic 25 µm
BOPET 12 µm
Dodecane MOSH 216 4900 1640 0.02 1.43 1.51 0.010Naphthalene MOAH 218 693 395 0.009 0.44 0.39 0.0101-Methylnaphthalene MOAH 243 1590 808 <0.006 0.98 0.79 <0.006Tetradecane MOSH 254 1390 1250 0.014 3.90 4.05 0.0081-Ethylnaphthalene MOAH 260 1000 690 <0.006 1.90 1.57 <0.0062,7-Diiso-propylnapht-halene
MOAH 279 88.0 79.5 <0.006 1.30 1.45 <0.006
TXIB Photoinitiators 280 244 103 <0.009 0.25 0.26 0.015Hexadecane MOSH 287 238 275 0.008 3.85 6.14 <0.006Benzophenone Photoinitiators 305 68.0 76.5 0.008 0.21 0.26 <0.007Octadecane MOSH 317 33.0 31.5 0.010 2.61 4.02 0.0094-Methylbenzophenone Photoinitiators 326 22.0 22.5 0.017 1.27 0.59 0.017Phenanthrene MOAH 336 32.0 31.5 <0.006 1.37 1.00 <0.006Eicosane MOSH 343 5.51 4.95 <0.006 0.76 1.17 <0.006Docosane MOSH 369 1.02 0.90 <0.007 0.11 0.11 <0.007Tetracosane MOSH 391 <0.03 <0.03 <0.007 <0.007 <0.007 <0.007
7
Functional barriers against mineral oil from paper and cardboard packaging materials
starting conditions, such as for example the starting contamination of the packaging, the nature of the packaging, storage time and temperatures.
The ideal barrier against mineral oil components is a polar polymer (favourable partition coefficient) with high density (low coating weight) and low diffusion coefficients (long lag time). In practice this ideal mineral oil barrier cannot always be realised either technically or economically.
Literature[1] Fragen und Antworten zu Mineralölbestandteilen in Schokolade aus Adventskalendern und anderen Lebensmit-
teln. Aktualisierte FAQ des BfR vom 26. November 2015 (Online unter http://www.bfr.bund.de/de/fragen_und_ant-worten_zu_mineraloelbestandteilen_in_schokolade_aus_adventskalendern_und_anderen_lebensmitteln-132213.html)
[2] BMEL Entwurf Stand: 24.07.2014: Zweiundzwanzigste Verordnung zur Änderung der Bedarfsgegenständeverord-nung
[3] Ewender, J., Franz, R., Welle, F., Permeation of mineral oil components from cardboard packaging materials through polymer films. Packaging Technology and Science 2013, 26, 423-434.
[4] Schweizerisches Verpackungsinstitut SVI, SVI Guideline 2015.01 “Überprüfung und Bewertung der Barrierewirk-samkeit von Innenbeuteln für Lebensmittelverpackungen in Recyclingkarton”. 2015.
[5] Diehl, H., Welle, F., How to determine functional barrier performance towards mineral oil contaminants from recycled cardboard. Food Packaging and Shelf Life 2015, 5, 41-49.
[6] Guazzotti, V., Limbo, S., Piergiovanni, L., Fengler, R., Fiedler, D., Gruber, L., A study into the potential barrier prop-erties against mineral oils of starch-based coatings on paperboard for food packaging. Food Packaging and Shelf Life 2015, 3, 10.
[7] Fiselier, K., Grob, K., Barriers against the migration of mineral oil from paperboard food packaging: Experimental determination of breakthrough periods. Packaging Technology and Science 2012, 25, 285-301.
[8] O‘Connor, G., Hudson, N., Buckley, S., Mineral oil barrier testing of cellulose-based and polypropylene-based films. Packaging Technology and Science 2015, 28, 75-89.
[9] Biedermann-Brem, S., Biedermann, M., Grob, K., Required barrier efficiency of internal bags against the migration from recycled paperboard packaging into food: A benchmark. Food Additives and Contaminants: Part A 2016, 33, 725-740.
Figure 3: Simplified evaluation. Left: experimental data and lag time. Right: worst-case Simplification with uniform permeation rate as of t0 without consideration of the lag time.
Migration limit level
lag time
Experimental permeation curve Simplification (lag time = t0)
Storage time [days] Storage time [days]
Perm
eatio
n[µ
g/dm
2 ]
Perm
eatio
n[µ
g/dm
2 ]
1000
900
800
700
600
500
400
300
200
100
0
1000
900
800
700
600
500
400
300
200
100
00 50 100 150 200 250 300 350 0 50 100 150 200 250 300 350

8
DLG Expert report 10/2016
[10] Ewender, J., Welle, F., Determination and prediction of the lag times of hydrocarbons through a polyethylene terephthalate film. Packaging Technology and Science 2014, 27, 963-974.
[11] Ewender, J., Langowski, H.-C., Welle, F., Functional barriers towards mineral oil contaminants - Evaluation of alternatives to PET and PA. Verpackungs-Rundschau, Technisch-wissenschaftliche Beilage, 2015, 50-51.
Authors
Johann Ewender, Romy Fengler, Roland Franz, Ludwig Gruber, Frank Welle, Fraunhofer Institute for Process Engineering and Packaging, Giggenhauser Strasse 35, 85354 Freising, [email protected]
Contact:
Dr.-Ing. Annette Schmelzle, DLG Competence Center Food, [email protected] In cooperation with the DLG Committee for Food Technology.
© 2016All information and references are provided without any guarantee or liability. Any reproduction and transmission of individual text sections,drawings or pictures – even for educational purposes – requires the prior consent of DLG e.V., Service Department Communication,Eschborner Landstrasse 122, 60489 Frankfurt am Main.
www.DLG.org
DLG-Expertenwissen 3/2010Sensorische Analyse: Methoden-überblick und Einsatzbereiche Teil 4: Beschreibende Prüfungen
2010_3_EW_Sensorik4.indd 1 09.01.17 14:13
DLG e.V. Competence Center FoodEschborner Landstr. 122 · 60489 Frankfurt am Main · GermanyTel. +49 69 24788-311 · Fax +49 69 [email protected] · www.DLG.org
DLG Expert report: concise information on topical issues in the food industry
Expertise, trends and strategies first-hand. The DLG produces numerous publi-cations informing readers about current issues and developments in the fields of food technology, quality management, sensory analysis and food quality.In the “DLG Expert report” series, experts tackle current issues and provide con-cise information and assistance.
Individual editions of DLG Expert report are available as downloads at www.DLG.org/publikationen.html.
Further information on DLG Expert report: DLG e.V., Marketing, Guido Oppenhäuser, email: [email protected] www.DLG.org
DLG Expert report 14/2015
Steviol Glycosides – Compact Knowledge
www.DLG.org
DLG Expert report 2/2016
Focus on mycotoxins
2016_2_EW_Mykotoxine_e.indd 1 27.01.17 07:20