full year results 2016 - avjenningsinvestors.avjennings.com.au/.../presentation-fy16.pdf · full...
TRANSCRIPT

Full Year Results 2016
18 August 2016
Your Community Developer

avjennings.com.au
Contents
Highlights 3
Results and capital management 4
Business model and strategy 10
Project portfolio 20
Industry and company outlook 26
Appendices 28
2

avjennings.com.au
FY16 Highlights
STRONG FINANCIAL
GROWTH
Revenue +32.7%
PBT +22.0%
EPS +18.6%
SUSTAINABLE OPERATIONS
Contract signings (lots) +5.5%; WIP +11.2% Geographically diverse project pipeline in urban growth
corridors Traditional housing undersupplied; Stable and domestic
customer profile; Affordable product
INCREASED SHAREHOLDER
RETURNS
Fully franked final dividend of 3.5 cents
Interim + final dividend is 5 cents fully franked (+25%), yielding ~7.5% at current prices
3 consecutive years of dividend growth
FINANCIAL FLEXIBILITY MAINTAINED
Gearing at 17.9%
$250 million ‘Club’ banking facility extended to Sept ’18
Healthy and stable product pipeline of ~10k+ lots
3

avjennings.com.au
FY16 Results
4
FY16 FY15 % change FY14
Revenue $421.9m $317.9m 32.7% $250.6m
Statutory Profit before Tax $58.8m $48.2m 22.0% $27.0m
Statutory Profit after Tax $40.9m $34.4m 19.0% $18.8m
Gross Margins 25.2% 26.80% -1.6pp 21.90%
Inventory Provision Write Back(After tax)
$2.6m $2.6m 0.0% $3.6m
Net tangible assets (NTA) $361.1m $334.5m 7.9% $313.0m
NTA per share $0.95 $0.88 7.6% $0.81
EPS (cents per share) 10.7 9 18.6% 4.9
Dividend (cents per share) 5 4 25.0% 2

avjennings.com.au
Strong financials and sustainable operations
819
1,415
1,737 1,832
FY13 FY14 FY15 FY16
Contract signings +5.5%
829
1,254
1,538 1,596
FY13 FY14 FY15 FY16
Settlements +3.8%
158.5
250.6
317.9
421.9
FY13 FY14 FY15 FY16
Revenue ($m) +32.7%
-15.3
18.8
34.440.9
FY13 FY14 FY15 FY16
NPAT($m) +19%
5
Stronger revenue growth driven by changes in product mix and revenue share including the prior period acquisitions of JV partner interests in ‘Argyle’ and ‘St Clair’ projects

avjennings.com.au
Increased shareholder returns
Fully franked final dividend of 3.5 cents per share to be paid in September 2016
Dividend growth over three years tracking earnings growth
Continuing to target a dividend payout ratio of 40-50%.
2
4
5
4.9
9
10.7
FY14 FY15 FY16
Earnings and Dividend Growth (cents)
DPS EPS
6

avjennings.com.au
Maintaining financial flexibility
Prudent gearing ratio with net debt to total assets at 17.9% and total net debt $132.4 million
Extended the $250 million ‘Club’ banking facility by a further year to 30 Sept. 2018
0.0%
10.0%
20.0%
30.0%
0
90
180
June 15 Dec 15 June 16
Net Debt and Gearing Ratio(net debt / total assets)
Net Debt (LHS) Gearing (RHS)
$m
7
avjennings.com.au
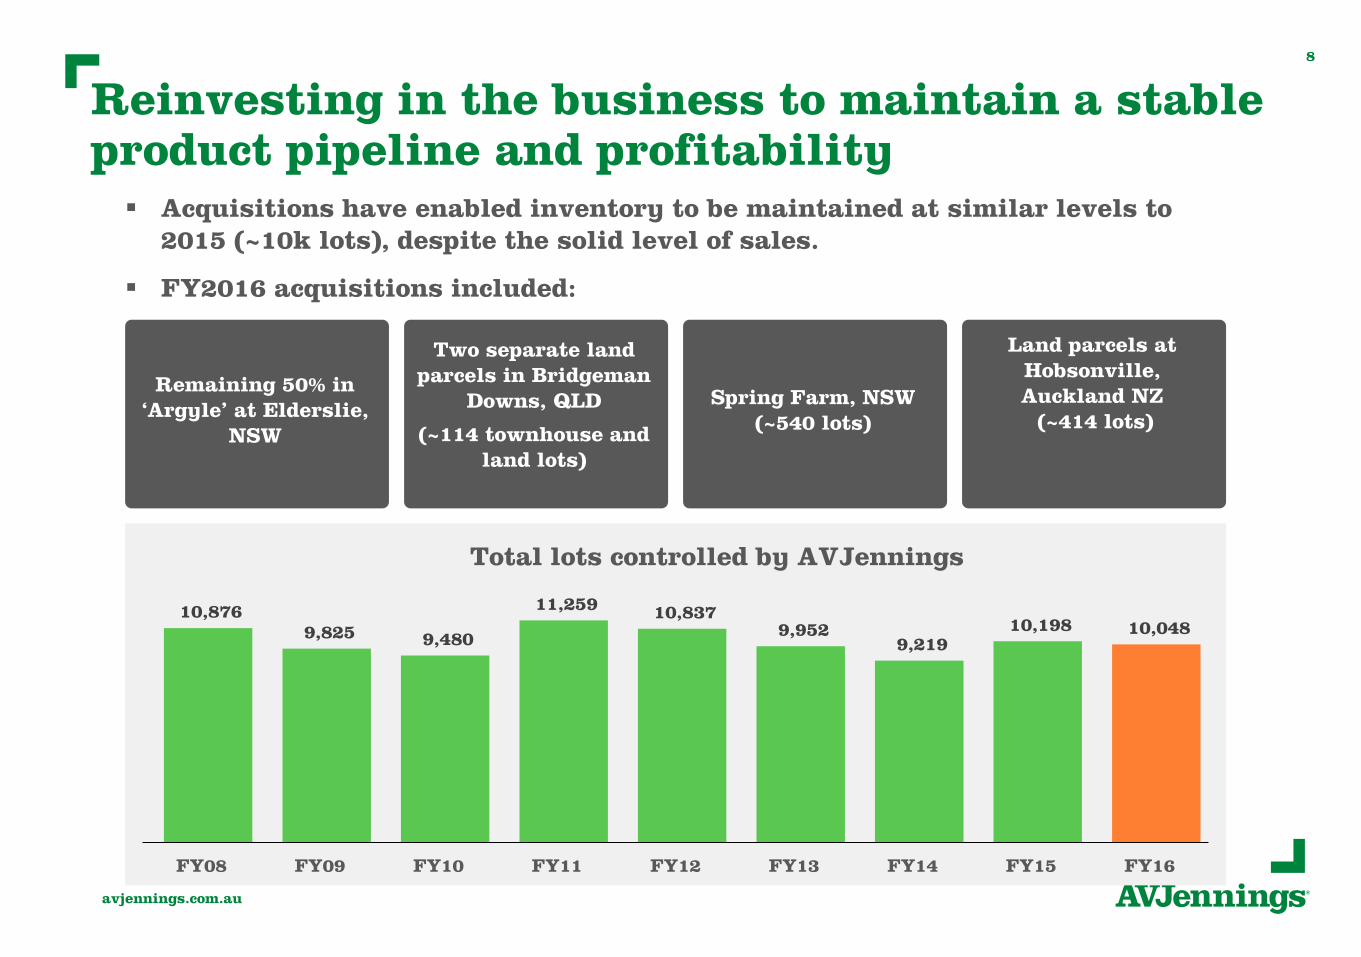
Reinvesting in the business to maintain a stable product pipeline and profitability
10,876 9,825 9,480
11,259 10,837 9,952
9,219 10,198 10,048
FY08 FY09 FY10 FY11 FY12 FY13 FY14 FY15 FY16
Total lots controlled by AVJennings
Acquisitions have enabled inventory to be maintained at similar levels to 2015 (~10k lots), despite the solid level of sales.
FY2016 acquisitions included:
Remaining 50% in ‘Argyle’ at Elderslie,
NSW
Two separate land parcels in Bridgeman
Downs, QLD
(~114 townhouse and land lots)
Spring Farm, NSW (~540 lots)
Land parcels at Hobsonville, Auckland NZ
(~414 lots)
8

avjennings.com.au
Healthy level of production
892
667 572
318
554
715
974
1,264
1,539 1,512 1,623
1,681
1H11 2H11 1H12 2H12 1H13 2H13 1H14 2H14 1H15 2H15 1H16 2H16
Work In Progress Levels
Work in progress levels reflect our confidence in the market
The level of completed unsold stock remains small at 2.8% by value
9
avjennings.com.au
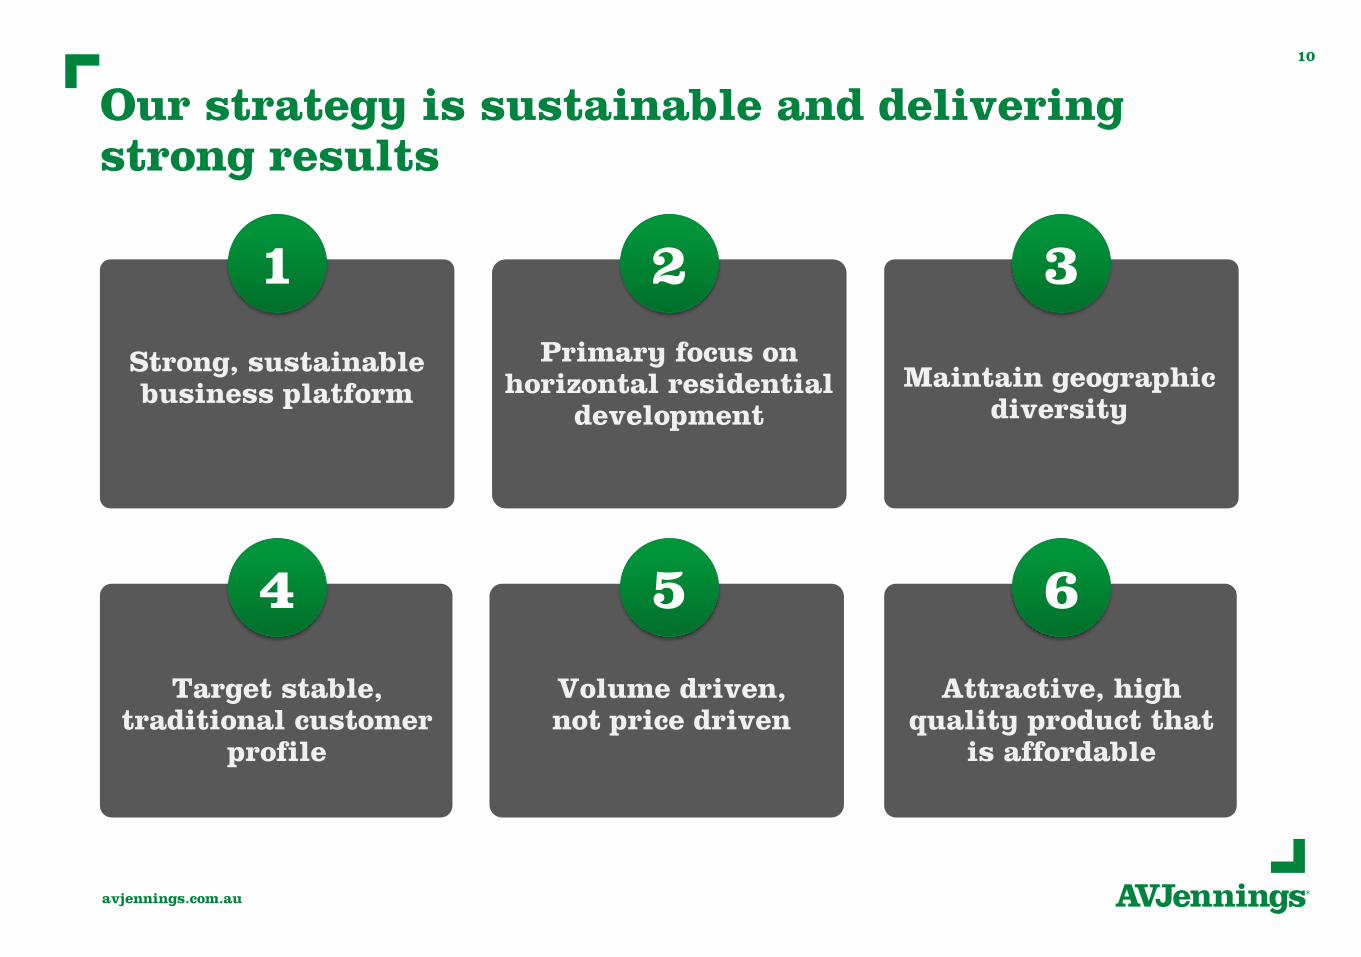
Our strategy is sustainable and delivering strong results
Primary focus on horizontal residential
development
Target stable,traditional customer
profile
Maintain geographic diversity
2 3
4
Volume driven,not price driven
5
Strong, sustainable business platform
1
Attractive, highquality product that
is affordable
6
10

avjennings.com.au
Customers associate trust, reliability, value and quality with AVJennings
The brand is positively recognised by other stakeholders (suppliers, government, land owners, financial institutions)
We’re investing in the brand.
11
Strong and sustainable business platform
Strong, sustainable business platform1
PEOPLE & COMMUNITY FOCUS
STRONG INTERNAL SYSTEMS
GOOD CORPORATE GOVERNANCE
BRAND STRENGTH

avjennings.com.au
Our focus remains on horizontal residential development
INC
RE
AS
ING
SIZ
E O
F
BA
LA
NC
E S
HE
ET
Contract Housing
SimondsHenleyPorter Davis
MetriconClarendon
House & Land
Land OnlyAVJennings
Pure Residential
PropertyDeveloper
Peet FrasersStockland
MirvacLend Lease
Development Housing
Medium Density
Country Garden
GreenlandWanda
Aqualand
High Density Meriton
Industrial FundsManagers
Commercial
Chart based on core business lines
12
Focus on horizontal residential development2

avjennings.com.au
Continuing demand and under supply in our sector
13
-100
-50
0
50
100
150
200
250
300
87 89 91 93 95 97 99 01 03 05 07 09 11 13 15 17
Dw
ellin
gs (
'000s)
Cumulative market balance Underlying demand Completions
Shortage
Surplu
s
Forecasts
0
2
4
6
8
10
12
14
16
18
20
22
88 89 90 91 92 93 94 95 96 97 98 99 00 01 02 03 04 05 06 07 08 09 10 11 12 13 14 15 16
Dw
ellin
g a
pprovals
('0
00s p
er m
onth)
Total dwellings (sa) Total dwellings (trend)Houses (sa) Houses (trend)Flats/units/townhouses (sa) Flats/units/townhouses (trend)
Focus on horizontal residential development2
Sources: ABS, ANZ Research

avjennings.com.au
14
-20
0
20
40
60
80
100
120
140
85 87 89 91 93 95 97 99 01 03 05 07 09 11 13 15 17
Num
ber
of dw
ellin
gs
('000s)
Housing market balance Completions Underlying demand
Short
age
Surp
lus
Forecast
-40
-20
0
20
40
60
80
85 87 89 91 93 95 97 99 01 03 05 07 09 11 13 15 17
Num
ber
of dw
ellin
gs (
'000s)
Housing market balance Completions Underlying demand
Short
age
Surp
lus
Forecast
-30
-20
-10
0
10
20
30
40
50
60
85 87 89 91 93 95 97 99 01 03 05 07 09 11 13 15 17
Num
ber
of dw
ellin
gs (
'000s)
Housing market balance Completions Underlying demand
Short
age
Surp
lus
Forecast
A shortage of dwellings exists in NSW and Victoriabut in Queensland the market has stabilised
NSW
Victoria
Queensland
Focus on horizontal residential development2
Sources: ABS, ANZ Research

avjennings.com.au
LAND DEVELOPMENT PHASE HOME CONSTRUCTION PHASE
MONTH 1 2 3 4 5 6 7 8 9 10 11 12 13 14 15
Civil Works Commence
Land only sales
commence once civils
50% complete
Civil workscomplete
Cash settlements
typically occur within one month of civil workscompletion
Constructioncommences
Built form sales
commence once
construction 50% complete
Constructioncomplete
Cash settlements
typically occur within one month of constructioncompletion
Efficient working capital cycle
TYPICAL PRODUCTION TIMELINE – RETAIL SALES
15
Focus on horizontal residential development2
Land only, terraces and town-homes, detached dwellings, low - medium rise apartments
Horizontal development emphasis means shorter working capital cycle
Product type and customer profile means settlement risk is extremely low

avjennings.com.au
Diversified geographic mix provides opportunities in different markets
Number of lots at30 June 2016:
10,048
VIC: 3,007
NZ: 414
WA: 426SA: 2,446
NSW: 2,768
QLD: 987
Continued focus on urban growth corridors and infill sites where people want to live
QLD: Brisbane, Gold Coast and Sunshine Coast
NSW: West and SW Sydney, Central Coast
VIC: Melbourne’s northern suburbs and Williamstown
SA: Adelaide suburbs
WA: Perth suburbs
NZ: Auckland
16
Maintain geographic diversity3

avjennings.com.au
AVJ CUSTOMER SEGMENTS
Our B2B customers are contract home builders and others who buy our land.
This segment remains a stable and important customer sector.
RETAIL BUSINESS
FIRST HOME BUYERS 36%
LOCAL INVESTORS 30%
TRADE UPS / DOWNSIZERS 33%
FOREIGN INVESTORS 1%
Large and growing market of customers 17
Target stable, traditional customer profile4
avjennings.com.au
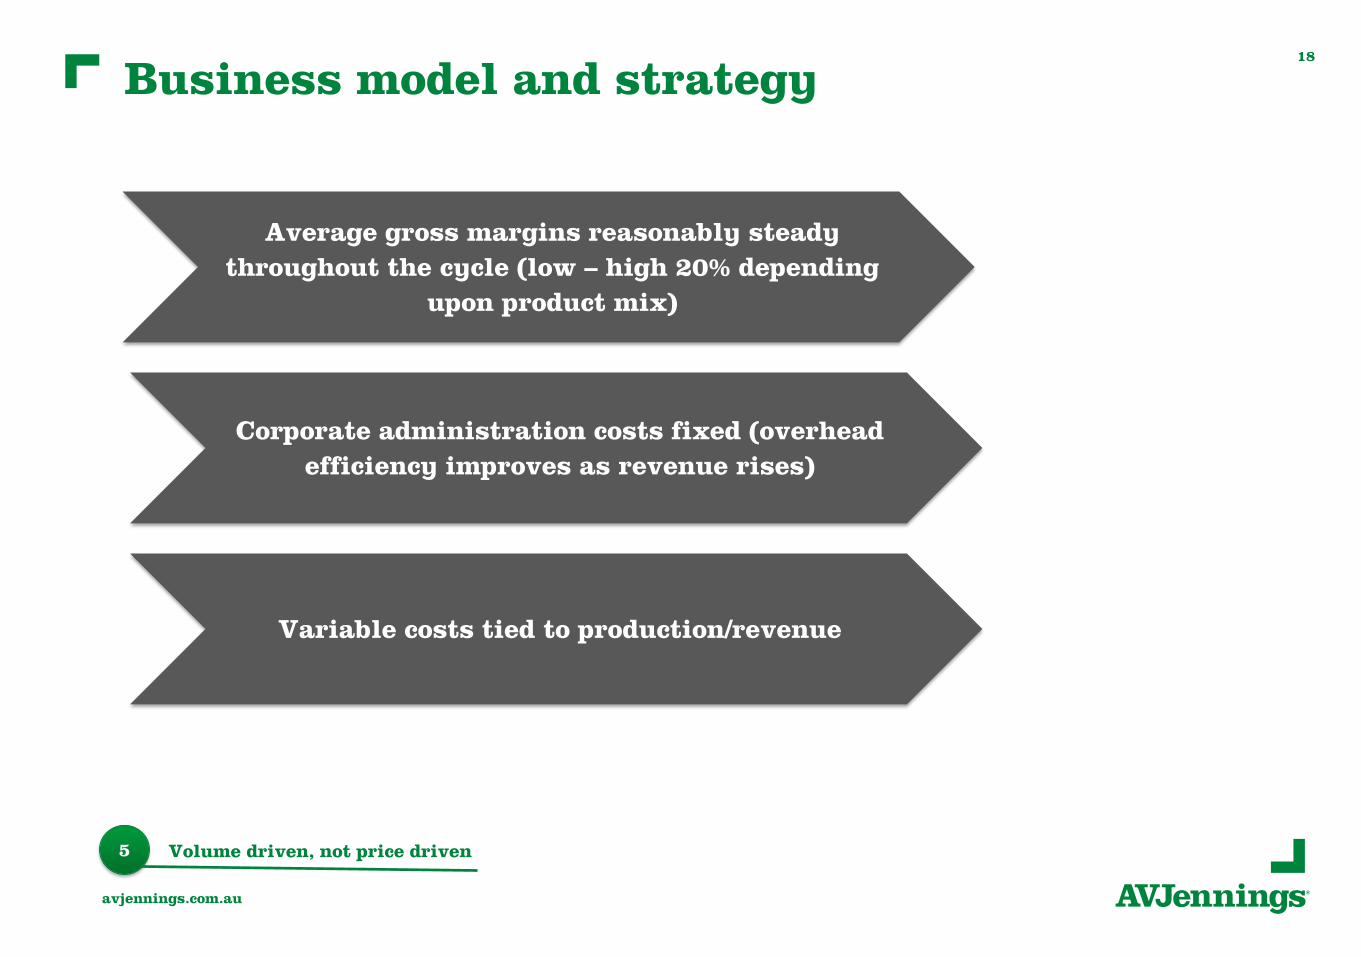
Business model and strategy18
Volume driven, not price driven5
Average gross margins reasonably steady
throughout the cycle (low – high 20% depending
upon product mix)
Corporate administration costs fixed (overhead
efficiency improves as revenue rises)
Variable costs tied to production/revenue
avjennings.com.au
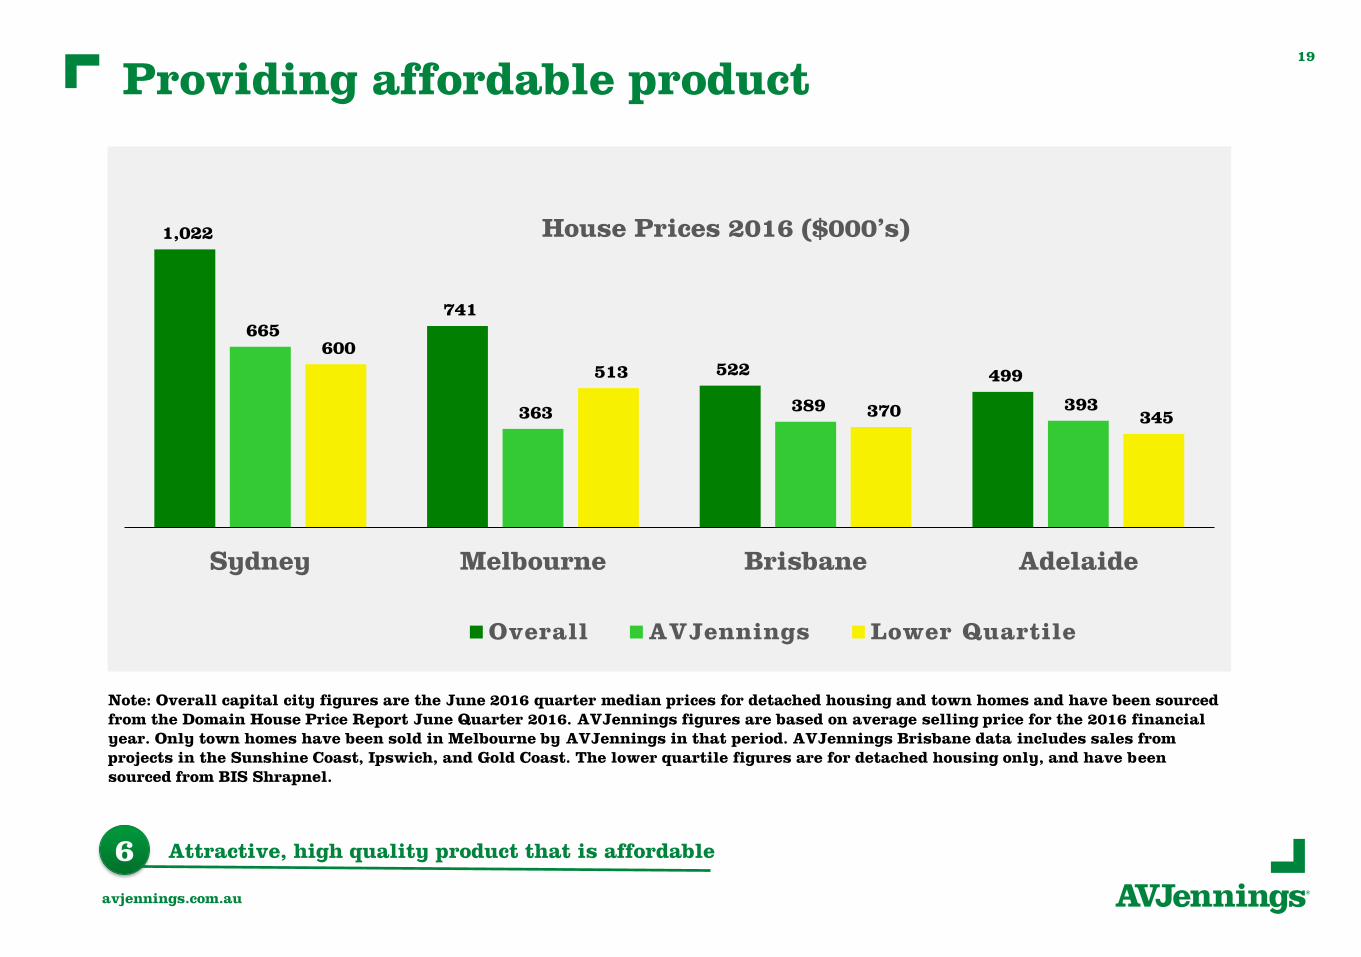
Providing affordable product
1,022
741
522 499
665
363 389 393
600
513
370 345
Sydney Melbourne Brisbane Adelaide
Overall AVJennings Lower Quartile
House Prices 2016 ($000’s)
Note: Overall capital city figures are the June 2016 quarter median prices for detached housing and town homes and have been sourced from the Domain House Price Report June Quarter 2016. AVJennings figures are based on average selling price for the 2016 financial year. Only town homes have been sold in Melbourne by AVJennings in that period. AVJennings Brisbane data includes sales from projects in the Sunshine Coast, Ipswich, and Gold Coast. The lower quartile figures are for detached housing only, and have beensourced from BIS Shrapnel.
19
Attractive, high quality product that is affordable6

avjennings.com.au
NSW market and project pipeline 20
Sydney and Central Coast markets remains active with good demand, inadequate supply and building delivery constraints
1,64760%
91733%
2047%
Lots across NSW Regions
Sydney
Central Coast
Other
MAGNOLIA
Hamlyn TerraceWARNERVALE
Coming soon
ARCADIAN HILLS
Cobbitty
ARGYLE
Elderslie
SPRING FARM
SCHOFIELDS
Coming soon

avjennings.com.au
Victorian market and project pipeline 21
Melbourne market remains buoyant
Waterline Place at Williamstown is expecting first settlements late FY2017
Lyndarum North construction to commence 1H17
2,11770%
69123%
1997%
NorthernMelbourne
Williamstown
Portarlington
ARLINGTON RISE
Portarlington
WATERLINE PLACE
Williamstown
HAZELCROFT
DoreenLYNDARUM
Epping North
LYNDARUM
Wollert
LYNDARUM NORTH
coming soon
Lots across Melbourne

avjennings.com.au
Queensland market and project pipeline 22
Land sales rates and prices stabilising at sustainable levels in Brisbane, Gold Coast and Sunshine Coast
44345%
646%
30331%
17718%
Brisbane
Gold Coast
Sunshine Coast
Other
Lots across Queensland regions
GLENROWAN
ESTATE Walkerston
CREEKWOOD
Caloundra
HALPINE CENTRAL
Mango Hill
VILLAGGIO
Richlands
ESSINGTON RISE
Leichhardt
NOTTINGHAM SQUARE
Calamvale
PARKSIDE
Bethania
BIG SKY
Coomera
BRIDGEMAN DOWNS
Coming soon

avjennings.com.au
S.A. market and project pipeline 23
Adelaide residential market remains subdued but positive signs emerging
2,30394%
1436%
Lots across S.A. Adelaide
Other
EYRE AT PENFIELD
Penfield
ST CLAIR
Cheltenham
PATHWAYS
Murray Bridge
RIVER BREEZE
Goolwa North
avjennings.com.au
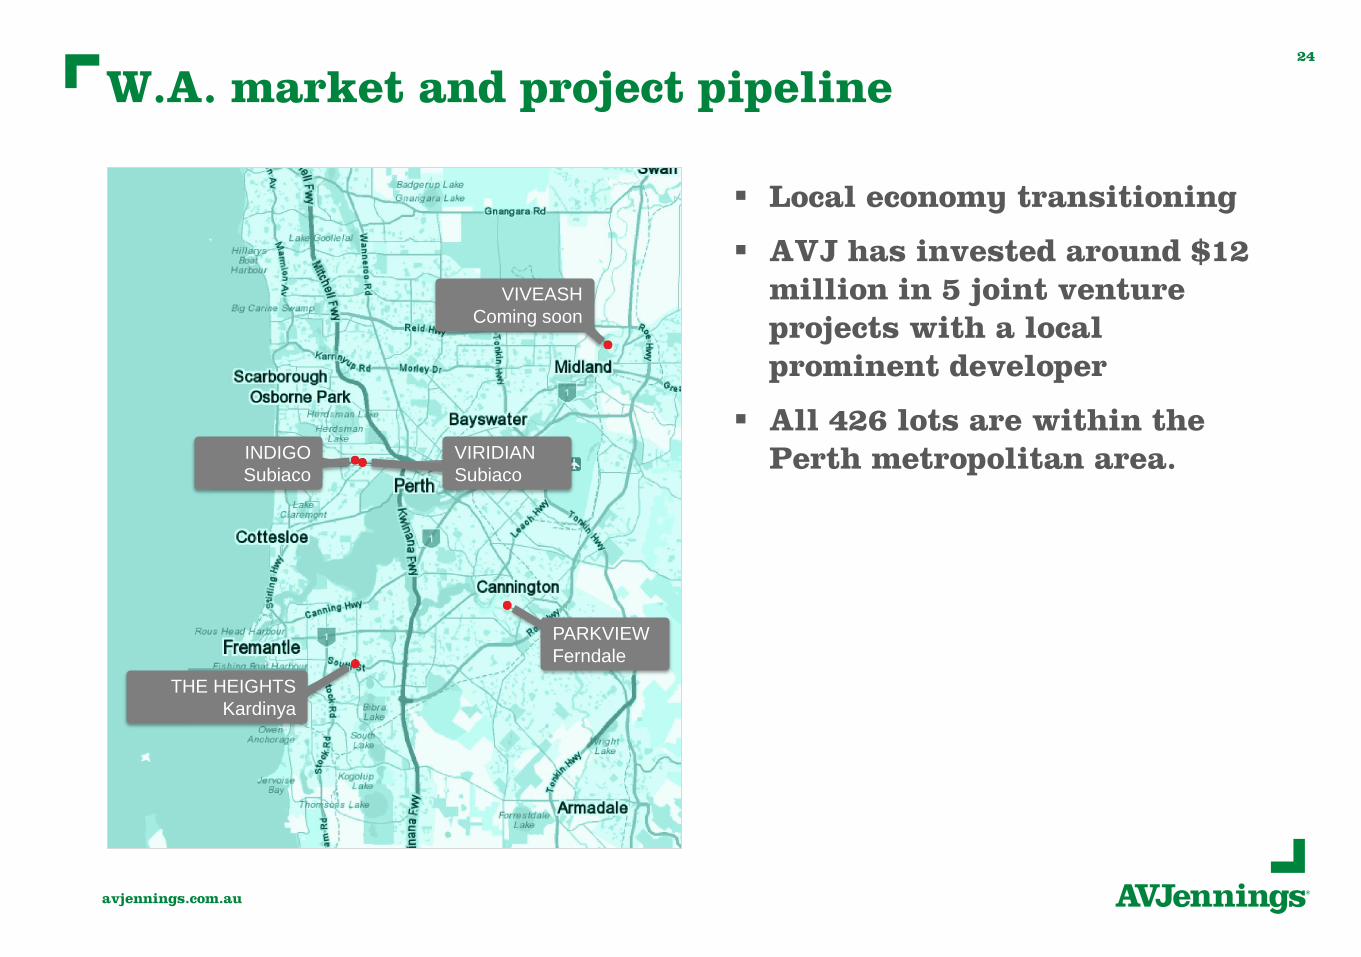
W.A. market and project pipeline 24
Local economy transitioning
AVJ has invested around $12 million in 5 joint venture projects with a local prominent developer
All 426 lots are within the Perth metropolitan area. INDIGO
Subiaco
VIRIDIAN
Subiaco
THE HEIGHTS
Kardinya
VIVEASH
Coming soon
PARKVIEW
Ferndale

avjennings.com.au
Auckland market and project pipeline 25
Auckland remains a strong market with positive net population migration
Hobsonville continues to experience significant demand
AVJennings is exploring further opportunities in Auckland to add to the 414 Hobsonville lots acquired in 2015.
HOBSONVILLE

avjennings.com.au
Market outlook supported by positive fundamentals
26
Increasing population
Historically low interest rates expected to remain low
Employment outlook remains stable
** Source: ABS - Australian Demographic Statistics, Dec 2015
# Infrastructure Australia analysis of ABS data. Medium level projections used for forecasts. Source paper: Population Estimates and Projections (April 2015).
*Auckland data is 2013 – 2033, sourced from Statistics NZ
0% 20% 40% 60% 80% 100%
Greater Brisbane
Greater Sydney
Greater Melbourne
Greater Adelaide
Greater Perth
Greater Auckland*
Forecast population growth (2011 - 2031)#
0
150
300
450
2010 2011 2012 2013 2014 2015
Components of annual population growth -Australia (000's)**
Natural increase Net overseas migration
Total growth

avjennings.com.au
Company outlook27
Positive fundamentals remain and the strategy of delivering traditional housing solutions at affordable prices in well-planned communities will continue to provide shareholders with healthy returns.
CONTRACT SIGNINGS
Similar level to 2016
DIVIDENDS
Continuing to target a dividend payout ratio of 40-50% of earnings
H1 – H2EARNINGS MIX
Earnings bias may shift further into H2
given higher volume of built form

avjennings.com.au
Appendices
28

avjennings.com.au
FY12 FY13 FY14 FY15 FY16
Total settlements (units) 861 829 1,254 1,538 1,596
NSW settlements (units) 110 158 200 493 454
VIC settlements (units) 395 186 329 247 326
QLD settlements (units) 172 121 352 409 439
SA settlements (units) 105 166 138 144 143
NZ settlements (units) 79 198 235 245 234
Lots under control at end of year* 10,837 9,952 9,219 10,198 10,048
Work in progress (units) 318 715 1,264 1,512 1,681
Work in progress ($ million) 61.9 72.1 127.3 158.5 169.5
Revenue from settlements($ million)
182.3 152.2 244.4 308.8 422.3
Land Payments ($ million) 68.0 28.4 53.9 68.1 175.5
Lot settlements and land payments29
* Prior years may includes some contracts where revenue was recognised on an unconditional contract basis
avjennings.com.au
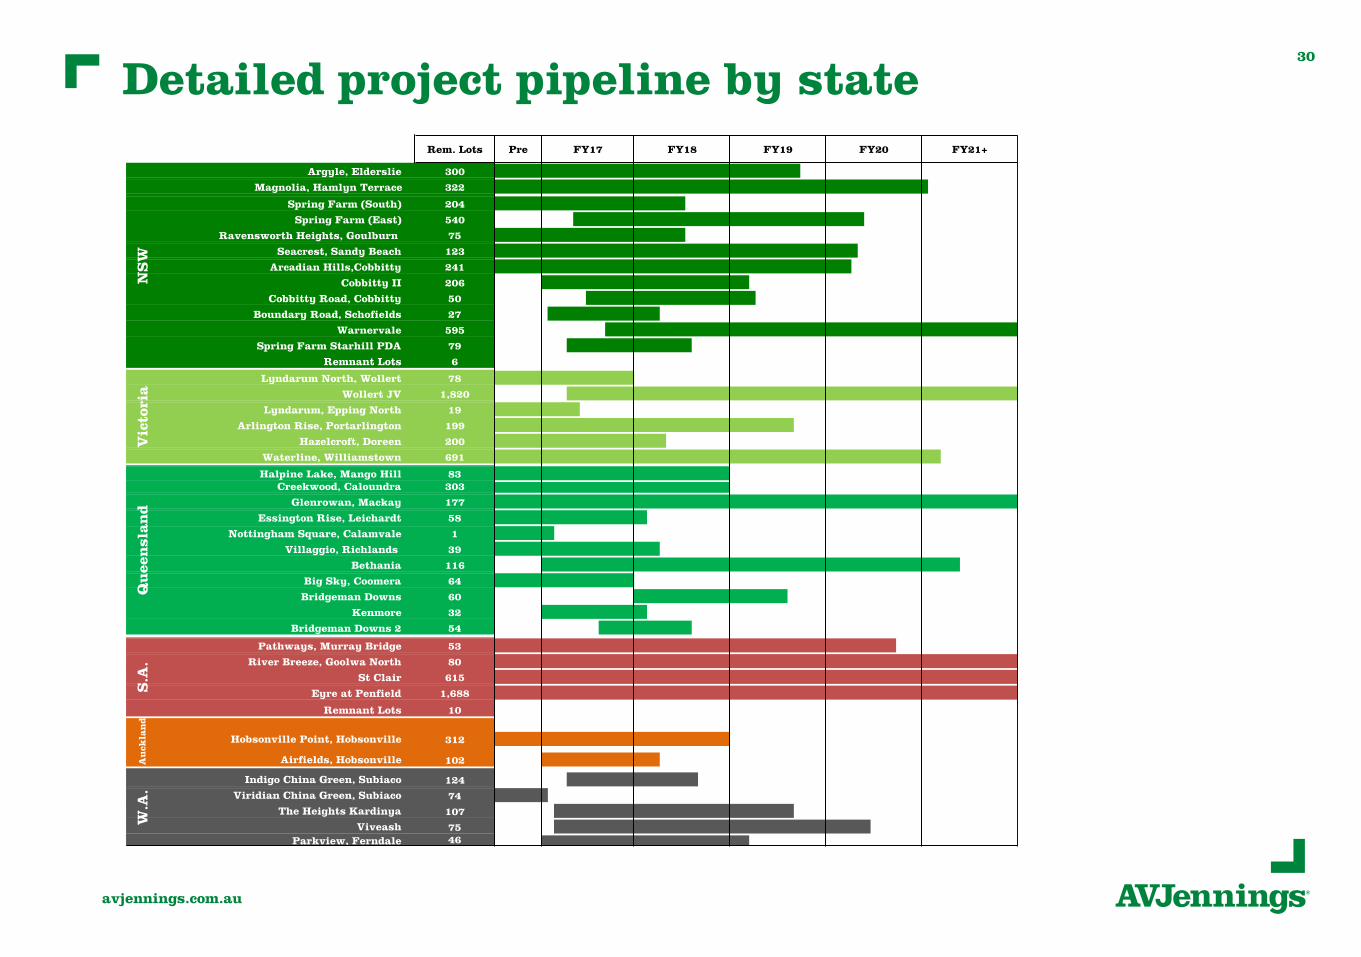
Detailed project pipeline by state 30

avjennings.com.au
Balance Sheet: selected line items31
$millions JUNE 2016 JUNE 2015
Current Assets
Cash and cash equivalents 43.1 37.8
Inventories 209.9 204.9
Total Current Assets 361.2 314.3
Non-Current assets
Inventories 343.1 312.0
Total Non-Current Assets 380.2 341.8
Total Assets 741.4 656.1
Current Liabilities
Trade and other payables 120.6 117.5
Total Current Liabilities 147.4 126.0
Non-Current Liabilities
Interest bearing loans and borrowings 165.5 123.7
Total Non-Current Liabilities 230.1 192.8
Total Liabilities 377.5 318.8
Net Assets 363.9 337.3

avjennings.com.au
Cash Flow Statement: selected line items 32
$millions FY2016 FY2015
Cash flows from operating activities
Receipts from customers 417.9 317.3
Net receipts from joint venture related activities* 1.4 18.0
Payments to suppliers, land vendors and employees (432.9) (320.1)
Net cash (used in) / from operating activities (26.9) 3.7
Cash flows from investing activities
Net cash used in investing activities (0.2) (0.8)
Cash flows from financing activities
Proceeds from borrowings 454.5 240.2
Repayment of borrowings (405.7) (199.0)
Net cash from financing activities 31.5 29.6
Net increase in cash held 4.4 32.5
* Related to normal trading activities in joint ventures. In the statutory cash flow these are disclosed as net receipts from investing activities.

avjennings.com.auavjennings.com.au
Housingmatters.
Community matters.