fy16 results presentation for personal use only
TRANSCRIPT

FY16 resultspresentation
26 August 2016
For
per
sona
l use
onl
y
1
FY16 pro forma results highlights
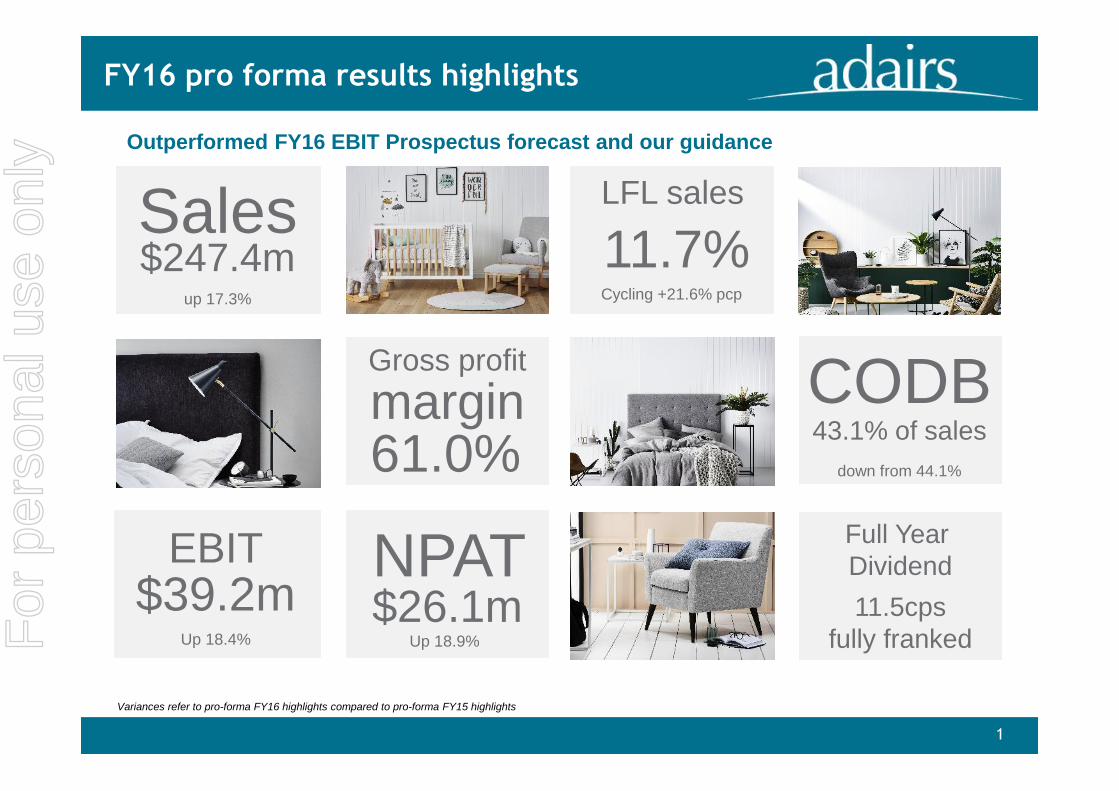
Variances refer to pro-forma FY16 highlights compared to pro-forma FY15 highlights
$247.4mup 17.3%
Sales
Up 18.4%
$39.2mEBIT
margin
11.7%LFL sales
Cycling +21.6% pcp
Gross profit
61.0% down from 44.1%
43.1% of salesCODB
$26.1mNPAT
11.5cpsfully franked
Full YearDividend
Update photo
Up 18.9%
Outperformed FY16 EBIT Prospectus forecast and our guidance
For
per
sona
l use
onl
y

1. Business Highlights - Continuing to deliver outstanding results2. Financial Results - Outperformed FY16 EBIT Prospectus Forecast3. Key growth drivers4. Company Outlook
AgendaF
or p
erso
nal u
se o
nly

3
Key business highlights – FY16
Strong results from Product and Range differentiation• Continued strong growth from category range extensions• Ongoing sales improvement from Adairs Kids product category
Strong results from Product and Range differentiation• Continued strong growth from category range extensions• Ongoing sales improvement from Adairs Kids product category
Increasing momentum from Australian store rollout programme• 13 new stores opened & ongoing store reinvestment• 8 Core and 5 Emerging store formats• Successful trial of 3 UHR concessions in Myer stores
Increasing momentum from Australian store rollout programme• 13 new stores opened & ongoing store reinvestment• 8 Core and 5 Emerging store formats• Successful trial of 3 UHR concessions in Myer stores
Omni channel strategies delivering above market sales growth:• LFL +11.7%• Online +63.8% (Now 7.9% of total sales)
Omni channel strategies delivering above market sales growth:• LFL +11.7%• Online +63.8% (Now 7.9% of total sales)
Outperformed FY16 EBIT guidance and Prospectus forecast• 3rd consecutive year of >10% LFL sales growthOutperformed FY16 EBIT guidance and Prospectus forecast• 3rd consecutive year of >10% LFL sales growth
International expansion commences with the signing of 3 stores inNew Zealand for FY17• First store to open in Sylvia Park Shopping centre in Oct 2016
(Homemaker format )F
or p
erso
nal u
se o
nly

Continuing to deliver LFL sales growth whilecycling strong prior periods (FY15: +21.6% pcp)
Continuing to grow market share with acompetitive market position
Sales growth largely driven by increasedtransaction numbers (i.e. larger customer base)
2H16 LFL sales +8.7% (cycling 24.1% in 2H15)
‘Core’ format LFL sales growth continues to beunderpinned by Homemaker store performance
‘Emerging’ format LFL sales growth was broadly inline with company average
We expect FY17 LFL sales growth to be in the“mid single digits”
4
Strong LFL sales growth of +11.7%
3 consecutive years of LFL sales growth >10%
Strong LFL sales growth
For
per
sona
l use
onl
y

1. Business Highlights - Continuing to deliver outstanding results2. Financial Results - Outperformed FY16 EBIT Prospectus Forecast3. Key growth drivers4. Company Outlook
AgendaF
or p
erso
nal u
se o
nly

6
Outperformed Prospectus & guidance
(1): FY15 EPS is based the number of shares on issue immediately following IPO. (2) excludes 3 UHR concessions in Myer stores
($ million)Statutory Pro-forma Pro-forma
FY16 vs FY15Change
Pro-formaFY16 Varianceto ProspectusFY16
(53 Wks)FY16 Act(52 Wks)
FY16 (52 Wks)Prospectus
FY15(52 Wks)
Sales 253.2 247.4 231.1 210.9 17.3% 7.1%
Gross Profit 154.3 151.0 142.1 130.7 15.5% 6.3%
CODB 108.3 106.6 100.2 93.0 14.6% 6.4%
EBITDA 46.0 44.4 41.9 37.7 17.8% 6.0%
EBIT 40.7 39.2 36.8 33.1 18.4% 6.7%
NPAT 27.2 26.1 24.4 22.0 18.9% 7.1%
EPS (cps) (1) 16.4 15.8 14.6 13.3 18.9% 7.1%
DPS (cps) 11.5 11.5 11.0 na na 4.5%
LFL sales growth 11.7% 11.7% 9.6% 21.6% na 2.1%
Gross profit margin 61.0% 61.0% 61.5% 62.0% 1.0% 0.5%
CODB as % of sales 42.8% 43.1% 43.3% 44.1% 1.0% 0.2%
EBIT margin 16.1% 15.9% 15.9% 15.7% 0.2%
Store No. (inc online)(2) 148 146 143 135 13 3For
per
sona
l use
onl
y

7
Actively managing Gross Profit
Achieved top end of guidance range for GPmargin
FY16 GP margin reduced to 61% from 62%(vs pcp)
Key challenge was the large decline in the A$within a relatively short period - faster thanAdairs or the market could absorb or adjust to
FY16 EBIT impact from A$ depreciation wasc.$7.2m holding all other factors constant (vspcp)
FY16 GP margin reduction (vs FY15) mainlydriven by FX impact in 2H16
‒ 20% decline in the effective US$ buyingrate
‒ Actively managed “sell prices” to drivegrowth in LFL GP $
‒ 2H16 EBIT impact from A$ depreciationwas c.$5.2m holding all other factorsconstant (vs 2HFY15)
Improved stock turn (~3.6x) and inventoryageing profile
Av. Dailyspot price
Av. Daily Spot PriceLagged 7 mths
% change vspcp
1H 2015 $0.89 $0.91
2H 2015 $0.78 $0.91
1H 2016 $0.72 $0.79 -13%
2H 2016 $0.73 $0.73 -20%
1H 2017 $0.73 -7%
Note prospectus assumed $0.75 for FY16
Impact of stock turns (~3-4 mths) and the effectof our hedging program (~3-4 mths) results in a6-8 month “lag” in the full financial impact of FXchanges (holding all other factors constant)
A$:US$ currency illustrative analysis
Management believe our GM rate can grow by25-75bp per annum for the next 3 years,dependent on prevailing market conditionsand assuming relative stability in the currency
We continue to believe that FX will not be a longterm determinant of our success/earnings growth
For
per
sona
l use
onl
y

8
8
Strong cash flows
• Underlying operating cash flow wasstrong, with some relatively minor timingdifferences, and continued investment inkey growth drivers
• Operating cash flow impacted byincreased inventory to support peak salesperiod in FY16, and store growth
• FY16 tax includes amounts relating toFY15 $6.6m, and provisional taxpayments in relation to FY16 $2.0m
• $10.3m Capex spent: 13 new stores & 9 refurbishments
Significant investment in ERP with newPOS rollout
• Dividend payment of $8.3m in relation toH1 FY16 (5.0cps)
• First year 11.5cps dividend fully franked –4.5% above Prospectus
• Final Dividend in relation to FY16 of6.5cps fully franked declared
$ millionPro-forma
FY16Pro-forma
FY15 Change $
EBITDA (52 Wks) 44.4 37.7 6.7
Change in inventory (3.1) 3.2 (6.3)
Change in other workingcapital items (1)
(1.4) (3.1) 1.7
Capex: New Stores (4.5) (1.7) (2.8)
Capex: Other (5.8) (5.2) (0.6)
Cash tax paid (8.6) (9.4) 0.8
Finance costs paid (2) (1.9) (2.2) 0.3
Operating Cash Flow 19.1 19.3 (0.2)
(1) Excludes IPO and other items associated with pre-IPO restructureto enable more relevant comparison
(2) In FY15, finance costs are pro-forma adjusted for the Post IPOcapital structure
For
per
sona
l use
onl
y
9
9
Strong balance sheet to support growth
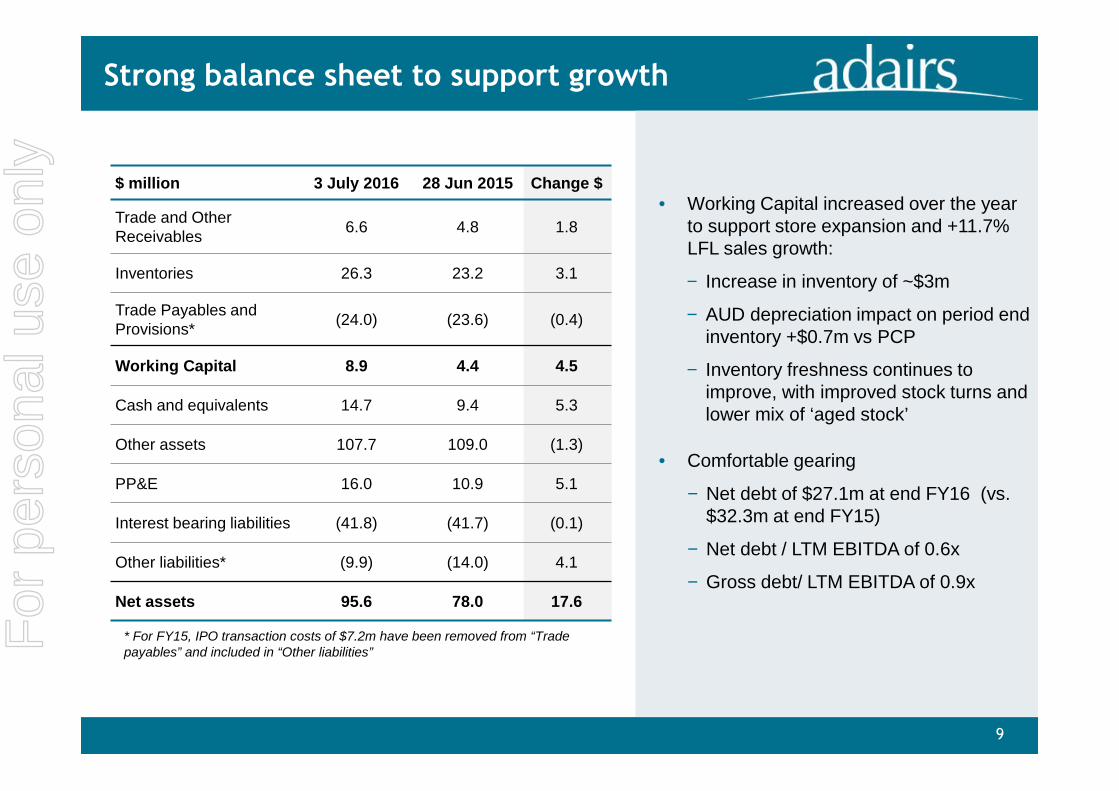
$ million 3 July 2016 28 Jun 2015 Change $
Trade and OtherReceivables 6.6 4.8 1.8
Inventories 26.3 23.2 3.1
Trade Payables andProvisions* (24.0) (23.6) (0.4)
Working Capital 8.9 4.4 4.5
Cash and equivalents 14.7 9.4 5.3
Other assets 107.7 109.0 (1.3)
PP&E 16.0 10.9 5.1
Interest bearing liabilities (41.8) (41.7) (0.1)
Other liabilities* (9.9) (14.0) 4.1
Net assets 95.6 78.0 17.6
Working Capital increased over the yearto support store expansion and +11.7%LFL sales growth:
Increase in inventory of ~$3m
AUD depreciation impact on period endinventory +$0.7m vs PCP
Inventory freshness continues toimprove, with improved stock turns andlower mix of ‘aged stock’
Comfortable gearing
Net debt of $27.1m at end FY16 (vs.$32.3m at end FY15)
Net debt / LTM EBITDA of 0.6x
Gross debt/ LTM EBITDA of 0.9x
* For FY15, IPO transaction costs of $7.2m have been removed from “Tradepayables” and included in “Other liabilities”F
or p
erso
nal u
se o
nly

10
10
Investing for growth (Capex)
Capital expenditure ($m)
13 new stores opened
9 stores fully refurbished
Continuing to see pleasing resultsfrom store refurbishments
$10.3m capex compared to $9.4m inProspectus
Opened 2 more stores
Higher mix of homemaker format
Final phase of significant investmentin ERP
For
per
sona
l use
onl
y
1. Business Highlights - Continuing to deliver outstanding results2. Financial Results - Outperformed FY16 EBIT Prospectus Forecast3. Key growth drivers4. Company Outlook
AgendaF
or p
erso
nal u
se o
nly

12
Strategy: Key growth drivers
Consistent with our long term strategic initiatives, revenue growth has 6 controllablekey drivers supported by excellence in customer service, retail execution and scalableinfrastructure. ‘Market growth’ now broadly in line with long term averages.
1. Differentiated and innovative product range
2. Building on category range extensions
3. Upsizing of our ‘Core’ store formats – Adairs& Adairs Homemaker
4. Accelerating Australian multi store format rollout
5. Highly effective omni channel marketing andonline store
6. International omni store expansion (NZ)
+Market Growth
For
per
sona
l use
onl
y

13
1. Differentiated & innovating product range
Driving customer appeal by consistently delivering fashionability, value and quality
Invested heavily in building a highly capable in-house product design, development and sourcingteam (key competitive advantage)
Innovative fabrications & bring new products to market quicker than competitors
Introduce new product fortnightly instore
Deliver a compelling value for money proposition for our customers
Interpret and anticipate fashion trends more reliably and with greater accuracy
Develop, co ordinate and merchandise new fashion trends across a range of home categories
Recent years of double digit LFL sales growth demonstrate the success of this strategy
For
per
sona
l use
onl
y

14
CORE:Bedding,Towels,
Bed Linen
KidsFurnishing
CushionsThrows
BeachTowels
Homedecor
DecorativeLighting
Candles &Home
Fragrance
BedroomFurniture
WallArt/mirrors
ChristmasTrim
FloorRugs
Baby
WallClocks
OccasionalFurniture
2. Building on category range extension
Adairs has expanded its product range materially over the last 5 years
This strategy is inextricably linkedto the success of our Homemakerstore format, and our strategy toincrease the average size of ourstores
Successfully expanded into newadjacent categories, whilemanaging risks and evolvingmerchandising
Long term strategy to furnish moreof our customers’ living,entertaining and functional spaces
For
per
sona
l use
onl
y

15
3. Upsizing of our ‘Core’ store formats
A key enabler of our category range extension strategy
Format Adairs ‘Regular’ Adairs ‘Homemaker’
Current number 80 43
Typical sales $1.0m - $3.0m $2.5m - $4.5m
Typical size (sqm) 150 – 250 sqm 450 – 1,000 sqm
Typical location Shopping centre Bulky goods centre
Adairs ‘Regular’
A new ‘mini homemaker’ store formathas been successfully trialled over the last18 months
350-500 sqm store in a largeshopping centre with a broaderselection of product categories
16 existing stores identified for conversionto mini homemaker format store
Adairs ‘Homemaker’
12 existing stores identified for ‘upsizing’to a materially larger 700-1,000sqmfootprint
Targeting 5 stores to be ‘upsized’ in FY17across both formats
Implementation driven by expiry ofexisting leases / centre redevelopments
Existing “core store formats”
Opportunity to further improve profitability anddrive further differentiation by selectively‘upsizing’ existing Adairs ‘Regular’ and Adairs‘Homemaker’ stores
“Mini Homemaker Stores” are a hybrid concept,combining Regular and Homemaker store features
They offer a larger product range than regularstores, but are smaller than the homemaker storesand are located in major shopping centres
Typically “born” from upsizing a Regular store
“Mini Homemaker Stores” are a hybrid concept,combining Regular and Homemaker store features
They offer a larger product range than regularstores, but are smaller than the homemaker storesand are located in major shopping centres
Typically “born” from upsizing a Regular storeFor
per
sona
l use
onl
y

16
4. Accelerating Australian multi store format roll out
In FY16, Adairs rolled out 13 new stores inAustralia, and successfully trialled 3 UHRconcession stores in Myer
Looking forward, we expect to open (net) ~8-12new stores per annum across ‘core’ and‘emerging’ store formats with the potential formore if opportunities present
In addition, we are working towards Phase 2 ofour successful trial of UHR concession stores inMyer
New stores across all ‘core’ formats will reflectour underlying ‘upsizing’ strategy
6 new stores already signed to open in 1H17For
per
sona
l use
onl
y

17
5. Highly effective omni channel marketing & online store
Linen Lovers is core to our operations and thecentrepiece of our customer engagementactivities
The program continues to grow strongly andmembers of Linen Lovers contribute more thanhalf of our total annual sales
Linen Lover customer data indicates growingpropensity to research online and shop onlineor instore
Online is important to our customers (includingLinen Lovers), and continues to grow stronglyand profitably
Digital marketing initiatives and social mediafollowing are enhancing customer engagementlevels and driving a higher ROI
Growing & investing in Online & Linen Lovers loyalty program
Key drivers of online growth:
‒ Broader product range (furniture)
‒ International territories
‒ Click and collect
‒ Enhanced user experience
Management believe Online sales couldrepresent ~12% of sales by 2020
~40%CAGR~40%CAGR
For
per
sona
l use
onl
y
18
6. International omni store expansion (NZ)
First store in NZ to open in October 2017 (Sylvia Park – a Homemaker format store in a shoppingcentre)
Two additional sites secured to open 2H
Up to 5 stores planned to open by the end of FY17 focused solely on the ‘core’ Adairs store formats
If successful, we believe the NZ market has capacity for up to 18 stores across our ‘core’ storeformats
Trading Online in New Zealand will commence in line with the first store opening
Based on our current planning for FY17 we expect New Zealand to generate an EBIT loss of ~A$1m
NZ is a ‘measured risk’ commencement in international markets, and requires us to manage a rangeof issues associated with operations, legal and regulatory framework, logistics, currency, time zone,employment and property
Importantly, we believe the differences in culture and customer preferences are subtleFor
per
sona
l use
onl
y

19
7. Positive market fundamentals
We estimate our market has a long term growth rate of~2% pa driven largely by volume (units) growth
The broader market growth rate reflects:
Consumer confidence & related factors (includinginterest rates, fuel prices, elections, employmentcertainty, housing prices – similar to most discretionaryretail categories)
Innovation in our category, and the strength anddirection of fashion trends in home decoration
Underpinning the market are consumers who areincreasingly interested and emotionally invested inhome decoration
Popularity of home design and decoration TVprograms
Consumers use of social media platforms includingPinterest and Instagram
Popularity of styling and home design blogs and otherrelated media
The growth and popularity of bulky good retailprecincts
For
per
sona
l use
onl
y

20
Growing shareholder value
Continued delivery of a focused growth strategy
Outperformed FY16 EBIT guidance and Prospectus forecast
Continuing to grow market share
Committed to key strategic drivers to deliver ongoing growth
First year 11.5cps dividend fully franked – above Prospectus
Final dividend 6.5cps declared, in addition to our maiden dividend of 5.0cps paid in April 16
For
per
sona
l use
onl
y

1. Business Highlights - Continuing to deliver outstanding results2. Financial Results - Outperformed FY16 EBIT Prospectus Forecast3. Key growth drivers4. Company Outlook
AgendaF
or p
erso
nal u
se o
nly

22
FY17 Outlook
Earnings growth driven through:
Full year benefit of new stores opened in
FY16
Further store roll out in FY17
Online enhancements
Outlook includes FY17 impact of NZ launch
3 – 5 stores expected to be opened
Capex spend A$1.5 - A$2m
EBIT loss of ~A$1.0m
FY17 Forecast
Sales ($ million) 275 – 285
Sustainable Gross Margin 60 – 62%
Year End Stores 160 – 165
Capex ($ million) 13.5 – 15
FX Hedging in place at 3 July 2016 (NB: Spot 74.6 cents):
- 1H17 USD $15.6m (avg rate 72 cents – 56% hedged)
- 2H17 USD $ 7.9m (avg rate 71.3 cents – 23% hedged)
Adairs will continue to execute our proven strategies to drive sales and earningsgrowth. FY17 earnings growth will increasingly bias to an accelerated store roll out asLFL sales growth moderates to “mid single digit” growth.
For
per
sona
l use
onl
y

23
Questions?
For
per
sona
l use
onl
y

24
AppendixF
or p
erso
nal u
se o
nly
25
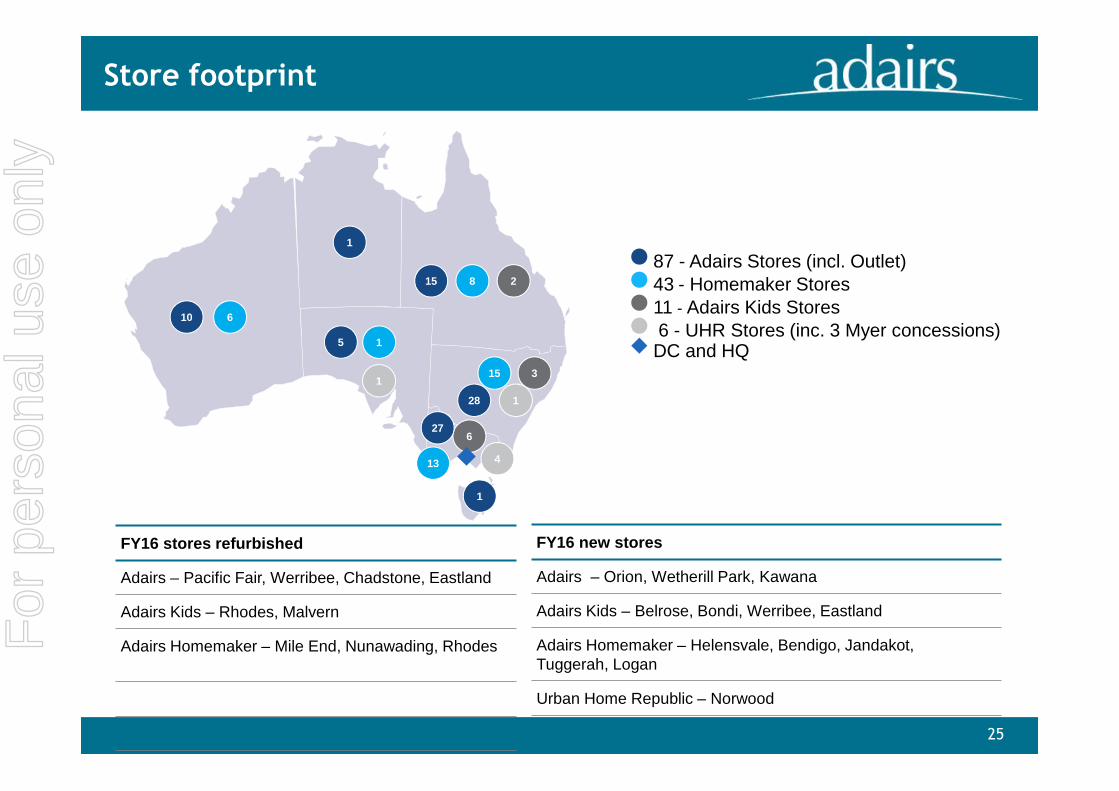
Store footprint
87 - Adairs Stores (incl. Outlet)43 - Homemaker Stores11 - Adairs Kids Stores6 - UHR Stores (inc. 3 Myer concessions)DC and HQ
FY16 stores refurbished
Adairs – Pacific Fair, Werribee, Chadstone, Eastland
Adairs Kids – Rhodes, Malvern
Adairs Homemaker – Mile End, Nunawading, Rhodes
FY16 new stores
Adairs – Orion, Wetherill Park, Kawana
Adairs Kids – Belrose, Bondi, Werribee, Eastland
Adairs Homemaker – Helensvale, Bendigo, Jandakot,Tuggerah, Logan
Urban Home Republic – Norwood
10 6
1
6
4
27
13
28
15 3
15 8 2
5 1
1
1
1
For
per
sona
l use
onl
y

Fashion & Decorator vs Staples sales mix %
26
Continued Growth in All Categories
Expansion vs Traditional sales mix %
Fashion & Decorator vs Staples YoY Growth %Expansion vs Traditional YoY Growth %
Note: Expansion includes Cushions, floor rugs, throws, wall art, lighting, furniture, home décor & Adairs Kids. Traditional includes Bedlinen, Bedding & Towels
For
per
sona
l use
onl
y

27
Proforma Statutory Reconciliations
Statutory Profit and Loss Bridge to Pro-Forma $000 Notes
Profit/(loss) after income tax 27,172
Transaction expenses 101 IPO transaction costs
53 Week EBIT (1,571) Pro forma tax has been appliedat the corporate tax rate of 30%
Income tax benefit/(expense) 441
Pro Forma Profit/(loss) after income tax 26,143
Statutory Profit and Loss Bridge to Pro-Forma
For
per
sona
l use
onl
y

28
Proforma Statutory Reconciliations
Statutory Cash Flow Bridge to Pro-Forma
$ million FY16
Statutory net increases in cash and cashequivalents 5,239
Cash flow impact of week 53 (1,645)
Dividends 8,294
Transaction costs on issue of shares 7,229
Pro Forma Operating Cash Flow 19,114
For
per
sona
l use
onl
y

29
Disclaimer
Some of the information contained in this presentation contains “forward-looking statements” which may not directly orexclusively relate to historical facts. These forward-looking statements reflect Adairs Limited current intentions, plans,expectations, assumptions and beliefs about future events and are subject to risks, uncertainties and other factors, many ofwhich are outside the control of Adairs Limited.Important factors that could cause actual results to differ materially from the expectations expressed or implied in theforward-looking statements include known and unknown risks. Because actual results could differ materially from AdairsLimited’s current intentions, plans, expectations, assumptions and beliefs about the future, you are urged to view all forward-looking statements contained herein with caution.Adairs' results are reported under International Financial Reporting Standards (IFRS). This presentation also includescertain non-IFRS measures including, “proforma” and “underlying” and “LFL”. These measures are used internally bymanagement to assess the performance of our business. Non-IFRS measures have not been subject to audit or review. Allnumbers listed as reported comply with IFRS.
For
per
sona
l use
onl
y