full-year report
TRANSCRIPT

Full-Year Report 2019
Lonza Delivers Strong Full-Year 2019 Group Results, with 11% Pharma Segment Growth

5,920 mn
Sales (CHF) --+ 6.8 %--
25.8 %
EBITDA Margin --0 bps--
27.4 %
CORE EBITDA Margin --+ 10 bps--
1,525 mn
EBITDA (CHF) --+ 6.7 %--
1,620 mn
CORE EBITDA (CHF) --+ 7.2 %--
10.22 CHF
EPS Diluted --+ 16.5 %--
13.59 CHF
CORE EPS Diluted --+ 13.4 %--
9.1 %
ROIC --+ 110 bps--
Full-Year 2019 Results--Comparison vs. Prior Year (Continuing Business)--
3 Lonza Full-Year Report 2019
Contents
Letter to the Stakeholders 5
Financial Highlights 6
Pharma Biotech & Nutrition Segment 8
Specialty Ingredients Segment 11
Outlook 2020 and Mid-Term Guidance 2022 13
CEO Succession 14
Dividend Announced 14
Changes in Board of Directors 15
Discontinued Operations 16
Corporate 16
Notes Condensed Financial Statements 17
Selected Explanatory Notes 21
Supplementary Financial Information 26
Forward-Looking Statements 32
4 Lonza Full-Year Report 2019
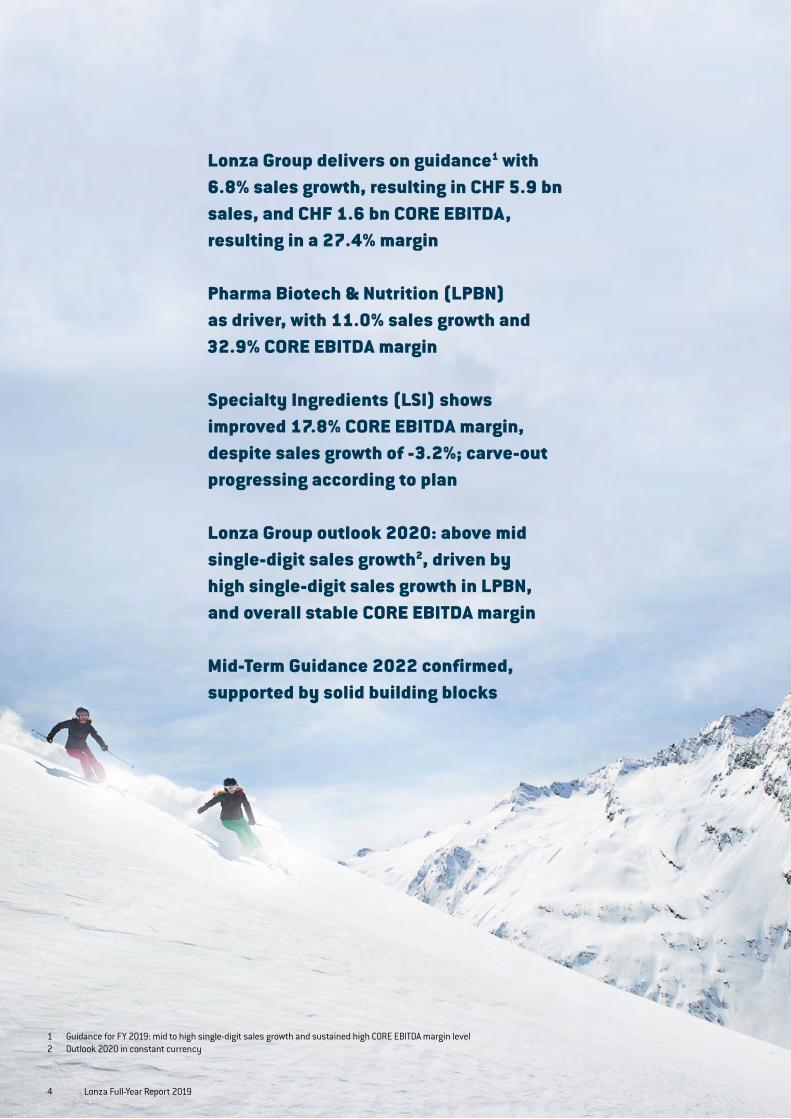
Lonza Group delivers on guidance1 with 6.8% sales growth, resulting in CHF 5.9 bn sales, and CHF 1.6 bn CORE EBITDA, resulting in a 27.4% margin
Pharma Biotech & Nutrition (LPBN) as driver, with 11.0% sales growth and 32.9% CORE EBITDA margin
Specialty Ingredients (LSI) shows improved 17.8% CORE EBITDA margin, despite sales growth of -3.2%; carve-out progressing according to plan
Lonza Group outlook 2020: above mid single-digit sales growth2, driven by high single-digit sales growth in LPBN, and overall stable CORE EBITDA margin
Mid-Term Guidance 2022 confirmed, supported by solid building blocks
1 Guidance for FY 2019: mid to high single-digit sales growth and sustained high CORE EBITDA margin level 2 Outlook 2020 in constant currency

5 Lonza Full-Year Report 2019
In 2020, we will focus on executing our growth projects in another major investment year, completing the carve-out of our Specialty In-gredients segment and reviewing future plans. Concurrently, we will work to strengthen a culture of shared values, collective accountability, commitment and transparency. Important for me and for the company alike, we will also increase our efforts to ensure a constant pipeline of talent to develop as future company leaders. Finally, we will establish clearer environmental, social and governance (ESG) targets and action plans for implementation in 2021.
I am confident about our current momentum, and our ability to deliver on our targets in 2020: above mid single-digit sales growth, driven by high single-digit sales growth in LPBN, and overall stable CORE EBITDA margin. We look forward to the successful start of operations for major investment projects by the end of the year, completing the carve-out, announcing a new Group CEO and continuing to work on the delivery of our Mid-Term Guidance 2022.
Finally, let me share our thanks to all of our stakeholders, our custom-ers, shareholders and suppliers who have supported the Lonza busi-ness over the last year. I also want to send our thanks to our more than 15,000 employees for their dedication and hard work in serving our hundreds of customers and millions of patients globally.
Yours sincerely,
Albert M. BaehnyChairman & CEO a.i.Lonza
Dear Stakeholders, Our people and business have delivered a strong Full-Year 2019 result; we reported CHF 5.9 billion in sales, CHF 1.6 billion in CORE EBITDA and CHF 1.2 billion in CORE EBIT for the Full-Year 2019. We delivered on our guidance with 6.8% sales growth, resulting in a CORE EBITDA margin of 27.4% in an important investment year.
These strong results reflect the continued positive momentum of our pharma-related businesses. The biopharma business achieved dou-ble-digit sales growth and a stable CORE EBITDA margin, even though we are investing in significant growth initiatives. In numbers, our Pharma Biotech & Nutrition (LPBN) segment achieved 11.0% sales growth above guidance, despite a contraction in the nutritional hard capsules business. LPBN reported a CORE EBITDA margin of 32.9%, even after an elevated level of operational expenditure (OPEX) behind growth initiatives.
Our specialty chemicals businesses showed soft full-year performance after headwinds, and reported weaker sales than anticipated in H2 2019. The Specialty Ingredients (LSI) segment performance was in line with industry peers and overall softness in global end-markets. How-ever, productivity gains, cost control measures and price increases resulted in a CORE EBITDA margin of 17.8%, as margins began to show improvement.
All figures relate to Lonza’s continuing operations, excluding the Water Care business unit, in reported currency1 and are compared with the same period in 2018 on a like-for-like basis (restated Lonza Full-Year 2018 financial results) to reflect the realignment of the segments. CORE EBITDA margin development was also supported by the impact of the IFRS 16 new accounting standard on leases, resulting in 60 bps in-cremental margin for Lonza Group, offset by costs related to the divest-ment of the Water Care business and carve out of Specialty Ingredients. This amounted to 50 bps negative CORE EBITDA margin impact.
2019 was a year of change as we accelerated the portfolio review and significantly progressed with the carve-out of our Specialty Ingredi-ents business. Our leadership changes have had no impact on our employees’ collective commitment to deliver for our customers and shareholders.
1 Currency exchange effects had 50 bps negative impact on actual exchange rate (AER) sales growth
6 Lonza Full-Year Report 2019
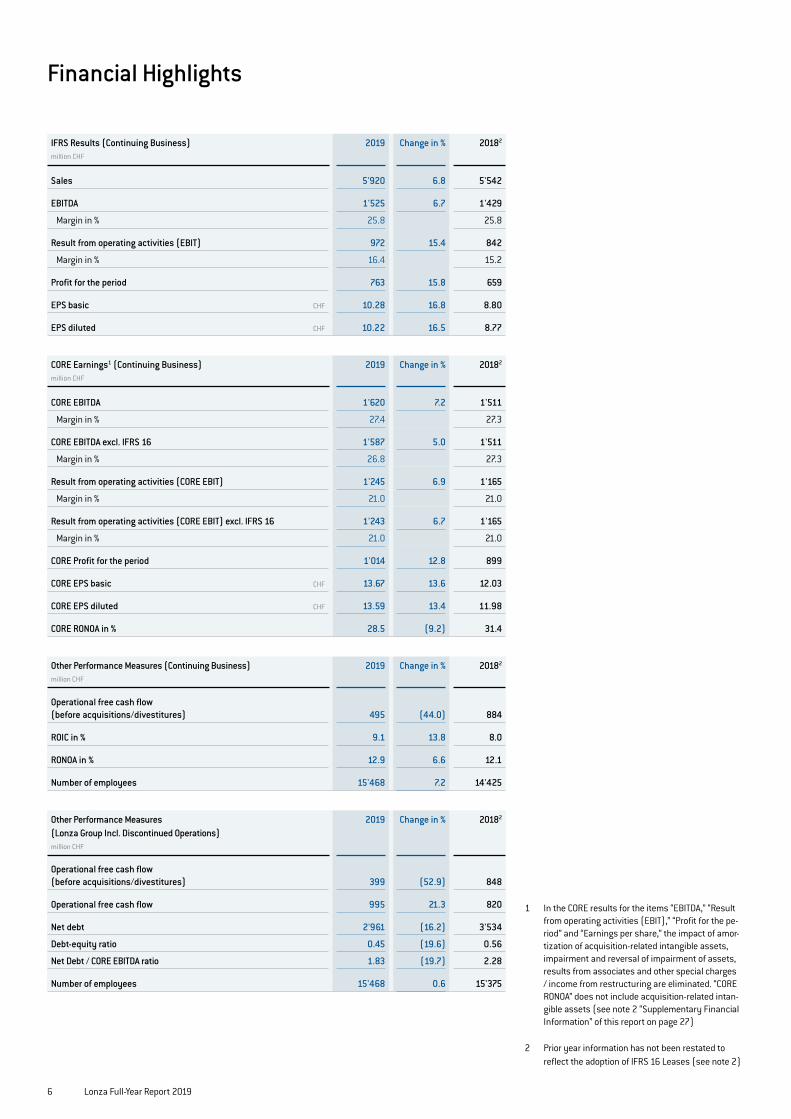
Financial Highlights
1 In the CORE results for the items “EBITDA,” “Result from operating activities (EBIT),” “Profit for the pe-riod” and “Earnings per share,” the impact of amor-tization of acquisition-related intangible assets, impairment and reversal of impairment of assets, results from associates and other special charges / income from restructuring are eliminated. “CORE RONOA” does not include acquisition-related intan-gible assets (see note 2 “Supplementary Financial Information” of this report on page 27)
2 Prior year information has not been restated to reflect the adoption of IFRS 16 Leases (see note 2)
Other Performance Measures (Continuing Business) million CHF
2019 Change in % 20182
Operational free cash flow (before acquisitions/divestitures) 495 (44.0) 884
ROIC in % 9.1 13.8 8.0
RONOA in % 12.9 6.6 12.1
Number of employees 15'468 7.2 14'425
Other Performance Measures (Lonza Group Incl. Discontinued Operations) million CHF
2019
Change in %
20182
Operational free cash flow (before acquisitions/divestitures) 399 (52.9) 848
Operational free cash flow 995 21.3 820
Net debt 2'961 (16.2) 3'534
Debt-equity ratio 0.45 (19.6) 0.56
Net Debt / CORE EBITDA ratio 1.83 (19.7) 2.28
Number of employees 15'468 0.6 15'375
IFRS Results (Continuing Business) milliOn CHF
2019 Change in % 20182
Sales 5'920 6.8 5'542
EBITDA 1'525 6.7 1'429
Margin in % 25.8 25.8
Result from operating activities (EBIT) 972 15.4 842
Margin in % 16.4 15.2
Profit for the period 763 15.8 659
EPS basic CHF 10.28 16.8 8.80
EPS diluted CHF 10.22 16.5 8.77
CORE Earnings1 (Continuing Business) milliOn CHF
2019 Change in % 20182
CORE EBITDA 1'620 7.2 1'511
Margin in % 27.4 27.3
CORE EBITDA excl. IFRS 16 1'587 5.0 1'511
Margin in % 26.8 27.3
Result from operating activities (CORE EBIT) 1'245 6.9 1'165
Margin in % 21.0 21.0
Result from operating activities (CORE EBIT) excl. IFRS 16 1'243 6.7 1'165
Margin in % 21.0 21.0
CORE Profit for the period 1'014 12.8 899
CORE EPS basic CHF 13.67 13.6 12.03
CORE EPS diluted CHF 13.59 13.4 11.98
CORE RONOA in % 28.5 (9.2) 31.4
7 Lonza Full-Year Report 2019
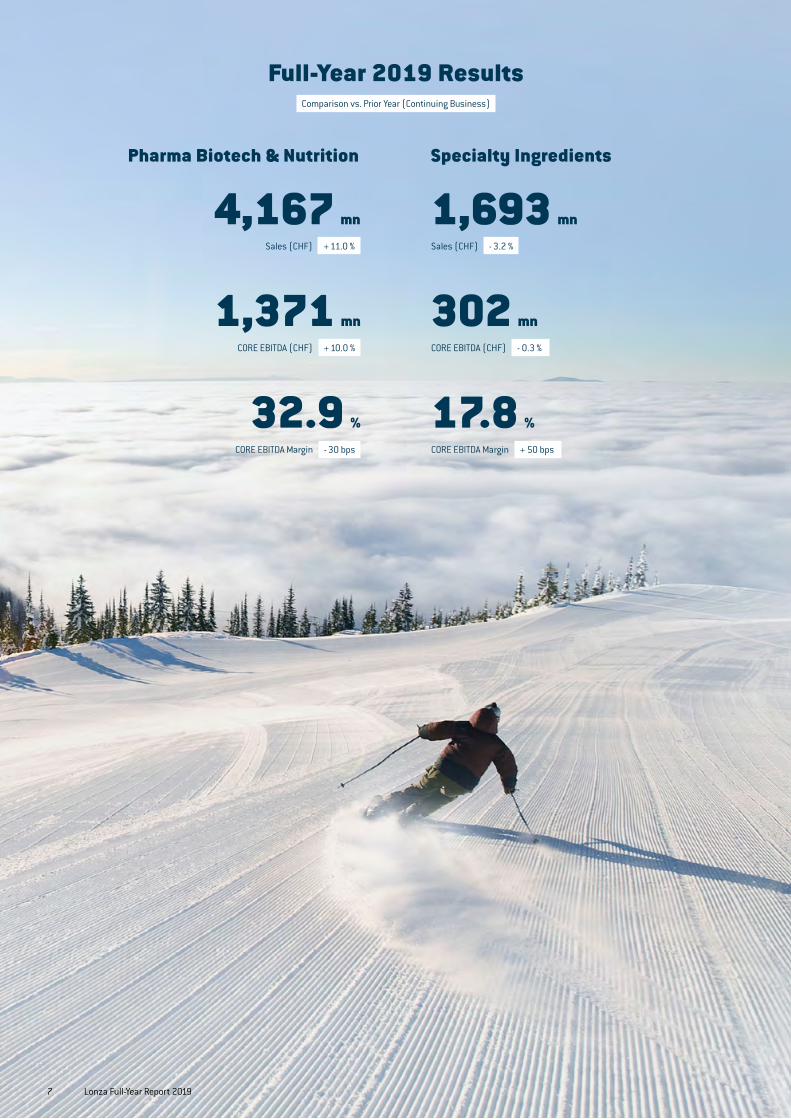
Pharma Biotech & Nutrition Specialty Ingredients
4,167 mn
Sales (CHF) --+ 11.0 %--
1,693 mn
Sales (CHF) --- 3.2 %--
17.8 %
CORE EBITDA Margin --+ 50 bps--
32.9 %
CORE EBITDA Margin --- 30 bps--
302 mn
CORE EBITDA (CHF) --- 0.3 %--
1,371 mn
CORE EBITDA (CHF) --+ 10.0 %--
Full-Year 2019 Results--Comparison vs. Prior Year (Continuing Business)--

Pharma Biotech & Nutrition Segment
milliOn CHF
2019
Change in %
2018 (Restated)1
Sales 4'167 11.0 3'755
CORE EBITDA 1'371 10.0 1'246
Margin in % 32.9 33.2
CORE EBITDA excl. IFRS 16 1'347 8.1 1'246
Margin in % 32.3 33.2
CORE result from operating activities (EBIT) 1'125 10.3 1'020
Margin in % 27.0 27.2
CORE result from operating activities (EBIT) excl. IFRS 16 1'123 10.1 1'020
Margin in % 26.9 27.2
1 Restated to reflect the 2019 realignment of Lonza’s segments into Pharma Biotech & Nutrition and Specialty Ingredients. Prior year information has not been restated to reflect the adoption of IFRS 16 Leases (see note 2)
Lonza is proud to sponsor the Olympic Swiss bobsledder Michael Kuonen and his bobsleigh team. When Michael is not training and competing during the Winter months, he works at Lonza in Visp, the same manufacturing plant as his father and – previously – his grandfather.
8 Lonza Full-Year Report 2019

9 Lonza Full-Year Report 2019
Contract Development and Manufacturing Organization (CDMO) Services BusinessesThe small molecules business continued to benefit from innovative business models (including tailored capacity optimized to customer needs), formulation and encapsulation capabilities. Lonza’s highly po-tent active pharmaceutical ingredients (HPAPI) offerings have made a positive contribution, with a number of new long-term contracts signed with customers including AstraZeneca among others. A contract has also been signed with a major international biopharmaceutical partner for the production of drug substance payloads for antibody drug con-jugates. To address bioavailability challenges, the business launched SimpliFiH™ Solutions, a service package specifically designed for small and emerging innovator companies and their early-stage, first-in-hu-man programs. Dosage forms and delivery systems showed strong performance, securing both commercial business and new long-term contracts. Lonza also entered into an integrated development and man-ufacturing agreement for producing both API and dosage form. The busi-ness has partnered with Emerald Health Pharmaceuticals for its novel, synthetic Cannabinoid-derived (CBD) drug candidate using soft gel and liquid filled hard capsules.
Mammalian and microbial saw ongoing strong momentum for its clinical and commercial offerings in FY 2019. Commercial agreements signed for new and existing assets provide meaningful sales visibility for the mid- and long-term. Commercial capacities for 2020 are largely committed. Lonza has confirmed a major multinational pharmaceutical company as a new Ibex™ Dedicate customer in Visp (CH). This agree-ment relates to the commercial manufacture of a microbial-derived product in addition to other Ibex™ Dedicate partners, including Sanofi and Portola.
Lonza’s integrated clinical service offerings gained traction, with short-ened development and manufacturing timelines, guaranteed delivery of drug product for IND (Investigational New Drug) applications and secured supply for subsequent clinical and commercial requirements. Customers will benefit from Lonza’s gene-to-vial offering in Visp (CH) and Slough (UK), including, among others, Alector, Genmab, and Citryll. Lonza further optimized its proprietary GS Xceed® Toolbox to meet the growing needs for mammalian expression of more complex, in-novative therapeutic proteins. Lonza’s Drug Product Services (DPS) continue to expand in Basel, Stein and Visp (CH), based on increasing customer demand for new solutions to product design, stability and us-ability challenges. Lonza’s newly acquired sterile fill and finish facility for clinical supply and commercial launch of parenteral drug product in Stein started production in August 2019 and secured initial customers including Novartis.
Cell and gene technologies benefitted from continued sales momen-tum in a dynamic market environment, with strong interest in offer-ings including process development and commercial manufacturing. Lonza signed a significant number of clinical and commercial contracts with new customers including, among others, Cellectis, Prevail, and Di-NAQOR. The business also signed new contracts with existing partners, including Mesoblast and Gamida, for commercial supply. The cell and gene business expects at least five late-stage registrations in 2020 within its global network. In the coming year, the business unit will continue to focus on improving operational excellence and on deliver-ing seamless service, removing supply chain challenges in autologous cell therapy and ensuring patient safety in personalized therapies while working on a “vein-to-vein” offering.
Lonza Pharma Biotech & Nutrition (LPBN) achieved continued double-digit sales growth above guidance for the Full-Year 2019. The newly expanded segment now includes the nutritional hard capsules business (acquired with Capsugel), as well as a small portfolio of nutritional ingre-dients and formulation services. LPBN delivered CHF 4.2 billion sales in FY 2019 and a CORE EBITDA of CHF 1.4 billion while investing in strategic growth projects, a number of which are expected to commence operations from the end of 2020.
Lonza Pharma Biotech & Nutrition Segment Overview
CDMO Services Businesses – Small molecules– Mammalian and microbial– Cell and gene technologies
Product Businesses – Bioscience– Capsules systems– Nutritional ingredients

10 Lonza Full-Year Report 2019
Product Businesses
Lonza’s bioscience business for media, research tools, testing solu-tions and quality control software saw increased demand, based on favorable market trends in drug discovery and cell therapy. Lonza is continuing to make progress with operational improvements.
The pharma hard capsules business saw ongoing demand for specialty polymer and dry powder inhalation (DPI) offerings. The business was supported by new product launches but challenged by market condi-tions in the US and slower growth in developed markets. Several long-term agreements were signed.
The nutritional hard capsules business was negatively impacted by increased competition. This was exacerbated by softer demand for con-ventional gelatin hard capsules and slower growth than anticipated in specialty polymer empty capsules, particularly in mature markets. The business started to implement commercial countermeasures with first impact in Q4 2019.
The nutritional ingredients business experienced soft demand. UC-II® manufacturing expansion in Greenwood, SC (USA) is on track to be operational in H1 2020, which will support an improved security of supply.
Lonza is investing in growth opportuni-ties in its core businesses in LPBN. These include capacity expansions and new technologies supporting the full-life cycle of molecules. In 2019, CHF 786 million in Capital expenditures (CAPEX) – 13.3% of sales – was spent financing several im-portant growth projects across Lonza’s global network with expansions in Visp (CH) for clinical and commercial biolog-ics, HPAPI and bioconjugates (including Antibody Drug Conjugates), in Portsmouth, NH (USA) for mid-scale mammalian, in Guangzhou (CN) for clinical mammalian, in Houston (TX), Geleen (NL), Singapore (SG) and Portsmouth, NH (USA) for cell and gene, and in the Basel area (CH) for drug product services.
Lonza carefully weighs risk-return profiles when investing in new initiatives and offers different business models to its customers depending on their needs. For larger com-mercial investments, Lonza seeks con-tractual commitment before build-out. For multi-purpose assets and clinical assets, decisions are based on robust demand pro-jections. Depending on business models, CAPEX contributions and milestone pay-ments by customers may be part of the in-vestment approach. Lonza announced sev-eral new customers for its growth projects in 2019, spanning from biotech companies to big pharma.
More than five significant projects are scheduled to start operations by the end of 2020. Lonza expects a similar level of CAPEX in 2020 as in 2019 as some of the 2019 projects will enter final construction phase and a subsequent set of opportuni-ties will be rolled out. Lonza is at an inflec-tion point as biopharma performance over the last few years was based on historic investments. To continue its current growth trajectory and meet market demand, the business has invested in new capacity, the expansion of its value chain and geographic coverage. 2019 and 2020 constitute a peak investment period with an elevated level of CAPEX spend which is then expected to return to a normalized level. Despite these investments Lonza’s net debt/CORE EBITDA level reduced to 1.83×, and Lonza expects to maintain a solid investment grade rating going forward.
To successfully execute these growth investments and ensure the seamless launch and management of new opera-tions, Lonza must hire and train qualified personnel several months in advance of construction completion and ramp-up. In 2019, LPBN has hired more than 1,000 new employees, on average 500 for the full year.
The OPEX impact of growth initiatives will continue to increase in 2020 as Lonza prepares for the start of clinical projects and commercial launches. Currently, LPBN anticipates that it will recruit a further 600 new employees globally in 2020 in addition to the 1000 employees hired in 2019. This scale of on-going recruitment requires a significant investment in on-boarding and training programs, impacting operating margins.
Planned projects are largely expected to contribute to continued growth in Pharma Biotech & Nutrition beyond the Mid-Term Guidance 2022, as facilities are ramped up over several years before full utilization and profitability levels are achieved. The revenue contribution in 2020 of the invest-ments coming on line in Q4 2020 is likely to be modest. New projects are expected to reach peak sales on average five years after start of operations, although there is a wide range of variation, depending on technology.
Investment Projects Progressing as Planned

11 Lonza Full-Year Report 2019
Specialty Ingredients Segment
1 Restated to reflect the 2019 realignment of Lonza’s segments into Pharma Biotech & Nutrition and Specialty Ingredients. Prior year information has not been restated to reflect the adoption of IFRS 16 Leases (see note 2)
milliOn CHF
2019
Change in %
2018 (Restated)1
Sales 1'693 -3.2 1'749
CORE EBITDA 302 -0.3 303
Margin in % 17.8 17.3
CORE EBITDA excl. IFRS 16 297 -2.0 303
Margin in % 17.5 17.3
CORE result from operating activities (EBIT) 223 -1.8 227
Margin in % 13.2 13.0
CORE result from operating activities (EBIT) excl. IFRS 16 222 -2.2 227
Margin in % 13.1 13.0

12 Lonza Full-Year Report 2019
While general demand for microbial control applications was solid, the business saw mixed performance, which was related to its various end-markets. Home care disinfection as well as professional hygiene saw positive performance in 2019, with continued strong disinfection sales in veterinary, biosecurity, food service and wipes. Personal care ended the year soft but saw an uptake in H2 as Lonza’s anti-dandruff platform for hair care was successfully expanded with the pickup of supply in Europe. Wood protection experienced stable demand, but saw an in-creasingly competitive environment and pricing pressure, especially in the US market. In material protection, Lonza’s oil and gas industry solutions performed strongly; these include corrosion inhibitors and biocides to protect vital operation systems. Polymer and textile faced softer market demand from the automobile industry and still suffered from a suboptimal supply of a BIT (1,2-Benzisothiazolin-3-one)-related intermediate. BIT supply began to regain stability in H2 2019; Lonza expects a fully restored supply by the end of H1 2020. Paints and coat-ings also showed good performance, despite the shortage of key raw material BIT. Crop protection, especially molluscicides, faced ongoing customer destocking after a dry 2018 summer in Europe, aggressive competition from China and further dry weather in 2019.
The SCS business was negatively impacted by ongoing geopolitical tensions, raw material supply challenges and unfavorable cyclical end-markets. The weak market demand for consumer electronics has been magnified by the US-China trade dispute, impacting the compos-ites business in 2019. Custom manufacturing closed ahead of its 2018 performance level. Competitive pressure from China and supply chain challenges resulted in lower volumes of industrial intermediates. De-
mand for agrochemical ingredients was down, and the vitamin B3 busi-ness was impacted by lower volumes due to the African Swine Fever in Asia and low prices at the beginning of the year.
Lonza Specialty Ingredients (LSI) has experienced headwinds during Full-Year 2019. Sales declined 3.2%, resulting in CHF 1,7 billion revenues for the segment. Pricing initiatives, operational improvements and cost control measures resulted in a CORE EBITDA of CHF 302 million and solid 17.8% CORE EBITDA margin. LSI will continue to focus on driving recovery for its business, delivering the carve-out and developing a new market-oriented and efficient organization. Over the course of 2019, LSI has worked to develop the structure of its business to reflect more accurately the underlying technology platforms. The business is now set up with a leading portfolio of Microbial Control Solutions (MCS), supported by a division of dedicated Specialty Chemicals Services (SCS).
Lonza Specialty Ingredients Segment Overview:
Microbial-Control Solutions
– Professional hygiene– Home and personal care– Wood protection– Material protection– Paints and coatings– Crop protection
Specialty Chemical Services
– Composites– Custom manufacturing organization (CMO)– Performance chemicals & intermediates
The carve-out of Lonza’s Specialty Ingredients segment is pro-gressing in line with plans; completion is currently expected in mid-2020. A designated core team of around 40 employees have worked on the carve-out since the program was initiated in June 2019. Cross-functional workstreams include tax, global real estate, HR, environment, IT, communications, treasury, procurement, logistics, legal, IP, regulatory, carve-out structure, regional carve-out and carve-out financials. Carve-out related cost of CHF 19 million had 30 bps negative impact on CORE EBITDA margin for full-year 2019.
Selected milestones in 2020: – Dedicated legal entities by business/segment
(operational in H1 2020) – Assignment of employees to segments – Set up of service and supply agreements between the
two segments progressing – Continued progress in setting up systems to reflect new
legal entity structure
Carve-out of Specialty Ingredients

13 Lonza Full-Year Report 2019
Outlook 2020 and Mid-Term Guidance 2022
– Above mid single-digit sales growth, with high single-digit sales growth in Pharma Biotech & Nutrition and low single-digit sales growth in Specialty Ingredients
– Stable CORE EBITDA margin
– Sales of CHF 7.1 billion– CORE EBITDA margin of 30.5%– CORE RONOA 35%– Double-digit ROIC
Lonza will continue to execute on all the necessary building blocks to achieve its Mid-Term Guidance 2022. In 2020, Lonza will focus on ex-ecuting its growth projects in another major investment year, complet-ing the carve-out of its Specialty Ingredients segment and reviewing future plans. The investment in growth projects in LPBN is expected to remain at 2019 levels in order to further expand Lonza’s asset and technology platforms for future growth. Lonza has also factored into its outlook the continued macroeconomic uncertainty and some po-tential ongoing headwinds in the cyclical parts of Lonza’s Specialty Ingredients businesses.
Concurrently, Lonza will work to strengthen a culture of shared values, collective accountability, commitment and transparency. Lonza will also increase its efforts to ensure a constant pipeline of talent to de-velop as future company leaders. Finally, Lonza will establish clearer environmental, social and governance (ESG) targets and action plans for implementation in 2021.
The following outlook for Full-Year 2020 is provided for Lonza Group:
The Outlook 2020 is the next step in achieving Lonza’s Mid-Term Guid-ance 2022 with all necessary building blocks in place. These include continued operating leverage and efficiency improvements in the LPBN base business, the return to a normalized level of investment in LPBN both in CAPEX and OPEX spend from 2021, alongside productivity gains and business recovery in LSI.
Lonza confirms its Mid-Term Guidance 2022:
Outlook 2020 and Mid-Term Guidance 2022 are based on the present business composition, the current macroeconomic environment, exist-ing visibility and constant exchange rates.
14 Lonza Full-Year Report 2019
CEO Succession
Dividend Announced
In line with its designated responsibility and remit, the Nomination and Compensation Committee (NCC) of Lonza’s Board of Directors is lead-ing the search and evaluation process for a new Chief Executive Officer (CEO). The NCC is recommending potential candidates for assessment by the Board of Directors. The process is expected to be successfully completed with a candidate announced during the course of 2020. To ensure continuing good corporate governance, Lonza appointed Chris-toph Mäder as Lead Independent Director in November 2019. This will remain in place until a new CEO is appointed, at which time the Chair-man will relinquish his additional responsibilities.
Lonza’s Board of Directors is proposing an unchanged dividend for shareholders of CHF 2.75 per share for 2019. The proposal represents a payout of 30.7% of 2019 reported net profit. Subject to approval at the upcoming Annual General Meeting (AGM) on 28 April 2020, the dividend of CHF 2.75 per share for 2019 will be paid from the reserve capital con-tribution and 50% will be free from Swiss withholding tax.1
1 Erratum: The original text concerning Dividend Announced should be clarified as follows: 50% of the dividend of CHF 2.75 per share for 2019 will be paid out of the capital contribution reserve and will therefore be free from Swiss withholding tax. (published 28 January 2020).

15 Lonza Full-Year Report 2019
Changes in Board of Directors
Two changes in Lonza’s Board of Directors were announced. Patrick Aebischer (Vice Chairperson), and Margot Scheltema have decided not to stand for re-election at the upcoming Annual General Meeting (AGM) on 28 April 2020. Patrick Aebischer has been a member of the Board since 2008 and most recently held the role of Vice Chairperson. Mar-got Scheltema has been a member of the Board since 2012. The Board would like to thank them both for their contributions during their years of service to Lonza.
The Board of Directors is proposing to Lonza’s AGM the election of two new Board members, Ms Dorothée Deuring and Dr Moncef Slaoui.
Dorothée Deuring is a professional Board Director and a Corporate Finance Adviser who brings more than 25 years of experience in the fields of manufacturing, biotech, pharmaceuticals and finance. Ms Deuring currently serves on the board of several companies including Axpo, Bilfinger and Elementis. Her Board memberships span the energy, chemical and biopharmaceutical sectors. She received her Master of Science in Chemistry from Université Louis Pasteur, Strasbourg in 1994. She later received her Master in Business Administration from INSEAD, Fontainebleau in 1996.
Dr Moncef Slaoui brings to Lonza extensive experience from his career with GlaxoSmithKline spanning nearly 30 years. In this time, he held a number of leadership positions, including member of the board of GSK Plc, Chairman Pharmaceutical R&D; Chairman, Global R&D for Vaccines & Oncology; and Chairman, Global Vaccines. Currently, Dr Slaoui is part-ner at Medicxi, a venture capital firm specializing in seed, Series A, early stage and late stage life sciences investments; he also sits on various biotechnology companies’ boards. Dr Slaoui received his Ph.D in Mo-lecular Biology and Immunology from Brussels University in 1983. He later received an accelerated Master of Business Administration from IMD, Switzerland in 1998.
The Board is further proposing to the AGM the re-election of all other Board members.

16 Lonza Full-Year Report 2019
Discontinued Operations
Water Care milliOn CHF
20191
2018
Sales 74 516
CORE EBITDA (5) 36
Corporate
milliOn CHF
20192
2018
Sales 60 38
CORE EBITDA (53) (38)
CORE EBITDA excl. IFRS 16 (57) (38)
CORE result from operating activities (EBIT) (103) (82)
CORE result from operating activities (EBIT) excl. IFRS 16 (102) (82)
1 The Water Care business was sold effective 28 February 2019. Therefore, 2019 information is not comparable to 2018 results, as it only comprises two months
2 The carve out had an impact of CHF 19 million on the CORE EBIT at Corporate
17 Lonza Full-Year Report 2019
Condensed Financial Statements
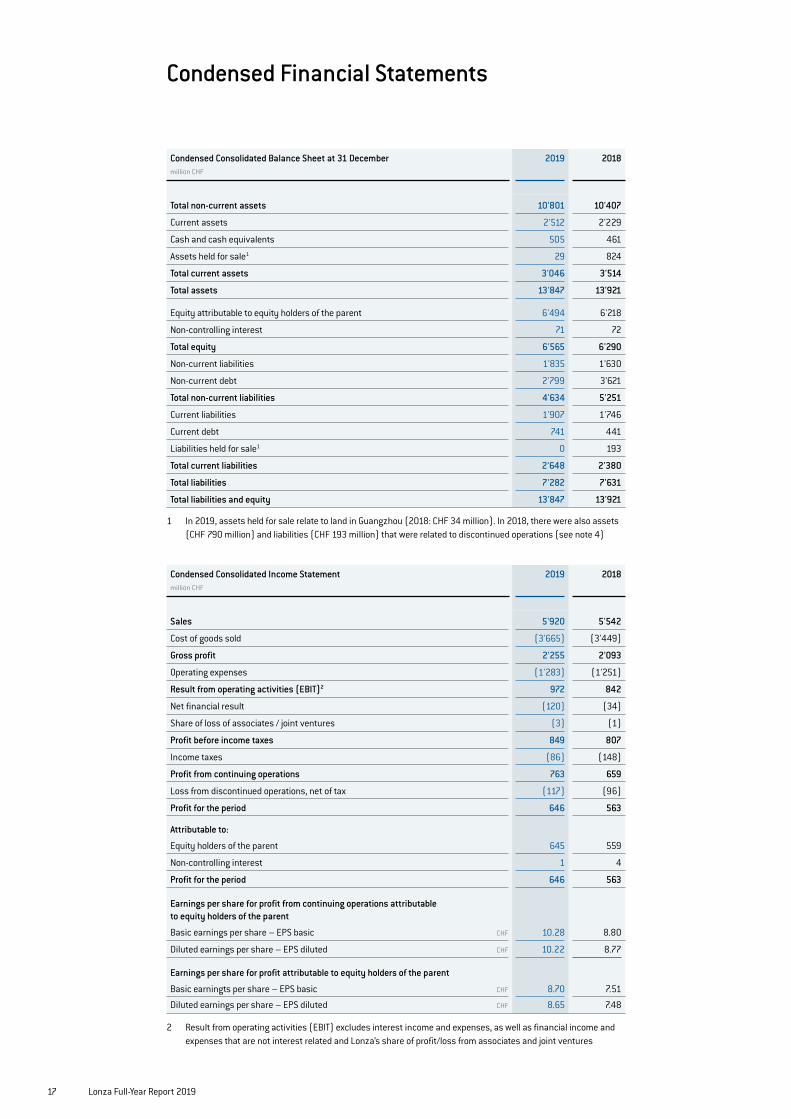
Condensed Consolidated Balance Sheet at 31 December milliOn CHF
2019 2018
Total non-current assets 10'801 10'407
Current assets 2'512 2'229
Cash and cash equivalents 505 461
Assets held for sale1 29 824
Total current assets 3'046 3'514
Total assets 13'847 13'921
Equity attributable to equity holders of the parent 6'494 6'218
Non-controlling interest 71 72
Total equity 6'565 6'290
Non-current liabilities 1'835 1'630
Non-current debt 2'799 3'621
Total non-current liabilities 4'634 5'251
Current liabilities 1'907 1'746
Current debt 741 441
Liabilities held for sale1 0 193
Total current liabilities 2'648 2'380
Total liabilities 7'282 7'631
Total liabilities and equity 13'847 13'921
1 In 2019, assets held for sale relate to land in Guangzhou (2018: CHF 34 million). In 2018, there were also assets (CHF 790 million) and liabilities (CHF 193 million) that were related to discontinued operations (see note 4)
Condensed Consolidated Income Statement milliOn CHF
2019 2018
Sales 5'920 5'542
Cost of goods sold (3'665) (3'449)
Gross profit 2'255 2'093
Operating expenses (1'283) (1'251)
Result from operating activities (EBIT)2 972 842
Net financial result (120) (34)
Share of loss of associates / joint ventures (3) (1)
Profit before income taxes 849 807
Income taxes (86) (148)
Profit from continuing operations 763 659
Loss from discontinued operations, net of tax (117) (96)
Profit for the period 646 563
Attributable to:
Equity holders of the parent 645 559
Non-controlling interest 1 4
Profit for the period 646 563
Earnings per share for profit from continuing operations attributable to equity holders of the parent
Basic earnings per share – EPS basic CHF 10.28 8.80
Diluted earnings per share – EPS diluted CHF 10.22 8.77
Earnings per share for profit attributable to equity holders of the parent
Basic earningts per share – EPS basic CHF 8.70 7.51
Diluted earnings per share – EPS diluted CHF 8.65 7.48
2 Result from operating activities (EBIT) excludes interest income and expenses, as well as financial income and expenses that are not interest related and Lonza’s share of profit/loss from associates and joint ventures

18 Lonza Full-Year Report 2019
Condensed Consolidated Statement of Comprehensive Income milliOn CHF
2019 2018
Profit for the period 646 563
Other comprehensive income:
Items that will not be reclassified to profit or loss:
Re-measurements of net defined benefit liability (43) 7
Income tax on items that will not be reclassified to profit or loss 7 (1)
(36) 6
Items that are or may be reclassified subsequently to profit or loss:
Exchange differences on translating foreign operations (153) (222)
Cash flow hedges (5) (16)
Income tax on items that are or may be reclassified to profit or loss 0 3 (158) (235)
Other comprehensive income for the period, net of tax (194) (229)
Total comprehensive income for the period 452 334
Total comprehensive income attributable to:
Equity holders of the parent 452 333
Non-controlling interest 0 1
Total comprehensive income for the period 452 334

19 Lonza Full-Year Report 2019
Condensed Consolidated Cash Flow Statement milliOn CHF
2019 2018
Profit for the period 646 563
Adjustment for non-cash items 965 941
Income tax and interest paid (208) (225)
Increase of net working capital (319) (29)
Use of provisions (56) (45)
Decrease of other payables, net (42) (123)
Net cash provided by operating activities 986 1'082
Purchase of property, plant & equipment and intangible assets (786) (575)
Acquisition of subsidiaries, net of cash acquired (24) (28)
Disposal of subsidiary, net of cash disposed of 620 (1)
Net purchase of other assets and disposals (34) (9)
Increase in loans and advances (69) (41)
Interest and dividend received 8 2
Net cash used for investing activities (285) (652)
Repayment of straight bond (300) (340)
Repayment of term loan (977) 0
Issuance of syndicated loan 144 29
Issuance of term loans 1'242 0
Repayment of syndicated loan (263) 0
Repayment of bank loans (198) 0
Increase / (decrease) in debt (94) 152
Payment of lease liabilities (33) 0
Increase in other non-current liabilities 60 29
Capital injection from non-controlling interest 1 0
Purchase of treasury shares (48) (77)
Dividends paid1 (206) (206)
Net cash used for financing activities (672) (413)
Effect of currency translation on cash (6) (14)
Net increase in cash and cash equivalents 23 3
Cash and cash equivalents at 1 January 482 479
Cash and cash equivalents at 31 December 505 482
Cash and cash equivalents at 31 December classified as held for sale 0 (21)
Cash and cash equivalents at 31 December (as reported) 505 461
1 Includes dividends of CHF 2 million (2018: CHF 1 million) paid to non-controlling interest shareholders of a subsidiary
20 Lonza Full-Year Report 2019
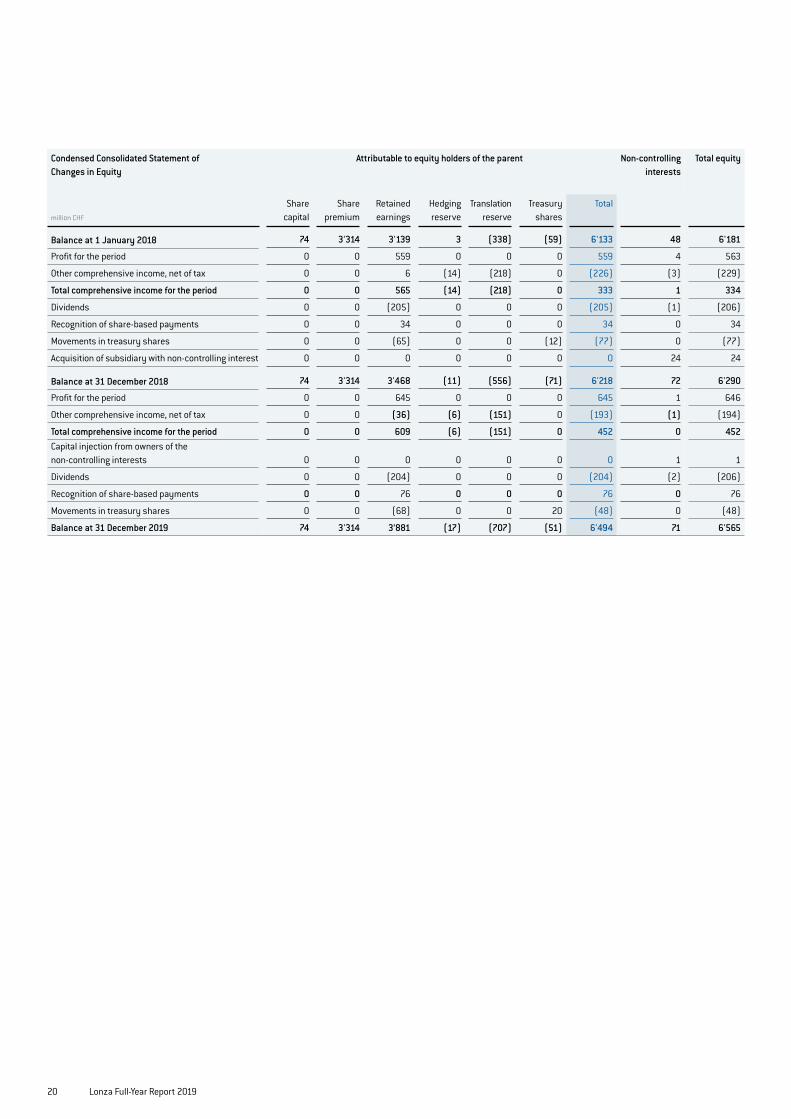
Condensed Consolidated Statement of Changes in Equity
Attributable to equity holders of the parent Non-controlling interests
Total equity
milliOn CHF
Share capital
Share premium
Retained earnings
Hedging reserve
Translation reserve
Treasury shares
Total
Balance at 1 January 2018 74 3'314 3'139 3 (338) (59) 6'133 48 6'181
Profit for the period 0 0 559 0 0 0 559 4 563
Other comprehensive income, net of tax 0 0 6 (14) (218) 0 (226) (3) (229)
Total comprehensive income for the period 0 0 565 (14) (218) 0 333 1 334
Dividends 0 0 (205) 0 0 0 (205) (1) (206)
Recognition of share-based payments 0 0 34 0 0 0 34 0 34
Movements in treasury shares 0 0 (65) 0 0 (12) (77) 0 (77)
Acquisition of subsidiary with non-controlling interest 0 0 0 0 0 0 0 24 24
Balance at 31 December 2018 74 3'314 3'468 (11) (556) (71) 6'218 72 6'290
Profit for the period 0 0 645 0 0 0 645 1 646
Other comprehensive income, net of tax 0 0 (36) (6) (151) 0 (193) (1) (194)
Total comprehensive income for the period 0 0 609 (6) (151) 0 452 0 452 Capital injection from owners of the non-controlling interests 0 0 0 0 0 0 0 1 1
Dividends 0 0 (204) 0 0 0 (204) (2) (206)
Recognition of share-based payments 0 0 76 0 0 0 76 0 76
Movements in treasury shares 0 0 (68) 0 0 20 (48) 0 (48)
Balance at 31 December 2019 74 3'314 3’881 (17) (707) (51) 6'494 71 6'565

21 Lonza Full-Year Report 2019
Selected Explanatory Notes
Basis of Preparation of Financial Statements
These unaudited condensed financial statements are based on the consolidated financial state-ments for the twelve-month period ended 31 December 2019 that will be prepared in accordance with the International Financial Reporting Standards (IFRS), issued by the International Account-ing Standards Board (IASB).
New Standards, Interpretations and AmendmentsThe following new or amended standards became applicable for the current reporting period and the Group changed its accounting policies as a result of adopting these standards:
– IFRS 16 Leases – IFRIC 23 Uncertainty over Income Tax Treatments
The impact of the adoption of IFRS16 Leases is disclosed in note 2 below. The adoption of IFRIC 23 did not have significant impact on the Group’s financial statements.
Changes in Accounting Policies
IFRS 16 introduced a single, on balance sheet accounting model for lessees. As a result, the Group, as a lessee, has recognized right-of-use assets representing its right to use the underly-ing assets and lease liabilities representing its obligation to make lease payments. Lessor ac-counting remains similar to previous accounting policies. The Group has initially adopted IFRS 16 Leases from 1 January 2019 and applied the modified retrospective method, under which the cumulative effect of initial application is recognized in retained earnings at 1 January 2019. Consequently, comparative 2018 information has not been restated. The Group elected to use the transition practical expedient allowing the standard to be applied only to contracts that were previously identified as leases applying IAS 17 and IFRIC 4 at the date of initial application. The Group also elected to use the recognition exemptions for lease contracts for which the lease term ends within 12 months at the date of initial application and lease contracts for which the underlying asset is of low value (‘low-value assets’).
Nature of Lease ContractsThe Group has lease contracts for various items of buildings, machinery, vehicles and other equipment. Before the adoption of IFRS 16, the Group classified each of its leases (as lessee) at the inception date as either a finance lease or an operating lease. A lease was classified as a finance lease if it transferred substantially all of the risks and rewards incidental to ownership of the leased asset to the Group; otherwise it was classified as an operating lease. Finance leases were capitalized at the commencement of the lease at the inception date fair value of the leased property or, if lower, at the present value of the minimum lease payments. Lease payments were apportioned between interest (recognized as financing costs) and reduction of the lease liability. In an operating lease, the leased property was not capitalized and the lease payments were rec-ognized as rent expense in profit or loss on a straight-line basis over the lease term.
Upon adoption of IFRS 16, the Group applied a single recognition and measurement approach for all leases, except for short-term leases and leases of low-value assets.
1
2

22 Lonza Full-Year Report 2019
Summary of Changes in the Group’s Accounting Policies Resulting from the Implementation of IFRS 16Right-of-use AssetsThe Group recognizes right-of-use assets at the commencement date of the lease (i.e., the date the underlying asset is available for use). Right-of-use assets are measured at cost, less any accumulated depreciation and impairment losses, and adjusted for any remeasurement of lease liabilities. The cost of right-of-use assets includes the amount of lease liabilities recognized, ini-tial direct costs incurred, and lease payments made at or before the commencement date less any lease incentives received. Unless the Group is reasonably certain to obtain ownership of the leased asset at the end of the lease term, the recognized right-of-use assets are depreciated on a straight-line basis over the shorter of its estimated useful life and the lease term. Right-of-use assets are subject to impairment.
Lease LiabilitiesAt the commencement date of the lease, the Group recognizes lease liabilities measured at the present value of lease payments to be made over the lease term. The lease payments include fixed payments (including in-substance fixed payments), variable lease payments that depend on an index or a rate, and amounts expected to be paid under residual value guarantees. The lease payments also include the exercise price of a purchase option reasonably certain to be ex-ercised by the Group and payments of penalties for terminating a lease, if the lease term reflects the Group exercising the option to terminate. The variable lease payments that do not depend on an index or a rate are recognized as an expense in the period in which the event or condition that triggers the payment occurs.
Summary of Impacts on Group’s Financial StatementsAt transition, for leases classified as operating leases under IAS 17, lease liabilities were mea-sured at the present value of remaining lease payments, discounted at the Group’s incremental borrowing rate for each asset class as at 1 January 2019. Right-of-use assets were measured at an amount equal to the lease liability, adjusted by the amount of any prepaid or accrued lease payments. The Group applied the following practical expedients when applying IFRS 16 to leases previously classified as operating leases under IAS 17 (in addition to the general practical expedients de-scribed above):
– Exemption not to recognize right-of-use assets and liabilities for which the lease term ends within 12 months of the date of initial application
– Excluded initial direct costs from measuring the right-of-use assets at the date of initial application

23 Lonza Full-Year Report 2019
Transition Impacts from the Recognition of Right-of-use Assets and Lease Liabilities as of 1 January 2019The impact on transition is summarized below:
million CHF 1 January 2019
Right-of-use assets presented in property, plant & equipment 238
Right-of-use assets presented in assets held for sale 15
Lease liabilities 236
Lease liabilities classified as liabilities held for sale 15
For the lease liabilities for leases that were previously classified as operating leases, the Group discounted lease payments using its incremental borrowing rate 1 January 2019. The weighted average rate applied is 3.6%.
Impact for the PeriodThe Group recognized the following amounts related to leases previously classified as operating leases in the income statement for the twelve-month period ended 31 December 2019.
million CHF 2019
Depreciation of right-of-use assets 31
Interest expenses 9
Lease payments for 2019 amounted to CHF 33 million. Consequently, applying IFRS 16 had a favorable impact of CHF 33 million on the Group’s EBITDA and CHF 2 million on the Group’s EBIT.
Exchange Rates
Balance Sheet period-end rate CHF
31.12.2019
31.12.2018
US dollar 0.97 0.99
Pound sterling 1.27 1.25
Euro 1.09 1.13
Income Statement average rate CHF
2019
2018
US dollar 0.99 0.98
Pound sterling 1.27 1.31
Euro 1.11 1.15
3
24 Lonza Full-Year Report 2019
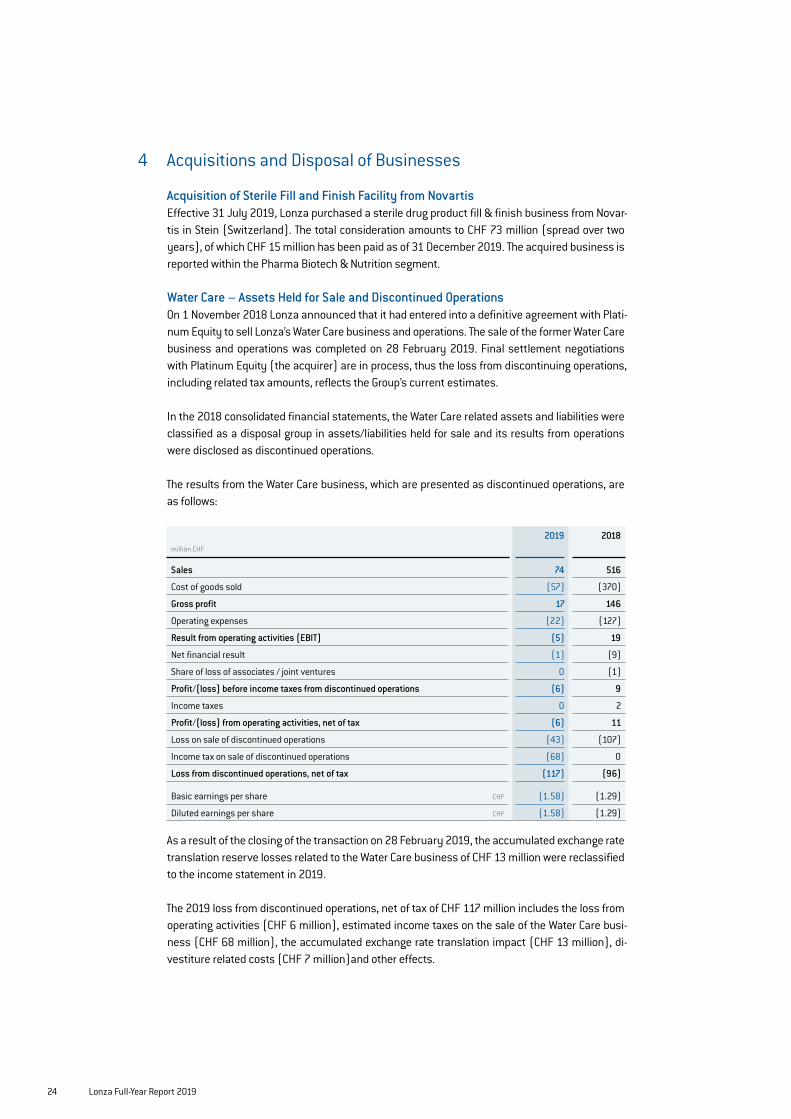
Acquisitions and Disposal of Businesses
Acquisition of Sterile Fill and Finish Facility from NovartisEffective 31 July 2019, Lonza purchased a sterile drug product fill & finish business from Novar-tis in Stein (Switzerland). The total consideration amounts to CHF 73 million (spread over two years), of which CHF 15 million has been paid as of 31 December 2019. The acquired business is reported within the Pharma Biotech & Nutrition segment.
Water Care – Assets Held for Sale and Discontinued OperationsOn 1 November 2018 Lonza announced that it had entered into a definitive agreement with Plati-num Equity to sell Lonza’s Water Care business and operations. The sale of the former Water Care business and operations was completed on 28 February 2019. Final settlement negotiations with Platinum Equity (the acquirer) are in process, thus the loss from discontinuing operations, including related tax amounts, reflects the Group’s current estimates.
In the 2018 consolidated financial statements, the Water Care related assets and liabilities were classified as a disposal group in assets/liabilities held for sale and its results from operations were disclosed as discontinued operations.
The results from the Water Care business, which are presented as discontinued operations, are as follows:
milliOn CHF
2019 2018
Sales 74 516
Cost of goods sold (57) (370)
Gross profit 17 146
Operating expenses (22) (127)
Result from operating activities (EBIT) (5) 19
Net financial result (1) (9)
Share of loss of associates / joint ventures 0 (1)
Profit/(loss) before income taxes from discontinued operations (6) 9
Income taxes 0 2
Profit/(loss) from operating activities, net of tax (6) 11
Loss on sale of discontinued operations (43) (107)
Income tax on sale of discontinued operations (68) 0
Loss from discontinued operations, net of tax (117) (96)
Basic earnings per share CHF (1.58) (1.29)
Diluted earnings per share CHF (1.58) (1.29)
As a result of the closing of the transaction on 28 February 2019, the accumulated exchange rate translation reserve losses related to the Water Care business of CHF 13 million were reclassified to the income statement in 2019.
The 2019 loss from discontinued operations, net of tax of CHF 117 million includes the loss from operating activities (CHF 6 million), estimated income taxes on the sale of the Water Care busi-ness (CHF 68 million), the accumulated exchange rate translation impact (CHF 13 million), di-vestiture related costs (CHF 7 million)and other effects.
4

25 Lonza Full-Year Report 2019
Dividends Paid
On 18 April 2019, the Annual General Meeting approved the distribution of a dividend of CHF 2.75 (financial year 2017: CHF 2.75) per share in respect of the 2018 financial year. The distribution to holders of outstanding shares totaled CHF 204 million (2018: CHF 205 million) and has been recorded against reserves from capital contribution of Lonza Group Ltd.
Net Financial Result from Continuing Operations
The net financial result from continuing operations are as follows:
milliOn CHF
2019 2018
Net interest expenses (65) (74)
Net interest expenses on defined benefit plan liabilities (9) (10)
Interest expense on IFRS 16 lease liabilities (9) 0
Amortization of debt fees and discounts (5) (7)
Fair value adjustment on Lonza's pre-acquisition investment in Octane 0 32 Foreign exchange rate differences, including impact from currency-related financial derivative instruments (18) 39
Other net financial expenses (14) (14)
Net financial result (120) (34)
5
6

26 Lonza Full-Year Report 2019
Supplementary Financial Information
This Finance Report includes alternative performance measures that are not clearly defined in IFRS (non-GAAP-measures). These supplemental financial measures should not be viewed in isolation or as alternatives to Lonza’s consolidated financial position, financial results and cash flows reported in accordance with IFRS.
Results at Constant Exchange Rates (CER)
Lonza Group milliOn CHF
2019 Change in %
2018
Sales 5'944 7.3 5'542
CORE EBITDA 1'624 7.5 1'511
Margin in % 27.3 27.3
CORE result from operating activities (EBIT) 1'249 7.2 1'165
Margin in % 21.0 21.0
1 Restated to reflect the realignment of Lonza’s segments into Pharma Biotech & Nutrition and Specialty Ingredients
Pharma Biotech & Nutrition milliOn CHF
2019 Change in %
2018 (Restated)1
Sales 4'178 11.3 3'755
CORE EBITDA 1'370 10.0 1'246
Margin in % 32.8 33.2
CORE result from operating activities (EBIT) 1'123 10.1 1'020
Margin in % 26.9 27.2
Specialty Ingredients milliOn CHF
2019 Change in %
2018 (Restated)1
Sales 1'706 (2.5) 1'749
CORE EBITDA 307 1.3 303
Margin in % 18.0 17.3
CORE result from operating activities (EBIT) 228 0.4 227
Margin in % 13.4 13.0
Corporate milliOn CHF
2019 2018
Sales 60 38
CORE EBITDA (53) (38)
CORE result from operating activities (EBIT) (102) (82)
1

27 Lonza Full-Year Report 2019
Reconciliation of IFRS results to CORE Results 2019
milliOn CHF
IFRS result
Amortization of intangible assets from acquisitions
Impairments
Reversal of impairments
Restructuring costs/income
Income/ expense
resulting from acquisition
and divestitures1
Environmental-related
expenses
Other
CORE result
Result from operating activities (EBIT) 972 169 16 (7) 30 45 20 0 1'245
Net financial result (120) 0 0 0 0 4 0 0 (116)
Share of profit / (loss) of associates/joint ventures (3) 0 0 0 0 0 0 0 0
Profit before income taxes 849 169 16 (7) 30 49 20 3 1'129
Income taxes2 (86) (17) (2) 0 (3) (5) (2) 0 (115)
Profit from continuing operations 763 152 14 (7) 27 44 18 3 1'014
Profit / (loss) from discontinued operations, net of tax (117) 0 0 0 0 121 0 0 4
Profit for the period 646 152 14 (7) 27 165 18 3 1'018
Non-controlling interest (1) 0 0 0 0 0 0 0 (1)
Profit for the period, attributable to the equity holders of the parent 645 152 14 (7) 27 165 18 3 1'017
Number of Shares Basic 74'109'308 74'109'308
Number of Shares Diluted 74'564'802 74'564'802
Earnings per share for profit from continuing operations attributable to equity holders of the parent:
Basic earnings per share – EPS basic CHF 10.28 13.67
Diluted earnings per share – EPS diluted CHF 10.22 13.59
Earnings per share for profit attributable to equity holders of the parent:
Basic earnings per share – EPS basic CHF 8.70 13.72
Diluted earnings per share – EPS diluted CHF 8.65 13.64
CORE Results2
1 Income / expense resulting from acquisition and divestitures Result from operating activities (EBIT): – Integration cost resulting from the acquisition of Capsugel (CHF 41 million) and other acquisitions Discontinued operations: – Water Care related divestiture expenses 2 Tax impact calculated based on the estimated average Group tax rate of: 10.2%
Lonza believes that disclosing CORE results of the Group’s performance enhances the financial markets’ understanding of the company because the CORE results enable better comparison across years.
CORE results exclude exceptional expenses and income such as restructuring, environment remediation, acquisitions and divestitures, impairments and amortization of acquisition-related intangible assets, which can differ significantly from year to year. For this same reason, Lon-za uses these CORE results in addition to IFRS as important factors in internally assessing the Group’s performance.

28 Lonza Full-Year Report 2019
1 Impairment charges relate to the market revaluation of land in Guangzhou (CHF 35 million), the production facilities in Walkersville subsequent to the transfer of the cell-therapy activities to Portsmouth and Houston (CHF 29 million) as well as other production assets in Nansha and Visp
2 Income / expense resulting from acquisition and divestitures Result from operating activities (EBIT):
– Integration cost resulting from the acquisition of Capsugel (CHF 28 million) and other acquisitions Net financing costs: – Fair value adjustment on Lonza’s pre-acquisition investment in Octane Discontinued operations: – Water Care related divestiture expenses 3 Tax impact calculated based on the estimated average Group tax rate of: 18.3%
Reconciliation of EBIT to EBITDA (Continuing Business)
milliOn CHF
2019 2018
Result from operating activities (EBIT) 972 842
Depreciation of property, plant and equipment 351 322
Amortization of intangible assets 193 188 Impairment and reversal of impairment on property, plant, equipment and intangibles 9 77
Earnings before interests, taxes and depreciation (EBITDA) 1'525 1’429
Reconciliation of EBITDA to CORE EBITDA (Continuing Business)
milliOn CHF
2019 2018
Earnings before interests, taxes and depreciation (EBITDA) 1'525 1'429
Restructuring costs / income 30 11
Income / expense resulting from acquisition and divestitures 45 30
Environmental-related expenses 20 41
CORE EBITDA 1'620 1'511
Reconciliation of IFRS results to CORE Results 2018
milliOn CHF
IFRS result
Amortization of intangible assets from acquisitions
Impairments1
Restructuring costs/income
Income/expense resulting from
acquisition and divestitures2
Environmental-related expenses
Other
CORE result
Result from operating activities (EBIT) 842 164 77 11 30 41 0 1'165
Net financial result (34) 0 0 0 (32) 0 1 (65)
Share of profit of associates (1) 0 0 0 0 0 1 0
Profit before income taxes 807 164 77 11 (2) 41 2 1'100
Income taxes3 (148) (30) (14) (2) 0 (7) 0 (201)
Profit from continuing operations 659 134 63 9 (2) 34 2 899
Profit / (loss) from discontinued operations, net of tax (96) 3 69 1 18 0 1 (4)
Profit for the period 563 137 132 10 16 34 3 895
Non-controlling interest (4) 0 0 0 0 0 0 (4)
Profit for the period, attributable to the equity holders of the parent 559 137 132 10 16 34 3 891
Number of Shares Basic 74'408'243 74'408'243
Number of Shares Diluted 74'723'145 74'723'145
Earnings per share for profit from continuing operations attributable to equity holders of the parent:
Basic earnings per share – EPS basic CHF 8.80 12.03
Diluted earnings per share – EPS diluted CHF 8.77 11.98
Earnings per share for profit attributable to equity holders of the parent:
Basic earnings per share – EPS basic CHF 7.51 11.97
Diluted earnings per share – EPS diluted CHF 7.48 11.92

29 Lonza Full-Year Report 2019
Operational Free Cash Flow
In 2019 and 2018, the development of operational free cash flow by component was as follows:
Components of operational free cash flow1 milliOn CHF
2019 Change 2018
Earnings before interests, taxes and depreciation (EBITDA) 1'489 47 1'442
Change of operating net working capital (336)2 (307) (29)
Capital expenditures in tangible and intangible assets (786) (211) (575)
Disposal of tangible and intangible assets 15 7 8
Change of other assets and liabilities 173 15 2
Operational free cash flow (before acquisitions / disposals) 399 (449) 848
Acquisition of subsidiaries (24) 4 (28)
Disposal of subsidiaries 620 620 0
Operational free cash flow 995 175 820
1 Operational Cash Flow represents Lonza Group incl. Discontinued Operations 2 Includes non-cash amortization of current deferred income of CHF 17 million,
recognized in the income statement through EBITDA. 3 Includes non-cash amortization of non-current deferred income of CHF 9 million,
recognized in the income statement through EBITDA.
Return on Net Operating Assets (RONOA)
Reconciliation of NOA to CORE NOA Net operating assets (NOA) allow for an assessment of the Group’s operating performance inde-pendently from financing activities.
NOA contains all operating assets (excluding goodwill) less operating liabilities and is defined as property, plant and equipment, intangible assets, net working capital and long-term net operat-ing assets minus operating liabilities.
CORE NOA adjusts NOA for intangible assets acquired through a business combination.
Components of Net Operating Assets and CORE Net Operating Assets for the Twelve Months Ended 31 December
milliOn CHF
2019 2018
Non-current operating assets excluding goodwill 6'929 6'505
Inventories 1'392 1'250
Trade receivables 759 692
Other operating receivables 295 240
Trade payables (453) (428)
Other operating liabilities (1'499) (1'464)
NOA 7'423 6'795
Acquisition-related intangible assets (2'999) (3'238)
CORE NOA 4'424 3'557
3
4

30 Lonza Full-Year Report 2019
5
Reconciliation of RONOA and CORE RONOARONOA is calculated by dividing NOA (average) by the Group’s EBIT. CORE RONOA is calculated by dividing CORE NOA (average) by the Group’s CORE EBIT.
milliOn CHF
2019 2018
NOA (average)1 7'512 6'956
EBIT 972 842
RONOA 12.9% 12.1%
CORE NOA (average)1 4'363 3'713
CORE EBIT 1'245 1'165
CORE RONOA 28.5% 31.4%
1 Calculated at historical monthly averages
Return On Invested Capital from Continuing Operations
Lonza’s Return On Invested Capital (ROIC) is defined as net operating profit after taxes (NOPAT) divided by the average invested capital of Lonza Group.
In 2019 and 2018, the development of ROIC by component was as follows:
Components of Average Invested Capital for the Twelve Months Ended 31 December
milliOn CHF
2019 2018
CORE result from operating activities (CORE EBIT) 1'245 1'165
Amortization of acquisition-related intangibles assets (169) (164)
Share of result of associates / joint ventures and interest on operating leases (3) (1)
Debt impact of operating leases (ROIC)1 0 4
Net operating profit before taxes 1'073 1'004
Taxes2 (104) (184)
Net operating profit after taxes (NOPAT) 969 820
Average invested capital 10'648 10'254
ROIC (in %) 9.1 8.0
1 Adjustment for financial year 2018 to reflect the expected impact from the adoption of IFRS 16-Leases on the operating profit. Following the adoption of IFRS 16, this adjustment is not required for the financial year 2019
2 Group tax rate of 10.2% for 2019 and 18.3% for 2018

31 Lonza Full-Year Report 2019
The invested capital represents the average of the monthly balances of the following components:
Components of Average Invested Capital for the Twelve Months Ended 31 December
milliOn CHF
2019 Change 2018
CORE net operating assets 4'363 650 3'713
Goodwill 3'722 (64) 3'786
Acquisition-related intangible assets 3'149 (95) 3'244
Other assets1 219 (101) 320
Net current and deferred tax liabilities (805) 4 (809)
Average invested capital 10'648 394 10'254
1 Investments in associates / joint ventures and operating cash. Also includes the present value of operating leases for 2018 only (from 2019, leases are part of CORE net operating assets)
Net Debt
The Net Debt Comprises:
milliOn CHF
2019 Change 2018
Debt
Non-current debt 2'799 (822) 3'621
Current debt 741 300 441
Total debt 3'540 (522) 4'062
Loans and advances
Non-current loans and advances (72) (26) (46)
Current advances (2) (2) 0
Cash and cash equivalents (505) (44) (461)
Cash and cash equivalents classified as held for sale 0 21 (21)
Total loans and advances and cash and cash equivalents (579) (51) (528)
Net debt 2’961 (573) 3’534
Refinancing Extension and Increase of Term and Revolving Bank Facilities
Following the assignment of Lonza’s investment grade rating by S&P (BBB+), Lonza refinanced and extended its syndicated Term and Revolving Bank Facilities Agreement effective 6 Septem-ber 2019.
Former terms of Lonza’s syndicated loans included a credit facility of CHF 700 million, of which CHF 259 million was used as of 31 December 2018, due 2023, at floating interest rated (based on LIBOR). After the refinancing, Lonza’s syndicated loans include a credit facility of CHF 1,000 million, of which CHF 80 million and USD 65 million was used as of 31 December 2019.
Former term loans included EUR 450 million and USD 489 million, repayable in 2020 and 2022 (EUR 225 million and USD 245 million at the first maturity date). After the refinancing, term loans include USD 700 million and EUR 500 million, repayable in tranches up until 2025.
6

Forward-Looking StatementsForward-looking statements contained herein are qualified in their entirety as there are certain factors that could cause results to dif-fer materially from those anticipated. Any statements contained herein that are not statements of historical fact (including state-ments containing the words “outlook,” “guidance,” “believes,” “plans,”
“anticipates,” “expects,” “estimates” and similar expressions) should be considered to be forward-looking statements. Investors are cautioned that all forward-looking statements involve risks and uncertainty.
There are a number of important factors that could cause actual re-sults or events to differ materially from those indicated by such for-ward-looking statements, including the timing and strength of new product offerings; pricing strategies of competitors; the company’s ability to continue to receive adequate products from its vendors on acceptable terms, or at all, and to continue to obtain sufficient financ-ing to meet its liquidity needs; difficulty to maintain relationships with employees, customers and other business partners; and changes in the political, social and regulatory framework in which the company operates, or in economic or technological trends or conditions, includ-ing currency fluctuations, inflation and consumer confidence, on a global, regional or national basis.
In particular, the assumptions underlying the Outlook 2020 and Mid-Term Guidance 2022 herein may not prove to be correct. The state-ments in the section on Outlook 2020 and Mid-Term Guidance 2022 constitute forward-looking statements and are not guarantees of future financial performance.
Lonza’s actual results of operations could deviate materially from those set forth in the section on Outlook 2020 and Mid-Term Guid-ance 2022 as a result of the factors described above or other factors. Investors should not place undue reliance on the statements in the section on Outlook 2020 and Mid-Term Guidance 2022. Except as oth-erwise required by law, Lonza disclaims any intention or obligation to update any forward-looking statements as a result of developments occurring after this presentation was published.
DisclaimerLonza Group Ltd has its headquarters in Basel, Switzerland, and is listed on the SIX Swiss Exchange. It has a secondary listing on the Singapore Exchange Securities Trading Limited (“SGX-ST”). Lonza Group Ltd is not subject to the SGX-ST’s continuing listing requirements but remains subject to Rules 217 and 751 of the SGX-ST Listing Manual.
© 2020 Lonza Ltd
10–11 Feb 2020 CEO roadshow Boston & New York (BAML)
18 Feb 2020 CEO & CFO roadshow London (Morgan Stanley)
3–4 March 2020 Credit Suisse Healthcare Conference (London)
17 March 2020 Annual Report 2019 (Tentative)
28 April 2020 Annual General Meeting, Basel (CH)
30 April 2020 Ex-Dividend Date
4 May 2020 Record-Dividend Date
5 May 2020 Dividend-Payment Date
24 July 2020 Half-Year Results 2020
For publications and further information please contact:
Lonza Group LtdMuenchensteinerstrasse 384002 Basel, SwitzerlandTel + 41 61 316 81 11www.lonza.com
Investor RelationsTel + 41 61 316 85 [email protected]
Media / Corporate CommunicationsTel + 41 61 316 87 [email protected]
Share Registerc/o Computershare Schweiz AGP.O. Box4601 Olten, SwitzerlandTel + 41 62 205 77 00Fax + 41 62 205 77 [email protected]