full year financial results 21 may 2019 - s3.amazonaws.com · home for talent. working in...
TRANSCRIPT

Full year financial results21 May 2019

2
Business review Darren Throop

Strong growth in underlying EBITDA in FY19
• Underlying EBITDA up 21% to £198 million (FY18: £164 million), with EBITDA margin up 510 basis points to 21.0%
• Revenue reduced by 9% to £941 million (FY18: £1,029 million), reflecting change in film strategy
Family & Brands continues to deliver strong growth in revenue and underlying EBITDA
• Revenue up 28% to £159 million and EBITDA up 37% to £97 million
• Retail sales up 6% to US$2.5 billion (FY18: US$2.4 billion), broader consumer roll out of our brands still to come
• Increased mix of high margin AVOD and SVOD platform revenues
Film, Television & Music earnings mix rebalancing towards television and music activities
• Underlying EBITDA up 9% to £115 million (FY18: £106 million), with margins up 300 basis points to 14.6%
• Revenues at £789 million (FY18: £911 million) largely attributable to the decline across the home entertainment market
• Integration of Film and Television Divisions completed, on track to deliver £13-15 million annualised cost savings by end of FY20; £6 million through FY19
• Transition in film activities now largely complete, with a smaller slate of high quality, more focused titles going forward: financial benefits being realised
• Exciting content pipeline across the film, television (over 60 funded projects in development) and music businesses
Acquisitions during the year of Sierra/Affinity and Whizz Kid, and Audio Network following the year end secure additional creative and management talent as well as global content rights
Increase in independent valuation of the content library from US$1.7 billion to US$2.0 billion
Year end net debt: Group EBITDA leverage of 1.7x, slightly better than previous guidance
3

Home for talent
Working in partnership with the world’s best talent across film, television, music and family brands
High quality content creation
Our talent relationships and platform-agnostic approach enables us to develop and produce highly valued content across multiple media formats
End-to-end capabilities
We offer scale and a full suite of production capabilities to enable our creative partners to bring the best content and brands to market
Global rights ownership
At the heart of everything we do is our growing library of high quality content rights that we monetise across the world
4

Family & Brands
5
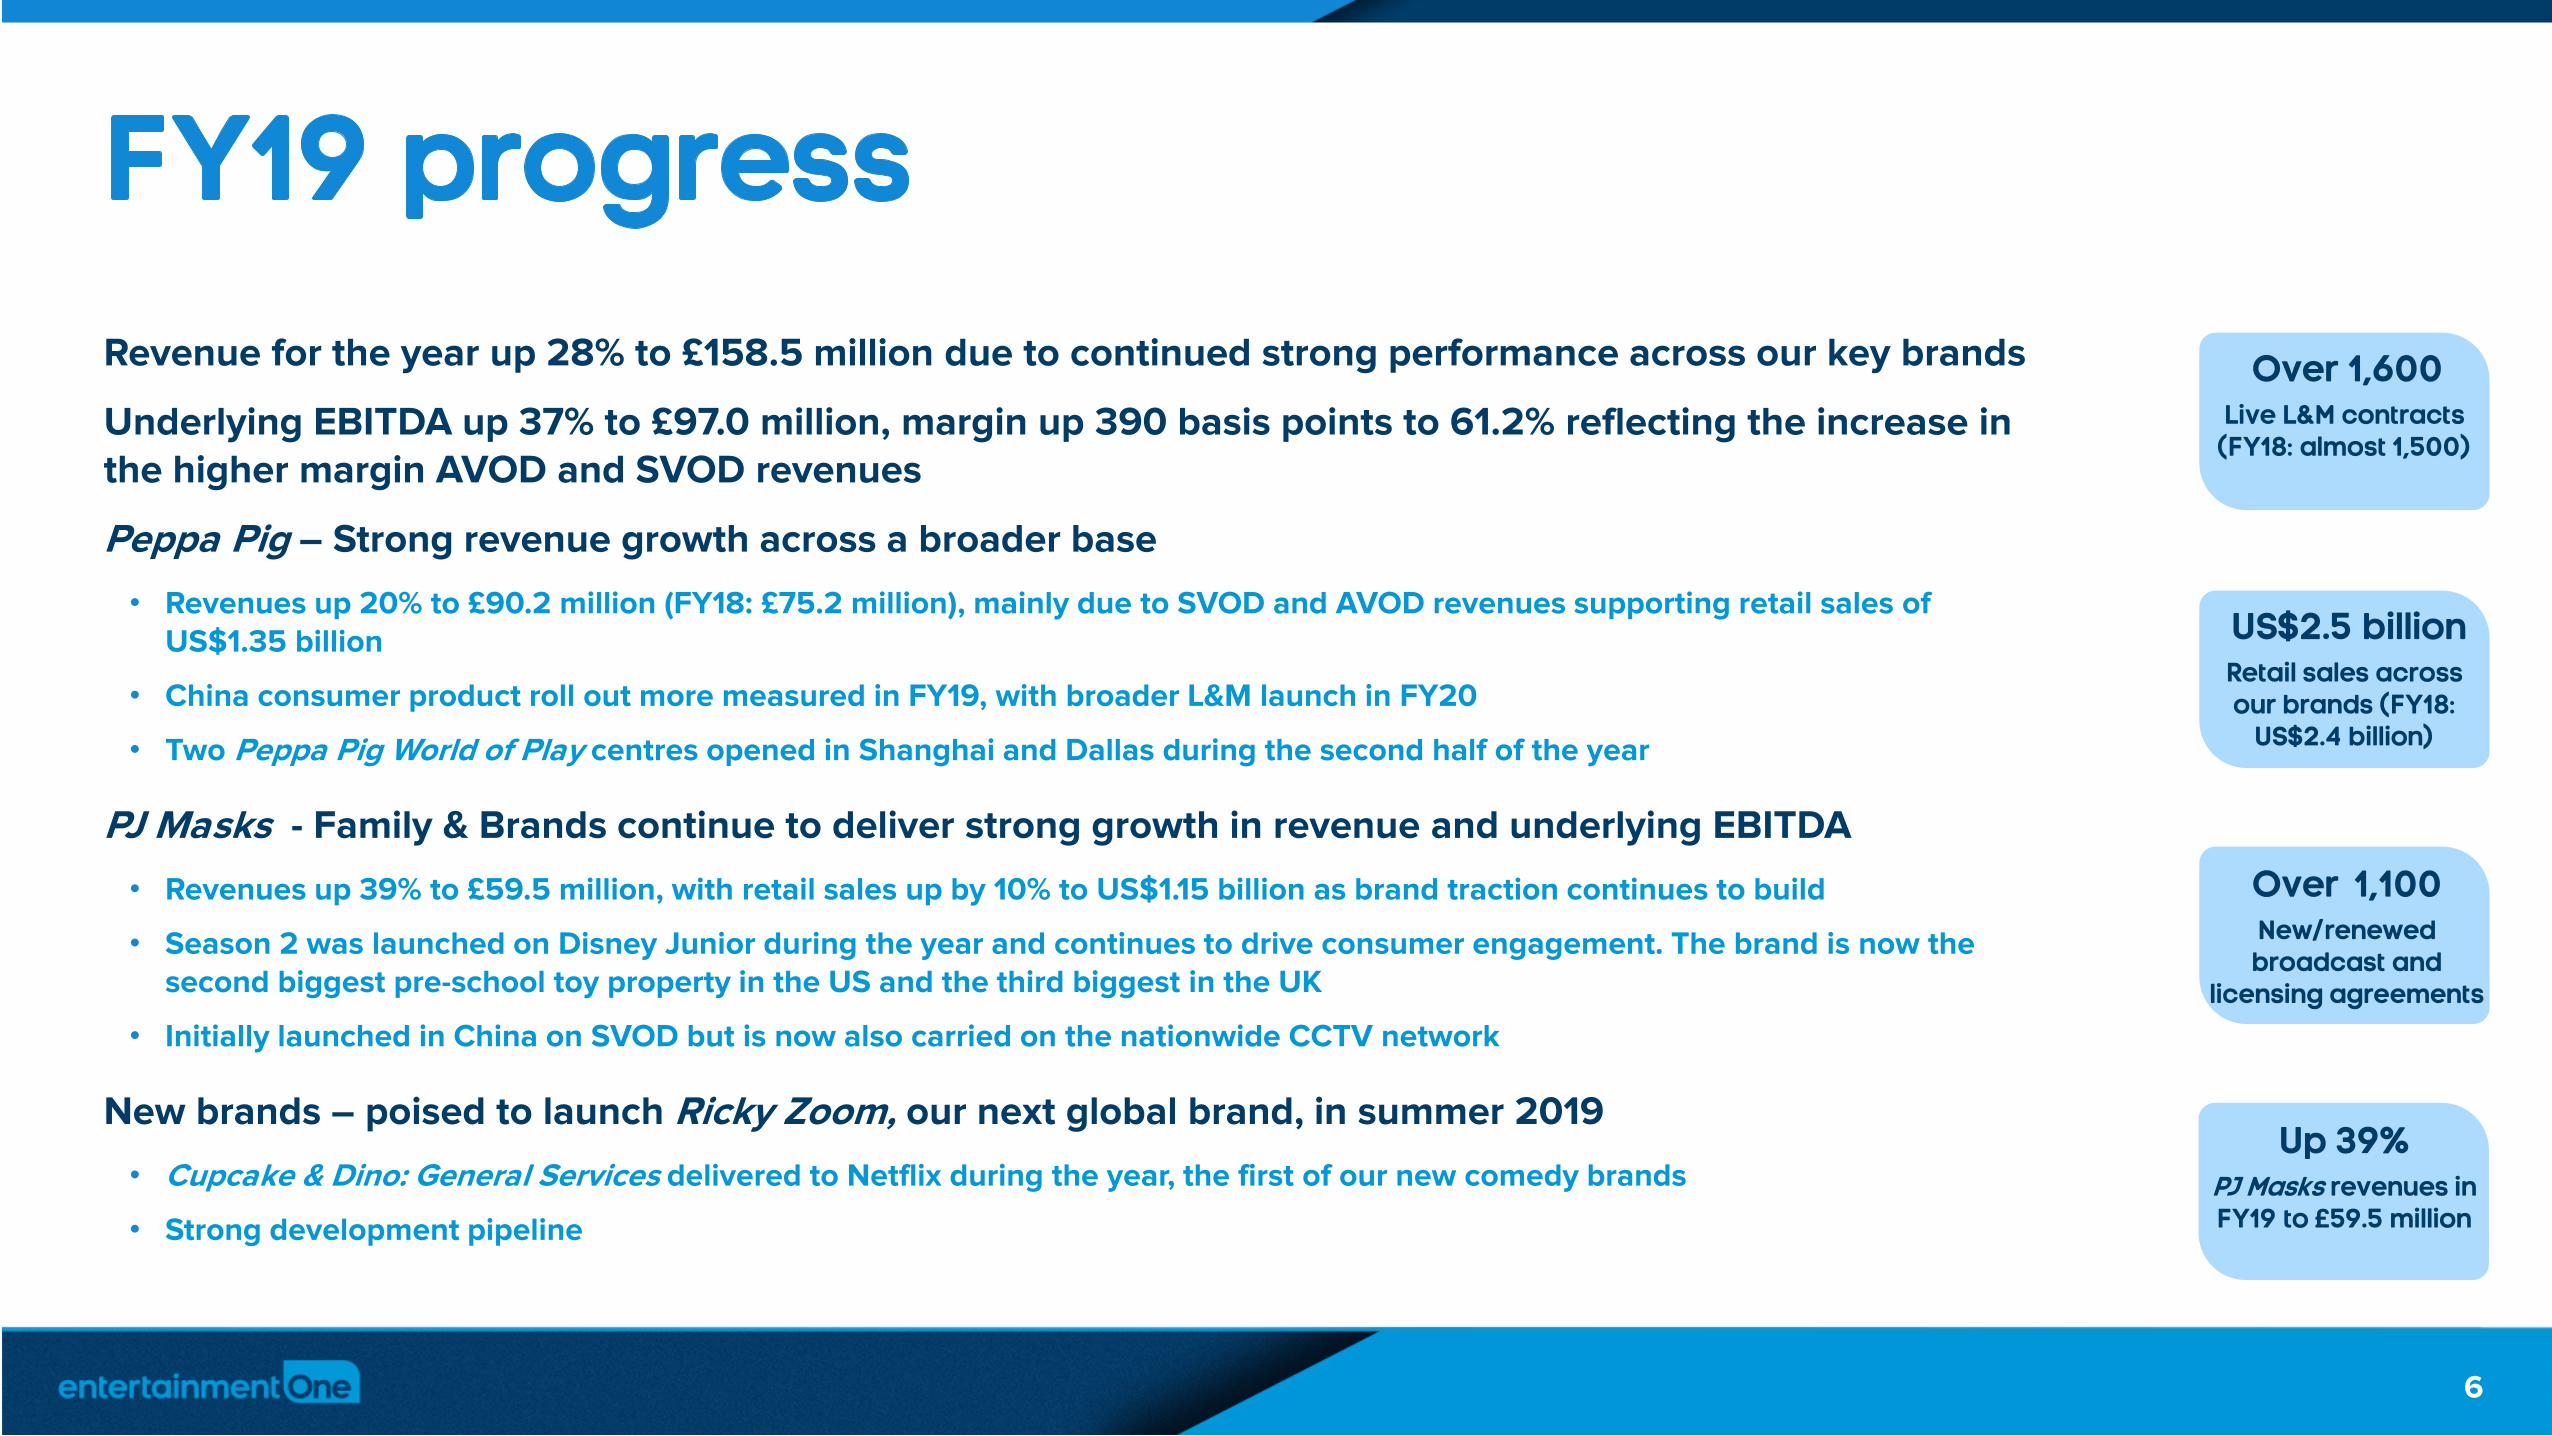
Revenue for the year up 28% to £158.5 million due to continued strong performance across our key brands
Underlying EBITDA up 37% to £97.0 million, margin up 390 basis points to 61.2% reflecting the increase in the higher margin AVOD and SVOD revenues
Peppa Pig – Strong revenue growth across a broader base
• Revenues up 20% to £90.2 million (FY18: £75.2 million), mainly due to SVOD and AVOD revenues supporting retail sales of US$1.35 billion
• China consumer product roll out more measured in FY19, with broader L&M launch in FY20
• Two Peppa Pig World of Play centres opened in Shanghai and Dallas during the second half of the year
PJ Masks - Family & Brands continue to deliver strong growth in revenue and underlying EBITDA
• Revenues up 39% to £59.5 million, with retail sales up by 10% to US$1.15 billion as brand traction continues to build
• Season 2 was launched on Disney Junior during the year and continues to drive consumer engagement. The brand is now the second biggest pre-school toy property in the US and the third biggest in the UK
• Initially launched in China on SVOD but is now also carried on the nationwide CCTV network
New brands – poised to launch Ricky Zoom, our next global brand, in summer 2019
• Cupcake & Dino: General Services delivered to Netflix during the year, the first of our new comedy brands
• Strong development pipeline
Over 1,100New/renewed broadcast and
licensing agreements
Over 1,600Live L&M contracts
(FY18: almost 1,500)
Up 39%PJ Masks revenues in FY19 to £59.5 million
US$2.5 billionRetail sales across our brands (FY18:
US$2.4 billion)
6

Peppa Pig – continuing consumer roll out into growth and evergreen markets
• Wide consumer product roll outs anticipated in Asia (particularly China) and Germany to drive additional L&M traction
• Evergreen markets also anticipated to grow this year with new clothing licensees coming on-stream and new publishing and clothing lines being released in FY20 for the 15th anniversary of the brand in the UK
• New content deliveries will help augment L&M initiatives, with the first of the 117 new episodes under production airing from spring 2019 onwards
PJ Masks – new content also driving continued growth
• Season 3 now being aired on Disney Junior in North America, reaching other territories during the course of FY20. Season 4 has been greenlit and is in pre-production
• Free to air broadcast from FY20 opens up a new audience segment in existing territories, driving incremental brand awareness
• Continued consumer launch in China in FY20, following carriage on national CCTV channel
New brands and shows
• Ricky Zoom will make its broadcast debut on the Youku platform in China in summer 2019, followed by a global launch in all other territories simultaneously in autumn/winter 2019. The consumer products launch will follow in spring/summer 2020
• Comedy shows in production, including Alien TV and Ninja Express
7
Industry developments
• Content viewership is moving away from traditional models towards SVOD, but the traditional broadcasters remain the best route for mass-market properties
• Shelf space availability at retail a key challenge for new brands. Established, proven retail brands benefit in this risk-averseenvironment
• Brand awareness remains critical for the online retail platforms
Key drivers for Family & Brands
• China is emerging as a top-tier kids market to rival the US; Peppa Pig’s success continues to drive growth
• The experiential entertainment industry is becoming an increasingly important driver: additional Peppa Pig World of Play sites identified by partner
• Flight to quality – premium, well-supported brands are safer bets
• Strong product pipeline of new shows creates a portfolio of properties, supporting existing brands
• Further diversification of revenue streams, e.g. live shows managed through an in-house team
8

Film, Television & Music
9
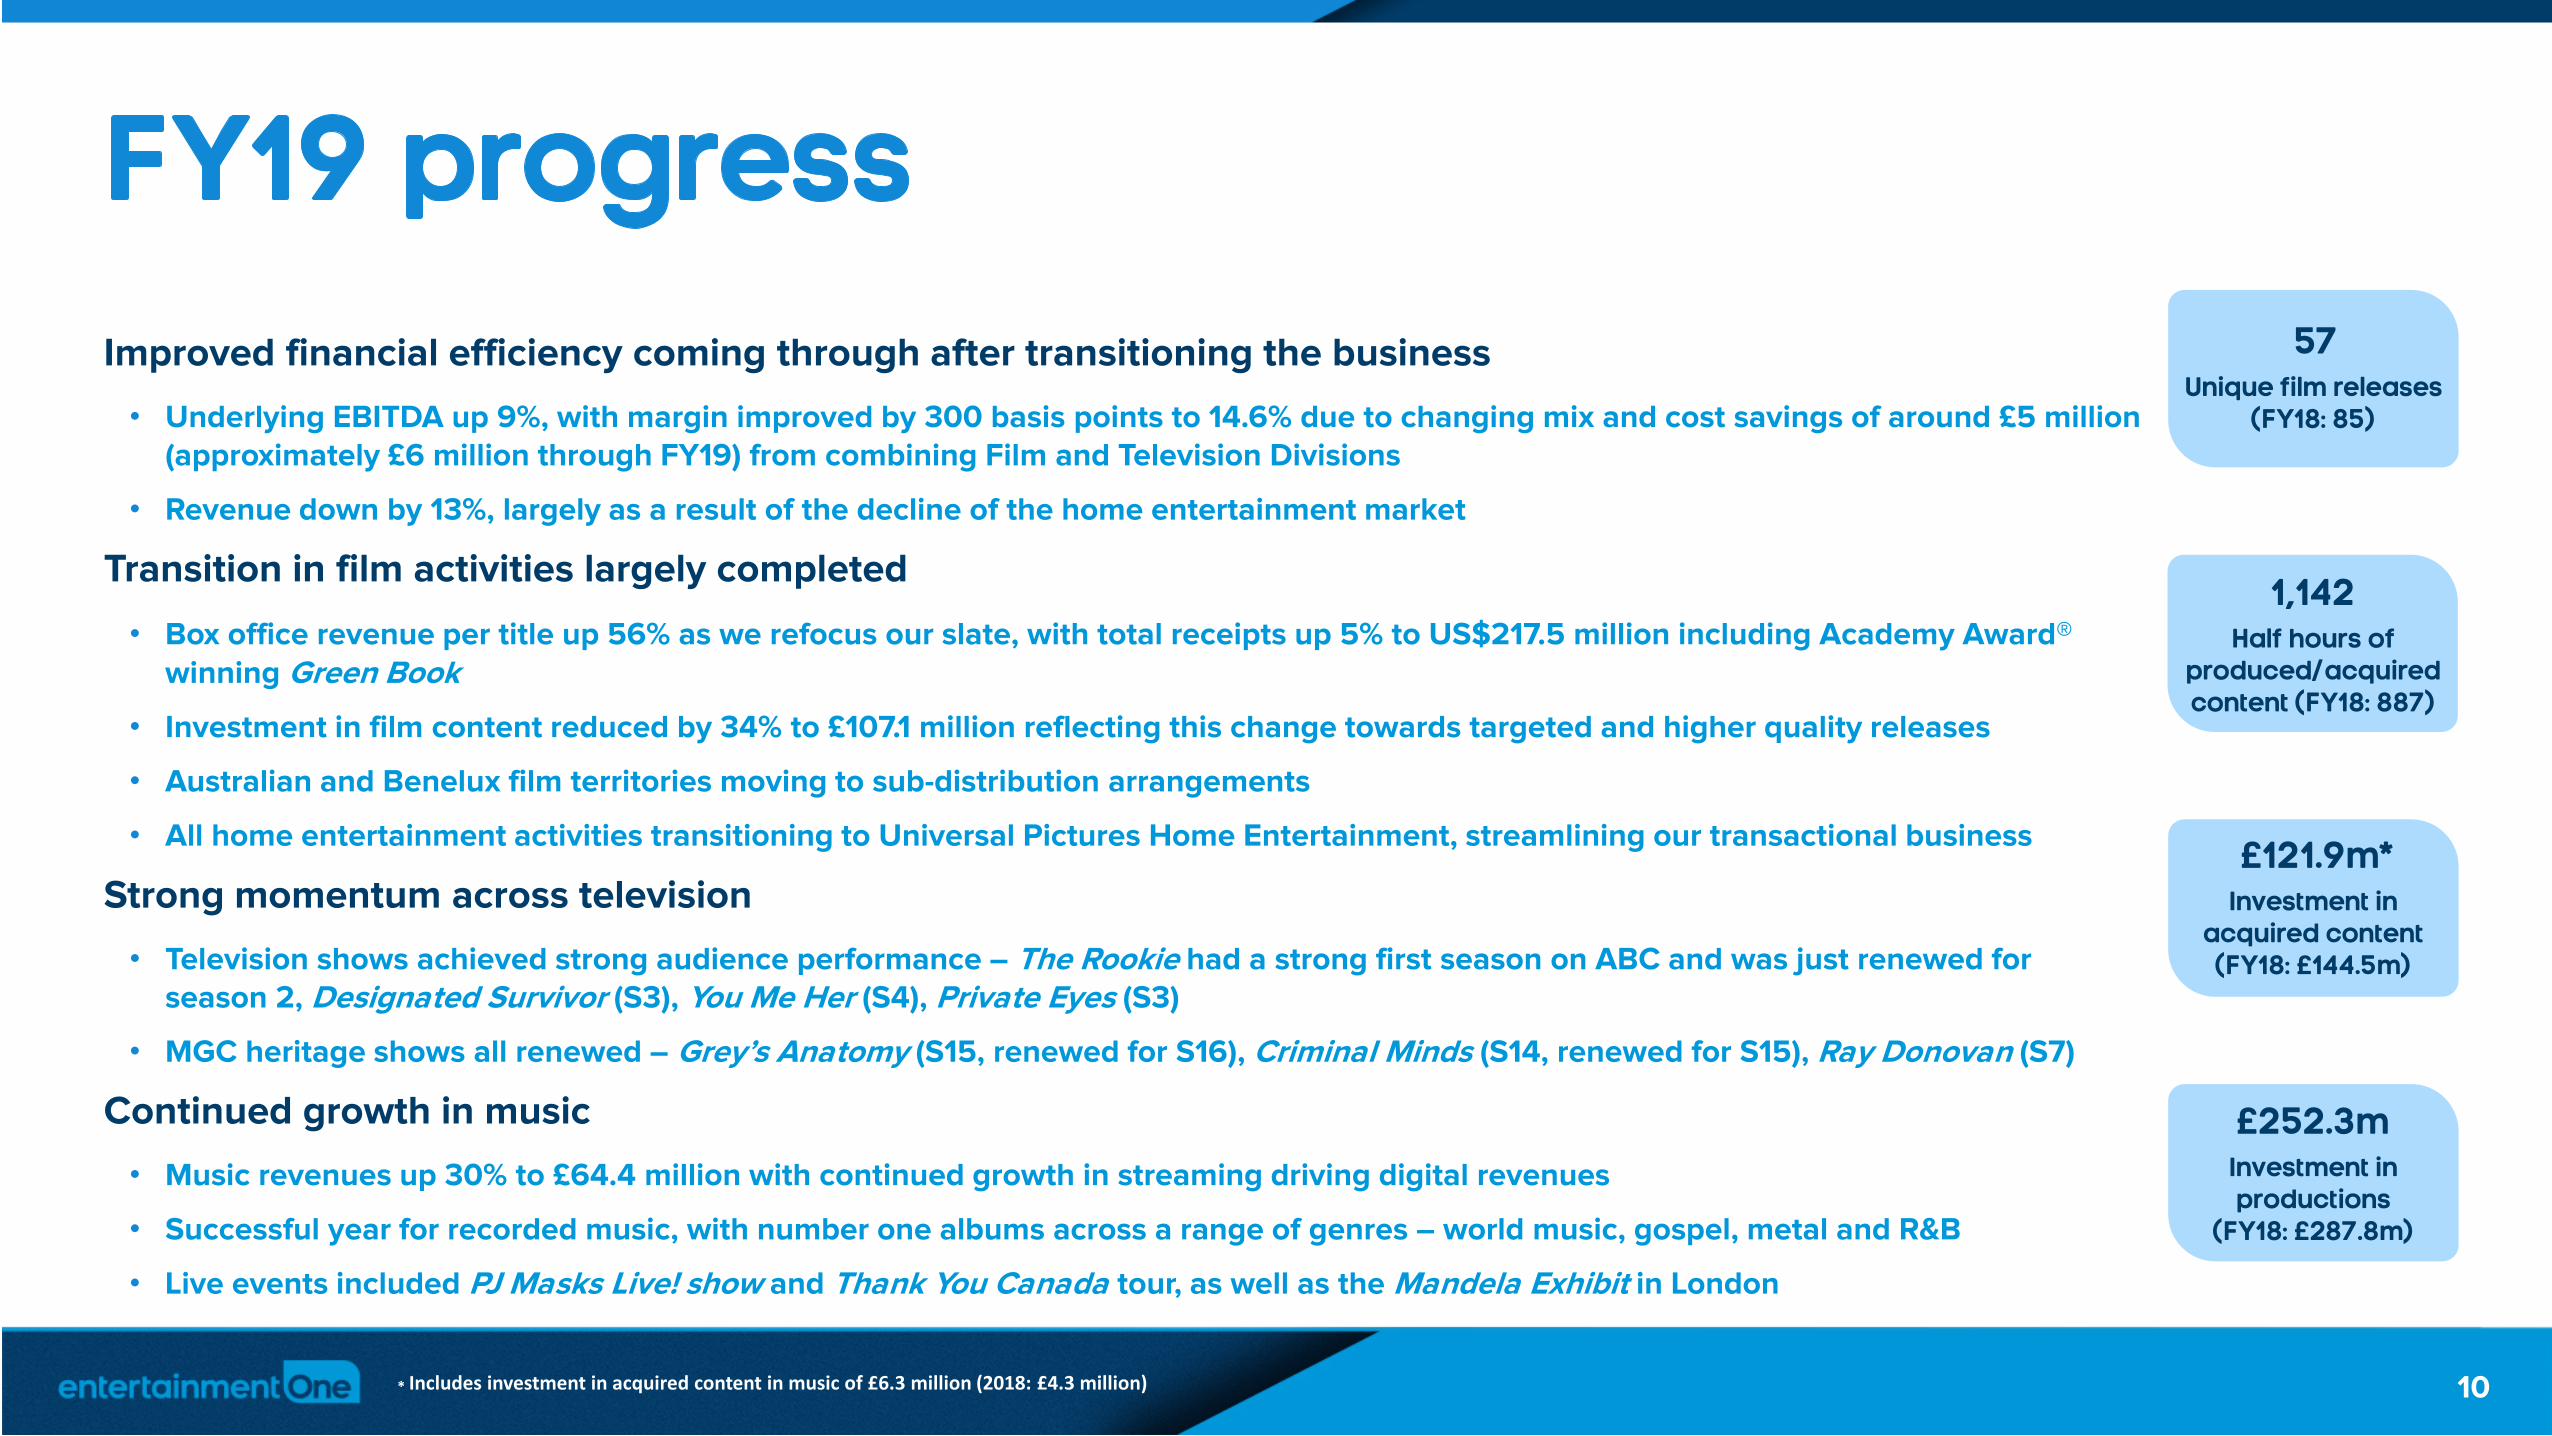
Improved financial efficiency coming through after transitioning the business
• Underlying EBITDA up 9%, with margin improved by 300 basis points to 14.6% due to changing mix and cost savings of around £5 million (approximately £6 million through FY19) from combining Film and Television Divisions
• Revenue down by 13%, largely as a result of the decline of the home entertainment market
Transition in film activities largely completed
• Box office revenue per title up 56% as we refocus our slate, with total receipts up 5% to US$217.5 million including Academy Award®winning Green Book
• Investment in film content reduced by 34% to £107.1 million reflecting this change towards targeted and higher quality releases
• Australian and Benelux film territories moving to sub-distribution arrangements
• All home entertainment activities transitioning to Universal Pictures Home Entertainment, streamlining our transactional business
Strong momentum across television
• Television shows achieved strong audience performance – The Rookie had a strong first season on ABC and was just renewed for season 2, Designated Survivor (S3), You Me Her (S4), Private Eyes (S3)
• MGC heritage shows all renewed – Grey’s Anatomy (S15, renewed for S16), Criminal Minds (S14, renewed for S15), Ray Donovan (S7)
Continued growth in music
• Music revenues up 30% to £64.4 million with continued growth in streaming driving digital revenues
• Successful year for recorded music, with number one albums across a range of genres – world music, gospel, metal and R&B
• Live events included PJ Masks Live! show and Thank You Canada tour, as well as the Mandela Exhibit in London
£252.3mInvestment in productions
(FY18: £287.8m)
57Unique film releases
(FY18: 85)
1,142Half hours of
produced/acquired content (FY18: 887)
£121.9m*Investment in
acquired content (FY18: £144.5m)
10* Includes investment in acquired content in music of £6.3 million (2018: £4.3 million)
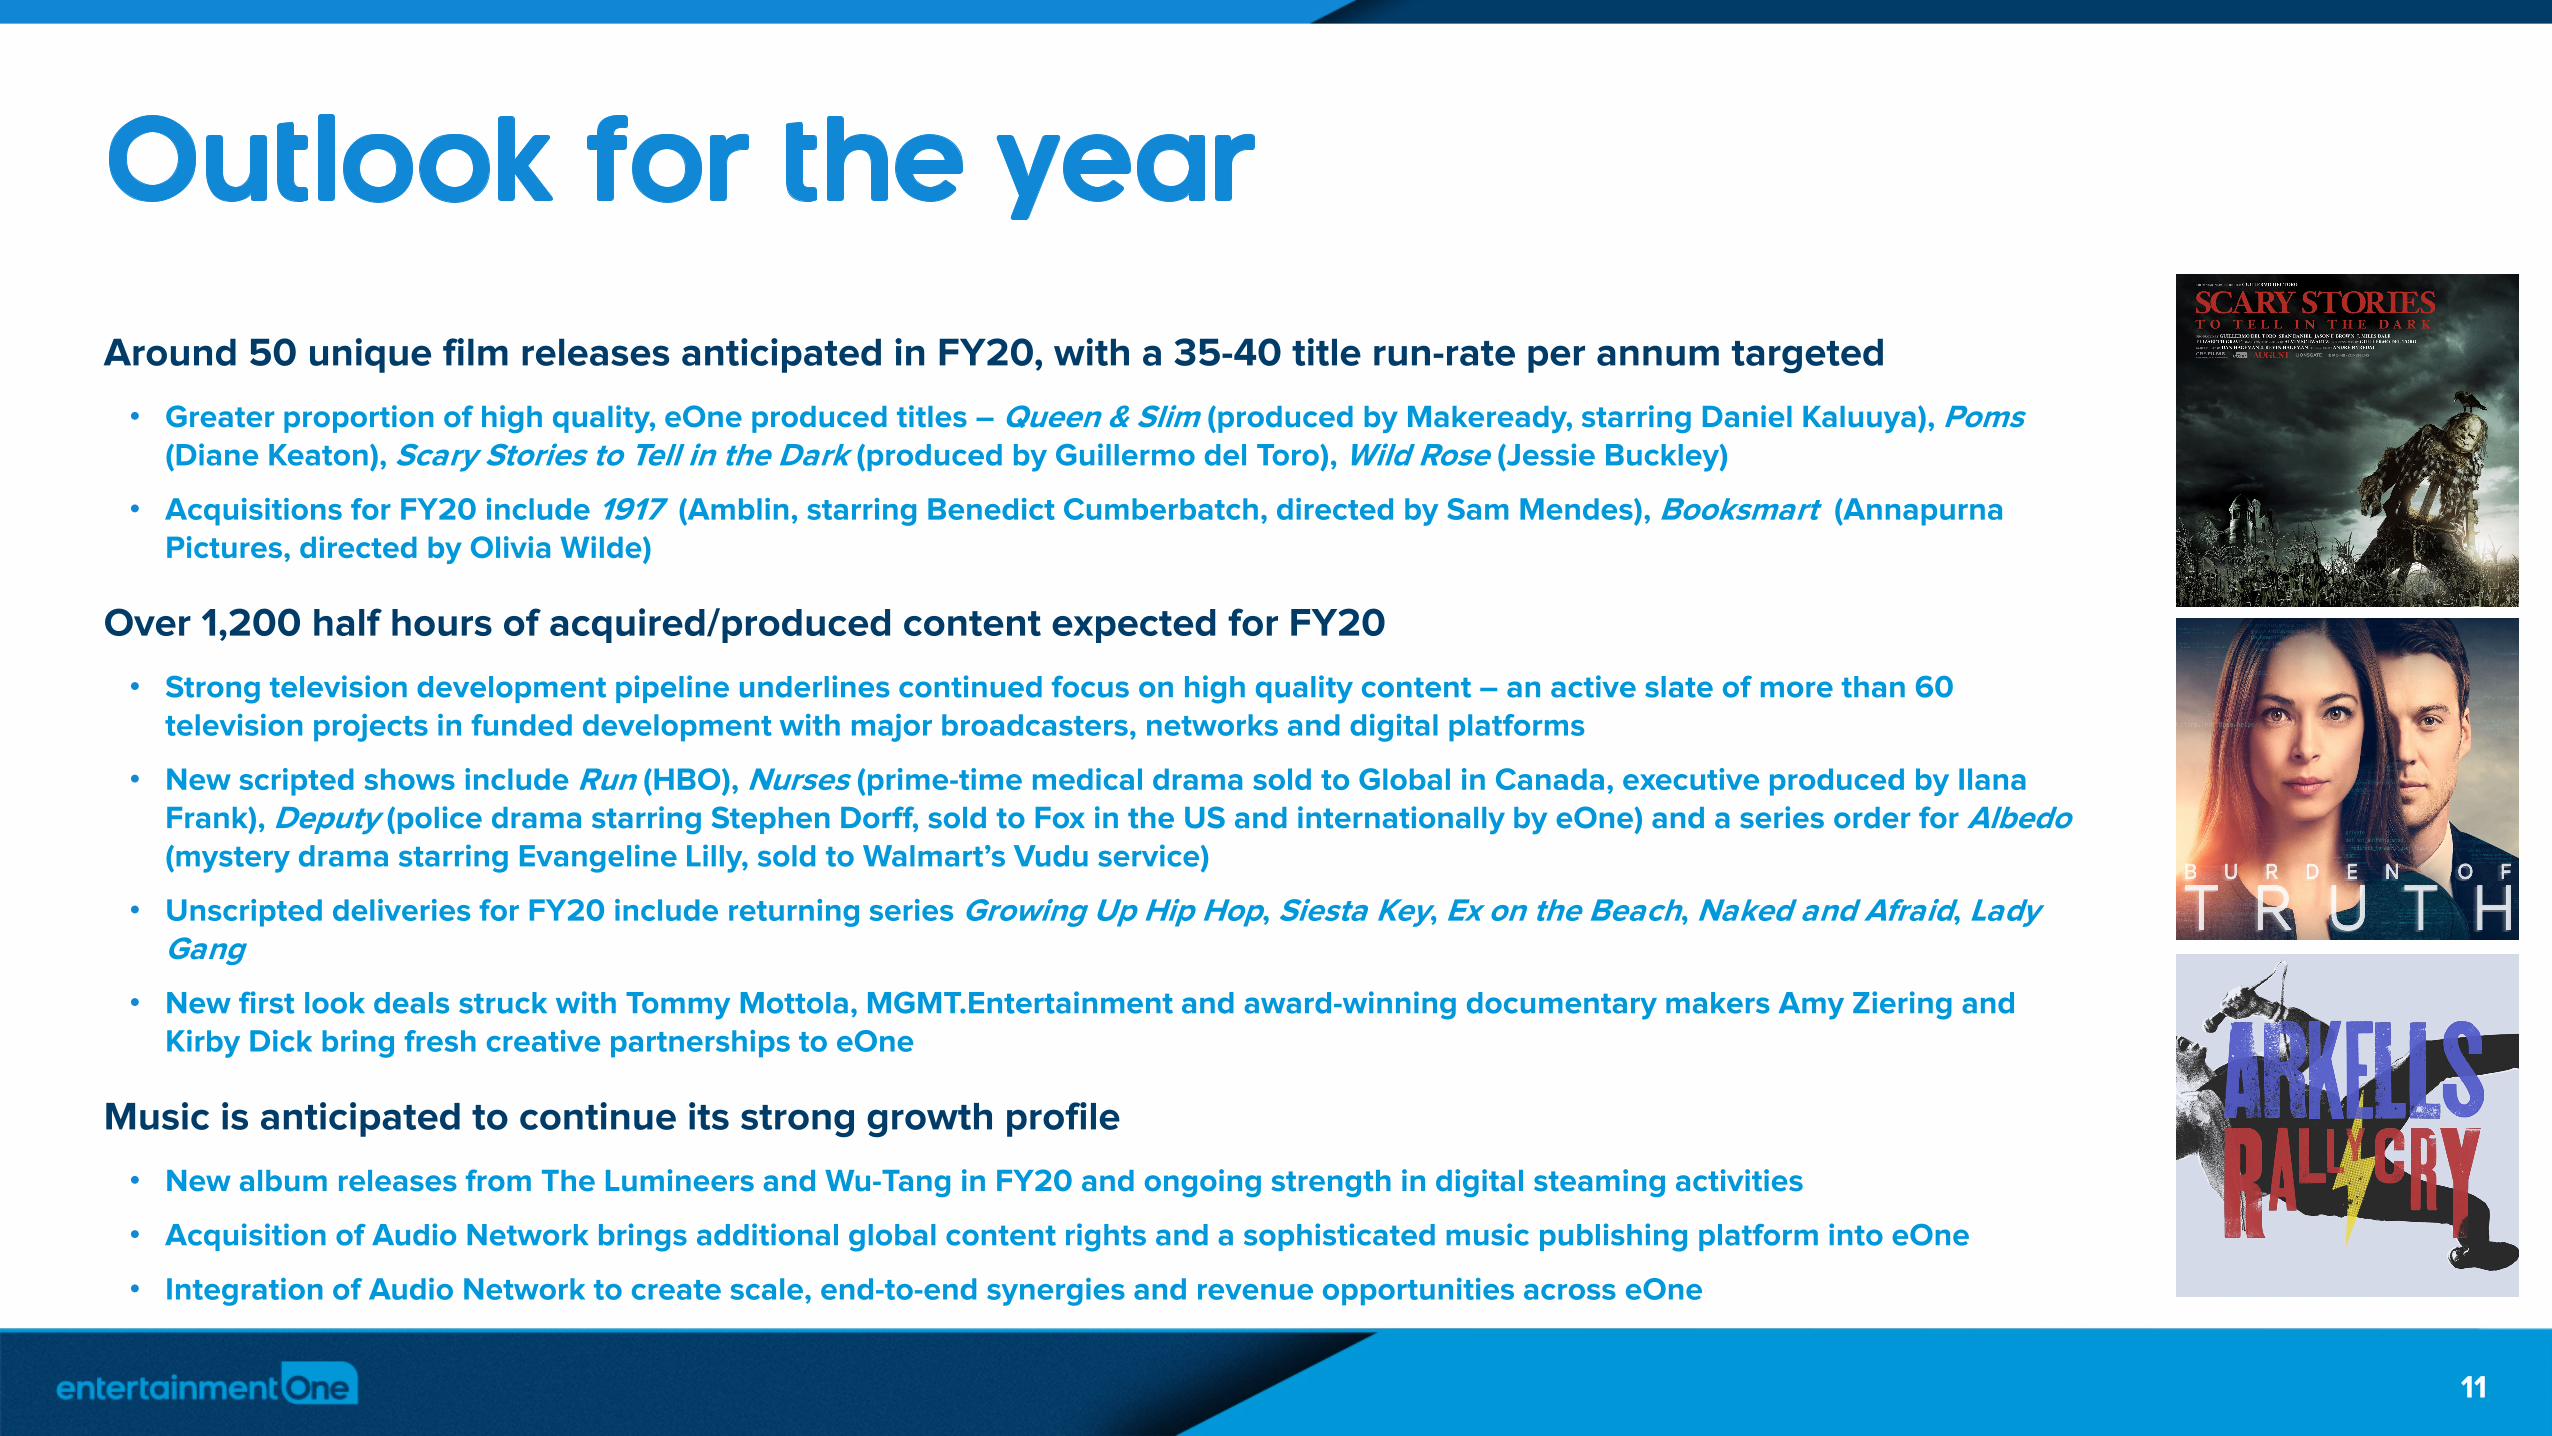
Around 50 unique film releases anticipated in FY20, with a 35-40 title run-rate per annum targeted
• Greater proportion of high quality, eOne produced titles – Queen & Slim (produced by Makeready, starring Daniel Kaluuya), Poms(Diane Keaton), Scary Stories to Tell in the Dark (produced by Guillermo del Toro), Wild Rose (Jessie Buckley)
• Acquisitions for FY20 include 1917 (Amblin, starring Benedict Cumberbatch, directed by Sam Mendes), Booksmart (Annapurna Pictures, directed by Olivia Wilde)
Over 1,200 half hours of acquired/produced content expected for FY20
• Strong television development pipeline underlines continued focus on high quality content – an active slate of more than 60 television projects in funded development with major broadcasters, networks and digital platforms
• New scripted shows include Run (HBO), Nurses (prime-time medical drama sold to Global in Canada, executive produced by Ilana Frank), Deputy (police drama starring Stephen Dorff, sold to Fox in the US and internationally by eOne) and a series order for Albedo(mystery drama starring Evangeline Lilly, sold to Walmart’s Vudu service)
• Unscripted deliveries for FY20 include returning series Growing Up Hip Hop, Siesta Key, Ex on the Beach, Naked and Afraid, Lady Gang
• New first look deals struck with Tommy Mottola, MGMT.Entertainment and award-winning documentary makers Amy Ziering and Kirby Dick bring fresh creative partnerships to eOne
Music is anticipated to continue its strong growth profile
• New album releases from The Lumineers and Wu-Tang in FY20 and ongoing strength in digital steaming activities
• Acquisition of Audio Network brings additional global content rights and a sophisticated music publishing platform into eOne
• Integration of Audio Network to create scale, end-to-end synergies and revenue opportunities across eOne
11

Industry developments
• Content budgets continue to grow (US$110 billion estimated spend in the US alone for 2019*), creating significant opportunities for producers of high quality content who are platform-agnostic
• M&A activity over the past year is unlike anything we have ever seen (Disney/Fox, AT&T/Time Warner)
• After a century of dominance by the “big six” major studios, technology companies like Netflix, Amazon, Google, and Apple have finally disintermediated the film/television business
• Non-media companies continue to bypass the majors, exhibitors and cable operators to go direct to consumer and have become an unstoppable threat to the current content ecosystem
• Early and direct access to premium content, as well as scale across production and distribution infrastructure, remain essential for remaining competitive and driving value
• The rise of streaming services has driven a recovery across the music industry – enabling easy access to front list tracks and the deeper catalogue
Key drivers for eOne
• We continue to see significant opportunity for eOne and remain more bullish on the power of premium content than ever before
• Video and music are the most consumed and valuable media on the planet
• Forging ongoing relationships with the best talent in the business
• We remain focused on growing our music activities across recorded music, artist management, live events and publishing: the recent acquisition of Audio Network brings music synchronisation revenues and a publishing platform into the Group
• As the large media conglomerates and middle-market studios compete in the world of direct-to-consumer, we believe there has never been a better time for eOne to be an independent, pure-play content company that controls global rights to the best content
* Source: RBC Capital Markets estimates 12

entertainmentone.com
Financial reviewJoe Sparacio
13
entertainmentone.com
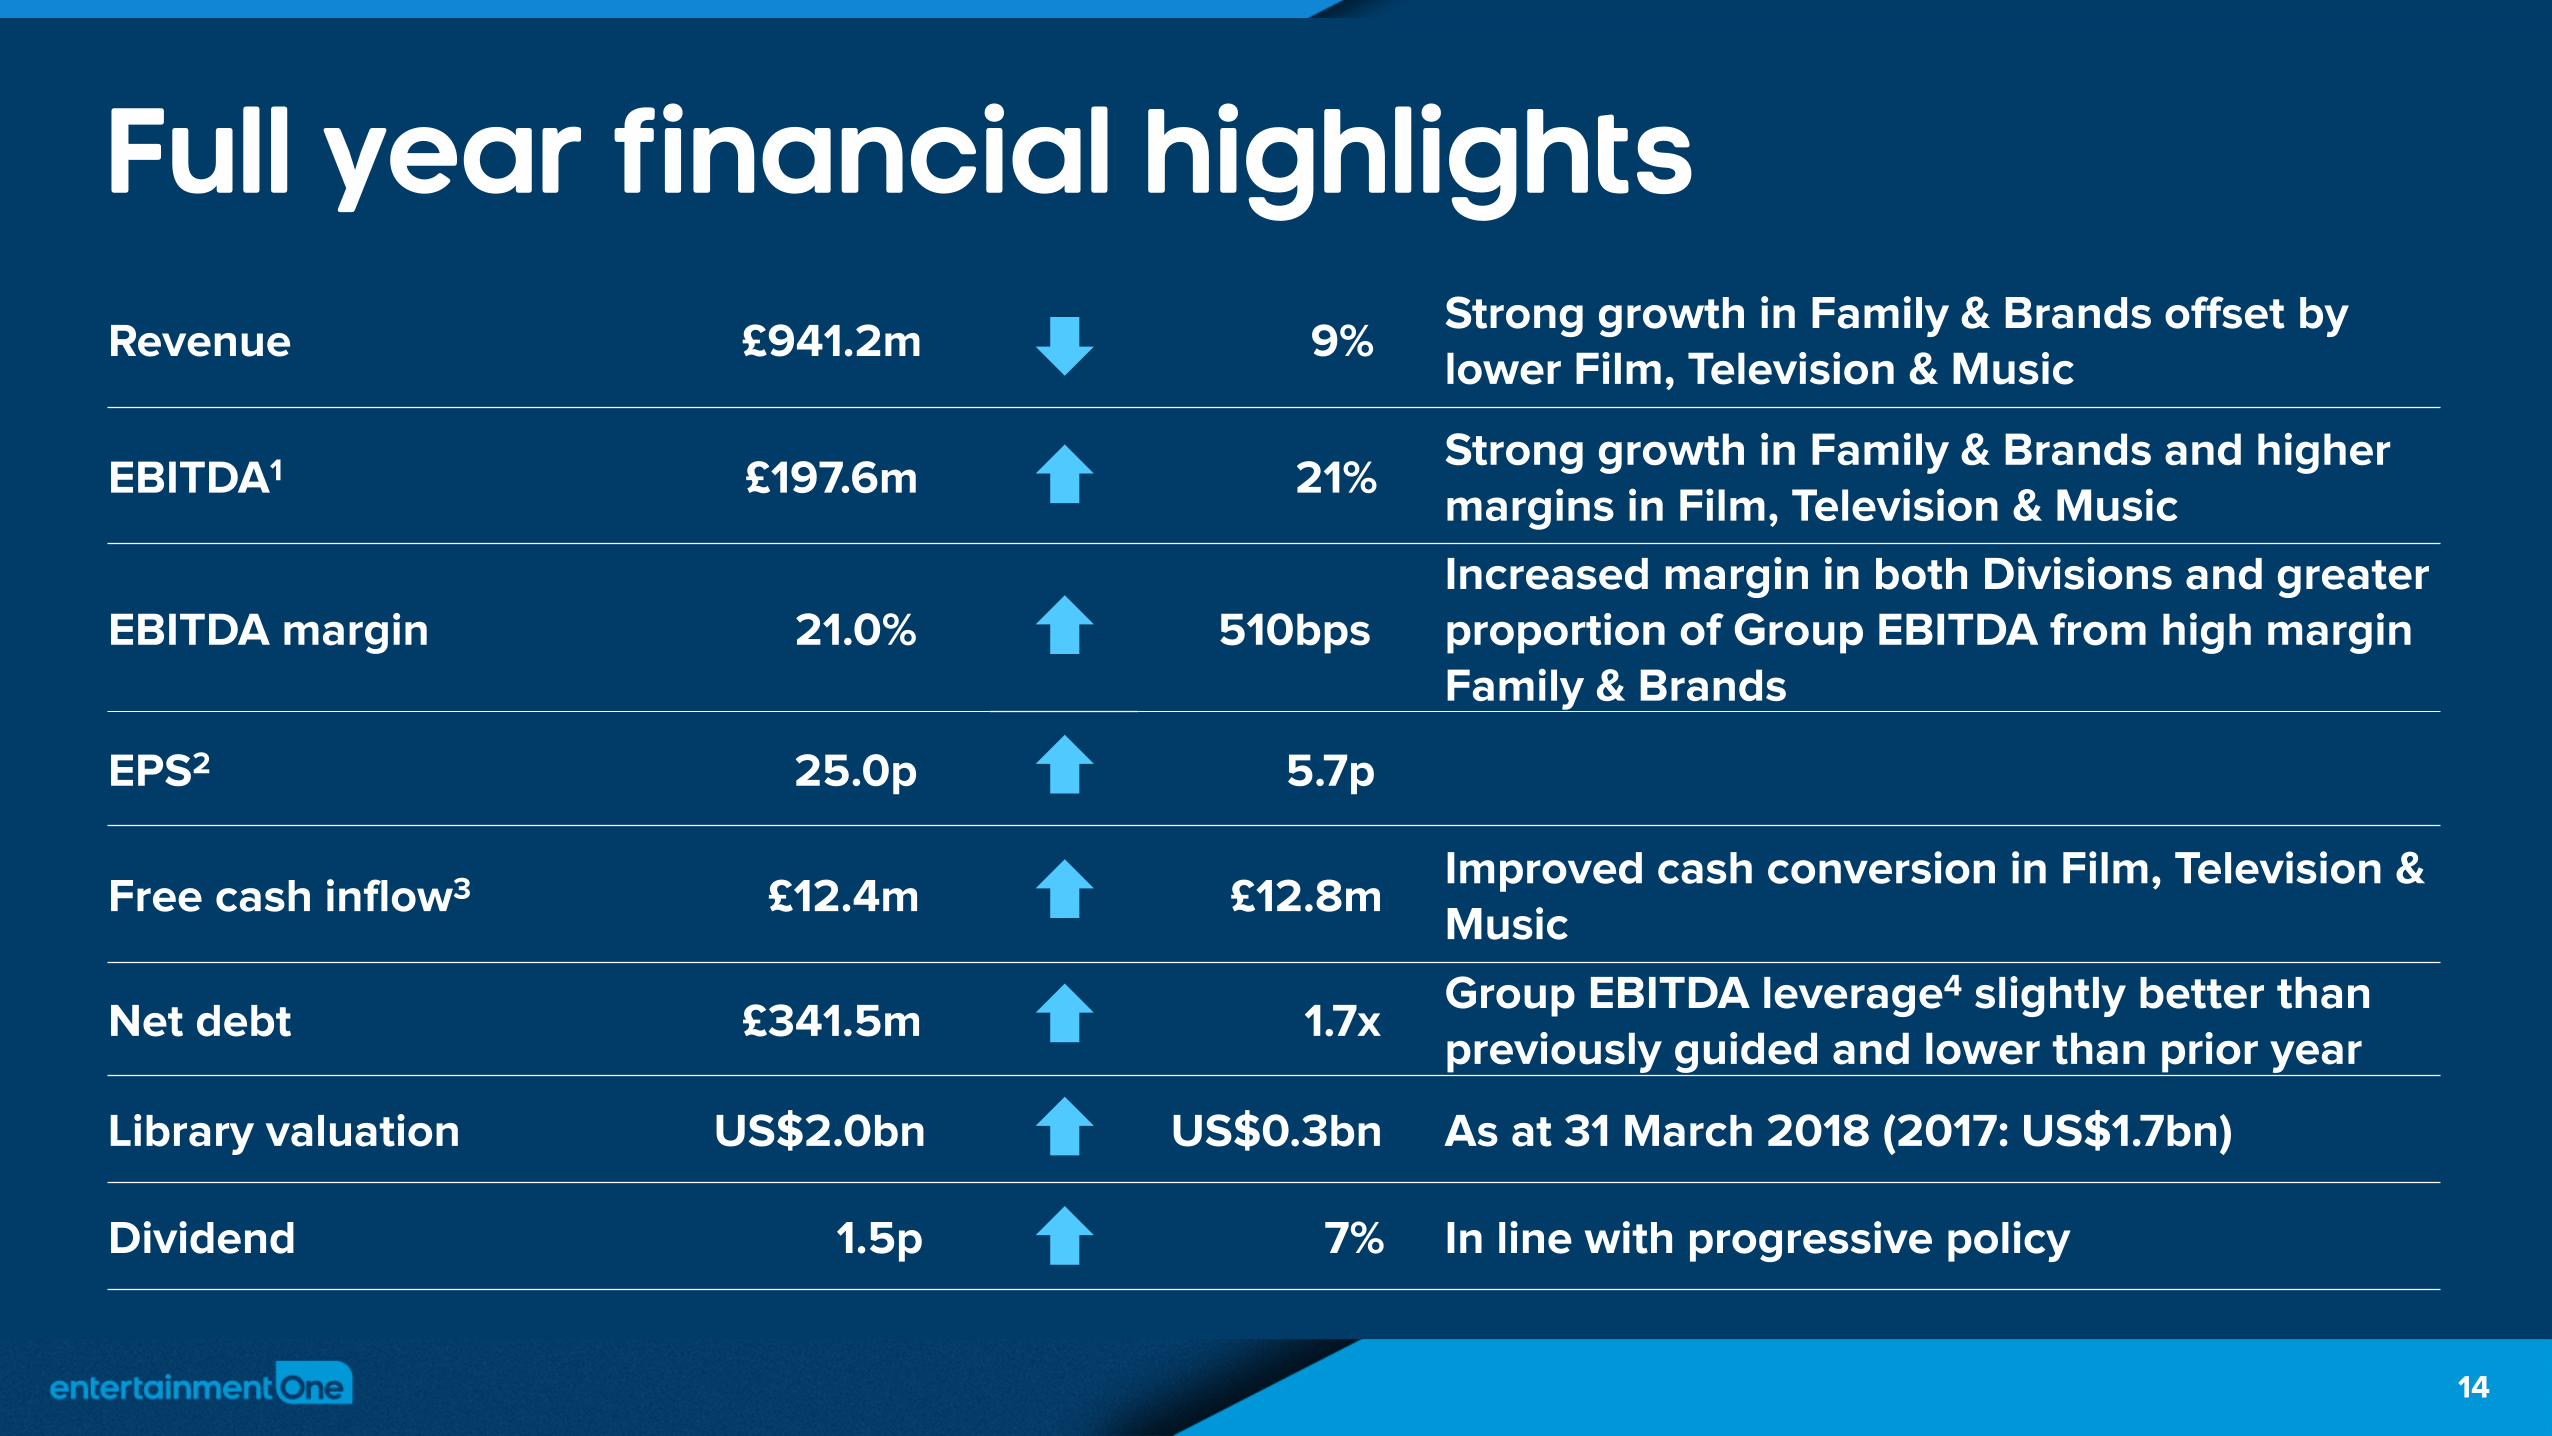
Revenue £941.2m 9%Strong growth in Family & Brands offset by lower Film, Television & Music
EBITDA1 £197.6m 21% Strong growth in Family & Brands and higher margins in Film, Television & Music
EBITDA margin 21.0% 510bpsIncreased margin in both Divisions and greater proportion of Group EBITDA from high margin Family & Brands
EPS2 25.0p 5.7p
Free cash inflow3 £12.4m £12.8mImproved cash conversion in Film, Television & Music
Net debt £341.5m 1.7xGroup EBITDA leverage4 slightly better than previously guided and lower than prior year
Library valuation US$2.0bn US$0.3bn As at 31 March 2018 (2017: US$1.7bn)
Dividend 1.5p 7% In line with progressive policy
Full year financial highlights
14

entertainmentone.com
Revenue down 9%Strong growth in Family & Brands and lower Film, Television & Music£m 2019 2018 Change
Family & Brands 158.5 123.9 28%
Transactional 32.2 25.9 24%
Broadcast and Licensing 30.5 12.5 144%
Licensing and Merchandising 89.4 78.8 13%
Production and Other 6.4 6.7 (4%)
Film, Television & Music 789.4 911.1 (13%)Theatrical 60.9 57.1 7%
Transactional 67.6 133.8 (49%)
Broadcast and Licensing 380.9 448.3 (15%)
Production and Other 215.6 223.1 (3%)
Music 64.4 49.4 30%
Eliminations - (0.6) 100%
Total Divisional Revenue 947.9 1,035.0 (8%)
Group Eliminations (6.7) (6.0) (12%)
Total Group Revenue 941.2 1,029.0 (9%)
Group revenue 9%– Film, Television & Music ( 13%):
• Lower revenue attributable to the change in the film strategy and home entertainment decline
• Partly offset by growth in music revenue
– Family & Brands 28% strong growth driven by continued strong performance of Peppa Pig, significant growth from PJ Masks and new show Cupcake & Dino: General Services
Foreign exchange
– On a constant currency basis Group revenue also declined by 9%
£1,035.0m£947.9m
£34.6m (£121.7m)
2018 Family & Brands Film, Television & Music 2019
Year-on-year Divisional revenue bridge
15
entertainmentone.com
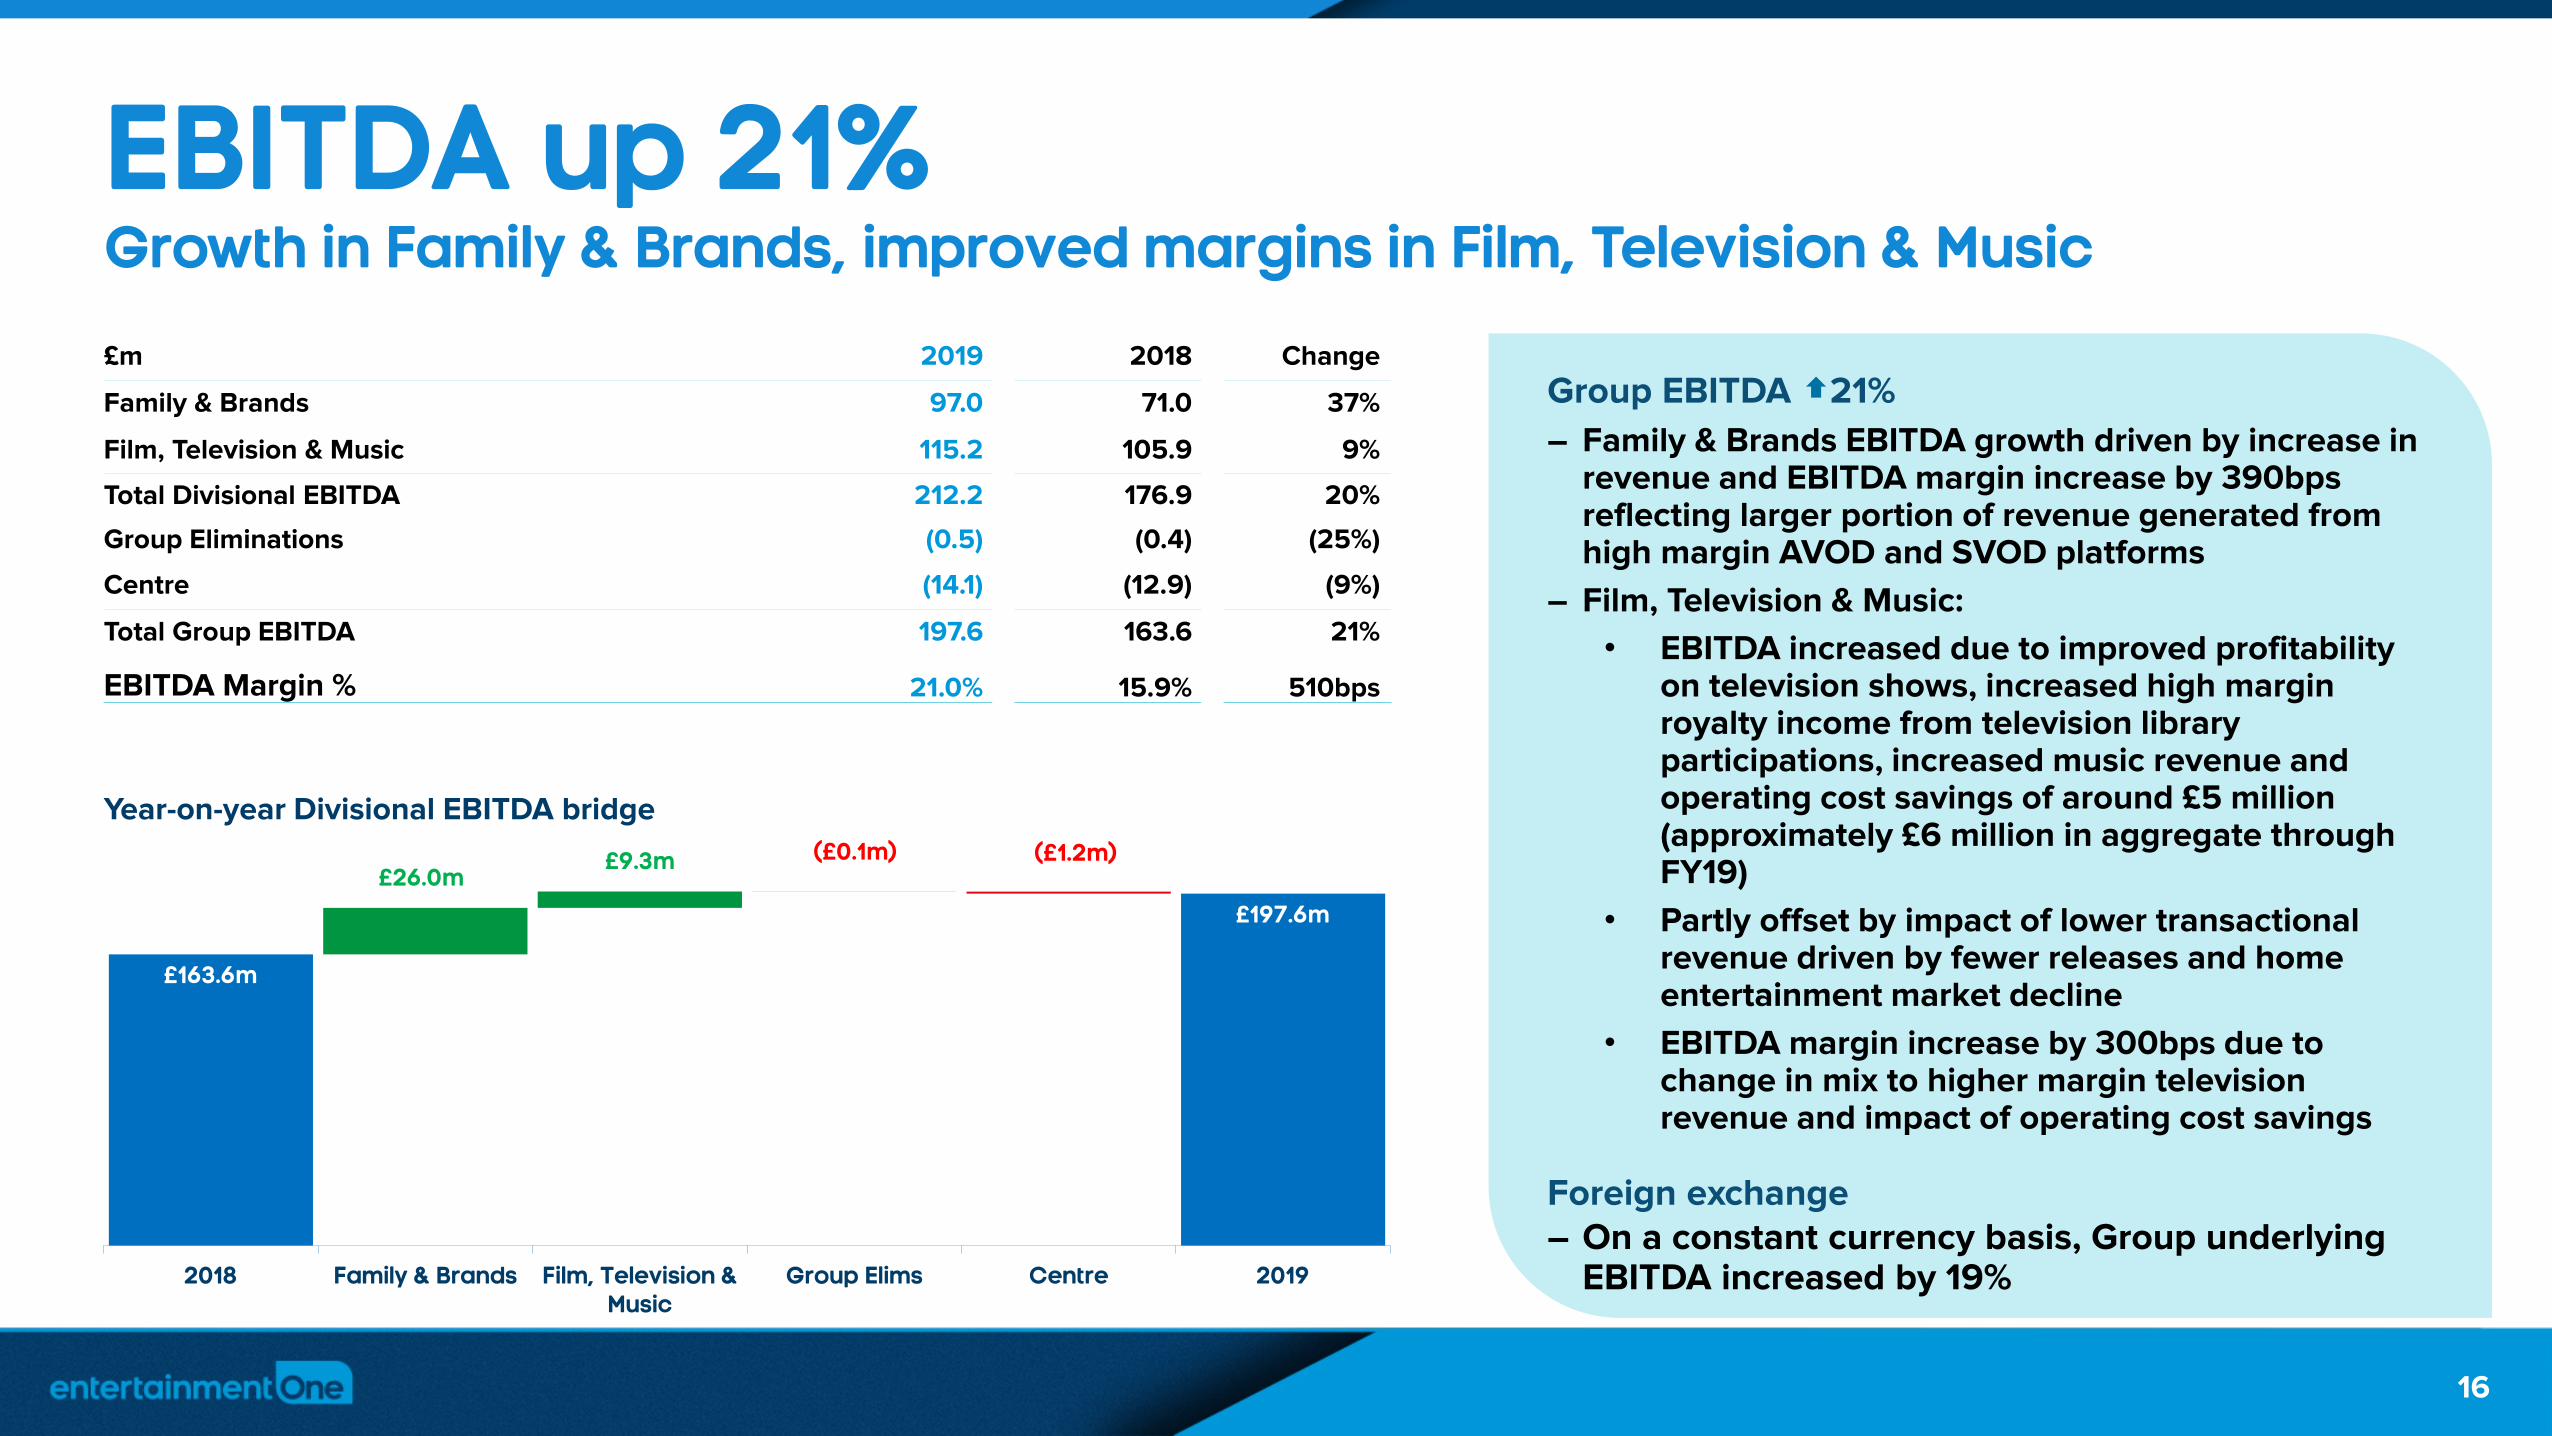
£163.6m
£197.6m
£26.0m£9.3m (£0.1m) (£1.2m)
2018 Family & Brands Film, Television &Music
Group Elims Centre 2019
EBITDA up 21%Growth in Family & Brands, improved margins in Film, Television & Music
Year-on-year Divisional EBITDA bridge
Group EBITDA 21%
– Family & Brands EBITDA growth driven by increase in revenue and EBITDA margin increase by 390bps reflecting larger portion of revenue generated from high margin AVOD and SVOD platforms
– Film, Television & Music:
• EBITDA increased due to improved profitability on television shows, increased high margin royalty income from television library participations, increased music revenue and operating cost savings of around £5 million (approximately £6 million in aggregate through FY19)
• Partly offset by impact of lower transactional revenue driven by fewer releases and home entertainment market decline
• EBITDA margin increase by 300bps due to change in mix to higher margin television revenue and impact of operating cost savings
Foreign exchange– On a constant currency basis, Group underlying
EBITDA increased by 19%
£m 2019 2018 Change
Family & Brands 97.0 71.0 37%
Film, Television & Music 115.2 105.9 9%
Total Divisional EBITDA 212.2 176.9 20%
Group Eliminations (0.5) (0.4) (25%)
Centre (14.1) (12.9) (9%)
Total Group EBITDA 197.6 163.6 21%
EBITDA Margin % 21.0% 15.9% 510bps
16

entertainmentone.com
FY18 FY19
£97.0m
£71.0m
FY18 FY19
Family & BrandsPeppa Pig continued strong performance and PJ Masks goes from strength to strength
Revenue by stream
TransactionalLicensing and Merchandising Broadcast and Licensing Other
Revenue by brandStrong AVOD and SVOD platform revenue growth and continued growth of licensing and merchandising revenue– Business generated US$2.5
billion of retail sales across its portfolio supported by over 1,600 live licensing and merchandising contracts globally
Peppa Pig: continued strong performance– Growth driven by SVOD, AVOD
and broadcast renewal revenue with consistent L&M revenues
– Brand remains strong in key territories such as the UK and the US with 264 episodes currently airing daily across 180 territories
PJ Masks: significant growth– Revenue growth of 39% driven
by L&M revenue driven by further successful roll outs in all categories across all territories
– The second biggest pre-school toy property in the US and the third biggest in the UK
Outlook– Continued growth for Peppa Pig
and PJ Masks with a contribution from new brand Ricky Zoom
– Peppa Pig expected L&M growth from wider consumer product roll outs in China, rest of Asia and Germany, with 117 episodes in production airing from spring 2019 through to 2023 bringing total to 381 episodes
– PJ Masks growth expected across most regions with season 3 airing from April 2019 with season 4 in pre-production
– Ricky Zoom scheduled for broadcast debut in summer 2019 with consumer products launch in spring/summer 2020
FY18 FY19
£158.5m
£123.9m
Cupcake & DinoPeppa Pig PJ Masks Other
17
EBITDA

entertainmentone.com
£144.5m £121.9m
£287.8m£252.3m
FY18 FY19
Film, Television & MusicImproved profitability after transitioning film businessRevenue by stream
FY18 FY19
£789.4m
£911.1m
Investment in acquired content and productions
Theatrical– Higher driven by strong box
office receipts in second half with average revenue per release increasing 56%
– 57 unique releases (2018: 85)
Transactional– Decrease driven by lower release
volume supported by strategy to focus on fewer high quality films and home entertainment market decline
Broadcast and Licensing– Lower driven by scripted
television slate composition, timing of shows and lower third party acquisitions
Production and Other– Decrease driven by fewer film
productions and lower third party international film sales partly offset by growth in unscripted television and
increased royalty income from television library participations
Music– Higher digital revenue on
recorded music reflecting industry-wide streaming growth, higher live and exhibition revenues and higher artist management partly offset by lower physical
EBITDA– Increased due to improved
profitability on television shows, increased high margin royalty income from television library participations, increased music revenue and additional operating cost savings of around £5 million (approximately £6 million in aggregate through FY19)
– More than offsets impact of transactional revenue decline
Broadcast and Licensing
Productionand Other
TransactionalTheatrical
Productions
Acquired content
FY18 FY19
£115.2m£105.9m
Music
EBITDA
18

entertainmentone.com
537350
Film, Television & Music continued
Outlook– Division continues to be focused on ensuring early access to high quality premium
content of all types by working with the best talent in the business
– Broadcast and licensing revenue expected to increase driven by ramp up of the
scripted and unscripted television businesses and music organic growth
– Higher percentage of theatrical revenue to come from eOne productions
– Integration of film and television operations on track to generate £13-15 million of
annualised cost savings by end of FY20
FY18 FY19
Box office (US$m) 207.6 217.5
No. unique theatrical releases 85 57
Average revenue per release (US$m) 2.4 3.8
c.35%
Greenlit/contracted Not yet greenlit/contracted
Television shows greenlit/contracted as % of
FY20 budgeted margin
Scripted shows delivering in FY20:
RunNursesDeputy
The Rookie season 2You Me Her season 4
Cardinal season 4
Unscripted shows delivering in FY20:
Growing Up Hip HopEx on the Beach
Naked and AfraidLady Gang
Third party shows delivering in FY20:
The Walking Dead season 10Fear the Walking Dead season 5
Film production releases in FY20:
Scary Stories to Tell in the DarkQueen & Slim
PomsWild Rose
Films in production in FY20:
Happiest SeasonDen of Thieves 2
Acquired content pipeline:1917
John Wick: Chapter 3Blinded by the Light
BooksmartLate Night
A Dog’s Journey
375
191
131
126
64
887
FY18 FY19
358
232169
138
245
1,142
Film box office performance
Television owned production/acquired content half hours
Scripted/unscripted half hours
434708
Scripted
Unscripted
19
FY18 FY19
29%
Season 1
Season 2
Season 3
Season 4
Season 5+
entertainmentone.com
FY18 FY19
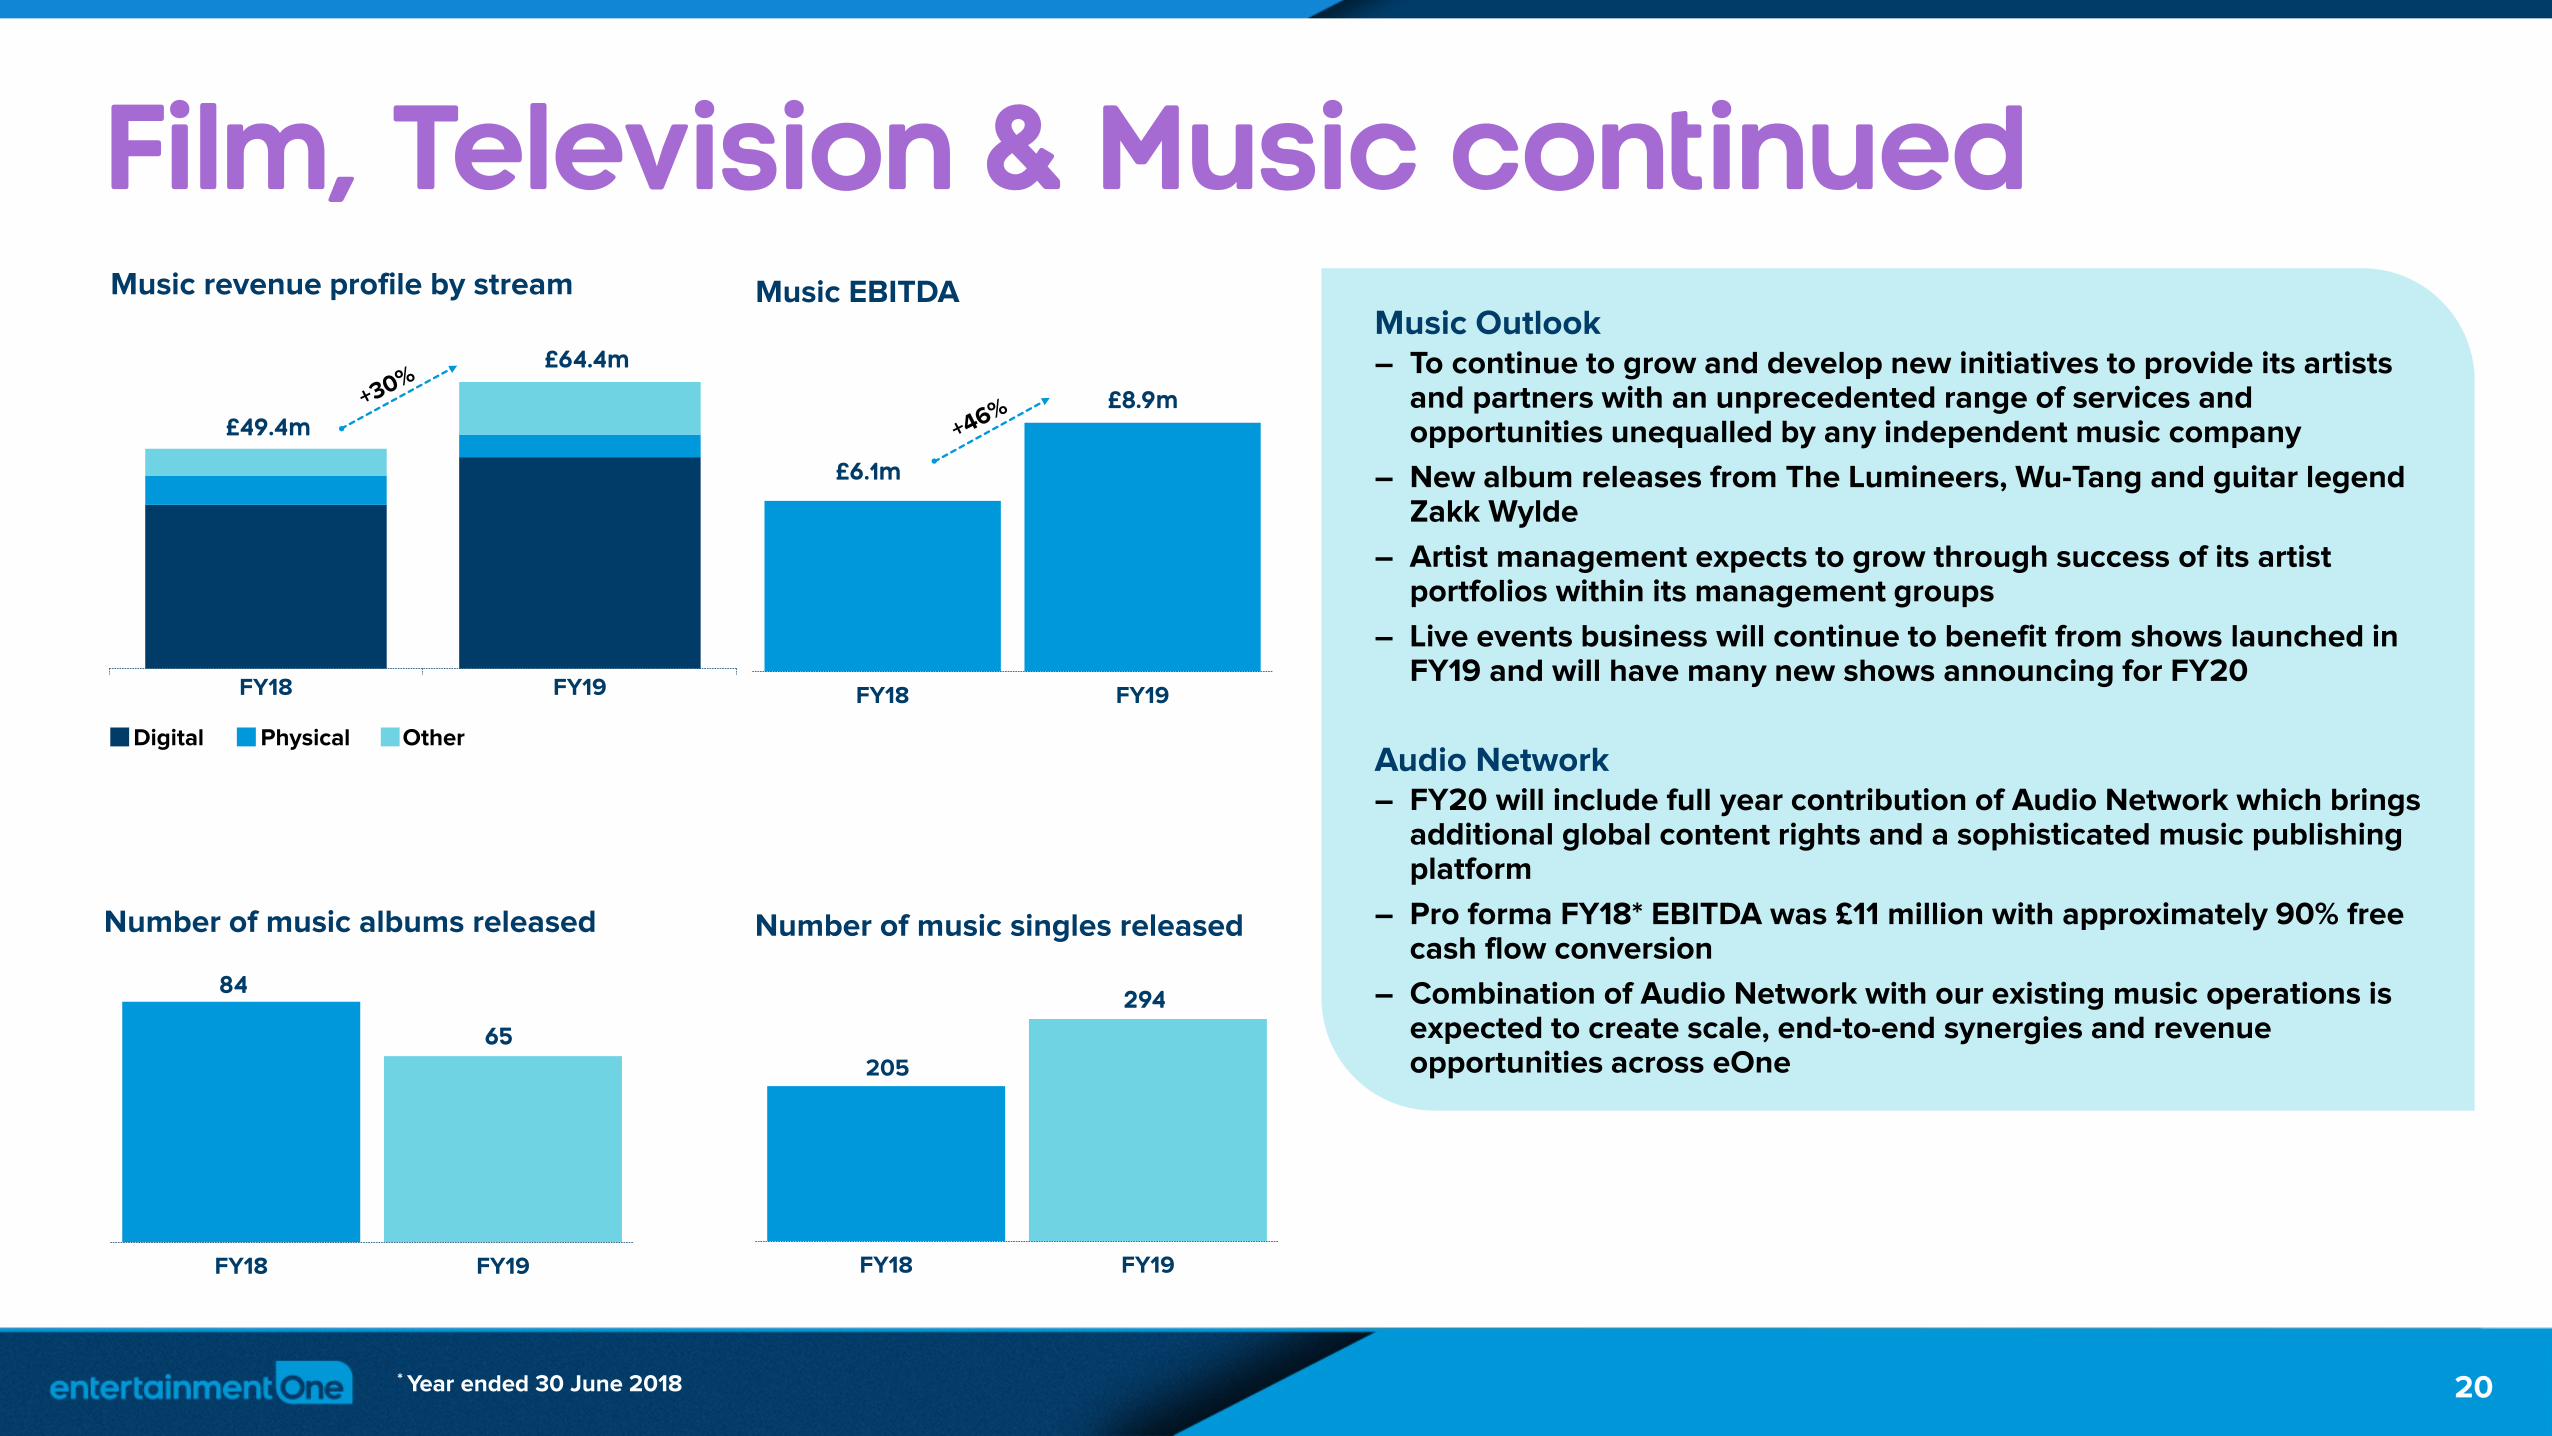
£49.4m
£64.4m
Film, Television & Music continuedMusic revenue profile by stream
PhysicalDigital Other
84
65
FY18 FY19
Number of music albums released
205
294
FY18 FY19
Number of music singles released
Music Outlook– To continue to grow and develop new initiatives to provide its artists
and partners with an unprecedented range of services and opportunities unequalled by any independent music company
– New album releases from The Lumineers, Wu-Tang and guitar legend Zakk Wylde
– Artist management expects to grow through success of its artist portfolios within its management groups
– Live events business will continue to benefit from shows launched in FY19 and will have many new shows announcing for FY20
Audio Network– FY20 will include full year contribution of Audio Network which brings
additional global content rights and a sophisticated music publishing platform
– Pro forma FY18* EBITDA was £11 million with approximately 90% free cash flow conversion
– Combination of Audio Network with our existing music operations is expected to create scale, end-to-end synergies and revenue opportunities across eOne
20
FY18 FY19
£8.9m
£6.1m
Music EBITDA
* Year ended 30 June 2018
entertainmentone.com
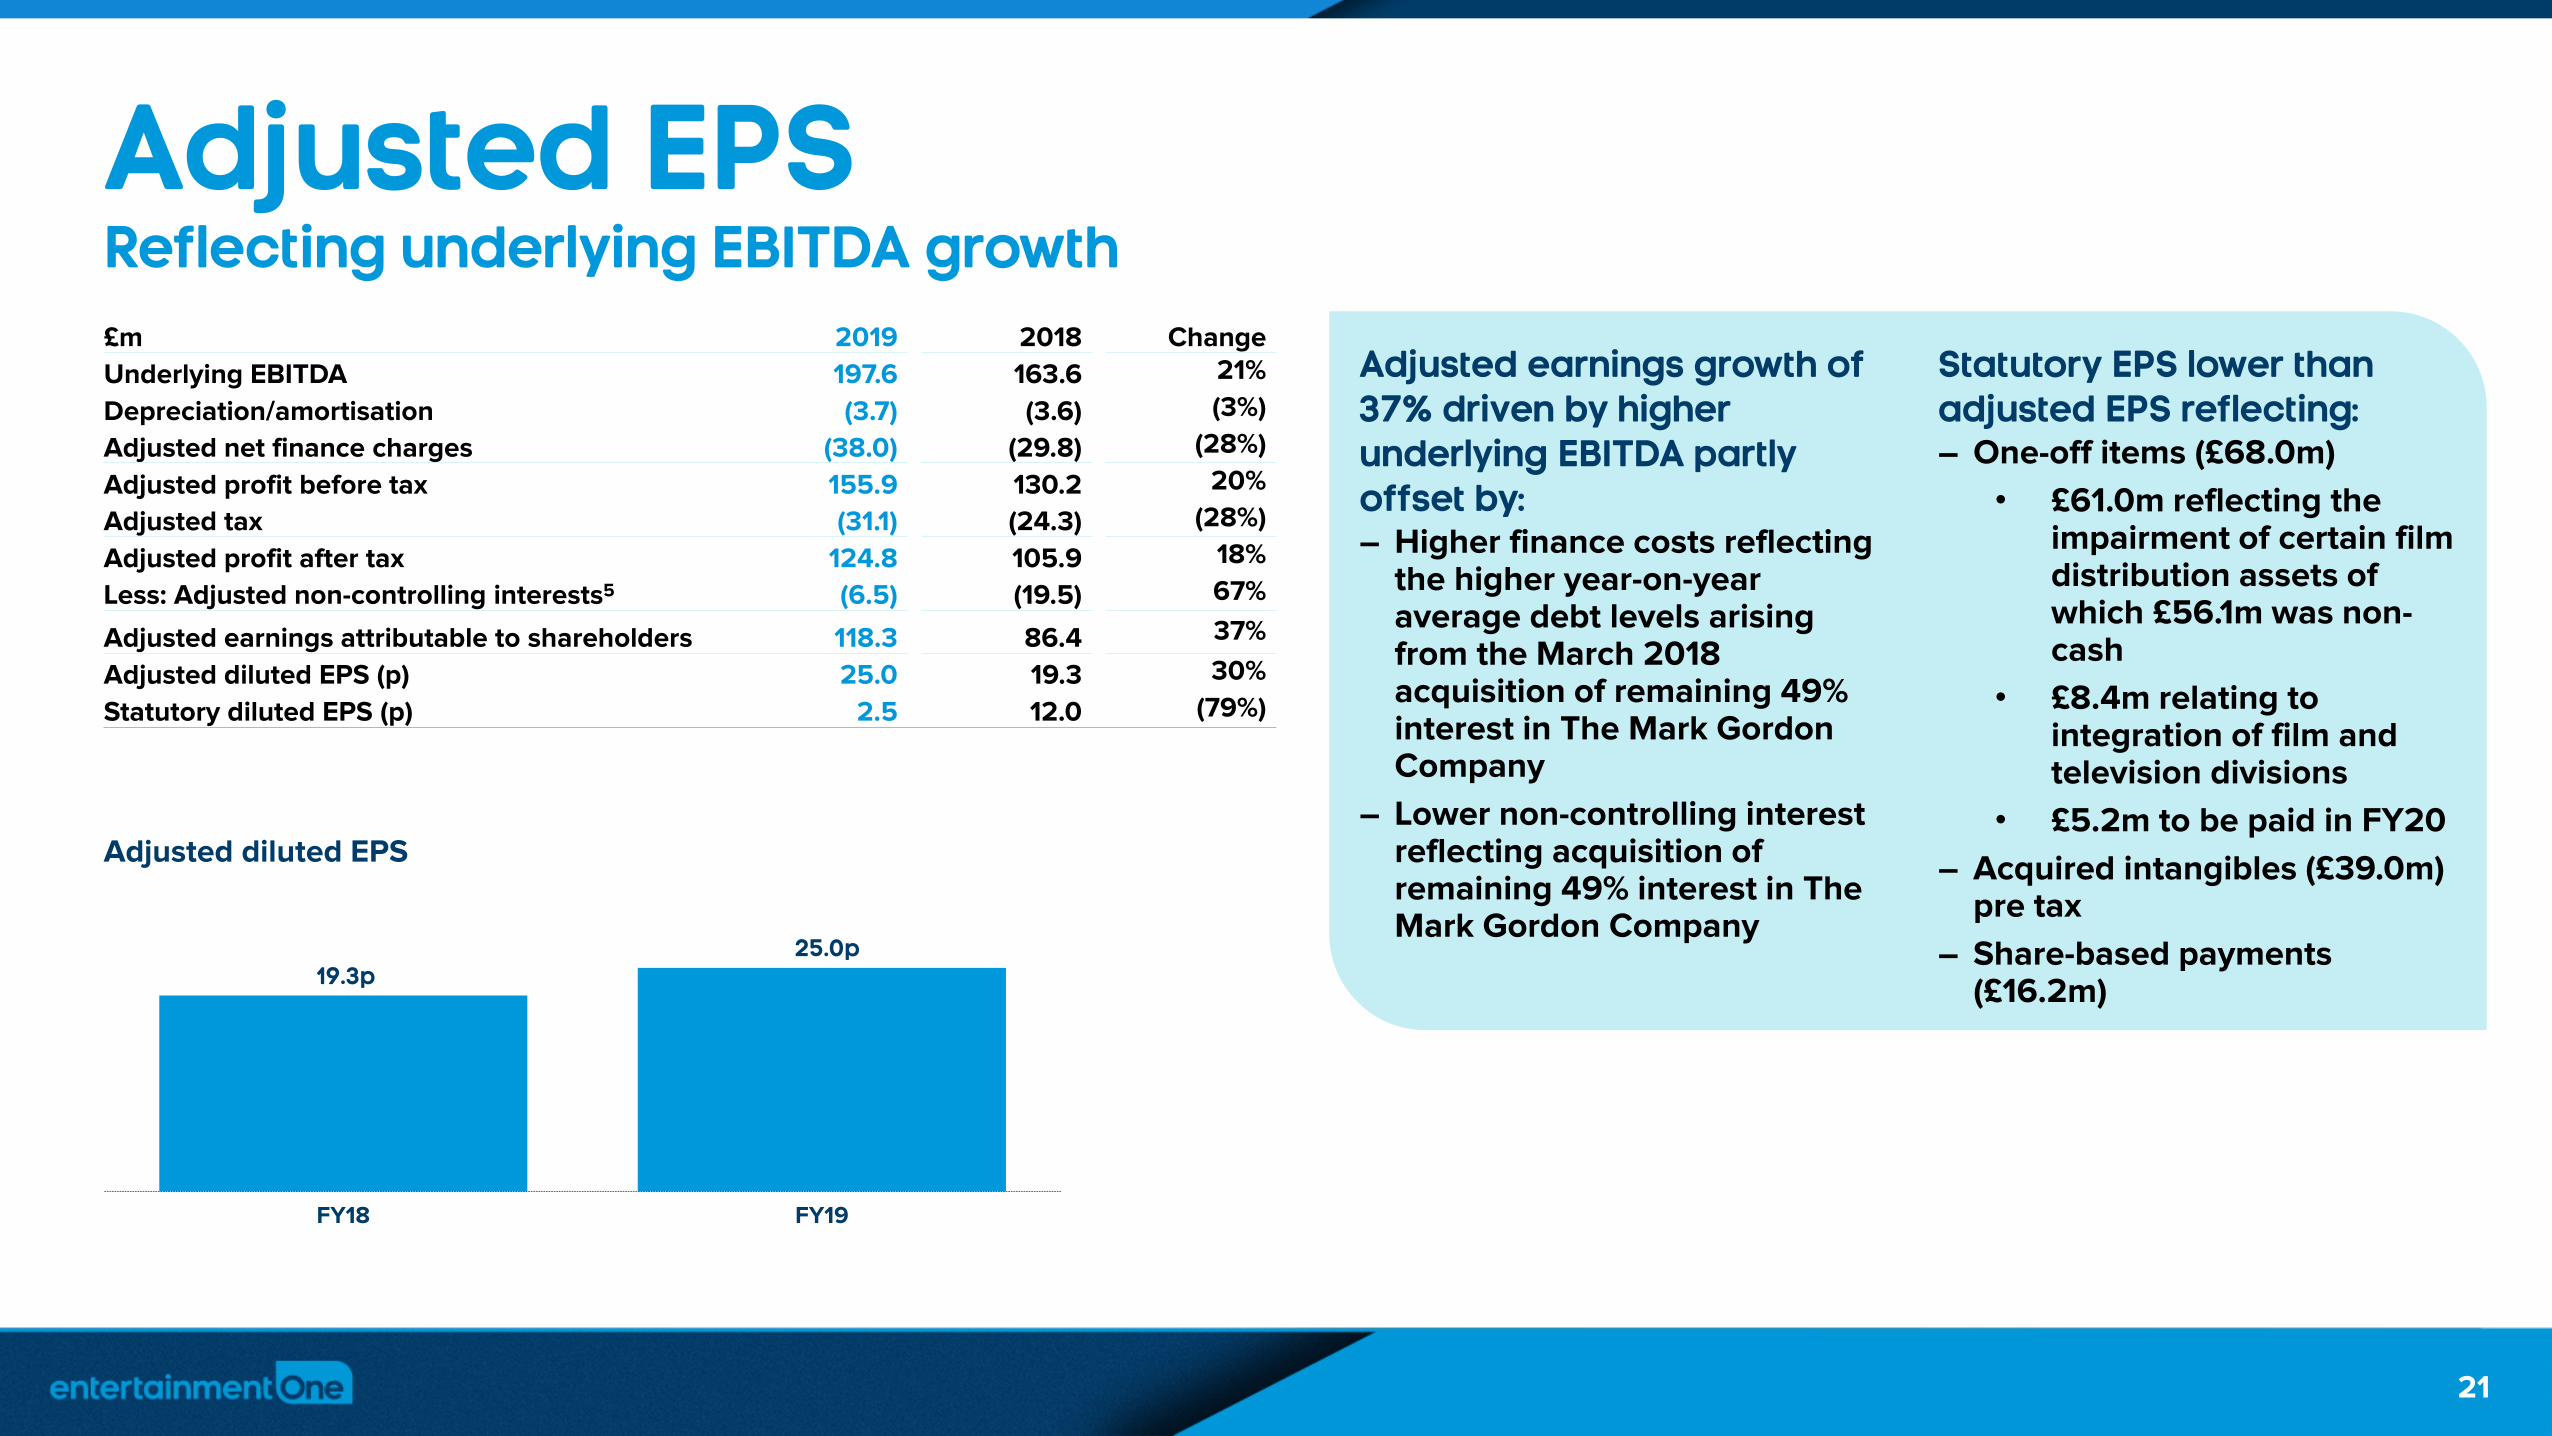
Adjusted EPSReflecting underlying EBITDA growth
Adjusted earnings growth of 37% driven by higher underlying EBITDA partly offset by:– Higher finance costs reflecting
the higher year-on-year average debt levels arising from the March 2018 acquisition of remaining 49% interest in The Mark Gordon Company
– Lower non-controlling interest reflecting acquisition of remaining 49% interest in The Mark Gordon Company
Statutory EPS lower than adjusted EPS reflecting:– One-off items (£68.0m)
• £61.0m reflecting the impairment of certain film distribution assets of which £56.1m was non-cash
• £8.4m relating to integration of film and television divisions
• £5.2m to be paid in FY20
– Acquired intangibles (£39.0m) pre tax
– Share-based payments (£16.2m)
19.3p25.0p
FY18 FY19
Adjusted diluted EPS
£m 2019 2018 Change
Underlying EBITDA 197.6 163.6 21%
Depreciation/amortisation (3.7) (3.6) (3%)
Adjusted net finance charges (38.0) (29.8) (28%)
Adjusted profit before tax 155.9 130.2 20%
Adjusted tax (31.1) (24.3) (28%)
Adjusted profit after tax 124.8 105.9 18%
Less: Adjusted non-controlling interests5 (6.5) (19.5) 67%
Adjusted earnings attributable to shareholders 118.3 86.4 37%
Adjusted diluted EPS (p) 25.0 19.3 30%
Statutory diluted EPS (p) 2.5 12.0 (79%)
21

entertainmentone.com
Free cash flowAdjusted cash flow improvement
Positive adjusted cash flow of £74.1 million with cash flow conversion at 41% – Primarily driven by an increase in EBITDA and reduction in investment in acquired content rights
– Partly offset by increase in working capital outflow and increase in investment in productions
– Strong cash conversion in Family & Brands and improved cash conversion in Film, Television & Music
Free cash flow of £12.4 million, after interest, tax and capex– Driven by improved adjusted cash flow and timing of tax payments partly offset by higher finance costs
2019 2018
£m
Family &
Brands
Film, Television
& Music
Centre &
Elims Total
Family &
Brands
Film, Television
& Music
Centre &
Elims Total
Underlying EBITDA (exc. Production) 96.4 99.8 (14.6) 181.6 71.8 78.9 (13.3) 137.4
Amortisation of investment in acquired content rights - 84.0 - 84.0 - 113.4 - 113.4
Investment in acquired content rights - (121.9) - (121.9) - (144.5) - (144.5)
Amortisation of investment in productions 7.4 104.7 (0.4) 111.7 3.5 86.6 (0.1) 90.0
Investment in productions, net of grants (9.5) (122.6) 0.4 (131.7) (7.3) (118.6) 1.0 (124.9)
Working capital (9.7) (37.6) (2.3) (49.6) 13.3 (28.0) 2.8 (11.9)
Adjusted cash flow 84.6 6.4 (16.9) 74.1 81.3 (12.2) (9.6) 59.5
Cash conversion (%) 88% 6% 41% 113% (15%) 43%
Capital expenditure (6.9) (3.2)
Tax paid (23.6) (31.8)
Funds transferred between Net Debt and Production Financing 2.2 0.6
Net interest paid (33.4) (25.5)
Free cash flow 12.4 (0.4)
22
entertainmentone.com
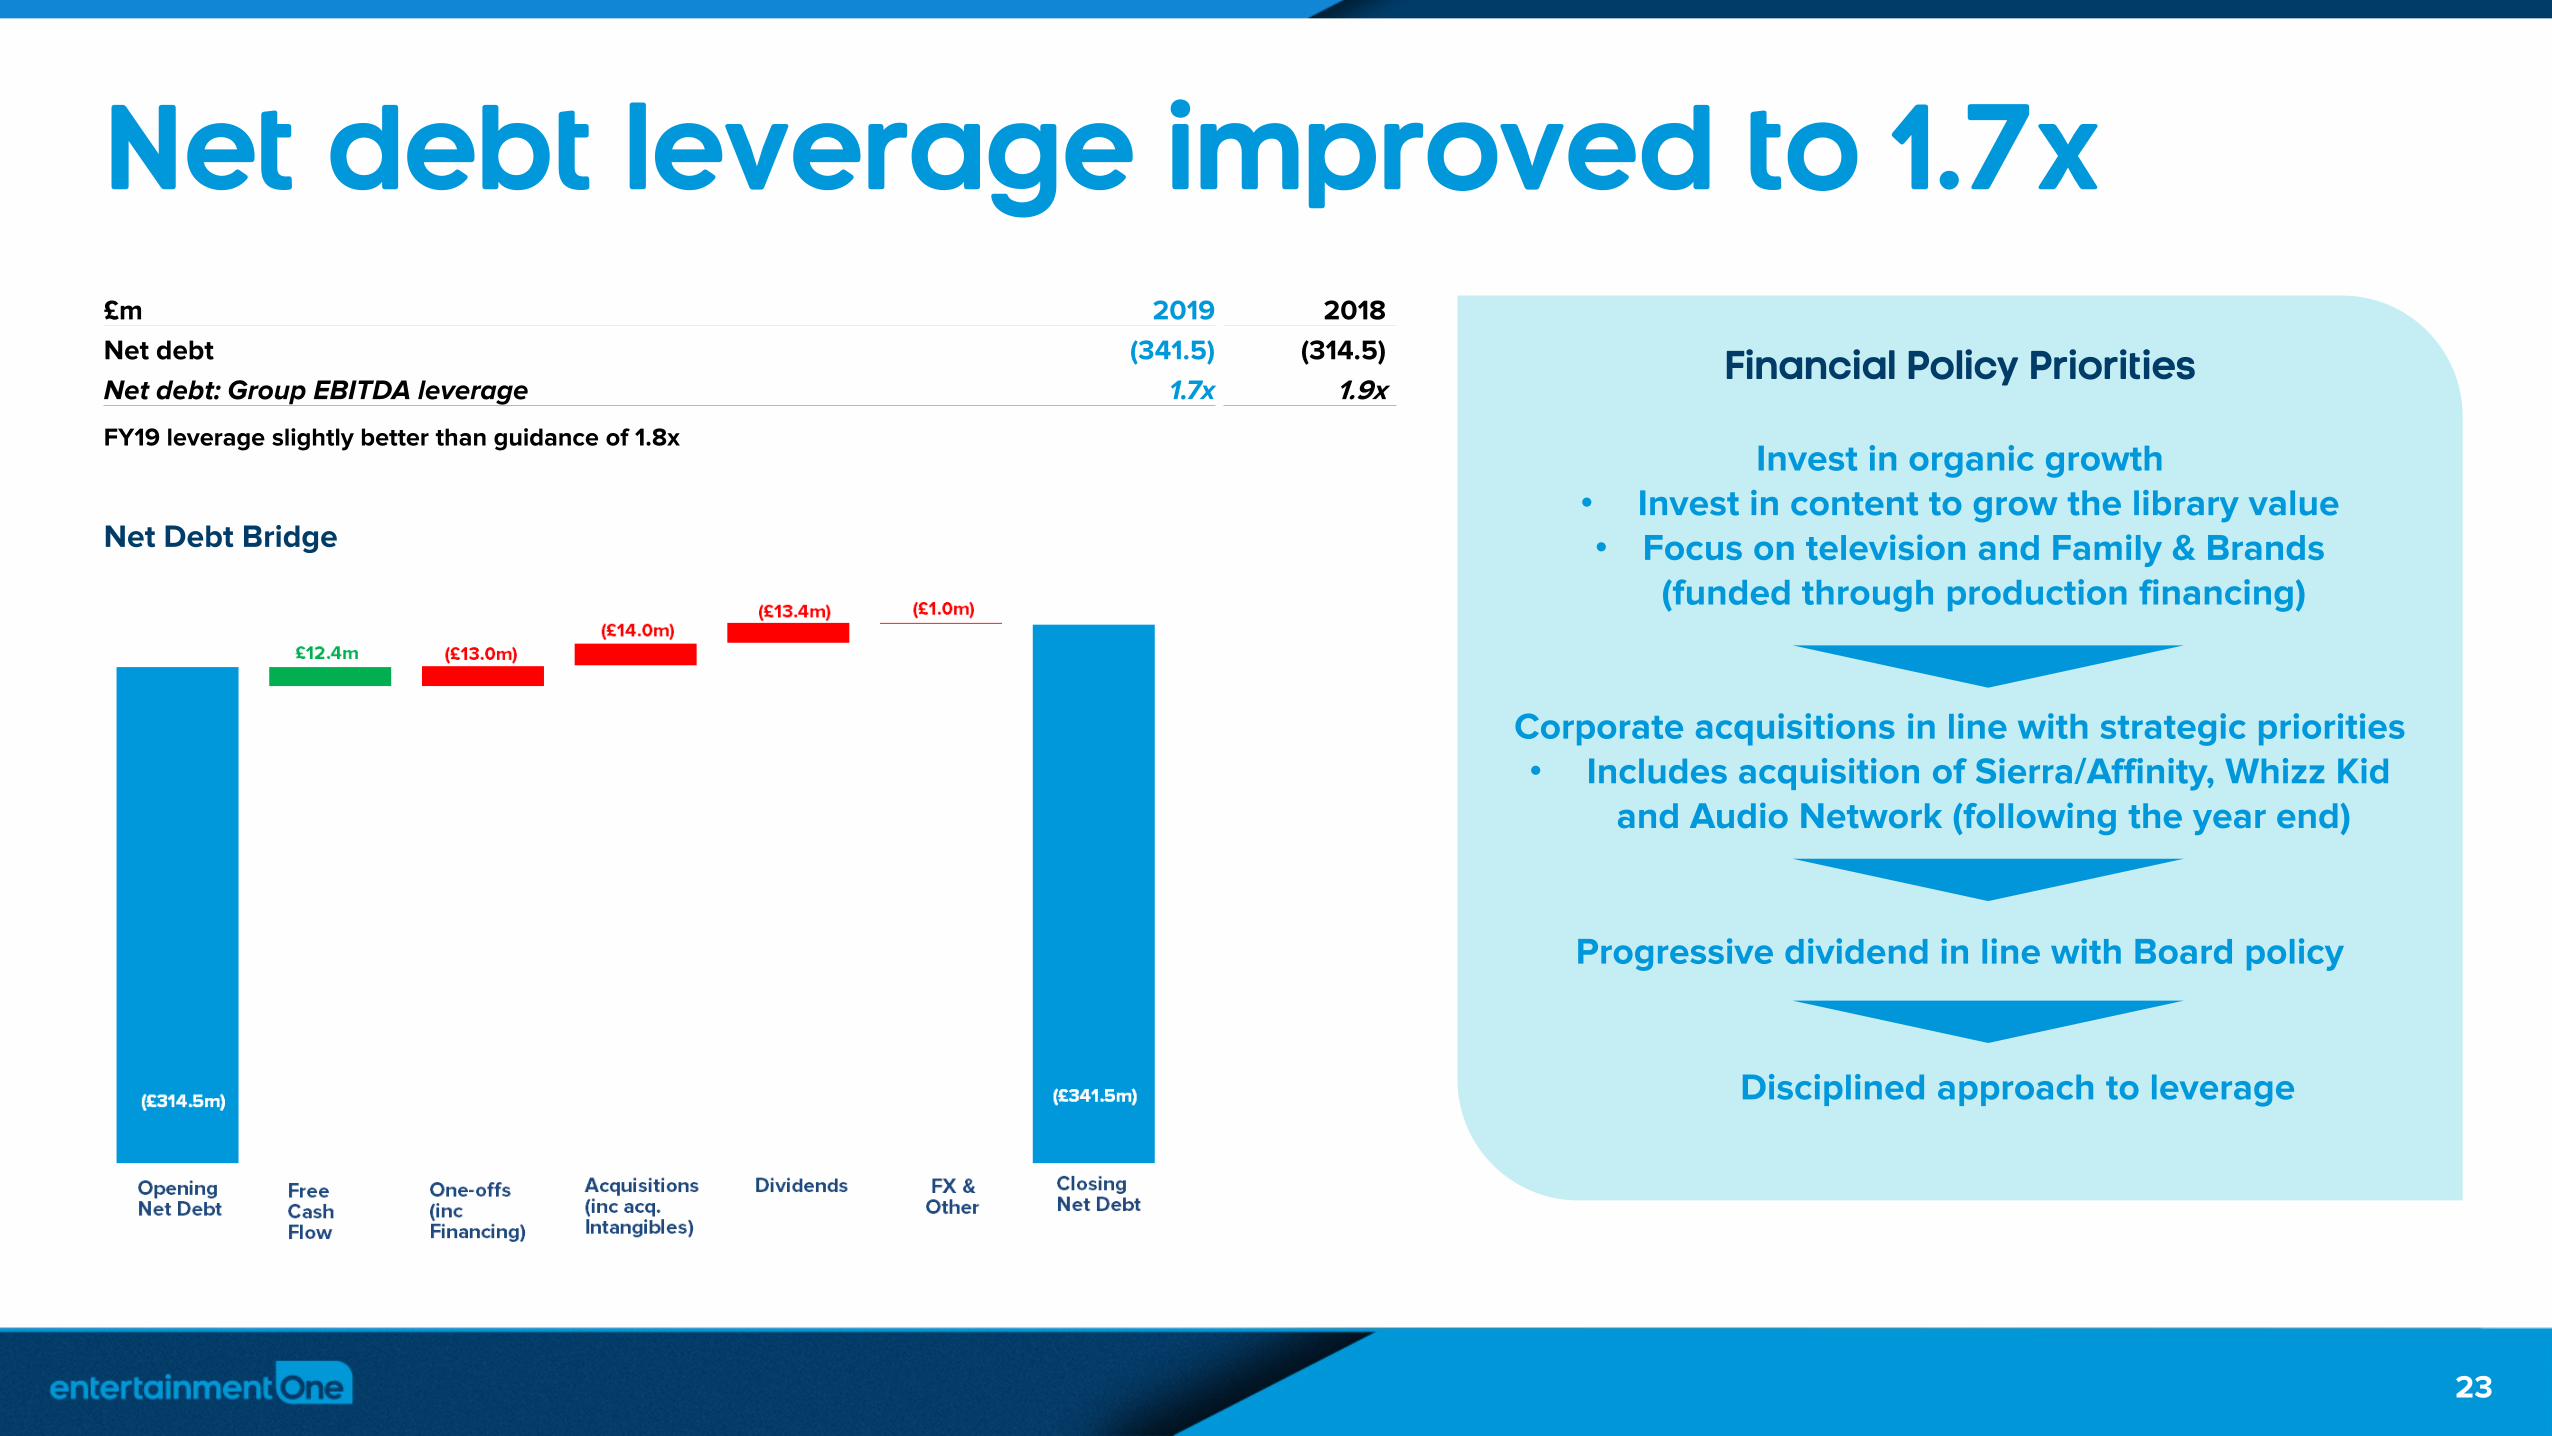
Net debt leverage improved to 1.7x
Financial Policy Priorities
Invest in organic growth• Invest in content to grow the library value• Focus on television and Family & Brands
(funded through production financing)
Corporate acquisitions in line with strategic priorities • Includes acquisition of Sierra/Affinity, Whizz Kid
and Audio Network (following the year end)
Progressive dividend in line with Board policy
Disciplined approach to leverage
Net Debt Bridge
£m 2019 2018
Net debt (341.5) (314.5)
Net debt: Group EBITDA leverage 1.7x 1.9x
FY19 leverage slightly better than guidance of 1.8x
23

entertainmentone.com
Production financing Adjusted cash outflow reflecting timing of programming activities
Production Financing Bridge
2019 2018
£m
Family &
Brands
Film, Television
& Music Total
Family &
Brands
Film, Television
& Music Total
Production underlying EBITDA 0.6 15.4 16.0 (0.8) 27.0 26.2
Amortisation of investment in productions 0.4 128.4 128.8 - 157.4 157.4
Investment in productions, net of grants 3.1 (129.7) (126.6) (2.2) (169.2) (171.4)
Working capital (1.2) (24.1) (25.3) 1.1 11.5 12.6
Production adjusted cash flow 2.9 (10.0) (7.1) (1.9) 26.7 24.8
Capital expenditure (0.2) -
Tax paid (1.3) (0.7)
Funds transferred between Net Debt and Production Financing (2.2) (0.6)
Net interest paid (3.9) (0.7)
Production free cash flow (14.7) 22.8
24

entertainmentone.com
Outlook FY202020 Guidance
Actuals Outlook
Family & Brands FY19 FY20
Investment in productions £6.4 million £10 million
Live licensing and merchandising contracts Over 1,600 Close to 1,800
Film, Television & Music FY19 FY20
Investment in productions, television £213.3 million £350 million
Investment in acquired content, television £43.5 million £30 million
Investment in productions, film £35.0 million £95 million
Investment in acquired content, film £72.1 million £55 million
Investment in acquired content and productions, other including music £10.3 million £13 million
Half hours produced/acquired, television 1,142 Over 1,200
No. of unique theatrical releases 57 50
FY19 FY20
Amortisation of acquired intangibles £39.0 million £36.2million*
One-off items £68.0 million £10 million
Adjusted effective tax rate 20.0% 22%
Weighted average number of shares 473.6 million 516 million
Net debt: Group EBITDA leverage 1.7x 1.6x**
* Does not yet reflect amortisation for Audio Network. Purchase price allocation to be completed.** Including £52 million additional debt related to Audio Network acquisition. 25

entertainmentone.com
IFRS 16 Leases update
• Being implemented on a go-forward basis from 1 April 2019
• Under IFRS 16 the present value of the minimum lease payments on the Group’s property leases are recorded on the balance sheet as a right of use asset with a corresponding lease liability. The present value of minimum lease payments has been calculated at approximately £55.0 million
• The lease payments currently recorded as operating expenses will be replaced by depreciation on the right of use asset and interest expense on the lease liability. This change is presently estimated to result in a reduction in rent expense of £8-10 million in FY20 which will lead to an increase in EBITDA. There will be a corresponding increase in depreciation of £8-10 million resulting in no material change in operating profit. Furthermore, there will be an increase in interest expense of £2.5-3 million resulting in a decrease in profit before tax of the same magnitude
• Net debt: Group EBITDA leverage of 1.6x guided for FY20 still appropriate after neutralising benefit of IFRS 16
• No impact on cash flows
26
entertainmentone.com
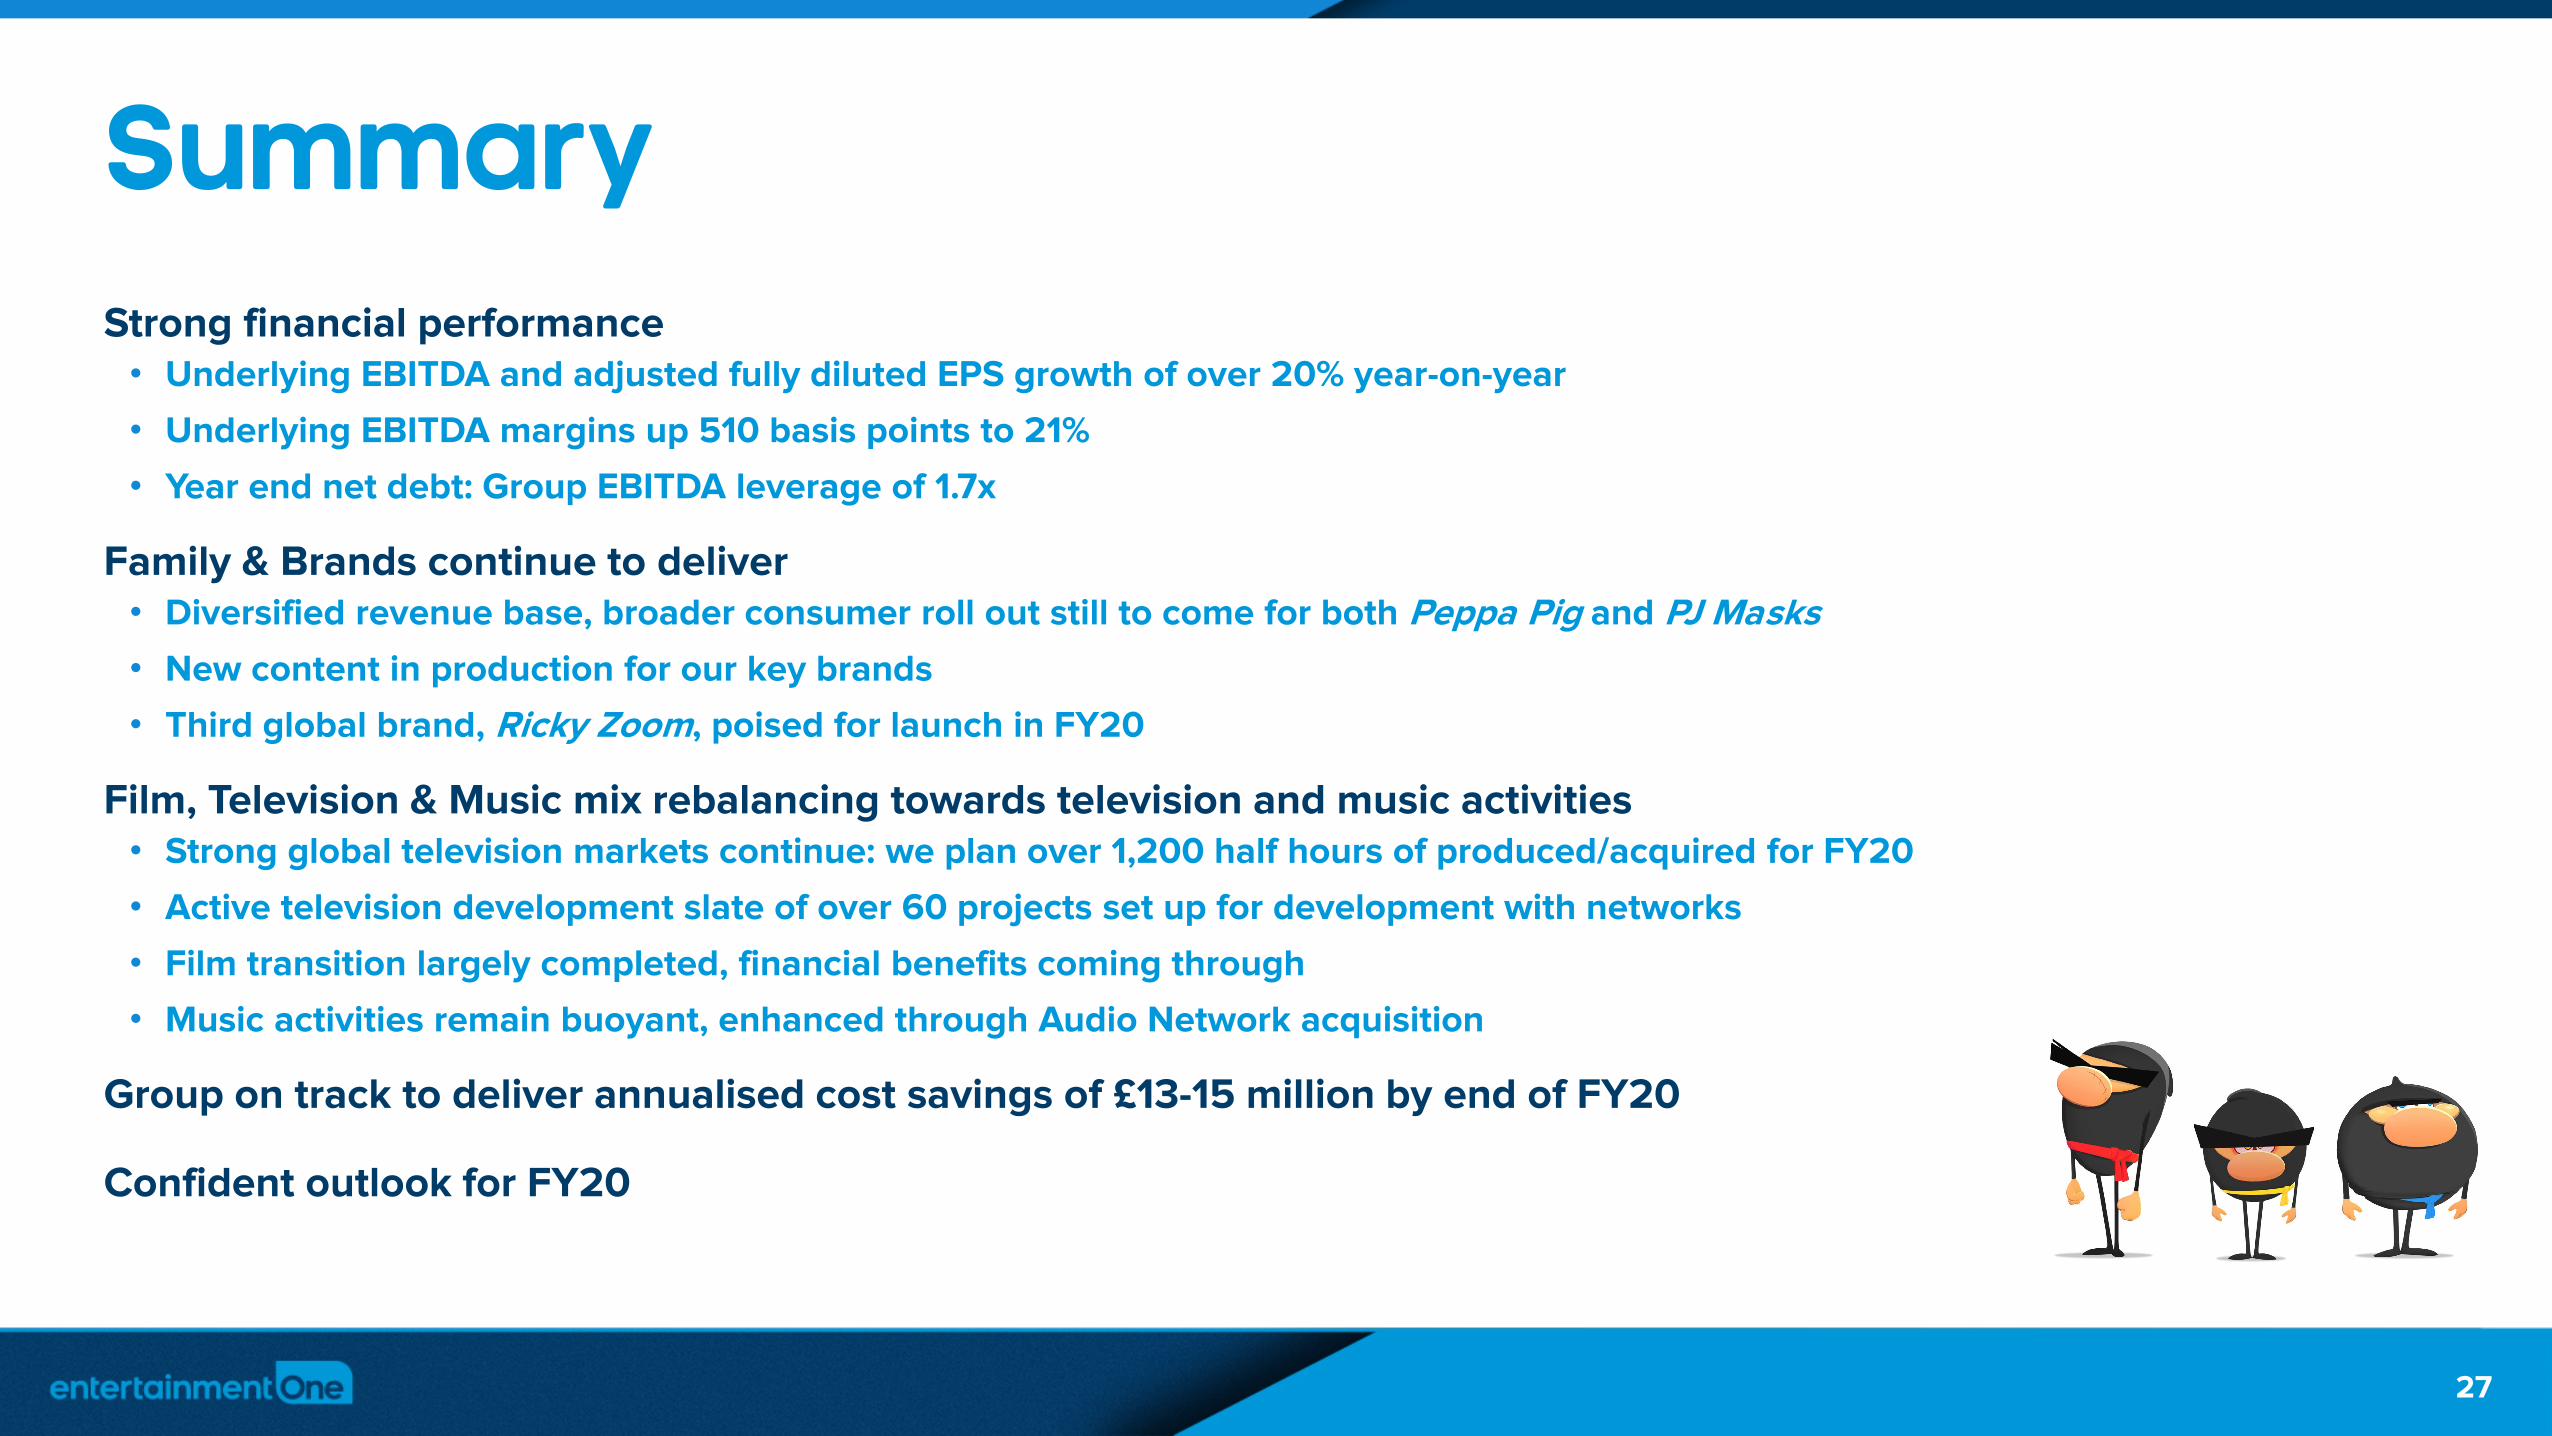
SummaryStrong financial performance
• Underlying EBITDA and adjusted fully diluted EPS growth of over 20% year-on-year
• Underlying EBITDA margins up 510 basis points to 21%
• Year end net debt: Group EBITDA leverage of 1.7x
Family & Brands continue to deliver• Diversified revenue base, broader consumer roll out still to come for both Peppa Pig and PJ Masks
• New content in production for our key brands
• Third global brand, Ricky Zoom, poised for launch in FY20
Film, Television & Music mix rebalancing towards television and music activities• Strong global television markets continue: we plan over 1,200 half hours of produced/acquired for FY20
• Active television development slate of over 60 projects set up for development with networks
• Film transition largely completed, financial benefits coming through
• Music activities remain buoyant, enhanced through Audio Network acquisition
Group on track to deliver annualised cost savings of £13-15 million by end of FY20
Confident outlook for FY20
27

28
Thank you Any questions?

entertainmentone.com
Appendix
29

entertainmentone.com
Group revenue and EBITDA profile
12%
88%
Revenue FY18
£1,029m
46%54%
EBITDA FY19
£198m
40%
60%
EBITDA FY18
£164m
17%
83%
Revenue FY19
£941m
Family & BrandsFilm, Television & Music
% Based on revenue/EBITDA pre eliminations and Group costs 30
entertainmentone.com
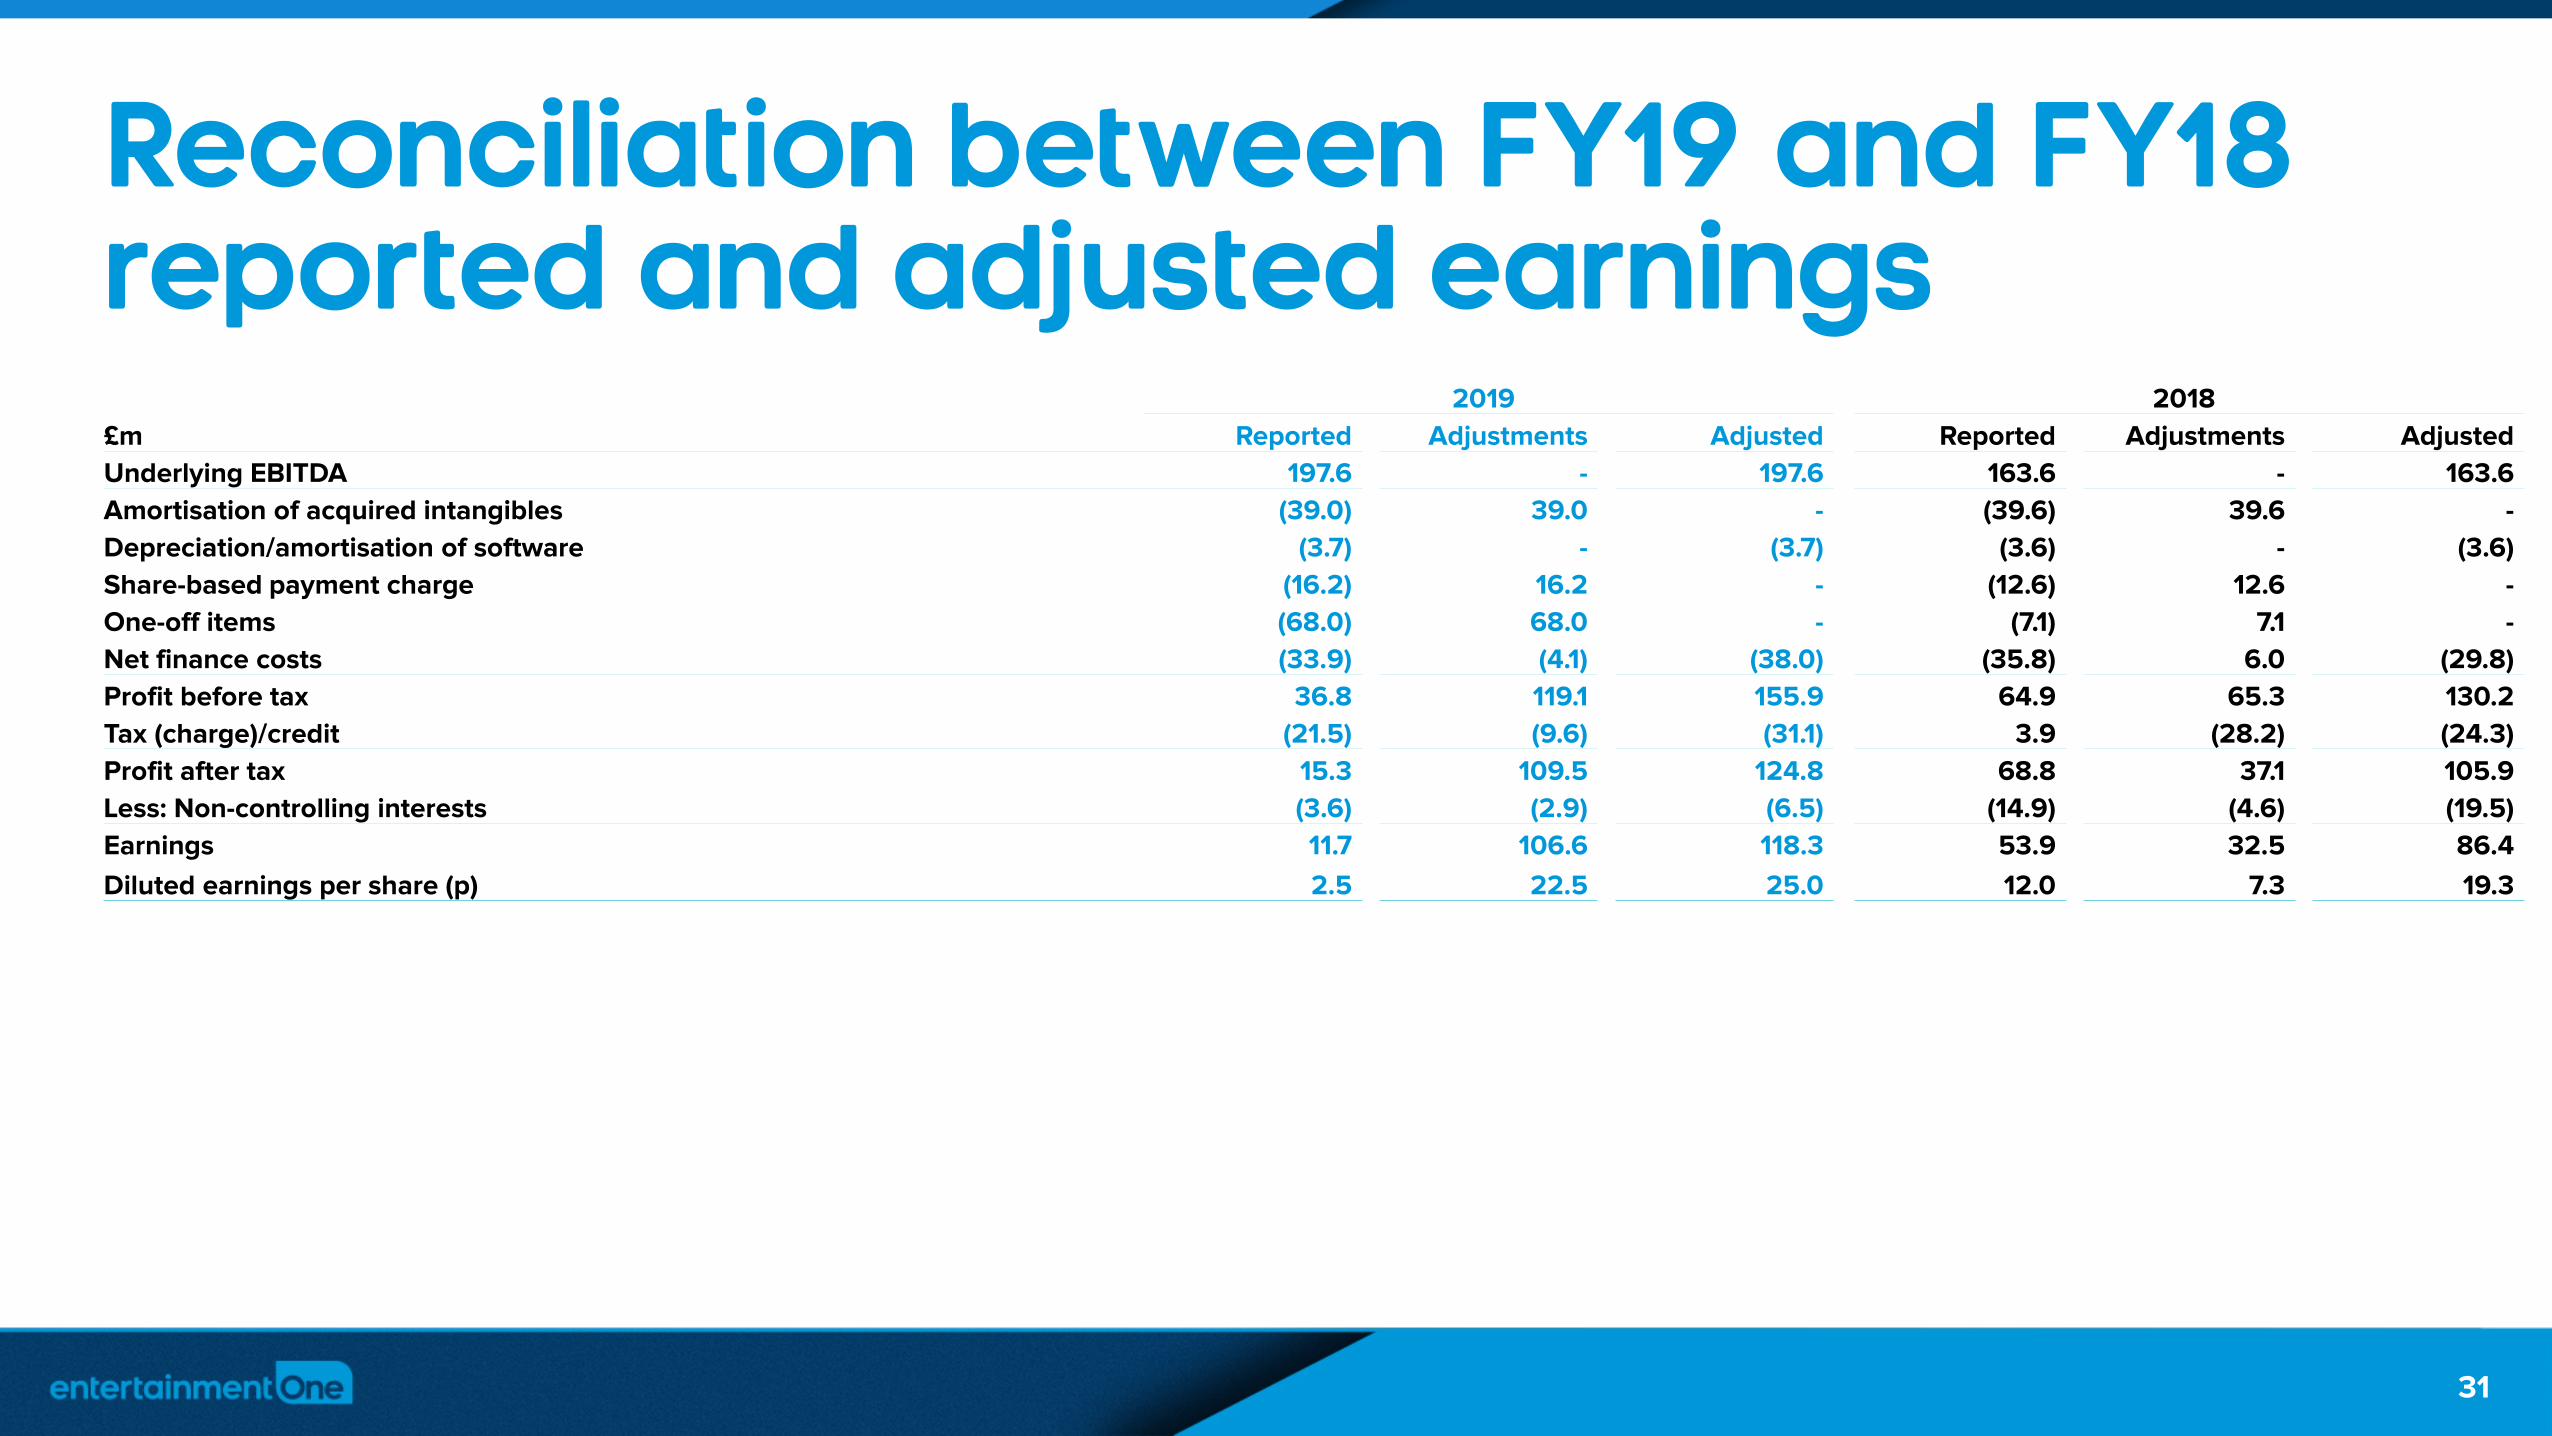
Reconciliation between FY19 and FY18 reported and adjusted earnings
2019 2018
£m Reported Adjustments Adjusted Reported Adjustments Adjusted
Underlying EBITDA 197.6 - 197.6 163.6 - 163.6
Amortisation of acquired intangibles (39.0) 39.0 - (39.6) 39.6 -
Depreciation/amortisation of software (3.7) - (3.7) (3.6) - (3.6)
Share-based payment charge (16.2) 16.2 - (12.6) 12.6 -
One-off items (68.0) 68.0 - (7.1) 7.1 -
Net finance costs (33.9) (4.1) (38.0) (35.8) 6.0 (29.8)
Profit before tax 36.8 119.1 155.9 64.9 65.3 130.2
Tax (charge)/credit (21.5) (9.6) (31.1) 3.9 (28.2) (24.3)
Profit after tax 15.3 109.5 124.8 68.8 37.1 105.9
Less: Non-controlling interests (3.6) (2.9) (6.5) (14.9) (4.6) (19.5)
Earnings 11.7 106.6 118.3 53.9 32.5 86.4
Diluted earnings per share (p) 2.5 22.5 25.0 12.0 7.3 19.3
31

entertainmentone.com
One-off items
£m 2019 2018
Home entertainment 61.0 -
Strategy-related 8.4 8.0
Total restructuring costs 69.4 8.0
Acquisition gains (0.5) (1.9)
Other (0.9) 1.0
Total other items (1.4) (0.9)
Total one-off costs 68.0 7.1
32

entertainmentone.com
Finance charges
£m 2019 2018
£355m senior secured notes at 6.875% (24.3) (20.2)
Interest on bank loans, overdrafts and other (9.3) (6.6)
Interest cost (33.6) (26.8)
Amortisation of deferred finance charges and premium on senior secured notes (1.6) (1.9)
Other net financing income/(costs) 1.3 (7.1)
Net financing costs (33.9) (35.8)
Comprised of:
Adjusted net finance costs (38.0) (29.8)
One-off net finance income/(costs) 4.1 (6.0)
33
entertainmentone.com
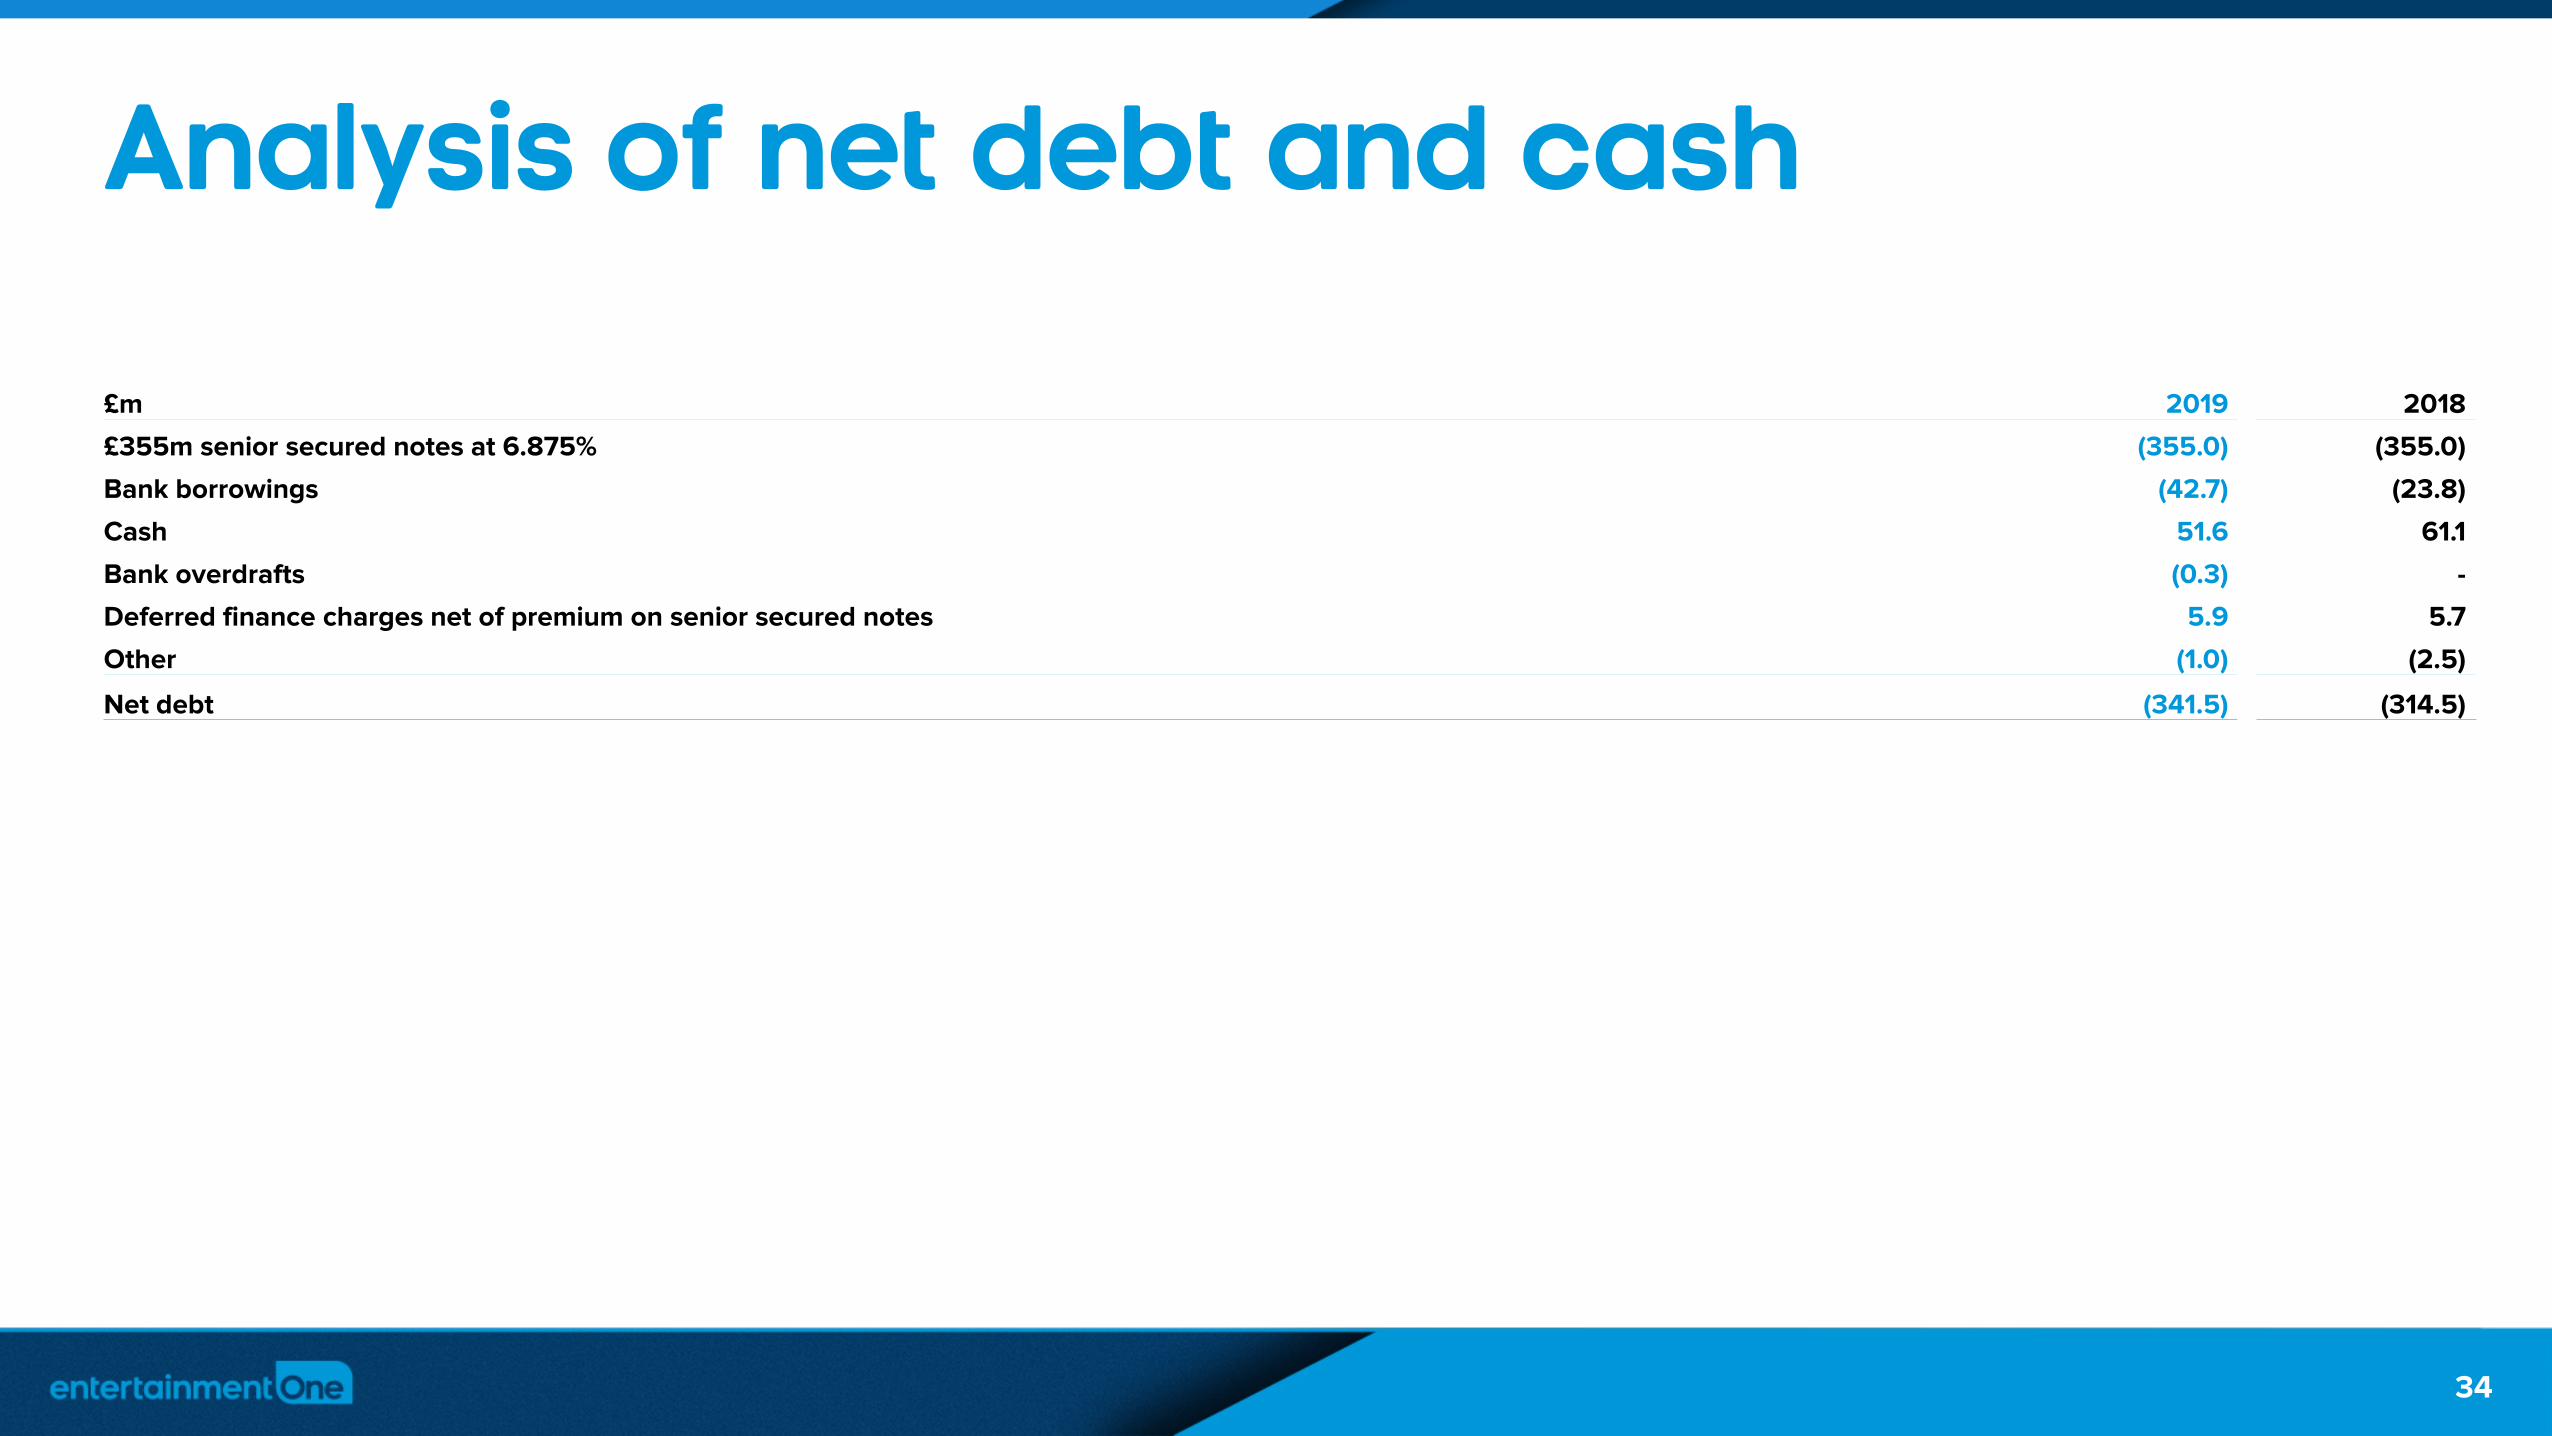
Analysis of net debt and cash
£m 2019 2018
£355m senior secured notes at 6.875% (355.0) (355.0)
Bank borrowings (42.7) (23.8)
Cash 51.6 61.1
Bank overdrafts (0.3) -
Deferred finance charges net of premium on senior secured notes 5.9 5.7
Other (1.0) (2.5)
Net debt (341.5) (314.5)
34

entertainmentone.com
Tax charge
£m 2019 2018
Profit before tax 36.8 64.9
Amortisation of acquired intangibles 39.0 39.6
Share-based payment charge 16.2 12.6
One-off items 68.0 7.1
One-off net finance charges (4.1) 6.0
Adjusted profit before tax 155.9 130.2
Income tax (charge)/credit (21.5) 3.9
Amortisation of acquired intangibles (5.1) (6.6)
Share-based payment charge (0.5) (0.4)
One-off items – operating and financing (3.4) (1.9)
One-off net finance charges 0.2 0.1
Release of certain tax provisions (0.7) (12.6)
Other discrete tax items (0.1) 0.7
Prior year impact of rate reduction in the US - (7.5)
Adjusted tax charge on adjusted profit before tax (31.1) (24.3)
Adjusted effective tax rate 20.0% 18.7%
35

entertainmentone.com
Notes
1. Underlying EBITDA (referred to as “EBITDA” herein) is operating profit excluding operating one-off items, amortisation of acquired intangibles, depreciation, amortisation of software, share-based payment charge, and tax, finance costs and depreciation related to joint ventures. Underlying EBITDA is reconciled to operating profit in the "Other Financial Information” section of the Announcement.
2. Adjusted profit before tax is the reported measure excluding amortisation of acquired intangibles, share-based payment charge, tax, finance costs and depreciation related to joint ventures, operating one-off items and finance one-off items. Adjusted diluted earnings is adjusted for the tax effect of these items and other one-off tax items.
3. Free cash flow is calculated from cash flows associated with the Net Debt of the Group. It excludes cash flows associated with production activities. Free cash flow is adjusted cash flow less capital expenditure, net interest paid and tax paid. It is measured excluding one-off items. Adjusted cash flow is underlying EBITDA (excluding EBITDA related to Production Financing), amortisation of acquired content rights, purchase of acquired content rights, amortisation of investment in productions, purchase of productions (net of grants), working capital (excluding the impact of operating one-off items) and joint venture movements. Cash conversion is calculated based upon underlying EBITDA (excluding EBITDA related to Production Financing) and adjusted cash flow.
4. Group EBITDA leverage calculated based upon the net debt and Group EBITDA.
5. Adjusted non-controlling interests are the adjusted profit after tax relating to non-controlling interests.
36
entertainmentone.com
Important information
This confidential presentation (including any oral information, question and answer session and any other document or materials distributed at or in connection with this presentation) (the “Presentation”) has been prepared by Entertainment One Ltd. (the “Company”), and contains confidential information regarding the Company, its business and operations and members of its group (“Group”). It is provided for the exclusive use of the persons provided with the Presentation, and the Presentation and any further confidential information made available to any recipient, either verbally or in writing, must be held in complete confidence and without prejudice to the aforesaid, such information and documents containing such information may not be reproduced, used or in any way disclosed without the prior written consent of the Company.
This Presentation is not intended to form the basis of any investment activity or decision, and should not be considered as a recommendation by the Company that any recipient should acquire any interest in the share capital or in any other interest in the Company. It does not constitute or form part of and should not be relied upon in connection with any offer or invitation to sell or issue, or a solicitation of an offer or invitation to purchase or subscribe for, any securities or other interests in the Company or any related entity and no legal relations shall be created by its issue.
The contents of this Presentation have not been approved for distribution in the UK by an authorised person for the purposes of Section 21 of the Financial Services and Markets Act 2000 (“FSMA”). This Document may only be communicated or caused to be communicated in the UK to: (1) persons authorised to carry on a regulated activity (“Authorised Persons”) under FSMA; (2) persons otherwise having professional experience in matters relating to investments and qualifying as investment professionals under Article 19 of the Financial Services and Markets Act 2000 (Financial Promotion) Order 2005, as amended (the “Order”); (3) persons qualifying as high net worth individuals under Article 48 of the Order; (4) persons qualifying as high net worth companies or unincorporated associations under Article 49 of the Order; or (5) to any other person to whom this Document may otherwise lawfully be communicated or caused to be communicated, including the recipients (“Relevant Persons”).
The distribution of the Presentation in certain jurisdictions may be restricted by law and therefore persons into whose possession this document comes should inform themselves about and observe such restrictions. Any person who receives this Presentation in violation of such restrictions should not act upon it and should return it to the Company immediately. The Presentation is not directed to, or intended for distribution or use by any persons or entity that is a citizen or resident or located in any locality, state, country or other jurisdiction where such distribution or use would be contrary to law or regulation or which would require any registration or licensing within such jurisdiction. In particular, this Presentation (and the information contained in it) is not for release, publication or distribution, directly or indirectly, in the United States (or for the account of any "U.S. Person" as defined in Regulation S under the US Securities Act 1933), Australia, New Zealand, Canada, Japan or South Africa. Persons into whose possession this Presentation comes should inform themselves about and observe such restrictions.
37