full report of findings / april 2014 land subsidence from ...€¦ · prepared by full report of...
TRANSCRIPT

Prepared By
Full Report of Findings / April 2014
Land Subsidence from Groundwater Use in California
James W. Borchers • Michael Carpenter
With Support By
Topic: Groundwater Land Subsidence from Groundwater Use in California
CA Water Plan Update 2013 Vol 4 Reference Guide Page 1

Full Report of Findings / April 2014
Land Subsidence from Groundwater Use in California
Contributing Authors
• James W. Borchers• Vicki Kretsinger Grabert• Michael Carpenter• Barbara Dalgish• Debra Cannon
California Water Foundation The California Water Foundation (CWF) seeks to transition California to a sustainable and resilient water future – a future in which water is managed as a natural resource, looking across all sources and uses to find the best solutions for social welfare, economic development, and environmental sustainability. CWF supports innovative projects and policies that address water challenges today, while achieving long-term, science-based solutions for the future. CWF is an initiative of Resources Legacy Fund, with primary funding from S.D. Bechtel, Jr. Foundation and Pisces Foundation, and additional support from David and Lucile Packard Foundation and others. Learn more at: http://www.californiawaterfoundation.org.
Topic: Groundwater Land Subsidence from Groundwater Use in California
CA Water Plan Update 2013 Vol 4 Reference Guide Page 2

Full Report of Findings / April 2014
Land Subsidence from Groundwater Use in California
Acknowledgement
The California Water Foundation Subsidence Resources Group was established on April 29, 2013 to act as advisors for this report and is made up of those persons most knowledgeable on the subject of subsidence. The group has provided general input and subsequent review of reference lists, data assessments, and descriptions of monitoring and research needs. CWF appreciates the contributions of the 22 members listed below:
Gerald Bawden U.S. Geological Survey
Chris Bonds CA Dept. of Water Resources No. Central Region
Rob Carruth U.S. Geological Survey
Wes Danskin U.S. Geological Survey
Bill Ehorn CA Dept. of Water Resources Northern Region
Claudia Faunt U.S. Geological Survey
Devin Galloway U.S. Geological Survey
Randy Hanson U.S. Geological Survey
Carl Hauge CA Dept. of Water Resource (retired)
Donald C. Helm USGS/LLNL/CSIRO/UNR/NBMG/MSU (retired)
Charles Heywood U.S. Geological Survey
Thomas Holzer U.S. Geological Survey
Marti Ikehara USGS/NGS (retired)
Steven Ingebritsen U.S. Geological Survey
John Kirk CA Dept. of Water Resources So.Central Region
Stan Leake U.S. Geological Survey
Steven Phillips U.S. Geological Survey
Don Pool U.S. Geological Survey
Keith Prince U.S. Geological Survey (retired)
Francis S Riley U.S. Geological Survey (retired)
Eric Senter CA Dept. of Water Resources
Michelle Sneed U.S. Geological Survey
Topic: Groundwater Land Subsidence from Groundwater Use in California
CA Water Plan Update 2013 Vol 4 Reference Guide Page 3

APRIL 2014 REPORT OF FINDINGS Land Subsidence from Groundwater Use in California
LSCE, BORCHERS AND CARPENTER ii
Table of Contents EXECUTIVE SUMMARY.............................................................................................................. ES-1
ES 1 Subsidence Resources Group.............................................................................. ES-2
ES 2 Major Areas of Subsidence ................................................................................. ES-2
ES 3 Recommendations ............................................................................................... ES-4
ES 3.1 Monitor Land Surface Elevation Changes and Compaction ....................... ES-4
ES 3.2 Characterize Aquifer System and Monitor Groundwater Levels................ ES-5
ES 3.3 Collect, Store and Disseminate Data ........................................................... ES-5
ES 3.4 Evaluate and Prioritize Subsiding Groundwater Basins .............................. ES-6
1 INTRODUCTION .......................................................................................................................... 1
1.1 Report Organization and Resources ........................................................................ 2
1.1.1 References ........................................................................................................ 3
1.1.2 Subsidence Resources Group ........................................................................... 4
2 SUBSIDENCE PROCESSES IN CALIFORNIA .......................................................................... 5
3 EXTRACTION OF GROUNDWATER FROM THE SUBSURFACE ........................................ 6
3.1 Unconsolidated Aquifer Systems ............................................................................. 7
3.2 Elastic and Inelastic Deformation............................................................................. 8
3.3 Delayed Yield, Residual Compaction, and Water of Compaction .......................... 10
3.4 Earth Fissures .......................................................................................................... 13
4 SUBSIDENCE FROM GROUNDWATER EXTRACTION IN CALIFORNIA ........................ 20
4.1 Santa Clara Valley ................................................................................................... 20
4.2 San Joaquin Valley .................................................................................................. 25
4.3 Sacramento Valley ................................................................................................... 48
Topic: Groundwater Land Subsidence from Groundwater Use in California
CA Water Plan Update 2013 Vol 4 Reference Guide Page 4

APRIL 2014 REPORT OF FINDINGS Land Subsidence from Groundwater Use in California
LSCE, BORCHERS AND CARPENTER iii
4.4 Antelope Valley....................................................................................................... 52
4. 5 Mojave River Basin and Vicinity ............................................................................. 55
4.6 Coachella Valley ...................................................................................................... 58
4.7 Los Angeles ............................................................................................................. 61
4.8 Chino ...................................................................................................................... 64
4.9 Paso Robles Area ..................................................................................................... 65
4.10 San Luis Obispo Area .............................................................................................. 66
4.11 Cambria................................................................................................................... 67
4.12 Santa Clara-Calleguas Basin ..................................................................................... 67
4.13 Elsinore Trough - Wolf Valley to Murrieta ............................................................ 70
4.14 San Jacinto Valley ................................................................................................... 70
4.15 Yucaipa Valley ........................................................................................................ 71
4.16 Cuyama Valley ........................................................................................................ 71
5 MEASURING AND MONITORING LAND SUBSIDENCE ..................................................... 72
5.1 Methods................................................................................................................... 72
5.1.1 Measuring Changes in Land Surface Elevation ............................................... 73
5.2 Earth Fissures – Methods for Measuring and Monitoring ....................................... 81
5.2.1 Precise Leveling and Horizontal Distance Surveys ......................................... 82
5.2.2 3-D Deformation and Continuous Measurements of Fissure Movement ....... 83
5.3 Numerical Modeling ............................................................................................... 84
5.4 Networks Monitoring Land Subsidence Caused by Groundwater Extraction ....... 86
6 SUMMARY .................................................................................................................................. 97
6. 1 Conclusions ........................................................................................................... 104
Topic: Groundwater Land Subsidence from Groundwater Use in California
CA Water Plan Update 2013 Vol 4 Reference Guide Page 5
APRIL 2014 REPORT OF FINDINGS Land Subsidence from Groundwater Use in California
LSCE, BORCHERS AND CARPENTER iv
7 RECOMMENDATIONS ............................................................................................................ 106
7. 1 Data Collection, Storage, and Dissemination ........................................................ 106
7.1.1 Monitoring Land Surface Elevation Changes and Compaction .................... 107
7.1.2 Characterize Aquifer System and Monitor Groundwater Levels................. 108
7.2 Prioritizing and Evaluating Subsiding Groundwater Basins ............................... 109
7.2.1 Reporting ...................................................................................................... 110
8 REFERENCES ........................................................................................................................... 111
Appendix Appendix A Subsidence Processes in California Tables Table 5-1 Methods of measuring land subsidence .............................................................. 74
Table 5-2 Central Valley historical extensometer data newly available through the USGS................................................................................................................. 88
Table 5-3 Sacramento Valley extensometers currently operated by the California
Department of Water Resources ......................................................................... 90
Table 5-4 Extensometers currently monitored by the Chino, California Water Master ........ 94
Table 5-5 Construction details and period of record for extensometers currently monitored by the East Bay Municipal Utility District at the Bayside Artificial Storage and Recovery Facility in San Lorenzo .................................... 94
Table 5-6 Construction details and period of record for extensometers currently monitored by the Semitropic Water Storage District near Kern Wildlife Area, Delano ...................................................................................................... 96
Table A-1 Subsidence Over Selected California Oil and Gas Fields ................................ A-20
Figures Figure 3-1 An undeveloped aquifer system in balance ........................................................... 6
Figure 3-2 Land subsidence due to compaction of fine-grained material after fluid extraction ............................................................................................................. 7
Topic: Groundwater Land Subsidence from Groundwater Use in California
CA Water Plan Update 2013 Vol 4 Reference Guide Page 6

APRIL 2014 REPORT OF FINDINGS Land Subsidence from Groundwater Use in California
LSCE, BORCHERS AND CARPENTER v
Figure 3-3 An aquifer system susceptible to compaction that results in land subsidence. Release of water from aquitards, both clayey confining units and clayey
interbeds causes a reduction in thickness of these compressible sediments ........... 8
Figure 3-4A Schematic of differential compaction settings for earth fissures; wells pumping near a substantial change in the thickness of compressible aquifer materials at a basin-bounding fault trigger fissuring ........................................... 14
Figure 3-4B Schematic of differential compaction settings for earth fissures; high total compaction in thick sediments triggers fissuring where sediments are thin over a buried bedrock high ................................................................................. 14
Figure 3-4C Schematic of differential compaction settings for earth fissures; Fissure forms where less compressible sand and gravel transition to highly compressible clay and silt................................................................................... 15
Figure 3-4D Schematic of differential compaction settings for earth fissures; Sediments are uniformly compressible, but a fissure forms where a fault barrier prevents groundwater from flowing toward pumping wells ................................ 15
Figure 3-5 Picacho earth fissure in Superbowl 2012 Chevrolet Cobalt commercial. ............. 17
Figure 3-6 Earth fissure, Harquahala Plain, Arizona, USA ................................................... 18
Figure 3-7A Earth fissure, Rogers Dry Lake at Edwards Air Force Base, California ............... 18
Figure 3-7B Earth fissure, Edwards Dry Lake at Edwards Air Force Base, California ............ 19
Figure 4-1 Location of areas of subsidence caused by groundwater extraction in California ........................................................................................................... 21
Figure 4-2 Contours of land subsidence in the northern Santa Clara Valley during 1934-1967 ................................................................................................................... 22
Figure 4-3A Interferograms showing seasonal subsidence during January 1997-August
1997 ................................................................................................................... 23
Figure 4-3B Interferograms showing small amounts of uplift over longer time period, 1992-1997 .......................................................................................................... 23
Figure 4-4A The South Bay Yacht Club at Alviso, California in 1915, before dikes were necessary to prevent flooding ............................................................................. 24
Figure 4-4B The South Bay Yacht Club at Alviso, California in 1915, 1978 after dikes were constructed to prevent bay water from flooding areas near the yacht club that had subsided to 10 feet below sea level. ...................................................... 24
Figure 4-5 Primary areas of Subsidence in the San Joaquin Valley ...................................... 27
Topic: Groundwater Land Subsidence from Groundwater Use in California
CA Water Plan Update 2013 Vol 4 Reference Guide Page 7

APRIL 2014 REPORT OF FINDINGS Land Subsidence from Groundwater Use in California
LSCE, BORCHERS AND CARPENTER vi
Figure 4-6A Remedial activities in subsidence-affected reaches of the Friant-Kern Canal. Excavating the canal berm for recompaction ...................................................... 28
Figure 4-6B Remedial activities in subsidence-affected reaches of the Friant-Kern Canal. Extension of concrete canal lining ...................................................................... 28
Figure 4-6C Remedial activities in subsidence-affected reaches of the Friant-Kern Canal. Cribbing emplaced to raise bridge higher ........................................................... 29
Figure 4-6D Remedial activities in subsidence affected reaches of the Friant-Kern Canal. Jacking operation in progress at Avenue 88 bridge ............................................. 29
Figure 4-7 Number of well completion reports received by the California Department of Water Resources annually for counties within San Joaquin Valley ................. 30
Figure 4-8 Recent subsidence in the in San Joaquin Valley January 2007-March 2011 shown as shaded regions compiled from Interferometric Synthetic Aperture Radar (InSAR) analysis. ..................................................................................... 32
Figure 4-9A Location of Lemoore Naval Air Station and Caltrans subsidence profile A-A’ ....................................................................................................... 33
Figure 4-9B Elevation changes from between the 1960s-2004 computed from repeat geodetic surveys along Highway 198 ................................................................. 33
Figure 4-10 Joseph Poland standing near the location of greatest land subsidence during 1925-1977 in the San Joaquin Valley, southwest from Mendota, California ....... 35
Figure 4-11 The San Joaquin River Restoration Program area. Land subsidence centered near El Nido area has affected water conveyance facilities between Mendota and areas downstream from El Nido including the Sack dam and Arroyo Canal, the San Joaquin River and the Chowchilla and Eastside Bypasses ........... 36
Figure 4-12A Recent subsidence in the central San Joaquin Valley near El Nido between January 2007 and March 2011 ............................................................................ 37
Figure 4-12B Graph showing elevation changes computed from repeat geodetic surveys along Highway 152 for 1972–2004 .................................................................... 38
Figure 4-12C Graph showing elevation changes computed from repeat geodetic surveys along the Delta-Mendota Canal for 1935–2001 .................................................. 38
Figure 4-13 Proposed alternative alignments of the Merced to San Jose section of California high-speed rail line pass through the newly subsiding areas south of El Nido, near where Highway 152 crosses the San Joaquin River................... 39
Figure 4-14 Location map of Central Valley Project, State Water Project and private canals ................................................................................................................. 41
Topic: Groundwater Land Subsidence from Groundwater Use in California
CA Water Plan Update 2013 Vol 4 Reference Guide Page 8

APRIL 2014 REPORT OF FINDINGS Land Subsidence from Groundwater Use in California
LSCE, BORCHERS AND CARPENTER vii
Figure 4-15 Delta Mendota Canal at Russell Road bridge north from Mendota, CA, looking downstream. Raised wing walls prevent water from overtopping Russell Avenue .................................................................................................. 42
Figure 4-16 Delta Mendota Canal at Athena Road north from Mendota, CA, downstream is to the left. The bridge has experienced a substantial loss of clearance as the land subsided ................................................................................................ 42
Figure 4-17 Raised canal linings and embankments upstream from Russell Avenue remediated the water-ponding effect of land subsidence ..................................... 43
Figure 4-18 Ruptured lining of the Delta Mendota Canal in the subsiding area about 0.6 miles upstream from the Russell Avenue bridge ................................................. 43
Figure 4-19 Desilting the Outside Canal and raising embankments remediated subsidence downstream from Russell Avenue .................................................... 44
Figure 4-20 Importing fill material to raise embankments in subsided areas of the Outside Canal .................................................................................................... 44
Figure 4-21 Outside Canal at Russell Road, north from Mendota looking generally upstream. The Russell Avenue bridge has been deemed a hazardous structure by the Fresno County Road Department............................................... 45
Figure 4-22 Well casings protruding from land surface just south from El Nido .................... 45
Figure 4-23A Elevation change measured by GPS surveys in Yolo County in 1999 and 2008 ................................................................................................................... 50
Figure 4-23B Location of intact wells and wells damaged by land subsidence, of the Woodland extensometer (11N01E24Q008M), and selected physical features in the southwestern Sacramento Valley .............................................................. 50
Figure 4-24A Well casings damaged by vertical compression during land subsidence in the Sacramento Valley: rippling of perforated steel casing during early stages of compression ........................................................................................ 50
Figure 4-24B Well casings damaged by vertical compression during land subsidence in the Sacramento Valley: deformation and ripping of slotted steel casing 400 feet below land surface ............................................................................................. 50
Figure 4-24C Well casings damaged by vertical compression during land subsidence in the Sacramento Valley: crumpled vertical ribbing of the stainless steel well screen 207 ft below land surface produces a radiating effect ......................................... 50
Figure 4-25 Land Subsidence in Antelope Valley during 1930-1992 ..................................... 53
Figure 4-26 Drainage channels (collectively called desert flowers) caused by erosion of playa sediments when floods carry sediment to an earth fissure on Rogers Lake bed at Edwards Air Force Base .................................................................. 53
Topic: Groundwater Land Subsidence from Groundwater Use in California
CA Water Plan Update 2013 Vol 4 Reference Guide Page 9

APRIL 2014 REPORT OF FINDINGS Land Subsidence from Groundwater Use in California
LSCE, BORCHERS AND CARPENTER viii
Figure 4-27A Subsidence in the Antelope Valley, California during 1993-1994 from computer modeling (white contours) and an InSAR interferogram during the same period. ....................................................................................................... 54
Figure 4-27B Period of the interferogram shown on a plot of water levels and aquifer compaction measured at the Holly extensometer site at Edwards
Air Force Base ................................................................................................... 54
Figure 4-28 Earth fissure associated with land subsidence caused by groundwater pumping in Fremont Valley, California, March 1978 ........................................................ 56
Figure 4-29 Earth fissure near the southeast edge of Lucerne Lake playa in the Mojave Desert, California. View is to the northeast, with a five-gallon bucket for scale ................................................................................................................... 57
Figure 4-30 Stacked and kriged interferogram in the Coachella Valley, California for June 27, 1995-September 19, 2010 (excludes November 8, 2000–November 30, 2003), showing areas of subsidence, geologic features, and GPS monitoring network components. ......................................................................................... 60
Figure 4-31 Terrain and InSAR image of Los Angeles and Santa Ana Basin shown as a location map for Figures 4-32 A, B, C, D, and E ................................................ 62
Figure 4-32A Subsidence and uplift of land surface along profile A-A’ in response to seasonal deformation during April 1998-May 1999 ............................................ 63
Figure 4-32B Interferogram east from Long Beach shows that groundwater flow is impeded by a groundwater barrier nearly coincident with the Newport-Englewood Fault (May-September 1999) ........................................................... 63
Figure 4-32C Interferogram shows long-term subsidence (October 1993-October 1998) in most of the Santa Anna basin ............................................................................. 63
Figure 4-32D Interferogram showing subsidence at the Beverly Hills Oil Field during October 1993-October 1998 ............................................................................... 64
Figure 4-32E Interferogram showing subsidence near Pomona-Chino during 1993-1995 ......... 65
Figure 4-33 Interferogram during January 1996-April 2000, showing subsidence bounded by faults and earth fissures in Chino. Differential subsidence across the San Jose Fault and Central Avenue Fault is visible ....................................... 65
Figure 4-34 Interferogram of the Paso Robles area showing four areas of likely subsidence during March 28-August 15, 1997 .................................................... 66
Figure 4-35A Subsidence in the Oxnard Plain and Pleasant Valley, Santa Clara-Calleguas groundwater basin, California, geographic features ............................................ 69
Topic: Groundwater Land Subsidence from Groundwater Use in California
CA Water Plan Update 2013 Vol 4 Reference Guide Page 10

APRIL 2014 REPORT OF FINDINGS Land Subsidence from Groundwater Use in California
LSCE, BORCHERS AND CARPENTER ix
Figure 4-35B Subsidence in the Oxnard Plain and Pleasant Valley, Santa Clara-Calleguas groundwater basin, California, subsidence profile .............................................. 69
Figure 4-35C Subsidence in the Oxnard Plain and Pleasant Valley, Santa Clara-Calleguas groundwater basin, California, subsidence of bench marks through time ............ 69
Figure 5-1 NGS Sites with vertical control .......................................................................... 75
Figure 5-2 Continuously Operating Reference Station (CORS) Network ............................ 77
Figure 5-3A Fordel extensometer, Mendota The 2″ pipe inside slip-jointed well casing is anchored in a concrete plug completed in the Corcoran Clay that underlies the aquifer sediments.......................................................................................... 81
Figure 5-3B Fordel extensometer, Mendota A dial indicator monitors the change in distance between the top of the 2″ pipe and the reference table (land surface). This records the amount of compaction in the aquifer sediments ........................ 81
Figure 5-4 Extensometers installed in the 1950s and 1960s, San Joaquin Valley ................. 87
Figure 5-5 Antelope Valley and Edwards Air Force Base Global Positioning System Networks ........................................................................................................... 92
Figure 5-6 Land subsidence monitoring network in the Chino Basin ................................... 95
Figure A-1 Collapse into the Old Brunswick Mine, Grass Valley, California ..................... A-1
Figure A-2 Plate tectonics of western North America ......................................................... A-2
Figure A-3 Alluvial aquifers, major areas of subsidence due to water level decline, oil and gas fields, locations of geothermal development, areas of hydrocompaction in the San Joaquin Valley, and the towns of Murietta, Hermosa Beach, and Fountain Valley in Orange County, California................. A-3
Figure A-4 Shade contours of subsidence in the Sacramento-San Joaquin Delta and the Delta pumping plant ......................................................................................... A-6
Figure A-5 Wind-whipped waves spilling over the levees on the north side of Jersey Island in the Sacramento-San Joaquin Delta December 3, 1983 ........................ A-7
Figure A-6 Concentric tension fissures and differential subsidence resulting from hydrocompaction at a 6-ft diameter corrugated infiltration test pit on the proposed alignment of the California Aqueduct, December 12, 1960 ............... A-8
Figure A-7 Flooding basin in Kern County, California, used to “presubside” sediments subject to hydrocompaction along the proposed route of the California Aqueduct ......................................................................................................... A-9
Topic: Groundwater Land Subsidence from Groundwater Use in California
CA Water Plan Update 2013 Vol 4 Reference Guide Page 11

APRIL 2014 REPORT OF FINDINGS Land Subsidence from Groundwater Use in California
LSCE, BORCHERS AND CARPENTER x
Figure A-8 Hydrocompaction damage to a canal test section in the west-central San Joaquin Valley ................................................................................................. A-9
Figure A-9 Map of oil and gas fields in the Los Angeles basin and southern San Joaquin Valley ............................................................................................................ A-13
Figure A-10 Subsidence over the Wilmington Oil Field, Long Beah, California during 1928-1974, in feet .......................................................................................... A-15
Topic: Groundwater Land Subsidence from Groundwater Use in California
CA Water Plan Update 2013 Vol 4 Reference Guide Page 12

APRIL 2014 REPORT OF FINDINGS Land Subsidence from Groundwater Use in California
LSCE, BORCHERS AND CARPENTER xi
List of Acronyms
AISH International Association of Hydrological Sciences ASCII American Standard Code for Information Interchange ASR Artificial Storage and Recovery AVEK Antelope Valley-East Kern Water Agency BARD Bay Area Regional Deformation BM Benchmarks Caltrans California Department of Transportation CCID Central California Irrigation District CHSRA California High-Speed Rail Authority CGPS Continuous GPS Sites CORS Continuously Operating Reference Station CSRC California Spatial Reference Center CVFED Central Valley Floodplain Evaluation and Delineation CWF California Water Foundation DIXN Dixon DMC Delta Mendota Canal DWR Department of Water Resources EAFB Edwards Air Force Base EDM Electronic Distance Measuring EIS Environmental Impact Statement GPS Global Positioning System GRACE Gravity Recovery and Climate Experiment GWMP Groundwater Management Plans HARNS High Accuracy Reference Network IASH International Association of Scientific Hydrology IBS Interbedded Storage InSAR Interferometric Synthetic Aperture Radar LACDPW Los Angeles County Department of Public Works LiDAR Light Detection and Ranging LSCE Luhdorff & Scalmanini, Consulting Engineers MODFLOW Modular Finite-Difference Flow Model NAD83 North American Datum of 1983 NASA/JPL Jet Propulsion Laboratory NAVD88 North American Vertical Datum of 1988 NGS National Geodetic Survey NGVD29 National Geodetic Vertical Datum of 1929 NSF National Science Foundation NSRS National Spatial Reference System NTC Fort Irwin National Training Center PBO Plate Boundary Observatory
Topic: Groundwater Land Subsidence from Groundwater Use in California
CA Water Plan Update 2013 Vol 4 Reference Guide Page 13

APRIL 2014 REPORT OF FINDINGS Land Subsidence from Groundwater Use in California
LSCE, BORCHERS AND CARPENTER xii
PMT Program Management Team PS Persistent Scatterer SAR Synthetic Aperture Radar SCVWD Santa Clara Valley Water District SCWA Solano County Water Agency SJRRP San Joaquin River Restoration Program SLDMWA San Luis Delta-Mendota Water Authority SOPAC Scripps Orbit and Permanent Array Center SSC Super-Conducting Super Collider SUB Subsidence and Aquifer System Compaction Package SWSD Semitropic Water Storage District USACE U.S. Army Corps of Engineers UNAVCO A Non-Profit University-Governed Consortium, Facilitates Geoscience Research
and Education Using Geodesy USBR U.S. Bureau of Reclamation USGS U.S. Geological Survey VCVL Vacaville WSD Water Storage District
Topic: Groundwater Land Subsidence from Groundwater Use in California
CA Water Plan Update 2013 Vol 4 Reference Guide Page 14

APRIL 2014 REPORT OF FINDINGS Land Subsidence from Groundwater Use in California
LSCE, BORCHERS AND CARPENTER ES-1
EXECUTIVE SUMMARY California’s groundwater is a vital resource for the state that provides water supplies for urban and rural areas, supports a large agricultural economy, and benefits fish and wildlife habitats and ecosystems. Groundwater meets about 40 percent of the state’s water demands in an average year (DWR, 2014). During droughts when surface supplies are limited, groundwater offers a critical buffer, providing a higher percent of the state’s water supply. In 2014, it is anticipated statewide groundwater use will be closer to 65 percent because of the critical nature of this year’s drought. Historically, groundwater has been pumped as needed in many areas of the state, often with little regard for the deleterious effects of over pumping. Over pumping is not sustainable in the long-term and can lead to a number of adverse consequences, including water-quality degradation; increased energy costs for groundwater pumping; costs for well deepening or replacement; impacts to nearby rivers and streams; and land subsidence. This report highlights the current and historical impacts of land subsidence in California due to groundwater pumping and makes recommendations for monitoring and assessment. This report confirms that land subsidence in California is not just a historical occurrence, but that it is an ongoing problem in many regions. The report presents key examples of significant historical subsidence and current active occurrences of subsidence, including the impacts and costs. There is no comprehensive land subsidence monitoring program in California. The information in this report was compiled from individual regional or local studies, which usually were initiated after substantial subsidence impacts had occurred. The most comprehensive evaluation of land subsidence in California occurred between 1954 and 1970, to assist with the construction of the state and federal water projects. Funding for this program ended when groundwater levels recovered after completion of the state and federal water projects. The lack of comprehensive subsidence monitoring has had costly consequences for the state. The California Water Foundation’s (CWF) vision is for California to meet its 21st century economic and ecological water needs sustainably. The CWF supports innovative projects and policies that address today’s water challenges, bringing together experts, stakeholders, and the public to achieve long-term, science-based solutions for the future. This report presents the following:
· Subsidence processes especially as related to groundwater extraction · Locations of areas subsiding as a result of groundwater extraction in California
Topic: Groundwater Land Subsidence from Groundwater Use in California
CA Water Plan Update 2013 Vol 4 Reference Guide Page 15

APRIL 2014 REPORT OF FINDINGS Land Subsidence from Groundwater Use in California
LSCE, BORCHERS AND CARPENTER ES-2
· Methods used to measure the magnitude of land subsidence and ground-surface deformation, and
· Recommendations related to sustainable groundwater management.
ES 1 Subsidence Resources Group
At the outset of the project, a Subsidence Resources Group was created to lend expertise and experience and provide input on document sources and this Report of Findings. The Subsidence Resources Group comprises 22 experts; 13 currently work for the U.S. Geological Survey, four work for the California Department of Water Resources (DWR), and five are retirees or former employees of these agencies. Most members of this group have contributed to articles and reports contained in the reference list. ES 2 Major Areas of Subsidence
Land subsidence has been discovered in many areas of the state, causing billions of dollars of damage. Impacts from subsidence fall into the following categories:
· Loss of conveyance capacity in canals, streams and rivers, and flood bypass channels; · Diminished effectiveness of levees; · Damage to roads, bridges, building foundations, pipelines, and other surface and
subsurface infrastructure; and · Development of earth fissures, which can damage surface and subsurface structures and
allow for contamination at the land surface to enter shallow aquifers. In many of these regions subsidence continues today, sometimes at nearly historically high rates of more than 1 foot/year (ft/yr). This report provides examples of current and historical subsidence pieced together from local or regional studies that were conducted by state, federal, or local agencies after subsidence was discovered to have dramatically deformed the land surface and/or caused significant infrastructure problems. Six major areas of subsidence in California are summarized below; additional details on these and other areas are provided in Section 4. Santa Clara Valley
o Subsidence in Santa Clara Valley, in the South San Francisco Bay Area, has required diking to prevent flooding from the bay; water well, and sanitary and storm sewer system repairs; modifications to roads, bridges, and stream channel levees, and other infrastructure construction and repair, translating to more than $756 million in damages.
o Between 1910 and 1995, downtown San Jose subsided 14 feet. o Santa Clara Valley has been successful in halting subsidence in the region by
implementing a monitoring program, importing surface water, artificially recharging groundwater, and regulating groundwater withdrawals.
Topic: Groundwater Land Subsidence from Groundwater Use in California
CA Water Plan Update 2013 Vol 4 Reference Guide Page 16

APRIL 2014 REPORT OF FINDINGS Land Subsidence from Groundwater Use in California
LSCE, BORCHERS AND CARPENTER ES-3
San Joaquin Valley o Subsidence from groundwater extraction in the San Joaquin Valley has been called the
greatest human alteration of the Earth’s surface. o By 1970, subsidence of more than 1 foot had affected 5,200 mi2—more than half of the
valley — and in some areas it had reached 28 feet. o Over the past decade, subsidence has been identified in two regions in the San Joaquin
Valley, including 3.94 feet during a 3½ year period near Corcoran, California. o Subsidence has caused major impacts to infrastructure and physical features, including
the San Joaquin River, Delta Mendota Canal, Friant-Kern Canal and San Luis Canal, as well as numerous privately owned canals and related infrastructure such as turnouts, bridges, pipelines, and storm sewers.
o These costs, add up to a total estimated cost of more than $1.3 billion during 1955-1972 (2013 dollars). Subsequent cost data are mostly unavailable.
Sacramento Valley
o Subsidence in the Sacramento Valley has resulted in wide scale destructive failure of steel groundwater well casings, making wells sometimes unusable.
o From the locations of damaged wells during a drought in 1976-1977, the subsidence appears to stretch from central Colusa County, through Yolo County, to Dixon in Solano County.
Antelope Valley
o Subsidence in Antelope Valley, east of Los Angeles, has been occurring for over 80 years. Increased pumping in the last 30 years due to population growth has accelerated the groundwater level declines to as much as 300 feet in some areas.
o Subsidence has adversely affected runways at Edwards Air Force Base and caused other negative consequences such as increased flooding and erosion; failed well casings; and damage to roads, homes, and other structures.
Coachella Valley
o Subsidence in Coachella Valley, in Riverside County, paused after importation of surface water began in 1949, but resumed in the 1970s as population and groundwater pumping increased.
o Earth fissures formed in 1948 and again recently. A subsidence study of a portion of the Coachella Branch of the All American Canal showed that the canal subsided as much as 1.35 feet from 1995 to 2010.
Topic: Groundwater Land Subsidence from Groundwater Use in California
CA Water Plan Update 2013 Vol 4 Reference Guide Page 17

APRIL 2014 REPORT OF FINDINGS Land Subsidence from Groundwater Use in California
LSCE, BORCHERS AND CARPENTER ES-4
Mojave River Basin Area o In the Mojave River Basin area, groundwater pumping resulted in groundwater-level
declines of more than 100 feet. Giant desiccation cracks, sink-like depressions, and earth fissures more than 3 feet wide and deep have made permanent scars on the landscape.
o A 1998 survey indicated 2 to 5 feet of subsidence occurred in Lucerne Valley. o Recent groundwater adjudication developed actions to stabilize the water levels of the
basin and manage groundwater pumping. As indicated in this report, alarming rates of subsidence continue to occur throughout California, causing impacts that can have lasting effects to property and the environment. This information is only being collected after the impacts from subsidence have occurred. The lack of a coordinated subsidence monitoring program, uniform monitoring procedures, and an ongoing data repository is causing significant irreversible impacts and costs to many regions and the state.
ES 3 Recommendations
This report proposes recommendations to help California address the ongoing economic and environmental impacts associated with over extraction of groundwater and the resulting land subsidence. The recommendations are summarized below; a complete set of recommendations is contained in Section 7. Only by monitoring and evaluation of monitoring data can California avoid the potential costly impacts of land subsidence that have plagued the state in the past. This report presents the technically necessary and desirable measures. ES 3.1 Monitor Land Surface Elevation Changes and Compaction
Remote Surveillance and Analysis: InSAR and Continuous GPS
Interferometric Synthetic Aperture Radar (InSAR) provides the most cost efficient method to generate high-resolution land surface deformation information over large areas with high spatial detail. InSAR products provide detailed monitoring data and imagery that facilitate communicating the magnitude and extent of subsidence to the general public. Although the United States does not have a civilian radar satellite that can provide data for InSAR analysis, NASA and the Indian Space Agency are cooperating to construct and launch a SAR satellite this decade. All available SAR data covering unconsolidated aquifer systems in California should be acquired and analyzed to identify areas of potential aquifer compaction, especially in areas of critical infrastructure. Additionally, Continuous Global Positioning System (CGPS) data should be examined for likely deformation sources and correlated with InSAR results. New CGPS stations should be installed in areas of actual or potential subsidence.
Topic: Groundwater Land Subsidence from Groundwater Use in California
CA Water Plan Update 2013 Vol 4 Reference Guide Page 18

APRIL 2014 REPORT OF FINDINGS Land Subsidence from Groundwater Use in California
LSCE, BORCHERS AND CARPENTER ES-5
Ground Surveillance and Analysis: Surveying and Borehole Extensometry
Ground surveillance techniques are a critical component in identifying areas of subsidence, and are an important complement to remote techniques. Therefore, geodetic surveys should be correlated with InSAR and CGPS data and with groundwater-level data. Geodetic networks should be improved by upgrading and protecting geodetic monuments. Borehole extensometers provide important aquifer compaction data. The distribution of extensometers in groundwater basins and subbasins should undergo a comprehensive evaluation and abandoned extensometers should be refurbished in priority areas. New extensometers should be designed and installed to monitor likely compacting intervals in areas where InSAR, CGPS, surveying, or infrastructure effects indicate that subsidence is occurring, or where groundwater use is increasing. Extensometers should be paired with multi-depth monitoring wells (piezometers) and a CGPS installation. New and more economical methods of building extensometers should be tested and assessed. ES 3.2 Characterize Aquifer System and Monitor Groundwater Levels Declining groundwater levels can trigger permanent land subsidence; it is therefore important to monitor, compile, and interpret groundwater levels throughout the state. The collection and storage of groundwater-level data by all federal, state, and local entities should be coordinated and made publically available. The distribution of groundwater-level monitoring wells areally and vertically within the aquifer system should be assessed to identify locations where additional monitoring wells are needed to track changes in hydraulic head. In order to make groundwater level monitoring measurements meaningful, and to use these measurements to understand the response of the aquifer system to natural factors (e.g., precipitation and droughts), imposed factors (e.g., pumping and artificial recharge) and the potential for land subsidence, requires that the construction of monitored wells and the distribution of fine-grained sediments be understood in the context of the aquifer system. Subsurface lithology used to characterize the aquifer system can be obtained from a variety of sources; the most prevalent form of this information is well completion reports submitted by drilling contractors. Although these reports vary greatly in the quality of information recorded, they capture subsurface information that is critical to understanding the relationships between measured groundwater levels and the subsurface location and thickness of clayey layers susceptible to compaction. Standards should be established for drillers to report well locations as GPS-determined latitude and longitude or other horizontal coordinate system. ES 3.3 Collect, Store and Disseminate Data Data collection related to subsidence, and the interpretation of such information, is fragmented. It is critical to develop a state repository for subsidence-related information. Currently,
Topic: Groundwater Land Subsidence from Groundwater Use in California
CA Water Plan Update 2013 Vol 4 Reference Guide Page 19

APRIL 2014 REPORT OF FINDINGS Land Subsidence from Groundwater Use in California
LSCE, BORCHERS AND CARPENTER ES-6
collection, storage, dissemination, and reporting of the data required to monitor and evaluate land subsidence is dispersed among many federal, state, and local agencies. Coordinated data maintenance should be achieved to assure consistent procedures for the collection, storage, and availability of pertinent water-resources data. The Arizona Department of Water Resources (ADWR) has developed a land subsidence monitoring program (Conway, 2013) that could provide a model for implementing a statewide subsidence-monitoring program in California. Alternatively, regional coordination of these responsibilities and an ongoing repository for the storage and disbursement of these data would facilitate their efficient use by government agencies, water purveyors and their consultants, and the public. ES 3.4 Evaluate and Prioritize Subsiding Groundwater Basins If the above data were in available databases and archives, groundwater basins statewide could be more easily and consistently prioritized for subsidence-relevant planning. In priority basins, where subsidence has occurred or is likely to occur, a step-wise planning assessment and management program could proceed as follows:
· Evaluate historical groundwater-level monitoring information and establish augmented groundwater-level monitoring networks to fully characterize the aquifer system.
· Characterize land surface deformation in priority basins with InSAR techniques, follow-up with geodetic surveys in subsiding areas, and establish a network of CGPS stations to provide time-series data at critical points.
· Establish borehole extensometers and associated multi-level monitoring well arrays to measure compaction and hydraulic head in various depth intervals of the aquifer system and CGPS installations to measure total change in land surface elevation at each extensometer.
· Establish measurable basin management objectives (BMOs) that identify goals for groundwater levels, land-surface elevations, and rates of change of each to avoid amounts or rates of inelastic compaction judged to be inappropriate for efficient operation of local infrastructure. These BMOs could be implemented through pumping strategies, artificial recharge, conservation strategies, and other sustainable groundwater management alternatives.
Topic: Groundwater Land Subsidence from Groundwater Use in California
CA Water Plan Update 2013 Vol 4 Reference Guide Page 20

APRIL 2014 REPORT OF FINDINGS Land Subsidence from Groundwater Use in California
LSCE, BORCHERS AND CARPENTER 1
1 INTRODUCTION California’s groundwater is a vital resource for municipal, rural residential, agricultural, and commercial water users, and for the health of ecosystems and biological habitats. California’s groundwater resources are widespread and diverse. There are presently 431 delineated groundwater basins (24 of which are subdivided into a total of 108 subbasins to result in 515 groundwater systems) in ten hydrologic regions that underlie 40 percent of California. Groundwater meets about 40 percent of the state’s water demands in an average year (DWR, 2014). During droughts when surface supplies are limited, groundwater offers a critical buffer, providing a higher percent of the state’s water supply. In 2014, it is anticipated statewide groundwater use will be closer to 65 percent because of the critical nature of this year’s drought. In many basins, groundwater is the principal source of supply, especially during droughts. In 2000, California accounted for approximately 18 percent of the total groundwater withdrawals in the United States (Hutson et al., 2004). Population projections estimate growth to about 48 million people in 2020, an increase of about 14 million people relative to 2000. Groundwater overdraft currently is estimated to occur at the rate of about 1 to 2 million acre-feet per year (DWR, 2003). Nonetheless, a comprehensive assessment of overdraft in the state’s groundwater basins has not been conducted since 1980, and “information is insufficient in many basins to quantify overdraft that has occurred, project future impacts on ground water in storage, and effectively manage ground water” (DWR, 2003). Essentially, future groundwater availability in the state is not well understood. Chronically declining groundwater levels associated with depletion of groundwater resources can lead to a number of adverse consequences, including saltwater intrusion or other water quality degradation; reduced groundwater storage, availability and reliability; increased energy costs; facilities costs such as for well deepening or replacement; streamflow depletion; environmental effects; and land subsidence. This Report of Findings focuses on land subsidence, and particularly on subsidence in California related to groundwater use. Land subsidence is a complex subject, and this report provides some background on the topic before presenting an overview of the processes, occurrence, measuring and monitoring, and broader implications of subsidence. Managing aquifer systems requires understanding changes in groundwater storage in saturated sediments or rock. Key components of tracking and understanding changes in groundwater storage include monitoring changing water levels (or potentiometric elevations) over time and, in areas susceptible to permanent subsidence, changes in aquifer storage capacity resulting from the compaction of the aquifer system itself. Senate Bill 1938 added monitoring (including subsidence) to the components to be included in Groundwater Management Plans (GWMP)
Topic: Groundwater Land Subsidence from Groundwater Use in California
CA Water Plan Update 2013 Vol 4 Reference Guide Page 21

APRIL 2014 REPORT OF FINDINGS Land Subsidence from Groundwater Use in California
LSCE, BORCHERS AND CARPENTER 2
(Water Code 10753.7(a)(1)); therefore, agencies seeking state funding must necessarily address monitoring for permanent and nonrecoverable (inelastic) land subsidence. According to the U.S. Geological Survey, land subsidence is a phenomenon found across the United States, affecting the land surface of over 17,000 square miles in 45 states (Galloway et al., 1999). The principal causes of land subsidence in general are aquifer system compaction, drainage of organic soils, compaction of hydrocarbon reservoirs, underground mining, hydrocompaction, natural compaction, sinkholes, and thawing permafrost. Most subsidence in the United States is a result of groundwater exploitation, and the increasing development of land and water resources threatens to worsen existing land-subsidence issues and initiate new ones (Galloway et al., 1999). Land subsidence caused by compaction of aquifer systems is often overlooked as a potential hazard and an environmental consequence of groundwater withdrawal. Some of the more costly consequences include damage to engineered structures, including buildings, roadways, pipelines, aqueducts, levees, sewerages, and well casings (Hoffmann et al., 2003), as well as increases in flood risk and associated remediation. Land subsidence in California is commonly a result of fluid withdrawal (oil or groundwater). As described in this report, significant subsidence has occurred historically in the San Joaquin Valley and elsewhere in California. However, recent observations of subsidence in the San Joaquin Valley are unanticipated and alarming.
1.1 Report Organization and Resources
The California Water Foundation’s (CWF) vision is for California to meet its 21st century economic and ecological water needs sustainably. The CWF supports innovative projects and policies that address today’s water challenges, bringing together experts, stakeholders, and the public to achieve long-term, science-based solutions for the future. The CWF communicates science-based facts on issues related to groundwater extraction, including land subsidence. This report presents the following:
· Subsidence processes especially as related to groundwater extraction · Locations of areas subsiding as a result of groundwater extraction in California · Methods used to measure the magnitude of land subsidence and ground-surface
deformation, and · Recommendations related to sustainable groundwater management.
The lack of a coordinated state-wide land subsidence monitoring program, and an accessible data repository, which are essential to the assessment of subsidence, and the lack of funding to support technical synthesis and evaluation of data and remotely sensed imagery, point to a real need to address an ongoing problem that has immense implications for the state of California.
Topic: Groundwater Land Subsidence from Groundwater Use in California
CA Water Plan Update 2013 Vol 4 Reference Guide Page 22

APRIL 2014 REPORT OF FINDINGS Land Subsidence from Groundwater Use in California
LSCE, BORCHERS AND CARPENTER 3
Recommendations are presented relating to current and future land surface monitoring and assessment needs. 1.1.1 References In support of several tasks associated with CWF’s interests in land subsidence, Luhdorff & Scalmanini, Consulting Engineers in association with James Borchers and Michael Carpenter (LSCE Team) with contributions from our Subsidence Resources Group (described below) prepared the list of key references in this report, including the references cited as well as many others. During a preliminary review of published literature relating to subsidence, it was found that there is no single compilation of historical and active occurrences of subsidence in California. This report, although not an exhaustive detailing of every occurrence of groundwater extraction-related subsidence in California, brings together key examples of significant historical subsidence and active occurrences, including those reported in just-published reports by the U.S. Geological Survey. It also provides examples obtained through personal communications with others in the geotechnical community, including the specially assembled Subsidence Resources Group acknowledged in this report. The examples presented in this report identify the impacts and historical costs of such subsidence. The reference list contains key citations for published and unpublished materials that describe the geographic locations of subsidence and processes that contribute to subsidence in California. Most citations relate to land subsidence resulting from withdrawal of groundwater from subsurface materials by water wells. Several citations describing other processes that cause land subsidence include: failure of natural or man-made underground cavities (solution voids, piping cavities, and engineered openings such as mines), tectonic activity, natural settling of sedimentary materials, oxidation of organic soils (peaty deposits), hydrocompaction (collapse of moisture deficient sediments upon wetting), energy development, and hydrocarbon extraction. Investigation of subsidence in areas where groundwater is pumped must also consider the potential contributions to land subsidence from these other processes. The reference list comprises primarily articles and reports that have been published in government reports, scientific journals, and proceedings of technical meetings. Active web site links are included as available. A few reports by consultants or students are also listed. Published abstracts of oral presentations at technical meetings are included in the list where they address either geographic locations or subsidence processes that are not well-reported in the more traditional literature. Articles describing damage to infrastructure in subsiding areas and legal and regulatory issues are included.
Topic: Groundwater Land Subsidence from Groundwater Use in California
CA Water Plan Update 2013 Vol 4 Reference Guide Page 23

APRIL 2014 REPORT OF FINDINGS Land Subsidence from Groundwater Use in California
LSCE, BORCHERS AND CARPENTER 4
1.1.2 Subsidence Resources Group At the outset of the project, a Subsidence Resources Group was created to lend expertise and experience, provide input on document sources, and assist with subsequent tasks, including this Report of Findings. The Subsidence Resources Group comprises 22 experts; 13 currently work for the U.S. Geological Survey, four work for the California Department of Water Resources, and five are retirees or former employees of these agencies. Most members of this group have contributed to articles and reports contained in the reference list.
Topic: Groundwater Land Subsidence from Groundwater Use in California
CA Water Plan Update 2013 Vol 4 Reference Guide Page 24

APRIL 2014 REPORT OF FINDINGS Land Subsidence from Groundwater Use in California
LSCE, BORCHERS AND CARPENTER 5
2 SUBSIDENCE PROCESSES IN CALIFORNIA In California, land subsidence primarily occurs as a result of groundwater extraction, but can also result from collapse of underground cavities, tectonic activity, natural consolidation of sediment, oxidation and compaction of organic deposits, hydrocompaction of moisture deficient soil and sediments, development of geothermal energy, and extraction of hydrocarbons. Land subsidence resulting from groundwater extraction is the primary focus of this report. However, it is important to recognize the potential effect of other processes. Subsidence processes other than those related to groundwater extraction are described in Appendix A, and some examples of the significance of other contributing factors are provided below. Tectonic forces influence all of California. Consequently, it is necessary to consider their effect on land surface elevation both in subsiding areas and in elevated bedrock areas used for reference elevations when evaluating subsidence in alluvial basins. Gas and oil wells produce hydrocarbons and saline formation water from sedimentary rocks and deposits that are usually deep in the subsurface. Because aquifers that provide groundwater often overlie hydrocarbon reservoirs, distinguishing subsidence resulting from hydrocarbon extraction from that resulting from pumping groundwater can be difficult. Understanding the location and production history of both hydrocarbon reservoirs and aquifers, and obtaining measurements of compaction over discrete subsurface intervals, are important in order to evaluate the deformation caused by each source. Lofgren (1975) evaluated land subsidence caused by groundwater extraction in areas underlain by oil and gas fields in the Arvin-Maricopa area of the southern San Joaquin Valley. Comparing the elevation changes at surveying monuments (bench marks) directly overlying the oil and gas fields to elevation changes noted in surrounding agricultural areas, he suggested that only the component of subsidence in the oil fields that exceeded subsidence in adjacent agricultural areas was caused by oil and gas extraction. He concluded that subsidence in oil fields was of little concern compared to subsidence related to groundwater extraction, although conceding that only a small part of the oil production, and therefore the consequent subsidence, occurred during the period of available leveling measurements. Subsidence caused by groundwater extraction has reportedly damaged the steel casings of oil and gas wells located near the San Joaquin River west from Fresno, California (Glenn Muggelberg, California Division of Oil, Gas, and Geothermal resources, oral commun., September 17, 2013). Measuring compaction over appropriate subsurface intervals is the only way to conclusively discriminate which compacting process has contributed to subsidence measured at the land surface.
Topic: Groundwater Land Subsidence from Groundwater Use in California
CA Water Plan Update 2013 Vol 4 Reference Guide Page 25

APRIL 2014 REPORT OF FINDINGS Land Subsidence from Groundwater Use in California
LSCE, BORCHERS AND CARPENTER 6
3 EXTRACTION OF GROUNDWATER FROM THE SUBSURFACE A balance occurs naturally in an undeveloped aquifer system where recharge mechanisms and discharge mechanisms of groundwater are equal (Figure 3-1). Pumping for urban or agricultural uses changes the balance of the system and may lead to land subsidence (Galloway et al., 1999). Aquifer systems experience some degree of deformation in response to changes in stress (additions such as recharge or withdrawals such as groundwater pumping). The seasonal cycle of discharge and recharge from unconsolidated heterogeneous aquifer systems like those underlying many locations in the Central and San Joaquin Valleys typically causes measurable elastic (recoverable) land subsidence and proportionate uplift (measured in millimeters to centimeters) of the land surface. Removing water from storage in fine-grained silts and clays that are interbedded in the aquifer system can cause these highly compressible sediments to compact inelastically and permanently. Land subsidence from inelastic (non-recoverable) compaction is a common consequence of the significant groundwater level changes that can result from developing groundwater as a water resource.
Figure 3-1. An undeveloped aquifer system in balance (adapted from Galloway et al., 1999)
When evaluating land subsidence from groundwater extraction it is important to understand the subsurface distribution and thickness of coarse (sand and gravel) and fine (silt and clay)-grained sediments and the aquifer units that are used by municipal, agricultural, and other wells for groundwater production. The geologic setting, combined with pumping records and the measured physical response of the aquifer system to pumping, are keys to analyzing subsidence. Section 3.2 describes the mechanisms associated with land subsidence in response to groundwater extraction.
Groundwater
Topic: Groundwater Land Subsidence from Groundwater Use in California
CA Water Plan Update 2013 Vol 4 Reference Guide Page 26

APRIL 2014 REPORT OF FINDINGS Land Subsidence from Groundwater Use in California
LSCE, BORCHERS AND CARPENTER 7
3.1 Unconsolidated Aquifer Systems
Aquifer-system compaction caused by groundwater pumping and extensive water-level declines is responsible for most subsidence in the state and has been observed for decades in the Santa Clara, San Joaquin, Sacramento, Antelope Valleys, and elsewhere. In other instances, it may be an unrecognized or overlooked consequence of groundwater development in alluvial basins. The reduction of fluid pressure in the pores and cracks of aquifer systems, especially unconsolidated sediments, is inevitably accompanied by some deformation of the aquifer system. The physical process is similar to that occurring in oil and gas fields (Appendix A). Unconsolidated sediments composing an aquifer system in an alluvial basin often are sorted into layers of similarly sized particles, i.e., gravel, sand, silt, and clay (Figure 3-2). The degree of sorting and layer physical dimensions, from thick and extensive to thin and discontinuous, affect the ability of an aquifer system to store and transmit water. Water moves most easily through permeable coarse-grained deposits of sand and gravel and much more slowly through finer-grained deposits of silt and clay. The fine-grained silt, silty-clay, and clay units typically are “aquitards” that can confine and separate groundwater flowing through coarser-grained aquifers that underlie or overlie them. Thick and extensive aquitards are effective confining units within an aquifer system (Figure 3-3). Aquifers often contain thinner and discontinuous aquitards. The arrangement of these elements of an aquifer system determines the bulk hydraulic and mechanical properties that govern how it responds to stresses imposed by extraction of groundwater.
Figure 3-2. Land subsidence due to compaction of fine-grained material after fluid extraction. (adapted from Sneed and Galloway, 2000)
Topic: Groundwater Land Subsidence from Groundwater Use in California
CA Water Plan Update 2013 Vol 4 Reference Guide Page 27

APRIL 2014 REPORT OF FINDINGS Land Subsidence from Groundwater Use in California
LSCE, BORCHERS AND CARPENTER 8
Figure 3-3. An aquifer system susceptible to compaction that results in land subsidence. Release of water from aquitards, both clayey confining units and clayey interbeds, causes a reduction in thickness of these compressible sediments. Water levels in wells screened in confined aquifers are higher than the upper surface of the aquifer (Figure 3-3).1 If thin and sometimes discontinuous aquitard layers are numerous, confinement of water flowing through aquifer units increases with depth in the aquifer system. If saturated permeable deposits are not overlain by confining aquitards, they are termed unconfined and are open to the atmosphere via the unsaturated zone, and to direct infiltration from the land surface. 3.2 Elastic and Inelastic Deformation
The weight of materials overlying an aquifer (the rocks and sediments, water, soil, vegetation, and structures on the land surface) is borne within an aquifer system by both the water in the pore spaces and by the clay, silt, sand, and gravel that form the granular mineral skeleton of the aquifer. When pumping lowers groundwater levels and thus fluid pressure in the pores (pore pressure), the weight of overlying materials must be increasingly supported by the mineral skeleton of the aquifer. Increased pressure or stress on the mineral grains (effective stress) exactly balances the support lost by decreased pore pressure. Increased effective stress causes some compression of the aquifer system skeleton and, if the stresses are large enough, some rearrangement of mineral grains and compaction of the aquifer system. The aggregate result of aquifer-system compaction 1 The term artesian is sometimes used as an adjective to refer to a confined aquifer.
Topic: Groundwater Land Subsidence from Groundwater Use in California
CA Water Plan Update 2013 Vol 4 Reference Guide Page 28

APRIL 2014 REPORT OF FINDINGS Land Subsidence from Groundwater Use in California
LSCE, BORCHERS AND CARPENTER 9
within the full thickness of the system is expressed as subsidence at the land surface. It is well known that extraction of groundwater by pumping wells causes a complex three-dimensional deformation of an aquifer system (Galloway and Burbey, 2011). However, because of its conceptual simplicity and wide application to accurately describe subsidence measured in in California and throughout the world, one-dimensional vertical compaction discussed here is used to illustrate land subsidence processes throughout this report. Aquifer-system deformation can be fully reversible (elastic) or largely permanent (inelastic). Elastic deformation occurs when sediments compress as pore pressure decreases, and expand equally as pore pressure increases. The consequent cycles of subsidence and rebound of the land surface commonly occur seasonally, coincident with cyclic groundwater discharge and recharge. The elastic compressibility of clayey aquitards typically is several times larger than that of coarser-grained aquifers. Elastic deformation does not permanently alter the water storage properties of an aquifer, that is, the same volume of water can be stored in an aquifer after many cycles of solely elastic compression and expansion. The magnitudes of elastic subsidence and rebound are equivalent and typically small, ranging from about 2 x 10⁻⁶ to 8 x 10⁻⁶ feet of subsidence (or rebound) per foot of aquifer-system thickness per foot of hydraulic head change (the terms “hydraulic head”, “water level” and “pore pressure” are used interchangeably here). For example, 0.25 feet of reversible subsidence would result from a hydraulic head decline of 100 feet in a 500-foot-thick aquifer system with an average elastic compressibility. If the water-level decline occurred over a large area a large but shallow (0.25 ft-deep) subsidence bowl would form at the land surface. The bowl would disappear when water-levels recovered and land surface rebounded. The rebound occurs because the aquifer system has not been permanently reconfigured into a denser, more closely packed arrangement. Neglecting the time it takes for water to drain from aquitards (Section 3.3), because they are more elastically compressible than coarser-grained parts of the aquifer system, they can elastically yield and then regain, should water levels rise, more groundwater than coarser-grained aquifer sand and gravel units. Permanent compaction results only when the sediments are compressed inelastically beyond their previous maximum effective stress (preconsolidation stress). The preconsolidation stress, the effective stress threshold at which inelastic compaction begins, generally is exceeded when groundwater levels decline past historical low levels. In these stress ranges, the materials compress inelastically, and the inelastic compaction and consequent land subsidence are largely permanent and irreversible. Because clay (particularly montmorillonite) and diatomaceous deposits (materials that contain a high percentage of the siliceous skeletal remains, or frustules of phytoplankton) are often highly compressible and subject to rearrangement of the grains, depressurization results in more compaction and subsidence than depressurization of less compressible, coarser-grained deposits of sand and gravel. In fact, inelastic compaction of
Topic: Groundwater Land Subsidence from Groundwater Use in California
CA Water Plan Update 2013 Vol 4 Reference Guide Page 29

APRIL 2014 REPORT OF FINDINGS Land Subsidence from Groundwater Use in California
LSCE, BORCHERS AND CARPENTER 10
coarse-grained sediment generally is negligible unless very large decreases in pore pressure increase effective stress to levels that fracture mineral grains or crush diatom frustules as sometimes occurs in oil and gas fields (Appendix A). The inelastic compressibility of aquitards typically ranges from 20 to more than 100 times larger than their elastic compressibility. For example, in contrast to the earlier example for elastic subsidence, 20 feet of compaction and permanent land subsidence would ultimately result from 100 feet of hydraulic head decline beyond the preconsolidation stress in an aquifer system containing an aggregate 500-foot thickness of fine-grained, clay-rich sediments with a typical inelastic compressibility (4 x 10⁻⁴ feet of irreversible subsidence per foot of aquifer-system thickness per foot of head change). If the water-level decline occurred over a large area, a large 20 ft-deep subsidence bowl would form at the land surface. Except for a small amount of elastic subsidence and rebound (perhaps as much as 0.4 ft), the subsided area would remain a permanent feature of the land surface even when groundwater levels recovered to original values. The subsidence is permanent because clayey mineral grains in the aquifer system have been reconfigured into a denser, more closely packed arrangement.
3.3 Delayed Yield, Residual Compaction, and Water of Compaction
The relative timing of variations in hydraulic head and aquifer-system compaction is often complex. Because clay and other fine-grained sediments have low hydraulic conductivity (permeability), changes in hydraulic head are transmitted slowly through these materials. Typically, when pumping wells extract groundwater from aquifer systems, water in aquitards (confining units and clayey interbeds, Figure 3-3) moves slowly vertically outward toward adjacent depressured coarser-grained sediments that transport groundwater to wells. Although hydraulic heads in thin aquitards (1 to 3 feet) equilibrate relatively quickly to a pressure decline in adjacent aquifers, pore pressures in the middle of thick aquitards may take decades or centuries to equilibrate. The result of this delay is that the magnitude of subsidence is considerably less than would ultimately result if hydraulic head had equilibrated with the lowest water levels in adjacent aquifers. For example, if hydraulic head in thick aquitards at the area of maximum subsidence in the San Joaquin Valley had equilibrated with the lowest water levels in adjacent aquifers, it is likely that subsidence would be double the almost 30 feet measured (Riley, 1998). Compaction of thick aquitards can be hastened if the aquitards drain from both their upper and lower surface to depressured parts of the aquifer system, or if screened intervals in pumping wells intersect stringers of permeable sand that lie within them (Figure 3-3). The delay in drainage or delayed yield of groundwater from the middle of thick aquitards results in residual compaction that may continue long after water levels have stabilized in the aquifers. The unequal distribution of hydraulic head in these low permeability confining units leads to a complex vertical distribution of preconsolidation stress within them. It is likely that unequal distribution of preconsolidation stress in aquitards accounts for the rapid re-initiation of inelastic
Topic: Groundwater Land Subsidence from Groundwater Use in California
CA Water Plan Update 2013 Vol 4 Reference Guide Page 30

APRIL 2014 REPORT OF FINDINGS Land Subsidence from Groundwater Use in California
LSCE, BORCHERS AND CARPENTER 11
compaction in some areas of the Central Valley where temporarily recovered groundwater levels in permeable parts of the aquifer have more recently declined, though not below historical low levels (Borchers et al., 1999). Similarly, residual compaction measured during winters in the 1990s after water levels in wells at Edwards Air Force Base in Antelope Valley, California recovered from summer pumping is likely caused both by the lingering effects of seasonal drawdown on the aquifer system and the ongoing long-term effects of delayed yield from thick, slowly draining aquitards still responding to large water-level declines between 1950 and 1975 (Sneed and Galloway, 2000). Confining units are often thicker than the permeable units of the aquifer system, so although the permeabilities of aquitards are low, their storage capacities can be very high. Freeze and Cherry (1979) provide important insight to the long-term relationship between pumping and the release of water from the aquifer and confining units (aquitards), which may result in inelastic compaction:
“In the very early pumping history of a production well, most of the water comes from the depressurization of the aquifer in which the well is completed. As time proceeds the leakage properties of the aquitards are brought into play and at later times the majority of the water being produced by the well is aquitard leakage2. In many aquifer-aquitard systems, the aquitards provide the water and the aquifers transmit it to the wells. It is thus of considerable interest to be able to predict the response of aquitards as well as aquifers.”
In overpumped, confined aquifer systems, water provided during inelastic compaction of aquitards (water of compaction) typically amounts to between 10 and 30 percent of the total volume of water pumped (Riley, 1969). The volume of the permanently subsided region is equal to the volume of storage space lost, which is equivalent to the volume of water of compaction. When water of compaction is removed, the pore space that it occupied is reduced. However, this does not mean that the nonrecoverable compaction constitutes substantial structural damage to an aquifer system. The hydraulic conductivity (permeability) of aquitards is reduced by inelastic compaction but the notion that subsidence collapses aquifers and destroys usable storage space for water is a misrepresentation of the physical process. This space in the aquitards was never available for cyclic storage of groundwater. A published quotation from Joseph Poland, in answer to a question raised about inelastic compaction after his presentation at the 1969 IASH/AISH land subsidence symposium in Tokyo, Japan, states this concept simply: “…as far as the aquifers themselves are concerned (the permeable beds), there has been very little compaction, so that the usable storage capacity of the aquifer system is affected very little by this actual subsidence” (Poland, 1969, p.294). A key aspect of Poland’s statement is his use of the 2 Leakage includes water derived from inelastic compaction in the aquitard and also water moving vertically through confining units from adjacent aquifers.
Topic: Groundwater Land Subsidence from Groundwater Use in California
CA Water Plan Update 2013 Vol 4 Reference Guide Page 31

APRIL 2014 REPORT OF FINDINGS Land Subsidence from Groundwater Use in California
LSCE, BORCHERS AND CARPENTER 12
word ‘usable’, which is intended to describe cyclically reusable storage space in an aquifer system. Water managers may need to take a long-term perspective with regard to economic issues created by inelastic compaction of thick confining units. For example, after an initial period of inelastic compaction and subsequent water-level recovery, extracting an identical amount of water during a second pumping cycle will result in lower water levels than during the first cycle of pumping. During the second pumping cycle, less water is stored in aquitards because of previous compaction. Additionally, previous compaction decreases the vertical hydraulic conductivity in the aquitard making it more difficult for water to be released. Lowering water levels further to produce the same volume of water initially retrieved will induce additional inelastic compaction and additional, permanent land subsidence. This pattern repeats until hydraulic head throughout the confining units equilibrates with that in more permeable parts of the aquifer system. Effectively though, in the lifetime of a water manager, there will be no equilibration for affected systems with thick confining units. The manager will have to contend with inelastic compaction each pumping cycle. The energy expended and the pumping costs to lift groundwater to the surface will increase as water levels drop farther during each pumping cycle. Wells with damaged casings will have to be repaired and most likely replaced. In California, loss of capacity in water conveyance facilities such as canals, streams and rivers, flood bypass channels and the loss of effectiveness of levees are other expensive consequences of subsidence that have to be remediated. Damage to roads, bridges, building foundations, pipelines, and other surface and subsurface infrastructure may result in exposure to liability claims. Moreover, the development of earth fissures can accompany the subsidence and damage surface and subsurface structures and also provide conduits for sources of contamination at the land surface to shallow aquifers, further degrading the resource. Water of compaction is available only once – beginning when the aquifer system experiences historically low water levels. Riley (1998) described this as follows:
“The water released by inelastic compaction represents ground-water mining in the truest sense of the term-- a one-time exploitation of a nonrenewable resource, unusable if not mined but accessible only at the cost of the significant and in some cases unacceptable environmental impact.”
Water of compaction is akin to a sequestered inheritance, such as a chest of rare coins buried deeply out of sight. It is not invested, so it gathers no interest although its value can fluctuate with market forces and the costs to retrieve it. It is only available once, so its expenditure should be planned carefully. In California, water of compaction has supported a vibrant agricultural industry and expanding population. It can be argued, though, that its use has not been carefully planned; a legacy of aquifer-system compaction, land subsidence, and unanticipated deleterious
Topic: Groundwater Land Subsidence from Groundwater Use in California
CA Water Plan Update 2013 Vol 4 Reference Guide Page 32

APRIL 2014 REPORT OF FINDINGS Land Subsidence from Groundwater Use in California
LSCE, BORCHERS AND CARPENTER 13
effects on surface and subsurface infrastructure has resulted. These impacts are discussed later in this report.
3.4 Earth Fissures
Earth fissures are long curvilinear cracks in unconsolidated alluvial basins that have undergone groundwater depletion. In the western United States, earth fissures have occurred predominantly in California, Arizona, Nevada, New Mexico, and Texas. Holzer (1980) distinguished between earth fissures, which exhibit little evidence of vertical offset, and surface faults, which exhibit mostly vertical movement and are associated with known tectonic faults at depth. Earth fissures commonly occur around the periphery of basins where thickness of the aquifer system subjected to water-level decline varies laterally, resulting in differential vertical compaction of the aquifer system (Jachens and Holzer, 1982). Differential compaction means that the amount of compaction within an aquifer system differs significantly with location. Differential compaction results in different magnitudes of subsidence over short distances on the land surface. Other causes of differential compaction may include shallow buried bedrock away from the periphery of a basin, faults within the basin-filling sediments (Burbey, 2010) and fault-plane barriers to groundwater flow (Holzer, 1980). Differential subsidence results from lateral differences in thickness, compressibility or the amount of water-level decline within an aquifer system. (Figures 3-4A-D). Differential compaction also produces horizontal deformation of the land surface as sediments overlying an aquifer system in a fissure-prone area bend (Holzer, 2010).
Topic: Groundwater Land Subsidence from Groundwater Use in California
CA Water Plan Update 2013 Vol 4 Reference Guide Page 33

APRIL 2014 REPORT OF FINDINGS Land Subsidence from Groundwater Use in California
LSCE, BORCHERS AND CARPENTER 14
A
B
Topic: Groundwater Land Subsidence from Groundwater Use in California
CA Water Plan Update 2013 Vol 4 Reference Guide Page 34

APRIL 2014 REPORT OF FINDINGS Land Subsidence from Groundwater Use in California
LSCE, BORCHERS AND CARPENTER 15
C
D
Figure 3-4 A-D. Schematic of differential compaction settings for earth fissures. A) Wells pumping near a substantial change in the thickness of compressible aquifer materials at a basin-bounding fault trigger fissuring. B) High total compaction in thick sediments triggers fissuring where sediments are thin over a buried bedrock high. C) Fissure forms where less compressible sand and gravel transition to highly compressible clay and silt. D) Sediments are uniformly compressible, but a fissure forms where a fault barrier prevents groundwater from flowing toward pumping wells.
Topic: Groundwater Land Subsidence from Groundwater Use in California
CA Water Plan Update 2013 Vol 4 Reference Guide Page 35

APRIL 2014 REPORT OF FINDINGS Land Subsidence from Groundwater Use in California
LSCE, BORCHERS AND CARPENTER 16
Some earth fissures have occurred in the absence of measured differential compaction although differential compaction may or may not have been present. Other hypotheses include piping erosion (Fletcher et al., 1954), brittle vertical rupture of a rigid aquifer slab at the buried bedrock edge of a basin-bounding fault (Bouwer, 1977), horizontal seepage stresses (Lofgren, 1971), and an effective hydraulic stress (Helm, 1994a), that includes a total or bulk stress and the negative of Lofgren’s seepage stress, which acts to move aquifer-system sediments horizontally toward pumping centers and which may not be associated with differential vertical compaction. Earth fissure zones may be as much as 200 m (600 ft) wide and consist of multiple parallel, branching, or en echelon (stepped offset) fissures and graben (downdropped) blocks. Where fissure initiation has been observed, fissures formed first as hairline cracks on the land surface and widened during storms. Fissures may open by collapse to a width of as much as 6 m (20 ft) and depth of as much as 9 m (30 ft). Fissures may propagate by extension or may continue to widen without apparent lengthening. A continuous record of extensional movement across one fissure showed that more than 25 mm (1 in) of tensile opening occurred in less than 16 hr during the passage of the remnant of a hurricane. Several major fissure openings have occurred during severe storms as water floods into a crack at the land surface, dissolves cementing materials in the desert soils, erodes sediments, and builds up more than 10 to 20 m (30 to 60 ft) of hydraulic head (water level), causing hydraulic fracturing. Because of the paucity of information describing deformation of the sediments below land surface, it cannot be stated with certainty, whether fissures form at land surface and propagate downwards, form at depth and propagate upward or if propagation direction is dependent on the particular physical process causing fissuring (Holzer, U. S. Geological Survey, oral commun. January 17, 2014). The Picacho earth fissure in south-central Arizona may be the most thoroughly studied fissure in the world. It was visible in the Super Bowl Chevrolet Cobalt commercial in 2012 (Figure 3-5). The fissure marks the location of a Basin and Range dip-slip (vertical movement) fault that horizontally juxtaposes alluvium of different compressibilities. The Picacho earth fissure opened after an earthquake in 1927, before major groundwater pumping began in that basin, but major vertical offset began with increased pumping after WWII. The fissure is 16 km (10 mi) long, has a depth of 300 m (1,000 ft) as a dip-slip (vertical displacement) fault, and exhibits parallel fissures 200 m (600 ft) apart in some sections. Since World War II, the fault has not been tectonically active; the fissure has experienced more than 0.6 m (2 ft) of vertical offset in many places due to differential compaction of aquifer sediments. During 1980-1984, seasonal movements of 4 mm opening and 2 mm closing were correlated with 16 m (52 ft) of water-level decline and recovery, respectively. During that time 20 mm (0.8 in) of vertical offset occurred, with the basinward side downthrown.
Topic: Groundwater Land Subsidence from Groundwater Use in California
CA Water Plan Update 2013 Vol 4 Reference Guide Page 36

APRIL 2014 REPORT OF FINDINGS Land Subsidence from Groundwater Use in California
LSCE, BORCHERS AND CARPENTER 17
Figure 3-5. Picacho earth fissure in Superbowl 2012 Chevrolet Cobalt commercial. View is toward the south. Holes and cracks have occurred in the concrete lining and berm of the Central Main Lateral Canal where it crosses the fissure at the bottom of the photograph. Damage from earth fissures includes (typical fissures shown in Figure 3-6 and 3-7):
· cracked and offset streets, highways, and airport runways · railroad derailments · loss of field irrigation · erosional destruction and cracking of irrigation canals · forced rerouting of an aqueduct · cracked and condemned houses · utility disruption · groundwater contamination from surface pollutants.
Potential disasters from cracking include:
· explosions from cracked gas lines · explosions in sewer lines when methane is trapped because of changes in gradients · multi-car pileups on freeways because of a sudden, several centimeter (1 in) vertical
crack opening during passage of a tropical storm.
Topic: Groundwater Land Subsidence from Groundwater Use in California
CA Water Plan Update 2013 Vol 4 Reference Guide Page 37

APRIL 2014 REPORT OF FINDINGS Land Subsidence from Groundwater Use in California
LSCE, BORCHERS AND CARPENTER 18
Figure 3-6. Earth fissure, Harquahala Plain, Arizona, USA. (USGS photo)
Figure 3-7A. Earth fissure, Rogers Dry Lake at Edwards Air Force Base, California. (USGS photo)
Topic: Groundwater Land Subsidence from Groundwater Use in California
CA Water Plan Update 2013 Vol 4 Reference Guide Page 38

APRIL 2014 REPORT OF FINDINGS Land Subsidence from Groundwater Use in California
LSCE, BORCHERS AND CARPENTER 19
Figure 3-7B. Earth fissure, Edwards Dry Lake at Edwards Air Force Base, California. (USGS photo)
Topic: Groundwater Land Subsidence from Groundwater Use in California
CA Water Plan Update 2013 Vol 4 Reference Guide Page 39
APRIL 2014 REPORT OF FINDINGS Land Subsidence from Groundwater Use in California
LSCE, BORCHERS AND CARPENTER 20
4 SUBSIDENCE FROM GROUNDWATER EXTRACTION IN CALIFORNIA Groundwater extraction from nearly any aquifer will cause some degree of subsidence as aquifer materials adjust to new stresses. In fact, any change of groundwater levels from any cause, natural or human induced, will move the land surface up or down in response to expansion or compression of aquifer materials. Substantial and damaging subsidence from groundwater extraction in California is nearly always related to inelastic compaction in an aquifer system, and sometimes to differences in the magnitude of compaction over short lateral distances (differential compaction and subsidence). This section presents summaries of subsidence attributed to groundwater extraction (Figure 4-1). The summaries are organized by geographic location, and they range from an area that has been called the largest human alteration of the surface of the Earth’s surface, described in scores of scientific reports and scholarly articles, to small areas of minor subsidence that may not have been previously described in the scholarly literature.
4.1 Santa Clara Valley
The northern Santa Clara Valley, an alluvial lowland at the southern end of the San Francisco Bay, was the first area in the United States where land subsidence due to groundwater overdraft was recognized and described (Tolman and Poland, 1940). It is also the first area where remedial action effectively halted the subsidence caused by massive withdrawals of groundwater that supplied water first for agricultural development and later primarily for domestic and industrial uses. Ingebritsen and Jones (1999) described the history of water use and land development that precipitated land subsidence and later recovery of water levels in the aquifer system of the Santa Clara Valley. During the late 1800s, most wells in the central Santa Clara Valley between San Jose and the bay, and along the bay shore to the northeast and northwest, flowed freely; pumps were not needed in these wells. Wells produced water from an artesian aquifer as thick as 245 m (800 ft) that was confined beneath clayey deposits at about 18 m (60 ft) below land surface (Poland and Ireland, 1988). Agriculture developed rapidly in the early 1900s; two thirds of the valley was irrigated by 1920. By 1930, the groundwater level in a monitoring well in San Jose had fallen to 24 m (80 ft) below land surface. Subsidence was first noted in 1933, when bench marks installed in 1912 were found to have subsided more than 1.12 m (3.66 ft) (Fowler, 1981). Except for a few years in the early 1940s when higher than normal precipitation and stream runoff recharged aquifers, groundwater levels continued to decline. In 1964, the water level in the San Jose monitoring well had fallen to 72 m (235 ft) below land surface. Spirit-level surveys in 1967 identified subsidence of substantial magnitude and areal extent (Figure 4-1 and 4-2).
Topic: Groundwater Land Subsidence from Groundwater Use in California
CA Water Plan Update 2013 Vol 4 Reference Guide Page 40

APRIL 2014 REPORT OF FINDINGS Land Subsidence from Groundwater Use in California
LSCE, BORCHERS AND CARPENTER 21
Figure 4-1. Location of areas of subsidence caused by groundwater extraction in California. (Historic subsidence is defined for convenience in this report as occurring before 1993.)
Topic: Groundwater Land Subsidence from Groundwater Use in California
CA Water Plan Update 2013 Vol 4 Reference Guide Page 41

APRIL 2014 REPORT OF FINDINGS Land Subsidence from Groundwater Use in California
LSCE, BORCHERS AND CARPENTER 22
Figure 4-2. Contours of land subsidence in the northern Santa Clara Valley during 1934-1967, in feet (from Ingebritsen and Jones, 1999). Between 1910 and 1995 subsidence was greatest, 4.2 m (14 ft), in downtown San Jose. About 260 km2 (100 mi2) of land had subsided by more than one foot. In 1935 and 1936, the Santa Clara Valley Water District (SCVWD) built dams on local streams to retain flood flows for later release, in order to foster recharge of the aquifer system through stream beds. The SCVWD began to import water from the Hetch Hetchy reservoir in the Sierra Nevada in 1951, from the California State Water Project in 1965, and from the San Felipe Project of the Federal Central Valley Project in 1987. About 25 per cent of the imported water was used for groundwater recharge projects. Water imports for consumptive use and recharge projects proved successful; water levels in the confined aquifer system made a dramatic recovery. A pumping tax imposed in 1964 provided a disincentive to pump groundwater and thus contributed to groundwater-level recovery. Subsequently, some abandoned and long-forgotten wells have begun flowing once again. Subsidence has been completely arrested. The SCVWD now manages the aquifer system within
Topic: Groundwater Land Subsidence from Groundwater Use in California
CA Water Plan Update 2013 Vol 4 Reference Guide Page 42

APRIL 2014 REPORT OF FINDINGS Land Subsidence from Groundwater Use in California
LSCE, BORCHERS AND CARPENTER 23
tight water-level and subsidence tolerances designed to prevent the reoccurrence of land subsidence (see Section 5). InSAR was used to evaluate seasonal and multi-year deformation patterns, understanding of which is critical for implementing appropriate water-management strategies such as subsidence mitigation. An 8-month interferogram (January - August 1997) shows seasonal subsidence of about 30 mm (1.2 in) near San Jose (Figure 4-3A) and corresponds to about a 10-m decline in water levels. A 5-year interferogram (September 1992 - August 1997) shows a small amount (15 mm, 0.6 in) of regional uplift (Figure 4-3B). The uplift corresponds to a sustained period of water-level recovery throughout the valley. The lack of subsidence between 1992-1997 indicates that the seasonal subsidence during 1997 was elastic (recoverable) (Galloway et al., 1999). Interferograms prepared by Schmidt and Burgmann (2003) for September 1992-August 1999 indicate that uplift due to long-term elastic rebound of the aquifer system was most pronounced in two locations in the northern Santa Clara Valley— north of Sunnyvale and east of the Silver Creek Fault. The maximum uplift, 41 mm (1.6 in) north of Sunnyvale, was attributed to a greater amount of fine-grained sediment in this area. The elastic compressibility of fine-grained sediment is several times greater than that of coarser-grained materials.
A B Figure 4-3. Interferograms showing A) seasonal subsidence during January 1997-August 1997, and B) small amounts of uplift over longer time period, 1992-1997 (from Galloway et al., 1999). Despite the efficient and coordinated management of groundwater and surface-water supplies that allowed groundwater levels to return nearly to predevelopment levels in the Santa Clara Valley, aquifer compaction that occurred historically was almost completely inelastic and land subsidence permanent. The economic costs of this subsidence were substantial and continue today as a legacy of groundwater overdraft from the previous century.
Topic: Groundwater Land Subsidence from Groundwater Use in California
CA Water Plan Update 2013 Vol 4 Reference Guide Page 43

APRIL 2014 REPORT OF FINDINGS Land Subsidence from Groundwater Use in California
LSCE, BORCHERS AND CARPENTER 24
The economic costs of subsidence in California are perhaps nowhere documented as thoroughly as in the Santa Clara Valley. Because the valley has a gentle topographic slope and borders the San Francisco Bay, the effects of subsidence on coastal flooding are dramatic. Were it not for levees at the bay shore and bordering the streams and drains that flow to the bay, about 50 km2 (19 mi2) of the Santa Clara Valley would be under water. Fowler (1981) wrote, “Once a person standing on the land near the bay could look down upon the waters. Now, a person standing on the same spot looks up at levees keeping the salt water off the land” (Figure 4-4).
Figure 4-4. The South Bay Yacht Club at Alviso, California in A) 1914, before dikes were necessary to prevent flooding and B) 1978 after dikes were constructed to prevent bay water from flooding areas near the yacht club that had subsided to 10 feet below sea level. The yacht club headquarters stands on the right side of each photograph (photographs courtesy of Santa Clara Valley Water District). Fowler (1981) described the direct costs for subsidence remediation activities in the Santa Clara Valley. Costs to repair 1,000 wells whose steel casing had been compressed and collapsed by subsidence were estimated to be $2 million dollars between 1960 and 1965. The cost for well replacement during 1960-1965, or repair and replacement in other years, is not included in the estimate. Roll (1967) estimated the cost for well repairs in the valley at $5 million for the same period. Using Roll’s early-1960s estimate and 1967 as a base value, well replacement and repair costs amounted to $35 million in 2013 dollars. Where reductions in the design grade of sanitary sewers reduced their carrying capacity, larger sewer mains or parallel lines were constructed, and pumping stations had to be built to lift fluids to the bay at a cost of more than $8 million dollars in 1970 ($48 million in 2013 dollars), exclusive of the additional annual costs for electricity and maintenance of the pumping stations (Viets, et al., 1979). Viets and others (1979) estimated the
Topic: Groundwater Land Subsidence from Groundwater Use in California
CA Water Plan Update 2013 Vol 4 Reference Guide Page 44

APRIL 2014 REPORT OF FINDINGS Land Subsidence from Groundwater Use in California
LSCE, BORCHERS AND CARPENTER 25
cost to operate the additional pumping facilities at the San Jose-Santa Clara Sewage Treatment Plant at $200,000 annually in 1970 ($28 million total through 2013 in 2013 dollars). Raising the grades of roads and bridges cost $2.8 million by 1975 ($12 million in 2013 dollars) not including the costs of repairs necessitated by flooding. The estimated cost of constructing bayfront levees was $58 million in 1973 ($305 million in 2013 dollars), and the initial cost of raising stream channel levees was more than $10 million in 1979 ($32.2 million in 2013 dollars). The initial capital outlay to build pumping stations to remove storm drainage was $2.7 million in 1975 ($12 million in 2013 dollars). Annual operation and maintenance costs for the pumping facilities were expected to exceed the total capital outlay for construction of the plants ($283 million in 2013 dollars). Raising a Southern Pacific Railroad bridge to align it to tracks that had to be moved to avoid flooding cost $100,000 in 1970 (0.6 million in 2013 dollars). Roll’s (1967), Viets and others (1979), and Fowler’s (1981) cost estimates translate to more than $756 million in 2013 dollars spent on subsidence remediation in the Santa Clara Valley. These costs did not include replacing destroyed wells or repairing wells at other times than 1960-1965, or the indirect costs of silted up stream channels in flood prone areas. Costs to the Southern Pacific Railroad (and its successors) to raise tracks are not included in these estimated costs, nor are the substantial costs to private industry to raise about 80 km (50 mi) of levees protecting 80 km2 (30 mi2) of salt evaporation ponds that fringe the bay. The decline in the property values resulting from obstructed views or by flood zone designation has also not been estimated. Movement on a 0.56 km (0.35 mi) segment of the Busch fault north from Hollister, California, in what is sometimes referred to as the southern Santa Clara Valley, has been attributed to groundwater withdrawal (Holzer, 1984). Tectonic motion on the fault is predominantly right lateral, parallel to the surface trace of the fault, rather than vertical along on the steeply dipping fault plane. Yet measurements during 1970-1975 indicated only a slow, nearly vertical, creeping displacement averaging 8.6 mm/yr (0.34 in/yr) on the fault. The downward displacements on the steeply dipping fault plane were seasonal—coincident with the end of pumping for irrigation in the intensely farmed region. It is likely that seasonal lowering of groundwater levels by pumping wells caused the measured displacements.
4.2 San Joaquin Valley
Land subsidence from groundwater extraction in the San Joaquin Valley has been called the greatest human alteration of the Earth’s surface (Galloway et al., 1999). It is inexorably linked to the development of agriculture and the availability of water. Because the valley is semi-arid, and streamflow into the east side of the valley varies substantially from year to year and is mostly not available on the west side, agriculture developed a reliance on the aquifer system. More than half of the thickness of the aquifer system is composed of fine-grained sediments, including clays, silts, and sandy or silty clays (Williamson et al., 1989), that are susceptible to compaction if depressured by pumping wells. Throughout most of the valley, a thick compressible clay, the Corcoran Clay member of the Tulare formation, confines and separates deep aquifer sediments
Topic: Groundwater Land Subsidence from Groundwater Use in California
CA Water Plan Update 2013 Vol 4 Reference Guide Page 45
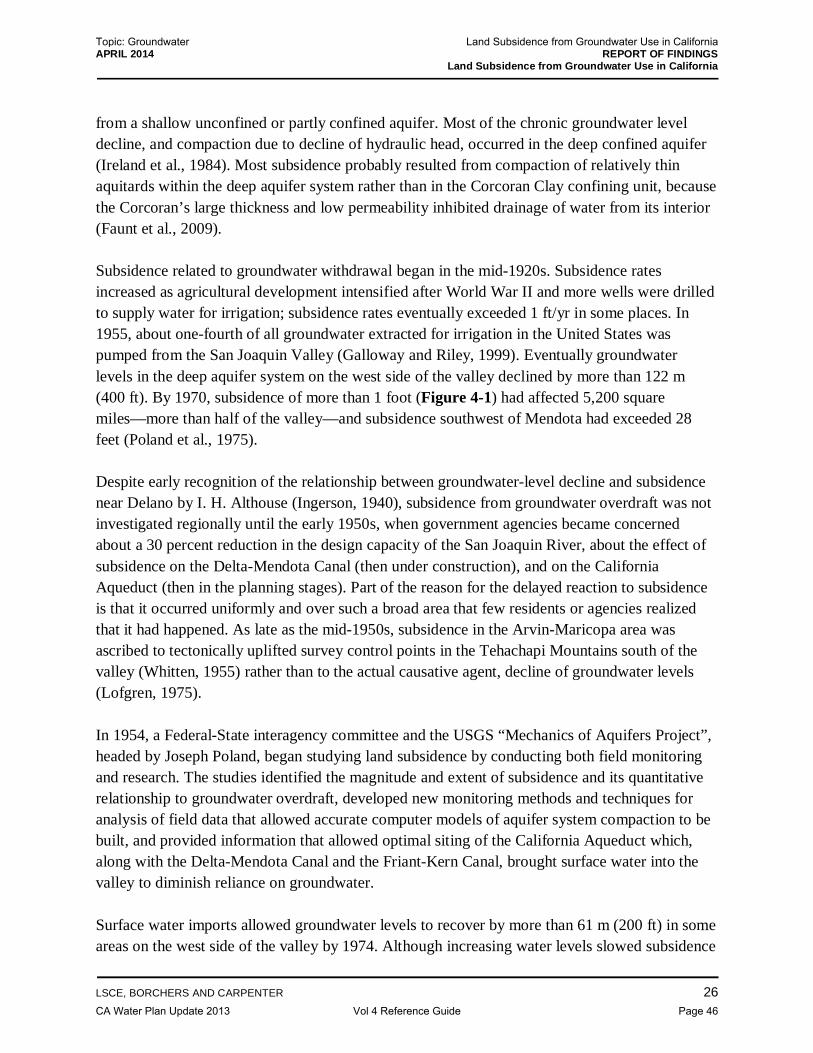
APRIL 2014 REPORT OF FINDINGS Land Subsidence from Groundwater Use in California
LSCE, BORCHERS AND CARPENTER 26
from a shallow unconfined or partly confined aquifer. Most of the chronic groundwater level decline, and compaction due to decline of hydraulic head, occurred in the deep confined aquifer (Ireland et al., 1984). Most subsidence probably resulted from compaction of relatively thin aquitards within the deep aquifer system rather than in the Corcoran Clay confining unit, because the Corcoran’s large thickness and low permeability inhibited drainage of water from its interior (Faunt et al., 2009). Subsidence related to groundwater withdrawal began in the mid-1920s. Subsidence rates increased as agricultural development intensified after World War II and more wells were drilled to supply water for irrigation; subsidence rates eventually exceeded 1 ft/yr in some places. In 1955, about one-fourth of all groundwater extracted for irrigation in the United States was pumped from the San Joaquin Valley (Galloway and Riley, 1999). Eventually groundwater levels in the deep aquifer system on the west side of the valley declined by more than 122 m (400 ft). By 1970, subsidence of more than 1 foot (Figure 4-1) had affected 5,200 square miles—more than half of the valley—and subsidence southwest of Mendota had exceeded 28 feet (Poland et al., 1975). Despite early recognition of the relationship between groundwater-level decline and subsidence near Delano by I. H. Althouse (Ingerson, 1940), subsidence from groundwater overdraft was not investigated regionally until the early 1950s, when government agencies became concerned about a 30 percent reduction in the design capacity of the San Joaquin River, about the effect of subsidence on the Delta-Mendota Canal (then under construction), and on the California Aqueduct (then in the planning stages). Part of the reason for the delayed reaction to subsidence is that it occurred uniformly and over such a broad area that few residents or agencies realized that it had happened. As late as the mid-1950s, subsidence in the Arvin-Maricopa area was ascribed to tectonically uplifted survey control points in the Tehachapi Mountains south of the valley (Whitten, 1955) rather than to the actual causative agent, decline of groundwater levels (Lofgren, 1975). In 1954, a Federal-State interagency committee and the USGS “Mechanics of Aquifers Project”, headed by Joseph Poland, began studying land subsidence by conducting both field monitoring and research. The studies identified the magnitude and extent of subsidence and its quantitative relationship to groundwater overdraft, developed new monitoring methods and techniques for analysis of field data that allowed accurate computer models of aquifer system compaction to be built, and provided information that allowed optimal siting of the California Aqueduct which, along with the Delta-Mendota Canal and the Friant-Kern Canal, brought surface water into the valley to diminish reliance on groundwater. Surface water imports allowed groundwater levels to recover by more than 61 m (200 ft) in some areas on the west side of the valley by 1974. Although increasing water levels slowed subsidence
Topic: Groundwater Land Subsidence from Groundwater Use in California
CA Water Plan Update 2013 Vol 4 Reference Guide Page 46

APRIL 2014 REPORT OF FINDINGS Land Subsidence from Groundwater Use in California
LSCE, BORCHERS AND CARPENTER 27
by the early 1970s, subsidence continued due to delayed drainage of water from compacting clayey aquitards, particularly in three areas: the Los Banos-Kettleman City area on the west side of the mid-valley, the Wasco-Tulare area of the southern valley east from the Tulare Lake bed, and the Arvin-Maricopa area in the extreme southern end of the valley (Figures 4-1 and 4-5). For example, although no long-term water-level decline occurred at an extensometer installation near Pixley, California (23S25E16N1-4, in the Tulare-Wasco subsiding region) between January 1959 and February 1971, almost 1 m (3.2 ft) of aquifer-system compaction occurred during this period (Helm, 1975). Three fissures formed in the large subsiding area near Pixley, California (Wasco-Tulare area), about 40 km north from Wasco. The easternmost fissure which formed in 1969 was believed to be related to differential subsidence (Holzer, 1984) that probably was triggered by groundwater extraction. During the drought of 1976-1977, groundwater was used to make up for reductions in surface water deliveries. Movement during 1977-1978 on the northern end of the Pond-Poso Creek fault, an active tectonic fault located about 11 km (6.8 mi) north of Wasco was attributed to stresses imparted by declining groundwater levels (Holzer, 1977 and 1980).
Figure 4-5. Primary areas of subsidence in the San Joaquin Valley (from Galloway et al., 1999). A, Los Banos-Kettleman City, B, Wasco-Tulare, C, Arvin Maricopa.
Topic: Groundwater Land Subsidence from Groundwater Use in California
CA Water Plan Update 2013 Vol 4 Reference Guide Page 47

APRIL 2014 REPORT OF FINDINGS Land Subsidence from Groundwater Use in California
LSCE, BORCHERS AND CARPENTER 28
About 48 km (30 mi) of the Friant-Kern Canal, from 153 to 201 km (95 to 125 mi) downstream of the Friant Dam, was impacted by subsidence in the Tulare-Wasco area. Between the end of construction in 1951 and January 1975, parts of the affected reach of the canal subsided 5.5 ft, interfering with operations (Prokopovich, 1983). Measurements of water depth at closed check dams indicated that subsidence also affected parts of the canal farther south toward Bakersfield. During 1976-1980, a 26.67 km (16.67 mi) reach of the canal was rehabilitated. Canal berm materials were excavated and recompacted (Figure 4-6 A), concrete linings were extended upward (Figure 4-6 B), bridges were raised (Figure 4-6 C, D), canal turnout structures and drain inlets were modified, and three large pumping plants were raised on new foundations. Costs for the remedial activities in 2013 dollars totaled $15 million (calculated from 1976, 1977, and 1980 contract amounts provided in Prokopovich, 1983). Currently, a $25 million (2013 dollars) rehabilitation of upstream reaches of the Friant-Kern Canal is planned to improve flow capacity where original design limitations, increased canal roughness, and perhaps small amounts of land subsidence have reduced its intended capacity.
Although only about one-third of the peak annual groundwater volumes of the 1960s was pumped during the 1976-1977 drought, water levels fell more than 45.7 m (150 ft) over a large area on the west side of the valley, and subsidence rates increased. The droughts of 1987-1992 and droughts and regulatory reductions in surface water diversions during 2007-2010 had similar effects, despite the fact that water levels never approached the historically low levels of the 1960s.
A B
Topic: Groundwater Land Subsidence from Groundwater Use in California
CA Water Plan Update 2013 Vol 4 Reference Guide Page 48

APRIL 2014 REPORT OF FINDINGS Land Subsidence from Groundwater Use in California
LSCE, BORCHERS AND CARPENTER 29
C D
Figure 4-6. Remedial activities in subsidence-affected reaches of the Friant-Kern Canal. A) Excavating the canal berm for recompaction, and B) extension of concrete canal lining, C) cribbing emplaced to raise bridge higher, D) jacking operation in progress at Avenue 88 bridge, where only one workman is clearly visible in the photograph, but 21 more workman are under the bridge manning 50-ton jacks (from Prokopovich, 1983). Increased use of the aquifer system during climactic and regulatory droughts is reflected in statistics on new well construction compiled by the California Department of Water Resources (Figure 4-7). At the end of the drought in the late 1970s, surface water availability increased and fewer wells were drilled until the drought of 1987-1992. New well construction peaked in 1991, when more that 1,100 new wells were drilled in the valley. After the 1987-1992 drought, fewer wells were constructed until the regulatory reductions in surface water diversions prompted additional well construction beginning in 2007. The rapid decline of groundwater levels during post-1975 droughts in response to relatively small volumes of pumping (compared to those of the 1960s) results from a loss of storage space in the aquifer system—mostly from inelastic compaction of aquitards during the 1950s and 1960s— and from reduced hydraulic conductivity (permeability) of those compacted aquitards that restrict drainage of water to permeable parts of the aquifer system. Observations showed that water levels were considerably higher than during the 1960s, yet there was renewed land subsidence during droughts. This illustrates the complex effects of unequal distribution of preconsolidation stress within the aquitards and between the aquitards and more permeable units of the aquifer system (see Section 3). Comprehensive leveling surveys of the valley ended in 1970 and, over time, funding for coordinated subsidence investigations also ended, and field installations such as borehole extensometers and water-level monitoring wells were decommissioned or fell into disrepair. DWR continued to collect compaction data from a few extensometers and from deep monitoring wells where available, and state, federal, and local water agencies continued to run surveys on
Topic: Groundwater Land Subsidence from Groundwater Use in California
CA Water Plan Update 2013 Vol 4 Reference Guide Page 49

APRIL 2014 REPORT OF FINDINGS Land Subsidence from Groundwater Use in California
LSCE, BORCHERS AND CARPENTER 30
Figure 4-7. Number of well completion reports received by the California Department of Water Resources annually for counties within San Joaquin Valley. (courtesy of the California Department of Water Resources) canal alignments intermittently, but analysis of this information was not centralized. Swanson (1998) presented a summary of land subsidence that occurred between 1970 and 1995. His information, gleaned from road, canal and levee surveys, documentation of canal and bridge infrastructure repairs, and reports of changing canal gradients from water agency managers, indicated that subsidence was continuing in each of the three main areas identified in the earlier comprehensive subsidence studies (Los Banos-Kettleman City, Tulare-Wasco, Arvin-Maricopa) and in an additional area near the San Joaquin River north of Mendota. The current drought and cropping patterns that have changed from row crops and range land to tree and other permanent crops have again forced reliance on aquifer systems in the San Joaquin Valley for agricultural irrigation supplies. Recent Interferometric Synthetic Aperture Radar (InSAR) analyses show that two large areas in the San Joaquin Valley are currently subsiding substantially (Jessica Reeves, Stanford University, written commun., July 9, 2013;Thomas Farr, NASA-JPL, written commun., September, 2013; Sneed et al., 2013). These areas are a large, about 7,000 km2 (2,700 mi2) swath of subsidence west of Tulare and east of Kettleman City and
Topic: Groundwater Land Subsidence from Groundwater Use in California
CA Water Plan Update 2013 Vol 4 Reference Guide Page 50

APRIL 2014 REPORT OF FINDINGS Land Subsidence from Groundwater Use in California
LSCE, BORCHERS AND CARPENTER 31
an area about half the size, 3,100 km2 (1,200 mi2), but still very large near El Nido (South of Merced and west of Madera; Figure 4-8). Currently subsiding areas are shifted substantially from the locales of major subsidence during 1926-1970 (Figure 4-8). Figure 4-8 shows shaded contours of land subsidence in both subsiding areas that were derived from preliminary InSAR analysis (Thomas Farr, NASA-JPL, written commun. February 22, 2014). The large subsiding area in the southern San Joaquin Valley is shifted to the northwest from the Wasco-Tulare area where maximum subsidence during 1926-1970 was about 4 m (13 ft) (Ireland et al., 1984). More than 46 cm (1.5 ft) of subsidence occurred over a large part of the southern subsiding area during 2007-2011. In some places subsidence lowered the land surface 120 cm (3.9 ft). The maximum rate of recent subsidence is about twice the maximum rate that occurred historically in the area. Caltrans surveys at bench marks along Hwy 198 corroborate the location of the subsidence and indicate that as much as 2.86 m (9.37 ft) of subsidence occurred between the 1960s and 2004 (Figure 4-9). Subsidence studies at the Lemoore Naval Air Station (LNAS), which lies in the northwest edge of this subsiding area (Cobett et al., 2011), indicate that total subsidence there between 1925 and 2010 exceeded 10 ft—considerably more than the Caltrans surveys indicated had occurred during the 1960s-2004, 1.0-1.2 m (3.5-4.0 ft). The difference in Corbett’s estimate and the Caltrans surveys likely is due to subsidence that occurred prior to the 1960s and after 2004. Because the LNAS and Highway 198 are located on northern fringe of the subsiding area, neither Corbett’s estimate or the Caltrans survey capture the maximum subsidence in this region. No independent surface measurements of land subsidence or aquifer-system compaction have been acquired to confirm the magnitude of subsidence represented on the Figure 4-8 in the southern subsiding area. The subsiding area reportedly is correlated with increased groundwater extraction needed for changing land use and cropping patterns; open land and seasonal crops have been supplanted by perennial crops and orchards that require irrigation year-round (John Kirk, California Department of Water Resources, oral commun., April 24, 2013). Planning for the effects of continued land subsidence in the area will be important for water conveyance agencies. Canals, rivers, and flood bypass channels sag in subsiding areas, losing freeboard and flow capacity. Historical photographs reportedly show the water surface in a full canal of the Angiola Water District (Corcoran, California, near the center of subsidence) lying 3.7-4.6 m (12-15 ft) below children fishing in the canal with their legs dangling over the canal embankment. ‘If a person sat there in the spring of 2013, they would get wet up to their knees’ (Matt Hurley, Angiola Water District, oral comm. June 25, 2013).
Topic: Groundwater Land Subsidence from Groundwater Use in California
CA Water Plan Update 2013 Vol 4 Reference Guide Page 51

APRIL 2014 REPORT OF FINDINGS Land Subsidence from Groundwater Use in California
LSCE, BORCHERS AND CARPENTER 32
Figure 4-8. Recent subsidence in the in San Joaquin Valley January 2007-March 2011 shown as shaded regions compiled from Interferometric Synthetic Aperture Radar (InSAR) analysis. (InSAR derived subsidence data were provided as preliminary unpublished data courtesy of NASA-JPL.) Subsidence data were composited from three separate interferograms—eastern part of the area, 1/2007-7/2010; central part, 6/2007-6/2010; and western part, 1/2007-3/2011.). Brown contours are lines of equal magnitude of historical land subsidence, in feet, during 1926-1970 (Ireland et al., 1984). The proposed alternative alignments of the California High-Speed Rail system are shown as dotted lines.
Topic: Groundwater Land Subsidence from Groundwater Use in California
CA Water Plan Update 2013 Vol 4 Reference Guide Page 52

APRIL 2014 REPORT OF FINDINGS Land Subsidence from Groundwater Use in California
LSCE, BORCHERS AND CARPENTER 33
A
B
Figure 4-9. A) The location of Lemoore Naval Air Station and Caltrans subsidence profile A-A’, and B) Elevation changes from between the 1960s-2004 computed from repeat geodetic surveys along Highway 198 (courtesy of California Department of Water Resources). Plans for other infrastructure currently in the design stage can be adjusted to accommodate the expected continued subsidence. The California High-Speed Rail (CHSR) line is one such project. The dotted line (Figure 4-8) shows proposed alternative alignments of the CHSR. To confirm subsidence information obtained from NASA-JPL shown on Figure 4-8, the Program Management Team California High-Speed Rail Authority conducted limited GPS field surveys, contacted Caltrans regarding their experience with subsidence, and proposed to develop mitigations to be implemented during procurement, design, and construction (California High-Speed Rail Project Monthly Program Report, May 2013).
Topic: Groundwater Land Subsidence from Groundwater Use in California
CA Water Plan Update 2013 Vol 4 Reference Guide Page 53

APRIL 2014 REPORT OF FINDINGS Land Subsidence from Groundwater Use in California
LSCE, BORCHERS AND CARPENTER 34
The area near El Nido (west of Madera and south of Merced) containing the northern subsidence feature (Figure 4-8) subsided between 0.3 m-1.2 m (1-4 ft) during 1926-1970, but subsidence was centered much further to the southwest at that time. In fact, the greatest subsidence during 1926-1970 was located 1.7 km (1.0 mi) northeast of the California Aqueduct on Panoche Road southwest from Mendota, California (Figure 4-8). This was the location of the well-known photograph of Joseph Poland of the U.S. Geological Survey standing next to a power pole signed to indicate the former height of land surface during 1925-1977 (Figure 4-10). Currently, subsidence occurs in a broad swath of the mid-valley area further to the northeast, in the focal area of the San Joaquin River Restoration Program (Figure 4-11), where it has affected water-conveyance structures, roads, and bridges. The subsiding area is apparently correlated with increased groundwater extraction needed for changing land uses and cropping patterns in areas east of the San Joaquin River that lie outside water district boundaries and have no access to surface water for irrigation. As is the case in the area of recent subsidence further south in the San Joaquin Valley, open land and seasonal crops have been supplanted by perennial crops and orchards that require irrigation year round. Farms have relied on extraction of water from the deep confined part of the aquifer system for irrigation (Chris White, Central California Irrigation District, oral commun., July 10, 2013). The U. S. Army Corps of Engineers (2002) has predicted that 5.2 m (17 ft) of subsidence will occur during 2000-2060 where Route 152 crosses the San Joaquin River and the East Side Bypass (Figure 4-11) in the area identified by Swanson (1998) as an emerging subsidence problem. GPS surveying in 2010, done by contractors to DWR’s Central Valley Floodplain Evaluation and Delineation (CVFED) Program to rectify vertical control for LiDAR surveys, identified discrepancies with historic elevations at survey monuments in this area. The discrepancies were attributed to subsidence that amounted to 0.18 m (0.6 ft) near Sack Dam during 2008-2010. Surveying campaigns by the USBR between 2011 and 2013 indicate that subsidence continues at about the same or a slightly greater rate (Gerald Davis, USBR, written commun., December 6, 2013). Preliminary InSAR analysis and later reporting by the USGS (Sneed et al., 2013, fig. 17) and NASA-JPL (Tom Farr, NASA-JPL, written commun., September 2013) showed substantial subsidence (Figure 4-12 A, B, C).
Topic: Groundwater Land Subsidence from Groundwater Use in California
CA Water Plan Update 2013 Vol 4 Reference Guide Page 54

APRIL 2014 REPORT OF FINDINGS Land Subsidence from Groundwater Use in California
LSCE, BORCHERS AND CARPENTER 35
Figure 4-10. Joseph Poland standing near the location of greatest land subsidence during 1925-1977 in the San Joaquin Valley, southwest from Mendota, California. Bench mark S 661, to which subsidence at the power pole was referenced was located 31 ft southeast of the center line of Panoche Road, 2.3 ft southwest of San Joaquin Power and Light Corporation power line pole number 3/10 (replaced by a new Pacific Gas and Electric Company pole since the photograph) was not found in 1988 when NGS survey crews visited the area; it likely has been destroyed. Sneed and others’ (2013) investigation of subsidence along the Delta Mendota Canal (Figure 4-12 C) determined that the northern portion of the canal was relatively stable. Historical land-surface deformation measurements indicate that the southern portion of the canal (Checks 15–21) subsided substantially (Chris White, Central California Irrigation District (CCID), oral commun. July 10, 2013); more recently, slight subsidence has occurred, probably in response to the large subsidence feature south of the town of El Nido. Results of InSAR analysis indicated at least 54 cm (1.8 ft) of subsidence at rates of 43 cm/yr (11 in/yr) near the San Joaquin River and the Eastside Bypass during 2008-2010 (Sneed et al., 2013), within a 3,100 km2 (~ 1,200 mi2) area, including the southern part of the Delta-Mendota Canal, that was affected by 20 mm (0.07 ft) or more of subsidence during the same period. Water levels in many shallow and deep wells in this area declined during 2007-2010; in many deep wells, water levels reached historical lows, indicating that subsidence measured during this period was largely inelastic.
Topic: Groundwater Land Subsidence from Groundwater Use in California
CA Water Plan Update 2013 Vol 4 Reference Guide Page 55

APRIL 2014 REPORT OF FINDINGS Land Subsidence from Groundwater Use in California
LSCE, BORCHERS AND CARPENTER 36
Figure 4-11. The San Joaquin River Restoration Program area. Land subsidence centered near the El Nido area has affected water conveyance facilities between Mendota and areas downstream from El Nido, including the Sack Dam and Arroyo Canal, the San Joaquin River and the Chowchilla and Eastside Bypasses. Red highlighting indicates those reaches of the Eastside Bypass that are most affected by recent subsidence according to the Lower San Joaquin Levee District. Canal reaches indicated by the orange arrow and the Arroyo Canal directly above the arrow were severely affected by subsidence historically, and are experiencing renewed occurrences (Chris White, Central California Irrigation District, oral commun. July 10, 2013). (Base map courtesy of DWR) Recent surveying campaigns by DWR and USBR indicate that subsidence continues at about 0.15 m/yr (0.5 ft/yr) near the Sack Dam and 0.27 m/yr (0.9 ft/yr) near the Eastside Bypass (Gerald Davis, USBR, written commun., December 6, 2013). Discovery of subsidence in this area halted redesign efforts for Sack Dam as agencies considered how to adapt to the lowered land surface and prepare for likely continued subsidence. The design process was complicated by the need to build a taller dam to contain a deeper and broader pool of water that would result from continued subsidence; dams taller than 6 ft are regulated by more rigorous safety regulations and approvals. Results of further study by USBR and DWR will provide guidance for dam design and other subsidence issues revealed by recent investigations in the area.
Topic: Groundwater Land Subsidence from Groundwater Use in California
CA Water Plan Update 2013 Vol 4 Reference Guide Page 56

APRIL 2014 REPORT OF FINDINGS Land Subsidence from Groundwater Use in California
LSCE, BORCHERS AND CARPENTER 37
A
Figure 4-12 A. See full figure title on next page.
Topic: Groundwater Land Subsidence from Groundwater Use in California
CA Water Plan Update 2013 Vol 4 Reference Guide Page 57

APRIL 2014 REPORT OF FINDINGS Land Subsidence from Groundwater Use in California
LSCE, BORCHERS AND CARPENTER 38
B
C
Figure 4-12. A) Recent subsidence in the central San Joaquin Valley near El Nido between January 2007 and March 2011. The location of proposed alignments for the Merced to San Jose rail line are shown in more detail and with additional points of geographic reference on Figure 4-13. B) Graph showing elevation changes computed from repeat geodetic surveys along Highway 152 for 1972–2004. C) Graph showing elevation changes computed from repeat geodetic surveys along the Delta-Mendota Canal for 1935–2001 (from Sneed et al., 2013, Fig. 17).
Topic: Groundwater Land Subsidence from Groundwater Use in California
CA Water Plan Update 2013 Vol 4 Reference Guide Page 58

APRIL 2014 REPORT OF FINDINGS Land Subsidence from Groundwater Use in California
LSCE, BORCHERS AND CARPENTER 39
Figure 4-13. Proposed alternative alignments of the Merced to San Jose section of California high-speed rail line pass through the newly subsiding areas south of El Nido, near where Highway 152 crosses the San Joaquin River (from California High Speed Rail Authority, 2013). Channel and levee surveys by DWR in 1983 and the U.S. Army Corps of Engineers (USACE) in 1984 indicated that one reach of the Eastside Bypass, west from El Nido California, downstream from the Sand Slough Connector (Figure 4-11) had subsided by about 0.46 m (1.5 ft) since it was constructed in 1964 (USACE, 1984). A flood breaching the west levee, which had subsided more than the east levee in this reach, would inundate at least 83 km2 (32 mi2) and possibly as much as 440 km2 (170 mi2) west from the bypass. This reach was originally designed to carry 4,672 m3/s (16,500 ft3/s) with a levee freeboard (the distance between the water surface and the top of the levees) of 1.22 m (4 ft). In 1984 the USACE removed 18,400 m3 (650,000 yd3) of sediment that had accumulated in 2.5 mi of the subsiding reach to improve the flow capacity. However, during a flood in 1995, flow in this reach was 340 m3/s (12,000 ft3/s) with only 0.46 m (1.5 ft) of freeboard—a substantial reduction of the design flow capacity (Reggie Hill, Lower San Joaquin Levee District (LSJLD), oral commun., December 11, 2013). In 1999, the LSJLD raised part of the west levee of the bypass 0.3 m (1ft) and in 2000 DWR raised both levees as much as 0.91 m (3 ft) (Reggie Hill, LSJLD, oral commun., December 11, 2013). The reach upstream from the Sand Slough connector (between the reaches highlighted in red on Figure 4-11) may be more severely impacted by subsidence than the reaches immediately upstream and downstream. In 2008, the flow capacity of this reach of the bypass was 5,000 ft3/s lower than the designed capacity of 17,500 ft3/s. Modeling studies by DWR predict that
Topic: Groundwater Land Subsidence from Groundwater Use in California
CA Water Plan Update 2013 Vol 4 Reference Guide Page 59

APRIL 2014 REPORT OF FINDINGS Land Subsidence from Groundwater Use in California
LSCE, BORCHERS AND CARPENTER 40
subsidence continuing at current rates will reduce levee freeboard by an additional 0.46 m (1.5 ft) between 2011 and 2016 reducing the flow capacity of this reach to 10,000 ft3/s, only 57 percent of its design capacity. Subsidence likely also has reduced the flow capacity of the San Joaquin River east of El Nido to less than half its design capacity of 42.5 m3/s (1500 ft3/s) (Reggie Hill, LSJLD, oral commun., December 11, 2013). Subsidence near Sack Dam has decreased the flow capacity of the Arroyo Canal by 5 percent. The Arroyo Canal, which flows westerly from its point of diversion at Sack Dam, is the only source of surface water for irrigation in the service area of the San Luis Canal Company. Additional subsidence may necessitate construction of pumping facilities and a pipeline to deliver water for irrigation (Chase Hurley, San Luis Canal Company, oral comm., July 8, 2013). Figures 4-14 through 4-22 illustrate some of the expensive physical infrastructure problems caused by land subsidence in this area. Loss of flow capacity has occurred on the Outside, Poso, and Main and Delta Mendota Canals (Figure 4-11). The Central California Irrigation District’s (CCID) Poso Canal, which runs parallel to the San Joaquin River and is not shown on Figure 4-11, has lost 10 percent of its flow capacity. Embankments were raised on CCID’s Main Canal near the Russell Avenue bridge and flow capacity has been reduced near Los Banos. Embankments were raised on CCID’s Outside Canal in 1971 (unknown costs), and 1994 ($315,000 in 2013 dollars) (Russell Landon, CCID, oral comm. Nov. 20, 2013). A current (2007-2014) subsidence remediation program to raise 25.7 km (16 mi) of embankments, construct two new weirs and 20 service turnouts will cost $5.4 million when completed (Chris White, CCID, oral commun. December 3, 2013). When the Russell Avenue bridge over the Outside Canal was constructed in 1954, the flow capacity of the canal was 17.6 m3/s (620 ft3/s). The bridge now restricts canal flow to 9.63 m3/s (340 ft3/s) partly because subsidence has changed the structure from a free flowing conduit to a siphon (Landon, 2006). In 1960, 0.61 m (2 ft) high sidewalls were added to the Russell Avenue bridge to prevent water from the canal from flowing across road surfaces. Currently, water seeps through the road bed onto the bridge, and on windy days waves splash over the sidewalls and wet the road surface. Facility inspections were conducted routinely by staff of the CCID by examining the canal and turnouts from a boat which passed easily under the bridge (Chris White, CCID, oral commun. July 10, 2013) — something that is obviously impossible now that the bridge is partly submerged (Figure 4-21). The bridge has been judged structurally deficient and is scheduled for replacement by CCID, Caltrans, and the Fresno County Department of Public Works at a cost of $2.5 million.
Topic: Groundwater Land Subsidence from Groundwater Use in California
CA Water Plan Update 2013 Vol 4 Reference Guide Page 60

APRIL 2014 REPORT OF FINDINGS Land Subsidence from Groundwater Use in California
LSCE, BORCHERS AND CARPENTER 41
Figure 4-14. Location map of Central Valley Project, State Water Project and selected private canals.
Topic: Groundwater Land Subsidence from Groundwater Use in California
CA Water Plan Update 2013 Vol 4 Reference Guide Page 61

APRIL 2014 REPORT OF FINDINGS Land Subsidence from Groundwater Use in California
LSCE, BORCHERS AND CARPENTER 42
Figure 4-15. Delta Mendota Canal at Russell Road bridge north from Mendota, CA, looking downstream. Raised wing walls prevent water from overtopping Russell Avenue.
Figure 4-16. Delta Mendota Canal at Athena Road north from Mendota, CA; downstream is to the left. The bridge has experienced a substantial loss of clearance as the land subsided.
Topic: Groundwater Land Subsidence from Groundwater Use in California
CA Water Plan Update 2013 Vol 4 Reference Guide Page 62
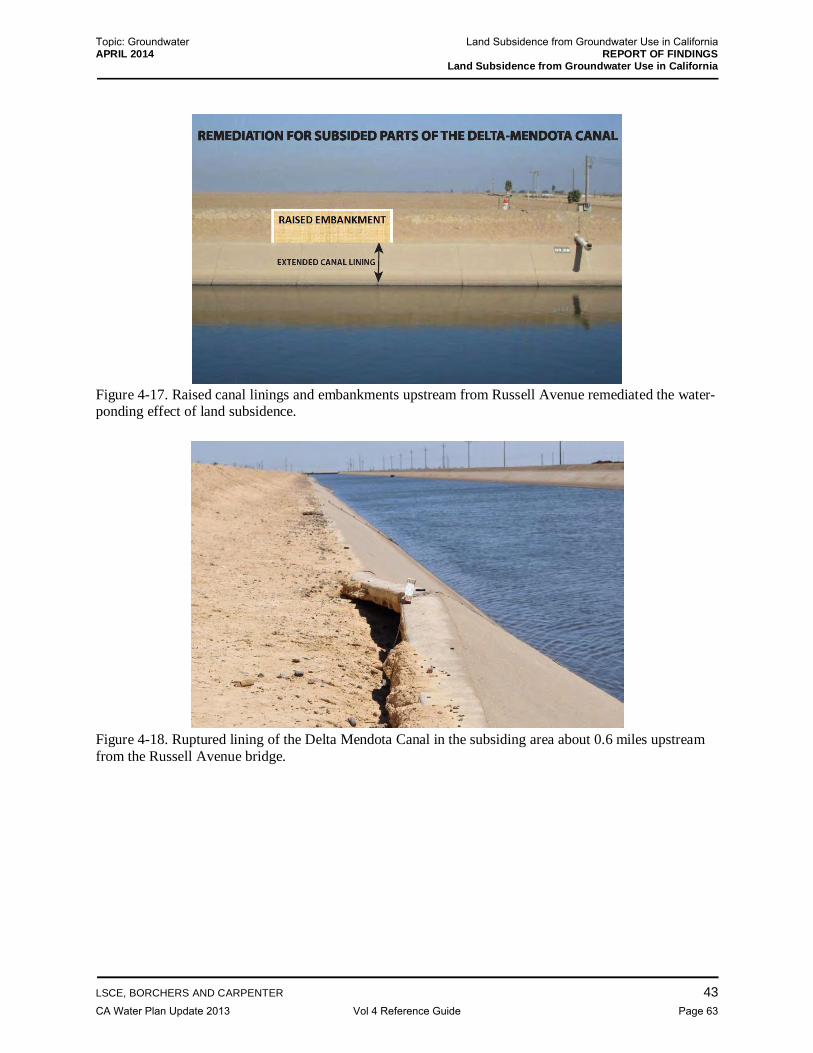
APRIL 2014 REPORT OF FINDINGS Land Subsidence from Groundwater Use in California
LSCE, BORCHERS AND CARPENTER 43
Figure 4-17. Raised canal linings and embankments upstream from Russell Avenue remediated the water-ponding effect of land subsidence.
Figure 4-18. Ruptured lining of the Delta Mendota Canal in the subsiding area about 0.6 miles upstream from the Russell Avenue bridge.
Topic: Groundwater Land Subsidence from Groundwater Use in California
CA Water Plan Update 2013 Vol 4 Reference Guide Page 63

APRIL 2014 REPORT OF FINDINGS Land Subsidence from Groundwater Use in California
LSCE, BORCHERS AND CARPENTER 44
Figure 4-19. Desilting the Outside Canal and raising embankments remediated subsidence downstream from Russell Avenue (photograph courtesy of Chris White, Central California Irrigation District).
Figure 4-20. Importing fill material to raise embankments in subsided areas of the Outside Canal (photograph courtesy of Chris White, Central California Irrigation District).
Topic: Groundwater Land Subsidence from Groundwater Use in California
CA Water Plan Update 2013 Vol 4 Reference Guide Page 64

APRIL 2014 REPORT OF FINDINGS Land Subsidence from Groundwater Use in California
LSCE, BORCHERS AND CARPENTER 45
Figure 4-21. Outside Canal at Russell Road, north from Mendota looking generally upstream. The Russell Avenue bridge has been deemed a hazardous structure by the Fresno County Road Department. Figure 4-22. Well casings protruding from land surface just south from El Nido. Left: casing of an abandoned gas well protrudes more than 46 cm (1.5 ft) higher than when it was painted 2 years earlier. Right: protruding casing of an irrigation well lifts its concrete surface pad and piping off the ground as land settles around it (photographs courtesy of Chris White, Central California Irrigation District). Prokopovich (1967, 1969, 1973, 1975, and 1986), Prokopovich and Herbert (1968) and Prokopovich and Marriot (1983) summarized the effects of historical subsidence on federal canals and drains on the west side of the San Joaquin Valley. Subsidence impacted about 48 km (30 mi) of the Delta Mendota Canal upstream from its terminous at Mendota Pool (Figure 4-12 C) by submerging canal service turnouts, drain inlets, bridges, pipelines, and check structures used to control water surface elevation in the canal, and by over topping the concrete lining of the canal. In the 1960s, the USBR raised bridges, and relocated pipeline crossings. In
Topic: Groundwater Land Subsidence from Groundwater Use in California
CA Water Plan Update 2013 Vol 4 Reference Guide Page 65

APRIL 2014 REPORT OF FINDINGS Land Subsidence from Groundwater Use in California
LSCE, BORCHERS AND CARPENTER 46
1977, the USBR extended the canal berms and concrete lining, modified bridges, and modified Check Structure No. 18 by adding a new deck on top of the existing structure and adding a 1.2 m (4 ft) extension to the three radial flow gates. The cost for these modifications, $7.821 million, was given by Prokopovich and Marriot (1983) as a total unadjusted for inflation. Using 1977 as the base year, the cost of these repairs in 2013 dollars is conservatively estimated as $30.14 million. In 1992, operation of the Delta-Mendota Canal passed to the San Luis Delta-Mendota Water Authority (SLDMWA). In 2004, the SLDMWA installed 3,048 linear m (10,000 ft) of concrete canal-lining extensions in areas of reduced freeboard; costs for this work have not been tabulated. Since then, SLDMWA has identified many areas where canal freeboard has been reduced to less than 0.15 m (0.5 ft). Sneed and others (2013) mapped additional subsidence along the canal during 2003 to 2010. The San Luis Canal (Figure 4-14), a shared asset of the federal Central Valley Project and the California State Water Project that was completed in 1968, has been affected by subsidence along 136.7 km (85 mi) of its length between the Los Banos and Kettleman City areas. The canal, now considered the middle section of the California Aqueduct, passes through three major subsidence bowls: 1) southwest of Mendota, 2) near the town of Cantua Creek, and 3) near the town of Huron (Ireland and others, 1984). Because subsidence had adversely affected the earlier-built Delta-Mendota Canal, designers incorporated as much as 2.75 m (10 ft) of extra freeboard into the San Luis Canal, adding $4.573 million ($30.67 million 2013 dollars) to construction costs. Additional subsidence required raising of canal linings, bridges, and other canal structures and rehabilitation of roads at costs of $1.575 million, $4.731 million, and $4.5 million, respectively, during 1982, 1983, and 1984 (Prokopovich and Marriot, 1983). Adjusting for inflation, these costs amount to $55.7 million in 2013 dollars. Subsidence due to hydrocompaction caused two sags in the canal, centered at California Aqueduct mile posts 120 and 128 near Cantua Creek (Ireland and others, 1984, p.I40), but no remedial actions have been discussed in the readily available literature. The USGS, in cooperation with DWR, is currently studying subsidence during 2003-2010 along this middle reach of the California Aqueduct (Sneed, U. S. Geological Survey, written commun., November 18, 2013). Although subsidence caused by structure settlement, groundwater extraction, hydrocompaction, hydrocarbon production, and perhaps other unknown causes has been described for the California Aqueduct in reaches south of San Luis Canal, no remedial activities have been discussed in the readily available literature. DWR is currently compiling historical information on subsidence magnitude, repairs, and operational impacts in order to assess the reliability of water deliveries from the entire California Aqueduct (Sheree Edwards, DWR, oral commun., November 21, 2013). The performance of all engineered structures, (check dams, turnouts, siphons, concrete lining, etc.) will be evaluated. Because the aqueduct cannot be shut down for this evaluation, divers will be employed to examine the concrete lining below the water surface.
Topic: Groundwater Land Subsidence from Groundwater Use in California
CA Water Plan Update 2013 Vol 4 Reference Guide Page 66

APRIL 2014 REPORT OF FINDINGS Land Subsidence from Groundwater Use in California
LSCE, BORCHERS AND CARPENTER 47
Drainage canals, which collect irrigation tail water, run northward on the floor of the San Joaquin Valley in the area served by the San Luis Canal reach of the California Aqueduct. Subsidence has lowered the gradients (slope) of the drains, reducing their flow capacity and making them more difficult to design and build (Viets and others, 1979). Design of the San Luis Drain included 15 cm (0.5 ft) of extra freeboard to account for potential subsidence from aquifer compaction caused by distant irrigation wells. Construction costs were $350,000 in 1968 ($2.35 million in 2013 dollars). The total cost to the U.S. government to account for or repair subsidence damage from groundwater extraction to major canals and drains built by the federal government on the west side of the San Joaquin Valley was $88.19 million (2013 dollars). These are contract construction costs and do not include costs for design, inspection, or studies. They also do not include the considerable cost of precompacting the San Luis Canal and major lateral canal alignments by diking and flooding to avoid subsidence caused by hydrocompaction of moisture deficient soils in the western San Joaquin Valley. (Hydrocompaction is described in Appendix A.) Costs for repairs to other infrastructure in the San Joaquin Valley, including replacement and repair of wells damaged and destroyed by land subsidence, have not been compiled systematically. Realistically, costs probably cannot be determined because there is no centralized repository of this information. According to Wilson (1968), 275 wells were reported with failed casings due to subsidence-induced compressive rupture in the 1,600 km2 (618 mi2) region of maximum subsidence in the valley between 1950 and 1961. Current costs to replace an 18-in diameter agricultural well averages $660-$820 per m ($200-$250 per ft) (Scott Lewis, Luhdorff and Scalmanini Consulting Engineers, oral commun. November 20, 2013). A conservative cost estimate to replace these wells, assuming each well is 500 m (1640 ft) deep, is $90 million dollars (2013 dollars). Viets and others (1979) present the example of a 486 km2 (120,000 acres, 188 mi2) farm on the west side of the San Joaquin Valley where 60 wells of an average depth of 610 m (2,000 ft) had failed casings. The current cost to replace the wells on this farm would be $24 million (2013 dollars). The most comprehensive and systematic estimate of economic costs of land subsidence in the San Joaquin Valley was $180 million by Bertoldi in 1993 dollars (Galloway and Riley, 1999). Bertoldi (Gilbert Bertoldi, U. S. Geological Survey (ret.), oral commun., November 29, 2013) collected billing invoices from land surveyors and other contractors and repair estimates from county agencies for remediating subsidence damage during 1955-1972 in areas of Fresno and Kings Counties that had subsided more than 1.22 m (4 ft) between 1925 and 1972. The invoices and repair estimates showed costs for: periodic surveying and regrading of agricultural fields to enable proper flow of water during flood irrigation, replacing networks of broken 20 to 25.4 cm (8 to 10-in) ceramic pipes that were buried trenches to transport irrigation water to fields, and
Topic: Groundwater Land Subsidence from Groundwater Use in California
CA Water Plan Update 2013 Vol 4 Reference Guide Page 67

APRIL 2014 REPORT OF FINDINGS Land Subsidence from Groundwater Use in California
LSCE, BORCHERS AND CARPENTER 48
broken sanitary sewers in urban areas. (Fresno and Kings County agencies had reported that sanitary sewers had broken for undetermined reasons; Bertoldi determined that broken sewers were in the subsiding areas.) Costs to repair or replace wells damaged by subsidence, the value of structures lost by condemnation, and decreased property values as a result of zoning changes where subsidence increased the extent and depth of flooding were also included in the damage estimates. Conservatively estimating the total cost in 2013 dollars, by assigning a cost of $10 million to each of the 18 years from 1955-1972 and accounting for inflation, results in total economic costs of $1.321 billion during 1955-1972. This estimate does not include the costs to repair damage to canals estimated above or the indirect costs of land subsidence such as flood damage to inundated farm equipment, long-term environmental effects, or any damage that may have occurred in areas where land subsidence from over pumping groundwater was less than 1.22 m (4 ft), or for subsidence damage that occurred prior to 1955 or after 1972. Water districts, ranchers, and others are dealing with the impacts of recent subsidence on water delivery infrastructure in an information vacuum because there has been no coordinated monitoring of land subsidence. Were it not for fortuitous satellite radar analyses (NASA-JPL, Stanford University, USGS) and recent attention focused by the San Joaquin River Restoration Program planning activities, the breadth and magnitude of recent subsidence in the San Joaquin Valley would be unknown. Much infrastructure in both the northern and southern subsiding areas potentially could be impacted by subsidence. Fortunately, federal, state and local agencies have been alerted to the issues of recent subsidence and can begin to implement appropriate strategies to monitor subsidence and minimize its impacts. For example, geotechnical and design engineers now can adapt plans for design (Figure 4-13) of the CHSR to accommodate potential future subsidence.
4.3 Sacramento Valley
The Sacramento Valley forms the northern one-third of the agriculturally rich Central Valley of California. Although it possesses substantial supplies of surface water, land subsidence in the Sacramento Valley has occurred when groundwater-levels declined in response to pumping for irrigation and public water supplies during droughts or in areas undersupplied by surface water. The earliest subsidence investigations in the southwestern Sacramento Valley were done using leveling data collected by the USGS and the NGS during 1935-1964. Land-surface profiles based on these data showed apparent land subsidence of more than 0.61 m (2 ft) along a level line between Zamora and Knights Landing in northern Yolo County; more than 0.3 m (1.0 ft) near Arbuckle in southern Colusa County; and more than 0.46 m (1.5 ft) in central Yolo County between Zamora and Davis (Lofgren and Ireland, 1973). Sixty miles of geodetic re-leveling was done by the NGS during 1987 to determine whether subsidence rates were within the tolerances specified for siting the proposed Super-Conducting Super Collider (SSC) at Davis or Stockton. Lofgren and others (undated report) determined that subsidence rates were similar to rates determined from historical leveling. (Neither location was selected for the SSC.) Elevation losses
Topic: Groundwater Land Subsidence from Groundwater Use in California
CA Water Plan Update 2013 Vol 4 Reference Guide Page 68

APRIL 2014 REPORT OF FINDINGS Land Subsidence from Groundwater Use in California
LSCE, BORCHERS AND CARPENTER 49
since 1949 ranging from 0.73 ft to 3.9 ft at five bench marks in the Sacramento Valley, damage to concrete pads at irrigation wells, and an increased extent of flooding were documented in the southern Sacramento Valley between Knights Landing and Stockton, California (Blodgett et al., 1990). GPS and spirit leveling by Blodgett and others (1990) and Ikehara and others (1994) identified a north-south trending zone of maximum subsidence where elevation loss ranged from 0.4 m (1.3 ft) to 1.6 m (5.4 ft) between Dixon and Zamora. Most geodetic monuments in the southern Sacramento Valley showed a loss of elevation (Ikehara et al., 1994). The area of greatest subsidence is south of the terminus of the Tehama Colusa Canal, where agriculture developed relying solely on groundwater for irrigation (Figure 4-20). A 1,000 ft-deep extensometer (11N01E24Q008M) constructed in the area of maximum subsidence north of Woodland (Figure 4-23B) measured an average annual inelastic compaction of about 55 mm/yr (0.18 ft/yr) during 1988-1992 (Ikehara, 1995). The average annual rate of subsidence since 1988 is 15.5 mm/yr (0.051 ft/yr) (Bill Ehorn, DWR, written commun. July 2, 2013); thus, inelastic compaction at the extensometer site continues, but has slowed considerably since 1992. Borehole extensometers at 10 other locations in the Sacramento Valley operated by DWR indicate that substantial subsidence has not occurred in the areas monitored (See Section 5). The magnitude of permanent land subsidence observed throughout the southwestern Sacramento Valley indicates that groundwater levels have dropped below the preconsolidation head, the historically lowest water level, sometimes called the critical head, beyond which inelastic compaction of aquifer-system sediments is triggered. A comparison of video logs, collected with downhill television cameras (Figure 4-23B) and groundwater-levels showed that damaged wells had experienced historically low water levels. Intact wells either were not experiencing historically low water levels, or were constructed subsequent to the 1976-1977 drought that had stressed the aquifer system (Borchers et al., 1998). Rapid rates of subsidence during droughts may have contributed to the well damage. If coupling between a well casing and the adjacent sediments is strong, compacting aquifer systems grip the casing and exert a downward thrust that creates compressional force powerful enough to cause a steel well casing to fail and collapse telescopically. Several photographs from the video scans illustrate casings that failed in this manner (Figure 4-24). If sediments are not well-bonded to casings, they will settle around the well and the casing will appear to protrude from the land surface. This phenomenon commonly occurred in the southwestern Sacramento Valley during the 1976-1977 drought; it also occurred in the San Joaquin Valley when groundwater levels dropped below historically low levels there (Poland and Ireland, 1965).
Topic: Groundwater Land Subsidence from Groundwater Use in California
CA Water Plan Update 2013 Vol 4 Reference Guide Page 69

APRIL 2014 REPORT OF FINDINGS Land Subsidence from Groundwater Use in California
LSCE, BORCHERS AND CARPENTER 50
Figure 4-23. A) Elevation change measured by GPS surveys in Yolo County in 1999 and 2008 (Jim Frame, Frame Surveying, written commun. July 2013), and B) location of: intact wells and wells damaged by land subsidence; of the Woodland extensometer (11N01E24Q008M); and selected physical features in the southwestern Sacramento Valley (from Borchers et al., 1998). A B C
Figure 4-24. Well casings damaged by vertical compression during land subsidence in the Sacramento Valley: A) rippling of perforated steel casing during early stages of compression; B) deformation and ripping of slotted steel casing 400 ft below land surface; and C) crumpled vertical ribbing of the stainless steel well screen 207 ft below land surface produces a radiating effect. Well interiors are illuminated by a light suspended below the camera lens.
A
B
Topic: Groundwater Land Subsidence from Groundwater Use in California
CA Water Plan Update 2013 Vol 4 Reference Guide Page 70
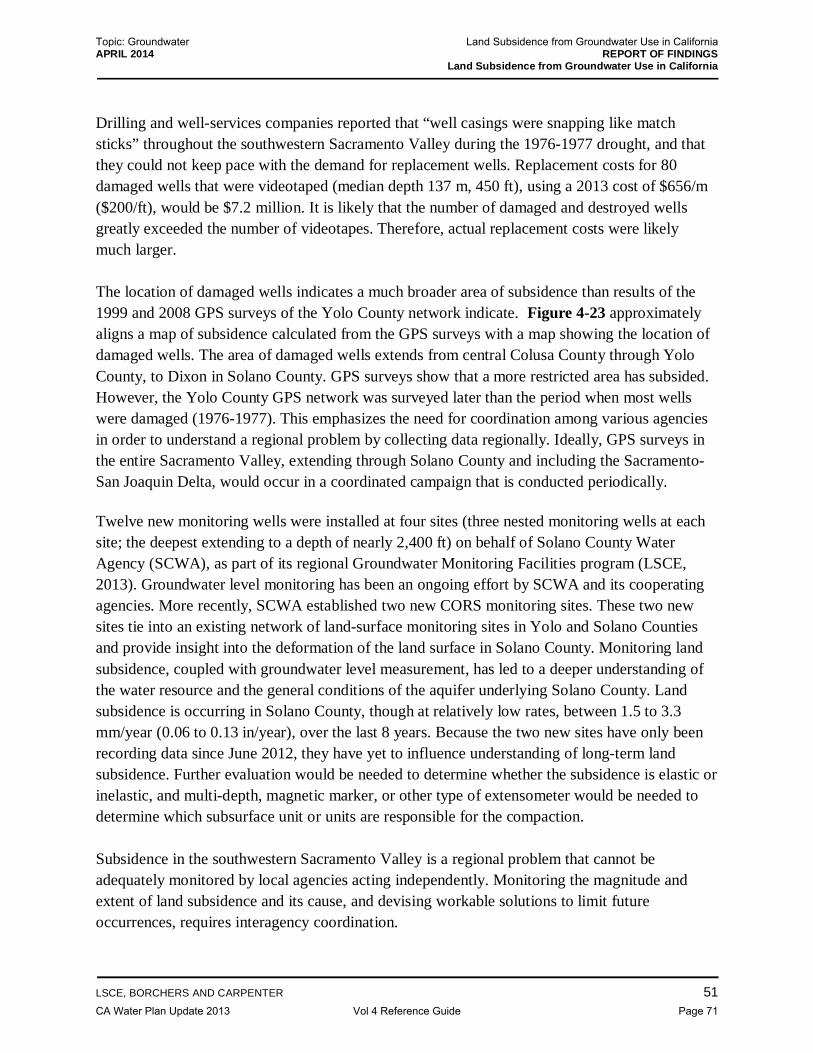
APRIL 2014 REPORT OF FINDINGS Land Subsidence from Groundwater Use in California
LSCE, BORCHERS AND CARPENTER 51
Drilling and well-services companies reported that “well casings were snapping like match sticks” throughout the southwestern Sacramento Valley during the 1976-1977 drought, and that they could not keep pace with the demand for replacement wells. Replacement costs for 80 damaged wells that were videotaped (median depth 137 m, 450 ft), using a 2013 cost of $656/m ($200/ft), would be $7.2 million. It is likely that the number of damaged and destroyed wells greatly exceeded the number of videotapes. Therefore, actual replacement costs were likely much larger. The location of damaged wells indicates a much broader area of subsidence than results of the 1999 and 2008 GPS surveys of the Yolo County network indicate. Figure 4-23 approximately aligns a map of subsidence calculated from the GPS surveys with a map showing the location of damaged wells. The area of damaged wells extends from central Colusa County through Yolo County, to Dixon in Solano County. GPS surveys show that a more restricted area has subsided. However, the Yolo County GPS network was surveyed later than the period when most wells were damaged (1976-1977). This emphasizes the need for coordination among various agencies in order to understand a regional problem by collecting data regionally. Ideally, GPS surveys in the entire Sacramento Valley, extending through Solano County and including the Sacramento-San Joaquin Delta, would occur in a coordinated campaign that is conducted periodically. Twelve new monitoring wells were installed at four sites (three nested monitoring wells at each site; the deepest extending to a depth of nearly 2,400 ft) on behalf of Solano County Water Agency (SCWA), as part of its regional Groundwater Monitoring Facilities program (LSCE, 2013). Groundwater level monitoring has been an ongoing effort by SCWA and its cooperating agencies. More recently, SCWA established two new CORS monitoring sites. These two new sites tie into an existing network of land-surface monitoring sites in Yolo and Solano Counties and provide insight into the deformation of the land surface in Solano County. Monitoring land subsidence, coupled with groundwater level measurement, has led to a deeper understanding of the water resource and the general conditions of the aquifer underlying Solano County. Land subsidence is occurring in Solano County, though at relatively low rates, between 1.5 to 3.3 mm/year (0.06 to 0.13 in/year), over the last 8 years. Because the two new sites have only been recording data since June 2012, they have yet to influence understanding of long-term land subsidence. Further evaluation would be needed to determine whether the subsidence is elastic or inelastic, and multi-depth, magnetic marker, or other type of extensometer would be needed to determine which subsurface unit or units are responsible for the compaction. Subsidence in the southwestern Sacramento Valley is a regional problem that cannot be adequately monitored by local agencies acting independently. Monitoring the magnitude and extent of land subsidence and its cause, and devising workable solutions to limit future occurrences, requires interagency coordination.
Topic: Groundwater Land Subsidence from Groundwater Use in California
CA Water Plan Update 2013 Vol 4 Reference Guide Page 71

APRIL 2014 REPORT OF FINDINGS Land Subsidence from Groundwater Use in California
LSCE, BORCHERS AND CARPENTER 52
Results from groundwater modeling by the USGS suggest that land subsidence may have occurred at several locations in the northern Sacramento Valley (Williamson, et al., 1989; Faunt, et al., 2009); but, published reports of land subsidence investigations in these areas were not located.
4.4 Antelope Valley
Groundwater accounts for as much as 90 percent of the water supply for agricultural and urban uses in the Antelope Valley in the western Mojave Desert east of Los Angeles. In the city of Lancaster where the population quadrupled between 1977 and 2010, extensive pumping contributed to groundwater level declines of as much as 91.4 m (300 ft) since the 1930s. At Edwards Air Force Base (EAFB) groundwater levels declined as much as 45.7 m (150 ft) between 1915 and 1991. A regional relationship between land subsidence and groundwater-level declines in the central Antelope Valley was established on the basis of geodetic and hydrologic monitoring during 1926-1992 (Ikehara and Phillips, 1994). Subsidence of 2 m (more than 6 ft) near Lancaster and more than 1 m (3 ft) at the southern edge of Rogers Lake resulted from groundwater pumping that vastly exceeded recharge to the aquifer system (Figure 4-25). At EAFB, differential subsidence caused sink-like depressions, polygonal cracks, and earth fissures (Figure 4-26) on the playa surface of Rogers Lake bed, adversely affecting the runways on the lake bed that were being used for landing aircraft. Numerical modeling at the 840 ft (256 m) deep Holly extensometer site at EAFB indicated that two thick confining units account for most of the compaction measured there (Sneed and Galloway, 2000). Due to the thickness and low permeability of these confining units, only half the ultimate compaction would occur during the 30 years subsequent to the modeling. Residual compaction and land subsidence from slowly draining confining units is a legacy of groundwater mining and must be carefully considered in long-term management of land and water resources at EAFB. A 600-meter-long (0.37 mi-long), 2.3-meter-deep (7.5 ft-deep) fissure located about 11 km east-northeast of Lancaster was first noticed in 1978 after it flooded (Holzer, 1984). The fissure grew eastward after floods in 1980. Because no recent faulting or seismicity had occurred when the fissure was discovered, and because of its similarity to other human-induced fissures, its formation was attributed to historical water-level declines of 75 m (245 ft) that had occurred prior to its appearance (Holzer, 1984). In addition to earth fissures, other negative consequences of land subsidence in Antelope Valley include altered drainage gradients; increased flooding and erosion; failed well casings; and structural damage to roads, buildings, pipelines, canals, homes, and other structures.
Topic: Groundwater Land Subsidence from Groundwater Use in California
CA Water Plan Update 2013 Vol 4 Reference Guide Page 72
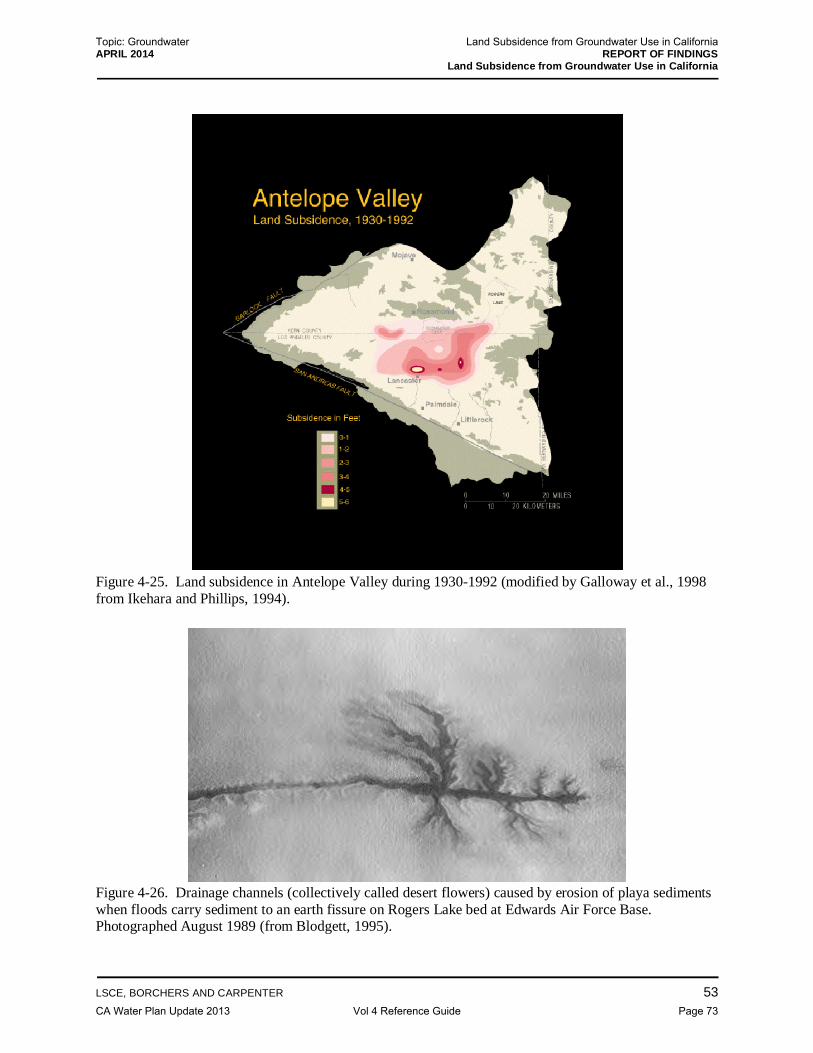
APRIL 2014 REPORT OF FINDINGS Land Subsidence from Groundwater Use in California
LSCE, BORCHERS AND CARPENTER 53
Figure 4-25. Land subsidence in Antelope Valley during 1930-1992 (modified by Galloway et al., 1998 from Ikehara and Phillips, 1994).
Figure 4-26. Drainage channels (collectively called desert flowers) caused by erosion of playa sediments when floods carry sediment to an earth fissure on Rogers Lake bed at Edwards Air Force Base. Photographed August 1989 (from Blodgett, 1995).
Topic: Groundwater Land Subsidence from Groundwater Use in California
CA Water Plan Update 2013 Vol 4 Reference Guide Page 73

APRIL 2014 REPORT OF FINDINGS Land Subsidence from Groundwater Use in California
LSCE, BORCHERS AND CARPENTER 54
During 1993-1995, InSAR was used to measure about 40 mm (1.57 in) of subsidence at an extensometer site in the Antelope Valley (Figure 4-27); the extensometer measured 31 mm (1.22 in) of subsidence. This disparity indicates that 20 percent of the subsidence could have occurred below the maximum depth of the extensometer 256 m (840 ft). InSAR imagery was also used to evaluate a computer model that simulated land subsidence and groundwater flow. These results highlight the potential use of InSAR to better constrain computer models of land subsidence to aid resource planning and management (Galloway et al., 1998; Hoffmann et al., 2003). A B
Figure 4-27. A) Subsidence in the Antelope Valley, California during 1993-1994 from computer modeling (white contours) and an InSAR interferogram during the same period. B) Period of the interferogram shown on a plot of water levels and aquifer compaction measured at the Holly extensometer site at Edwards Air Force Base (originally from Galloway et al., 1998; modified from Bawden et al., 2003). Facing future population growth and limited options for alternative water sources, water managers in Antelope Valley are seeking ways to make the best use of currently available resources. Injection of treated State Water Project water into the aquifer system during the winter (when it is most available) for later use in the summer (the peak demand period) is one potential element of a groundwater management plan. The USGS in cooperation with the Los Angeles County Department of Public Works (LACDPW) and the Antelope Valley–East Kern Water Agency (AVEK) conducted a series of freshwater injection, storage, and recovery tests in the Lancaster area from September 1995 through September 1998 as part of a study to evaluate the feasibility of artificial recharge via injection wells in the Lancaster area. Aquifer compaction and expansion and barometric pressure were measured at a dual extensometer site (shallow and deep extensometers, 735 ft (224 m) and 1,205 ft (367 m) deep, respectively). Water levels were monitored at 13 active and abandoned production wells and 10 nested piezometers. Microgravity was measured at 31 stations. Geodetic data were collected at 124 vertical-control bench marks, one permanent and one temporary continuous Global Positioning System (GPS) stations, and three tiltmeters. Water-chemistry samples were collected from 17 active production wells and the 10 nested piezometers. Flow data were collected using meters mounted on two wells used for water injection. The testing program and subsequent development of a simulation/optimization model helped evaluate the effectiveness of an injection program for halting the decline of
Topic: Groundwater Land Subsidence from Groundwater Use in California
CA Water Plan Update 2013 Vol 4 Reference Guide Page 74

APRIL 2014 REPORT OF FINDINGS Land Subsidence from Groundwater Use in California
LSCE, BORCHERS AND CARPENTER 55
groundwater levels and avoiding future land subsidence while meeting increasing groundwater demand (Phillips et al., 2003).
4. 5 Mojave River Basin and Vicinity
The Mojave River Basin is located in eastern San Bernardino County. California desert basins are areas of current or expected high water demand and are underlain by thick unconsolidated aquifer systems. Because surface water is scarce, groundwater has been the source of water for agricultural, industrial, and municipal uses throughout the Mojave Desert since the early 1900s (Sneed et al., 2001). Unplanned and unmonitored development of groundwater has produced unanticipated land subsidence when aquifer systems transitioned from elastic compression to inelastic compaction. The results included an increase in the extent of inland flooding, damaged engineered infrastructure, and the sudden appearance and erosional enlargement of destructive earth fissures, which have become permanent features of the landscape. The Fremont Valley, a deep, closed alluvial basin within the Garlock Fault zone at the southern terminous of the Sierra Nevada and just north from Antelope Valley, contains an aquifer system composed of as much as 275 m (900 ft) of sedimentary materials (Holzer, 1984). Prior to 1920, wells in the valley center flowed; by 1977, water levels in the central part of the valley had declined as much as 74 m (243 ft) primarily in response to increased irrigation pumpage (Holzer, 1984). Subsidence caused by groundwater withdrawal was documented by Pampeyan and others (1988). Data were too sparse to map subsidence, but subsidence of 0.48 m (2 ft) was measured between 1962 and 1978 on two leveling lines distant from the pumping centers in the valley. Subsidence near the valley center was likely considerably greater. Koehn Lake, a playa in the northeastern part of the valley, floods during winter rains. Subsidence has tilted the playa surface so that when surface water ponds on the playa, it also floods the area southwest of the playa where subsidence is centralized. Fremont Valley contains numerous faults associated with the Garlock Fault system. These faults act as barriers to groundwater flow, which prevent groundwater on one side of a fault from responding to pumping wells on the other. As a result, sediments compact on one side of the fault only. This differential compaction creates a step in the topography at the outcrop of the fault (the fault scarp) (Figure 4-28). If differential subsidence occurs gradually as the water levels decline, movement at the fault is slow and the fault is said to ‘creep’. It can be difficult to distinguish creeping tectonic motion from creeping motion due to differential compaction. Large earth fissures owing to differential compaction between areas where aquifer thickness varies substantially also formed in the Fremont Valley. Because both fault creep and earth fissures were coincident with times of increased pumpage and declining groundwater levels, both effects are believed to be related to groundwater development activities (Holzer, 1984).
Topic: Groundwater Land Subsidence from Groundwater Use in California
CA Water Plan Update 2013 Vol 4 Reference Guide Page 75
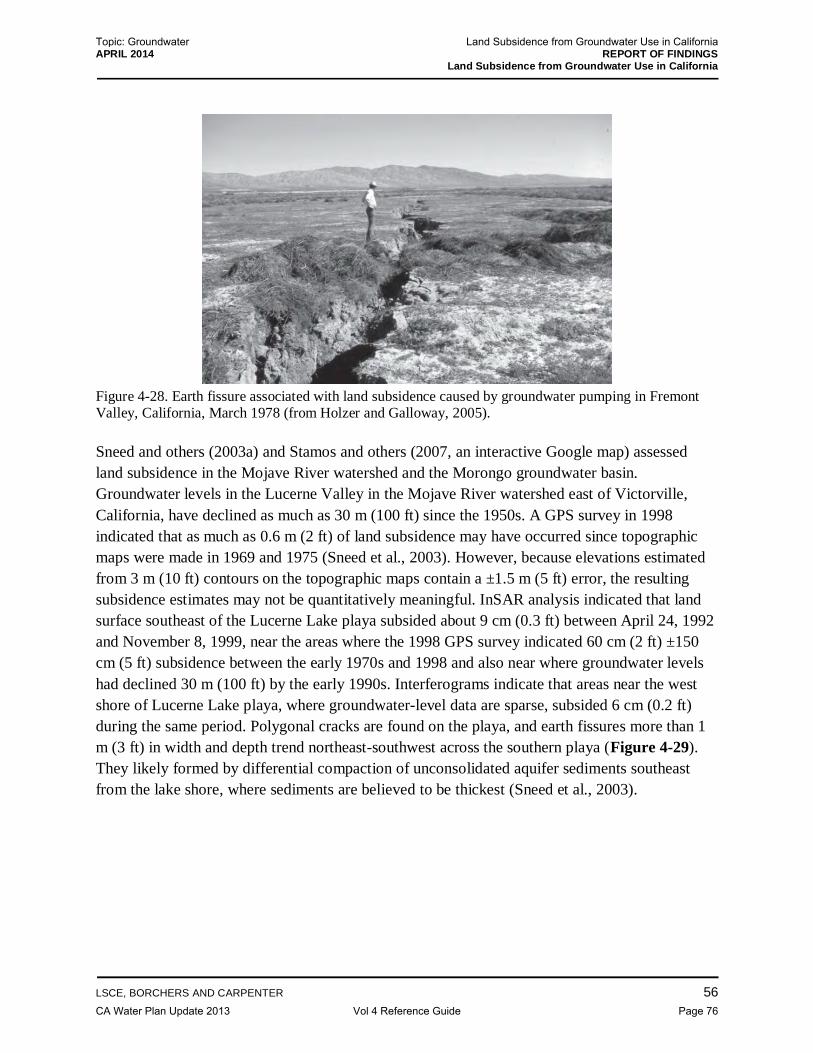
APRIL 2014 REPORT OF FINDINGS Land Subsidence from Groundwater Use in California
LSCE, BORCHERS AND CARPENTER 56
Figure 4-28. Earth fissure associated with land subsidence caused by groundwater pumping in Fremont Valley, California, March 1978 (from Holzer and Galloway, 2005). Sneed and others (2003a) and Stamos and others (2007, an interactive Google map) assessed land subsidence in the Mojave River watershed and the Morongo groundwater basin. Groundwater levels in the Lucerne Valley in the Mojave River watershed east of Victorville, California, have declined as much as 30 m (100 ft) since the 1950s. A GPS survey in 1998 indicated that as much as 0.6 m (2 ft) of land subsidence may have occurred since topographic maps were made in 1969 and 1975 (Sneed et al., 2003). However, because elevations estimated from 3 m (10 ft) contours on the topographic maps contain a ±1.5 m (5 ft) error, the resulting subsidence estimates may not be quantitatively meaningful. InSAR analysis indicated that land surface southeast of the Lucerne Lake playa subsided about 9 cm (0.3 ft) between April 24, 1992 and November 8, 1999, near the areas where the 1998 GPS survey indicated 60 cm (2 ft) ±150 cm (5 ft) subsidence between the early 1970s and 1998 and also near where groundwater levels had declined 30 m (100 ft) by the early 1990s. Interferograms indicate that areas near the west shore of Lucerne Lake playa, where groundwater-level data are sparse, subsided 6 cm (0.2 ft) during the same period. Polygonal cracks are found on the playa, and earth fissures more than 1 m (3 ft) in width and depth trend northeast-southwest across the southern playa (Figure 4-29). They likely formed by differential compaction of unconsolidated aquifer sediments southeast from the lake shore, where sediments are believed to be thickest (Sneed et al., 2003).
Topic: Groundwater Land Subsidence from Groundwater Use in California
CA Water Plan Update 2013 Vol 4 Reference Guide Page 76

APRIL 2014 REPORT OF FINDINGS Land Subsidence from Groundwater Use in California
LSCE, BORCHERS AND CARPENTER 57
Figure 4-29. Earth fissure near the southeast edge of Lucerne Lake playa in the Mojave Desert, California. View is to the northeast, with a five-gallon bucket for scale (Sneed et al., 2003a, Fig. 6 B). InSAR analyses show a large L-shaped pattern of land subsidence near the southeastern tip of the dry El Mirage Lake about 14 km (8.7 mi) northwest of Victorville (Sneed et al., 2003a). Interferograms indicate subsidence of as much as 50 mm (0.16 ft) during April 21, 1995-May 1, 1999. Groundwater-level data are sparse in the area during the period of the interferograms, but groundwater-flow simulations by Stamos and others (2001) indicate that water levels declined as much as 53 m (175 ft) in the regional aquifer south of El Mirage Lake during 1950-1999. Much of the water-level decline in the area may have occurred before the adjudication of the Mojave Basin area (January 1996) that resulted in decreased pumpage. Subsidence measured during 1995-1999 may result partly from residual compaction in response to earlier groundwater-level declines. InSAR analyses show a persistent pattern of deformation along the northern and eastern shores of the Harper Dry Lake playa near Lockhart, California. Interferograms show that the area subsided as much as 85 mm (0.28 ft) during 1992-1999 (Sneed et al., 2003a). Because groundwater levels declined 27 m (90 ft) to their lowest historical level between the late 1960s and 1999 (Stamos et al., 2001), the subsidence indicated on the interferograms may be a result of inelastic compaction. InSAR analyses show a persistent pattern of deformation about 10 km (6 mi) east from Newberry Springs California, near Troy Dry Lake (dry). Interferograms show that the area subsided as much as 45 mm (0.15 ft) during 1993-1999. No water-level data are available near Troy Lake, but groundwater levels in wells between Troy Lake and Newberry Springs declined about 3 m (10 ft) during 1993-1999, and Stamos and others (2001) determined that groundwater levels declined as much as 70 m (225 ft) in these areas between the early 1940s and 1999.
Topic: Groundwater Land Subsidence from Groundwater Use in California
CA Water Plan Update 2013 Vol 4 Reference Guide Page 77

APRIL 2014 REPORT OF FINDINGS Land Subsidence from Groundwater Use in California
LSCE, BORCHERS AND CARPENTER 58
Lithologic logs for wells near subsiding areas at Troy Lake indicate that sediments are predominantly clayey. Because clays are highly compressible, and water levels were likely at their historical low levels each summer during 1993-1999, it is likely that the subsidence measured near Troy Lake is a permanent result of inelastic compaction of aquifer sediments. The USGS, in cooperation with the Fort Irwin National Training Center (NTC) in the Mojave Desert, is investigating the mechanisms driving deformation on the surface of Bicycle Lake Playa. Bicycle Lake Playa contains the runways used to transport troops and supplies to Fort Irwin; its stability is of great concern to the NTC. An earth fissure and sink-like depressions appeared on the playa in 2005 (Densmore, et al., 2010). Giant desiccation cracks have also been observed. Increased groundwater pumping in the 1990s lowered groundwater levels 25 m (82 ft) by 2009 and contributed to 270 mm (10.6 in) of land subsidence during 1993-2006. Future work will determine the driving mechanism for playa surface fissuring—inelastic compaction of aquifer sediments or desiccation-triggered fissuring, or a combination of the two. Preliminary results indicate that the fissure opens at a rate of 1-2 mm/yr (0.04-0.08 in/yr), perhaps responding to groundwater level declines of about 4 m (13 ft) during 2008-2009. Data collected from a horizontal extensometer, surveying, electronic distance measurements, tiltmeters, heat dissipation sensors, and tripod mounted LIDAR scans will be employed to evaluate the cause of the fissures and their relation to desiccation cracks, and perhaps to provide real-time monitoring of fissure hazards (Densmore, et al., 2010).
4.6 Coachella Valley
The Coachella Valley is located in Riverside County and extends 45 miles from the San Bernardino Mountains to the northern shore of the Salton Sea. Groundwater has been a major source of agricultural, municipal, and domestic water supply in the Coachella Valley since the early 1920s. Groundwater levels declined throughout the Coachella Valley from the 1920s until 1949. In 1949, imports of surface water from the Colorado River to the southern Coachella Valley began, resulting in decreased pumping and a recovery of water levels in some areas. Since the 1970s, demand for water in the southern Coachella Valley has exceeded the deliveries of the imported surface water, and water levels have again declined. The declining water levels have the potential to induce or renew land subsidence in the Coachella Valley (Sneed, USGS, oral communication, May 30, 2013). A large earth fissure was discovered in 1948 about 3 km (2 mi) north of Lake Cahuilla in La Quinta. Because subsidence had not been documented in the southern parts of the Coachella Valley prior to a report by Ikehara and others (1997), it is not known whether this fissure formed in response to differential land subsidence during an early period (early 1920s-late 1940s) of groundwater-level declines. However, fissuring has since recurred in this area (Michelle Sneed, USGS, oral commun. May 30, 2013, citing Clay Stevens, TerraPacific Consultants, Inc., written commun., 2006).
Topic: Groundwater Land Subsidence from Groundwater Use in California
CA Water Plan Update 2013 Vol 4 Reference Guide Page 78

APRIL 2014 REPORT OF FINDINGS Land Subsidence from Groundwater Use in California
LSCE, BORCHERS AND CARPENTER 59
Concerns about land subsidence prompted the Coachella Valley Water District (CVWD) to contact the USGS to cooperatively establish and operate a land subsidence monitoring network. Monitoring results are reported in Ikehara and others (1997), and Sneed and others (2001, 2002, 2007), and via communication with Sneed (Michelle Sneed, U. S. Geological Survey, oral communication, September 2013). InSAR measurements made between June 27, 1995 and September 19, 2010 indicate that land subsidence ranging from about 22 to 60 cm (0.72 to 1.97 feet) occurred near Palm Desert, Indian Wells, and La Quinta (Figure 4-30). Average subsidence rates in Palm Desert were relatively stable increasingly only from about 3.9 cm/yr (0.13 ft) during the period 1995-2000 to about 4.5 cm/yr (0.15 ft/yr) during the period 2003-2010. Average subsidence rates for two subsidence maxima in Indian Wells were about 3.4 and 2.6 cm/yr (0.11 and 0.09 ft/yr) for both periods, indicating fairly steady subsidence; average subsidence rates for the third maxima in Indian Wells increased from about 1.4 to 1.9 cm/yr (0.05 to 0.06 ft/yr) between the two periods. Average subsidence rates for five selected locations in the La Quinta subsidence area ranged from about 1.7 to 3.7 cm/yr (0.06 to 0.12 ft/yr) during the period 1995-2000; three of the locations had similar rates during the period 2003–mid-2009 while the other two locations had increased subsidence rates. Recently, earth fissuring has reoccurred near La Quinta and differential compaction that damaged homes there has resulted in litigation. Differential compaction that damaged homes in the Indian Wells area also has been recently reported. A subsidence profile covering about 27 mi of the Coachella Branch of the All American Canal showed that the canal had subsided as much as 41.2 cm (1.35 ft) in the La Quinta area during June 27, 1995 to September 19, 2010. The areas that have subsided in the Coachella Valley between 1996 and 2010 are coincident with locations where groundwater levels declined, both during this period and during most of the past century. In the northern and central parts of the study area, where substantial subsidence was measured by 2010, water levels exhibited long-term declines during 1995-2010. The subsidence in these areas is likely to be mostly permanent because water levels have declined to historically low levels. The CVWD has had initial success in halting declining water levels and subsidence in the La Quinta area, where subsidence rates slowed or land surface slightly rebounded during mid-2009-2010 as water levels rose in response to deliveries of Colorado River water to groundwater recharge facilities. The correspondence between the timing of increased deliveries and significant water-level recoveries suggests that the water applied to the recharge ponds is effectively recharging the aquifer system, although reduced groundwater pumping also can cause water-level recovery. The water-supply portfolio of the Coachella Valley is changing again as Colorado River water allocations are changed, complex water transfers according to the Quantification Settlement Agreement are implemented, and mitigation measures are instituted, including tiered rate structures, aquifer-recharge projects, and conversion from groundwater to
Topic: Groundwater Land Subsidence from Groundwater Use in California
CA Water Plan Update 2013 Vol 4 Reference Guide Page 79

APRIL 2014 REPORT OF FINDINGS Land Subsidence from Groundwater Use in California
LSCE, BORCHERS AND CARPENTER 60
surface water resources for (primarily) golf course irrigation via the Mid-Valley Pipeline Project. The CVWD is encouraging golf courses and other landscape irrigators to employ reclaimed water for irrigation purposes. An effective land subsidence monitoring program helps water managers assess the effects of groundwater recharge, water reuse, and conservation efforts.
Figure 4-30.Stacked and kriged interferogram in the Coachella Valley, California for June 27, 1995–September 19, 2010 (excludes November 8, 2000–November 30, 2003), showing areas of subsidence, geologic features, and GPS monitoring network components. (interferogram construction is described in Section 5) From north to south the subsiding areas are, Palm Desert, Indian Wells, and La Quinta. Maximum subsidence in the southern Coachella Valley is estimated to be about 600 mm during the period. (Courtesy o the USGS and the CVWD). (Modified from: Michelle Sneed, U. S. Geological Survey, written commun., March 3, 2014).
Topic: Groundwater Land Subsidence from Groundwater Use in California
CA Water Plan Update 2013 Vol 4 Reference Guide Page 80

APRIL 2014 REPORT OF FINDINGS Land Subsidence from Groundwater Use in California
LSCE, BORCHERS AND CARPENTER 61
4.7 Los Angeles
The greater Los Angeles metropolitan area experiences surface deformation due to a variety of natural and human-induced causes. Because tectonic deformation, oil-field operations, and groundwater extraction and injection occur in overlapping proximity, it has proved difficult to determine the cause of observed deformations using standard surveying techniques. Human-induced land deformation also produces horizontal surface motion that obscures, or in some cases mimics, the tectonic signals expected from the blind thrust faults beneath Los Angeles (Bawden et al., 2001). Through the use of continuous GPS, InSAR (both methods described in Section 5), and groundwater-level data, Bawden and others (2001, 2003) were able to measure the separate deformations attributed to tectonic movement on strike-slip faults, tectonic contraction on blind thrust faults, seasonal groundwater pumping, year-round artificial groundwater recharge, and hydrocarbon withdrawal at oil fields (oil-field subsidence processes are described in Appendix A). The following information and illustrations are from Bawden and others (2001, 2003). In metropolitan Los Angeles, interferograms identified widespread seasonal and longer-term surface deformation related to both groundwater and hydrocarbon production. The largest coherent feature in the May–September 1999 interferogram (Figure 4-31) is the 40-km long Santa Ana Basin, where groundwater pumping and artificial recharge produced as much as 6 cm (0.2 ft) of seasonal subsidence and 4 cm (0.13 ft) of uplift, respectively, with as much as 2 cm (0.1 ft) of net subsidence in April 1998–May 1999 (Figure 4-32A). Faults and geologic structures can impede the flow of groundwater and can be recognized as linear InSAR features where groundwater levels decline on one side of the fault or rise on the other. The Newport-Inglewood Fault bounds the southwest margin of the Santa Ana Basin (Figure 4-32B). InSAR shows that an abrupt boundary to groundwater flow nearly coincides with the fault. The boundary is indicated by a bunching of the color fringes on the northeast side of the fault, showing that the land surface displacements are steepest where the fault barrier prevents groundwater west of the fault from flowing toward subsiding pumping centers farther to the east. Subsidence caused by pumping groundwater northeast of the fault does not affect areas southwest of the fault.
Topic: Groundwater Land Subsidence from Groundwater Use in California
CA Water Plan Update 2013 Vol 4 Reference Guide Page 81

APRIL 2014 REPORT OF FINDINGS Land Subsidence from Groundwater Use in California
LSCE, BORCHERS AND CARPENTER 62
Figure 4-31. Terrain and InSAR image of Los Angeles and Santa Ana Basin shown as a location map for Figures 4-32 A, B, C, D, and E (from Bawden et al., 2003).
Topic: Groundwater Land Subsidence from Groundwater Use in California
CA Water Plan Update 2013 Vol 4 Reference Guide Page 82

APRIL 2014 REPORT OF FINDINGS Land Subsidence from Groundwater Use in California
LSCE, BORCHERS AND CARPENTER 63
Figure 4-32A. Subsidence and uplift of land surface along profile A-A’ in response to seasonal deformation during April 1998-May 1999 (from Bawden et al., 2003).
Figure 4-32B-C. B) Interferogram east of Long Beach shows that groundwater flow is impeded by a groundwater barrier nearly coincident with the Newport-Englewood Fault (May-September 1999) (from Bawden et al., 2003). C) Interferogram shows long-term subsidence (October 1993–October 1998) in most of the Santa Anna basin (from Bawden et al., 2003). Many of the observed deformation features are long-lasting and exhibit substantial subsidence. Declining groundwater levels near Santa Ana caused the land surface there to subside at a long-term rate of about 2 cm per year (0.08 ft/year) (Figure 4-32A, C). Using precise leveling, oil production and oilfield water injection volumes, shallow groundwater extraction volumes and groundwater level data, Erickson (1977) concluded that subsidence from oilfield operations at the Beverly Hills Oil Field amounted to no more than a few hundredths of a foot per year (1.5 cm/yr maximum during 1967-1973). Using InSAR, Bawden and others (2003) identified a high resolution bullseye feature (Figure 4-32D) typical of interferograms showing deformation from oilfield operations. Subsidence resulted in an oval subsidence bowl. The two studies (Erickson, 1977; Bawden et al., 2003) indicated similar annual rates of subsidence at the oil field but, using InSAR, Bawden and others (2003) rapidly produced a detailed, high resolution map of subsidence over the entire field.
Topic: Groundwater Land Subsidence from Groundwater Use in California
CA Water Plan Update 2013 Vol 4 Reference Guide Page 83

APRIL 2014 REPORT OF FINDINGS Land Subsidence from Groundwater Use in California
LSCE, BORCHERS AND CARPENTER 64
Figure 4-32D. Interferogram showing subsidence at the Beverly Hills Oil Field during October 1993-October 1998 (from Bawden et al., 2003).
4.8 Chino
The Chino Groundwater Basin in the southwestern corner of San Bernardino County includes the cities of Chino, Chino Hills, Pomona, Ontario, and Upland. Water levels declined more than 40 m (131 ft) from the early 1900s through 1978. As much as 1.2 m (3.9 ft) of subsidence occurred during 1986-1993 (Stewart and others, 1998). Earth fissures developed as early as 1973 and again during 1987-1995 in conjunction with 0.7 m (2.3 ft) of subsidence (Wildermuth Environmental, 2007). The earth fissures developed along a zone of flexuring or differential subsidence associated with an inferred fault-zone groundwater barrier in the deep aquifer (Figures 4-32E and 4-33). With a possible depth of deformation of as much as 420 m (1,400 ft), the Chino fissure zone may be more than 200 m (600 ft) wide. It extends almost 3,200 m (2 mi) from the California Institute for Men prison, where it exists as two parallel fissures, to Chino Avenue. In the 1990s, it emptied a liquid manure pond and split a house that was then condemned and demolished at what is now a vacant lot for storage at 5500 Daniels Street. Limited repeated horizontal-distance surveys and leveling at Daniels Street over monuments spaced 3 m (10 ft) apart indicated a crack zone of more than 30 m (100 ft) with a possible graben (downdropped) block 3 m (10 ft) wide. Buried end-to-end quartz-tube horizontal extensometers that span 51 m (167) ft across the crack zone have exhibited more than 2 mm (0.08 in.) of predominantly elastic opening and closing in response to about 22 m (72 ft) of drawdown and recovery in a nearby observation well. In spite of being elastic, the measured strains are about 40 percent of the lowest value of strain-at-failure as provided by Jachens and Holzer (1982).
Topic: Groundwater Land Subsidence from Groundwater Use in California
CA Water Plan Update 2013 Vol 4 Reference Guide Page 84

APRIL 2014 REPORT OF FINDINGS Land Subsidence from Groundwater Use in California
LSCE, BORCHERS AND CARPENTER 65
Figure 4-32E. Interferogram showing subsidence near Pomona-Chino during 1993-1995 (from Bawden et al., 2003).
Figure 4-33. Interferogram during January 1996 – April 2000, showing subsidence bounded by faults and earth fissures in Chino (Wildermuth Environmental, 2007). Differential subsidence across the San Jose Fault and Central Avenue Fault is visible.
4.9 Paso Robles Area
As in much of California, the population of San Luis Obispo County has grown substantially. Land has been converted from dry farming and grazing to irrigated agriculture and urban development. Groundwater has been relied upon to make up for shortages of surface water. Valentine and others (2001) used InSAR techniques to determine that three areas northeast of
Topic: Groundwater Land Subsidence from Groundwater Use in California
CA Water Plan Update 2013 Vol 4 Reference Guide Page 85

APRIL 2014 REPORT OF FINDINGS Land Subsidence from Groundwater Use in California
LSCE, BORCHERS AND CARPENTER 66
Paso Robles and one area northeast of Atascadero subsided during March 28-August 15, 1997 (Figure 4-34). The maximum downward displacement northeast of Paso Robles during this 6-month period was 2 cm (0.8 in), whereas groundwater levels declined about 18 m (60 ft) during the same period (Valentine et al., 2001). It is likely that concentrated pumping is responsible for localized land subsidence. The small area of deformation in the Atascadero area subsided 2.8 to 5.6 cm (about 1 to 2 in), coincident with seasonal water-level declines of about 16 m (54 ft). Small amounts of subsidence owing to seasonal changes in groundwater levels may be elastic and recoverable. However, during 2013 substantially declining groundwater levels have been reported. Many formerly reliable wells have gone dry. Interferograms spanning 1997-2013 could indicate whether declining groundwater levels have triggered inelastic compaction of aquifer sediments and permanent subsidence in Paso Robles area.
Figure 4-34. Interferogram of the Paso Robles area showing four areas of likely subsidence during March 28-August 15, 1997 (modified from Valentine and others, 2001).
4.10 San Luis Obispo Area
The city of San Luis Obispo, about 20 miles inland from the central California coast at Morro Bay, is dependent on local water sources, including surface reservoirs and groundwater, for municipal water supplies. Water shortages became severe during the 1987-1992 drought.
Topic: Groundwater Land Subsidence from Groundwater Use in California
CA Water Plan Update 2013 Vol 4 Reference Guide Page 86

APRIL 2014 REPORT OF FINDINGS Land Subsidence from Groundwater Use in California
LSCE, BORCHERS AND CARPENTER 67
Mandatory water rationing was enforced in 1989. When one of the two surface-water reservoirs dropped to its minimum pool elevation in 1990, the city increased groundwater extraction dramatically to meet water demands (Ron Munds, City of San Luis Obispo, California, oral commun., November 4, 2013). In 1991, tenants and owners of businesses near two of the city wells began to notice unusual effects on their infrastructure. The Bear Valley Shopping Center, a strip mall on Los Osos Valley Road, experienced differential subsidence; floors were shifted unevenly. The middle of the long, narrow mall subsided less than either end of the building so that the floor had an inverted V-shape in its long dimension. Doors and windows would not close properly, and sidewalks sloped back toward the building so that slot drains had to be cut in order to remove pooling precipitation. A surveyor measured a 12-inch drop in the floor along the 45-foot length of one store. After the floor was leveled, a 1-foot step had to be built to allow safe access to the store. Because the steel frame construction of the building remained structurally sound, repairs could be made without complete reconstruction (John Rosesetti, Los Osos Valley Associates, oral commun., November 4, 2013). The adjacent building housing the Sunset Honda dealership had to be razed and completely rebuilt. Many homes in the nearby development were damaged. Owners of the strip mall successfully sued the city and were awarded $1 million in damages (John Rosesetti, Los Osos Valley Associates, oral commun., November 4, 2013). After that settlement the automobile dealership and many homeowners filed claims with the city. Total cost of the claims were about $2 million (Ron Munds, City of San Luis Obispo, California, written commun., November 5, 2013).
4.11 Cambria
At Cambria, on the central California coast, earth fissures resulting from substantial decline of groundwater levels during the 1976-1977 drought damaged buildings and other infrastructure (Cleveland, 1980). Subsequently, the city of Cambria developed additional sources of water for public supply; since then groundwater levels have not returned to historical low levels and fissuring has not reoccurred (Robert Gressens, Cambria Community Service District, oral commun. Sept. 13, 2013).
4.12 Santa Clara-Calleguas Basin
Subsidence in the Santa Clara-Calleguas basin, in coastal Ventura County, is caused by a combination of tectonic movement, hydrocarbon extraction, and groundwater pumping (Hanson et al., 2003). Some vertical movement – uplift north of the Oxnard Plain subbasin and subsidence in the Oxnard Plain subbasin – has been caused by tectonic deformation and related earthquakes. At the southern edge of the Oxnard Plain (Figure 4-35), elevation data from bench marks (BM) on bedrock (for example, BM Z 583) indicate that the 0.1 m (0.17 ft) of subsidence that occurred during 1939-1978 (at a rate of about 0.004 ft/yr) may be related to tectonic activity (Hanson et al., 2003). More than 9.7 million m3 (7,900 acre-ft) of brines, 7.86 million m3 (8,000 acre-ft) of oil, and 2.04 million m3 (1,653 ac-ft) of natural gas were withdrawn from oilfields in
Topic: Groundwater Land Subsidence from Groundwater Use in California
CA Water Plan Update 2013 Vol 4 Reference Guide Page 87

APRIL 2014 REPORT OF FINDINGS Land Subsidence from Groundwater Use in California
LSCE, BORCHERS AND CARPENTER 68
the Oxnard Plain (Figure 4-35) between 1943 and 1991 (Hanson et al., 2003, citing Steven Fields, Operations Engineer, California Department of Conservation, Division of Oil and Gas, written commun., 1992). Pressure declines equivalent to more than 335 m (1,100 ft) of groundwater-level decline have occurred in the Oxnard oilfields since the onset of oil and gas production. These declines alone could potentially account for local subsidence of 0.4 to 1 m (1.5 to 3.3 ft). However, the oil and gas fields are located several miles north of the bench marks used to measure subsidence and therefore likely do not affect those bench marks. Water-level declines in this coastal basin have induced land subsidence that was first measured in 1939. Subsidence of 0.8 meters (2.6 ft) between 1939 and 1978 was measured at bench mark E 584, about 7 km (4.3 mi) from the coast in the valley of Calleguas Creek. Numerical flow modeling by Hanson and others (2003) simulated a total of 0.9 m (3 ft) of land subsidence in the southern part of the Oxnard Plain and as much as 1.5 m (5 ft) in the Las Posas Valley subbasin. Model simulations indicate that most of the land subsidence occurred after the drought of the late 1920s and during the agricultural expansion of the 1950s and 1960s. Subsidence occurred primarily in the upper-aquifer system prior to 1959; some subsidence also occurred in the lower-aquifer system during 1959-1993 owing to an increase in pumpage there (Hanson et al., 2003). Indirect evidence that subsidence is in fact related to groundwater withdrawal includes water-level declines greater than 30 m (100 ft), subsurface collapse of well casings in the South Pleasant Valley subbasin and South Oxnard Plain subarea, repeated re-leveling of irrigated fields for proper drainage, less effective drainage ditches in agricultural areas, and lowering of levees along Calleguas Creek in the South Pleasant Valley subbasin (Hanson et al., 2003). In the Las Posas Valley and South Pleasant Valley subbasins, water-level declines of as much as 30 m (100 ft) in the upper-aquifer system and more than 91 m (300 ft) in the lower-aquifer system have occurred since the early 1900s. Considering the widespread water-level declines, the area of probable subsidence may include the Las Posas Valley subbasin and the remainder of the Pleasant Valley subbasin. Although the amount and areal extent of subsidence in the basin from each contributing source remains unknown, groundwater withdrawal and oil and gas production are probably major causes in the Oxnard Plain subbasin, and tectonic activity is probably a minor cause (Hanson et al., 2003).
Topic: Groundwater Land Subsidence from Groundwater Use in California
CA Water Plan Update 2013 Vol 4 Reference Guide Page 88

APRIL 2014 REPORT OF FINDINGS Land Subsidence from Groundwater Use in California
LSCE, BORCHERS AND CARPENTER 69
Figure 4-35. Subsidence in the Oxnard Plain and Pleasant Valley, Santa Clara-Calleguas groundwater basin, California. A) geographic features, B) subsidence profile, C) subsidence of bench marks through time (from Hanson et al., 2003, Figure 9).
Topic: Groundwater Land Subsidence from Groundwater Use in California
CA Water Plan Update 2013 Vol 4 Reference Guide Page 89
APRIL 2014 REPORT OF FINDINGS Land Subsidence from Groundwater Use in California
LSCE, BORCHERS AND CARPENTER 70
4.13 Elsinore Trough - Wolf Valley to Murrieta
There are two separate areas of subsidence in the Elsinore trough, a broad structural depression bounded by faults in western Riverside County (Shlemon and others, 1998). Subsidence in these two areas was likely caused by different mechanisms. Fissures appeared in the Wolf Valley area in 1987 and advanced northward seven miles to the Temecula-Murrieta area (Earth Consultants International, 2000). By 1991, damages to surface structures exceeded $50 million (Corwin and others, 1991). Study of the fissures led to discovery of the previously unknown Murrieta Creek and Wolf Valley Faults. The location of the fissures is primarily controlled by these two faults (Shelmon and Hakakian, 1992), but most investigators believe that the fissures formed when increased pumping caused inelastic compaction and subsidence (Shlemon and Davis, 1992). Tensile stresses that concentrated along the trough-bounding faults pulled apart subsurface materials. Evidence for this hypothesis is simply that several new wells began pumping in the days and weeks before subsidence was noted, and that since pumping stopped the fissures have not increased in number or size. Fissures in the other subsiding location in the Elsinore trough, the California Oaks subdivision in Murrieta, were caused by hydrocompaction upon wetting, rather than extraction of groundwater. Hydrocompaction is discussed in Appendix A.
4.14 San Jacinto Valley
Land surface deformation in the San Jacinto Valley, in eastern Riverside County, a structural depression within the San Jacinto Fault zone, has components of both tectonic deformation and aquifer compaction. Tectonic subsidence of the structural trough has been occurring at rates of 3 to 5.6 mm/yr (0.1 to 0.2 in/yr) for the past 10,000 to 40,000 years (Morton, 1977). Groundwater levels, which had been 7 m (25 ft) above land surface in the 1930s, declined to more than 61 m (200 ft) below land surface in the 1970s. Proctor (1962) reported 71 cm (2.34 ft) of subsidence between 1939 and 1959 east of the trough-bounding Casa Loma fault, with no subsidence west of the trough. Lofgren (1976) measured compaction of aquifer materials with a 377-m (1,237-ft) deep extensometer during 1970-1974 and concluded that inelastic compaction of aquifer materials in the depth range of the extensometer amounted to about 1 cm /yr (0.04 ft/yr) and that tectonic subsidence amounted to 0.3-0.6 cm/yr (0.1-0. 2 in/yr). That is, most permanent subsidence (70-80 percent) resulted from groundwater withdrawal, with the remainder from tectonic downwarping of the valley. After 1953, linear fissures and sinkhole-like depressions formed along traces of the eastern basin-bounding faults, and arcuate fissuring occurred near the contact of alluvium and basin-bounding hills to the west (Morton, 1977). Holzer (1984) concluded that although the fissures were co-located with basin-bounding faults, they could have been induced by groundwater pumping that concentrated stresses where aquifer deposits thin near bedrock outcrops on the west side of the trough, and at a groundwater-barrier fault on the east side of the trough.
Topic: Groundwater Land Subsidence from Groundwater Use in California
CA Water Plan Update 2013 Vol 4 Reference Guide Page 90
APRIL 2014 REPORT OF FINDINGS Land Subsidence from Groundwater Use in California
LSCE, BORCHERS AND CARPENTER 71
4.15 Yucaipa Valley
The Yucaipa Valley, in southwestern San Bernardino County, is a small, tectonically formed trough mostly filled with silt and clay. The valley has a long history of water development. The first irrigation ditch was constructed in 1819 to support farming and cattle raising. By 1909, about 95 percent of the area’s water supply was used for agricultural irrigation. (Yucaipa Valley Water District web page, http://www.yvwd.dst.ca.us/index.aspx?page=133, accessed January 13, 2014). Irrigation wells to support agriculture and post-World War II urbanization contributed to groundwater-level declines of more than 35 m by 1952. In January 1952, a 600-m-long fissure opened about 5 km (3.1 mi) west of the town of Yucaipa (Holzer, 1984, citing Burnham, unpublished report, 1952). Hydrogeologic studies were not performed to determine whether historically low groundwater levels in 1952 triggered the fissure or if tectonics caused or contributed to its formation. Managers at the Yucaipa Valley Water District are not aware of the location of the fissure reported by Burnham (1952, unpublished report) and have not observed other fissures in Yucaipa Valley (Jack Nelson, Yucaipa Valley Water District, oral commun., January 2014).
4.16 Cuyama Valley
Groundwater is the sole source of water supply in Cuyama Valley, a rural agricultural area east of Santa Barbara in the Coast Ranges near the edge of the southern San Joaquin Valley. Groundwater levels there have declined as much as 91 m (300 ft) since the 1940s. The magnitude of land subsidence from this historic groundwater-level decline has not been reported; however, the potential for increased groundwater extraction has raised concerns about land subsidence. Relevant factors include active tectonics and hydrocarbon extraction, as well as groundwater extraction. The USGS assessed the relationship between groundwater-level and land-surface elevation changes during 2008-2012 (Everett et al., 2013). The valley and surrounding mountains are moving 0.7 to 1.3 mm (0.03 to 0.05 in) upward and 25 to 36 mm (1 to 1.4 in) to the northwest each year, consistent with motion on the San Andreas Fault system. Comparison of changes in land-surface elevation determined from continuous GPS stations and Synthetic Aperture Radar (SAR) satellites with groundwater levels measured in observation wells indicated that the aquifer system in the valley experiences seasonal elastic land deformation and expansion that results in small amounts of recoverable subsidence. In parts of the valley where groundwater levels had declined below historically low levels during December 2002-May 22, 2008, InSAR detected longer-term land subsidence of 8 to 12 mm/yr (0.31 to 0.47 in/yr), amounting to 40 to 65 mm (1.6 to 2.6 in) total subsidence during the period. This long-term subsidence results from inelastic compaction of the aquifer system. The InSAR derived trend at one locality, 8 mm/yr (0.31 in/yr), was confirmed by a continuous GPS station located near observation wells where water levels had declined below historic lows. Extraction of hydrocarbons at two oil fields in the valley apparently had little effect on subsidence during 2002-2011. USGS evaluation of the Cuyama Valley aquifer system is ongoing.
Topic: Groundwater Land Subsidence from Groundwater Use in California
CA Water Plan Update 2013 Vol 4 Reference Guide Page 91

APRIL 2014 REPORT OF FINDINGS Land Subsidence from Groundwater Use in California
LSCE, BORCHERS AND CARPENTER 72
5 MEASURING AND MONITORING LAND SUBSIDENCE 5.1 Methods
Alarming rates of subsidence recently have been measured in several areas of California. This information has been reported only after disruptive impacts from subsidence have occurred; this emphasizes the need for increased monitoring. There is no state or federal agency in California that has the responsibility or program in place, specifically to monitor land subsidence. Consequently, there are no statewide monitoring networks for subsidence. Smaller regional, county-wide, or local monitoring networks are sometimes constructed to address a specific subsidence issue. These small networks usually are not designed for long-term monitoring, but rather for a project-specific period of time, usually implemented in reaction to a subsidence crisis that has damaged or impaired the function of essential infrastructure. There a few exceptions: adjudicated basins sometimes have management objectives that require detailed subsidence monitoring and reporting, as do some agencies that are the primary water purveyor in a region. But, if land subsidence monitoring is defined as the systematic and regular acquisition of information to describe the changing extent and magnitude of the problem, then most of California must be considered unmonitored. Land subsidence can be measured by determining the change in land surface elevation by several methods; other methods directly measure that part of land subsidence resulting from groundwater extraction. Borehole extensometers combined with water-levels in observation wells have been providing time series monitoring of subsidence at a few selected points in California since 1958. Repeat leveling of existing monuments along U.S. Coast and Geodetic Survey (now National Geodetic Survey) and USGS level lines since the early 1900s establish the areal distribution of subsidence. Civilian use of the Department of Defense Global Positioning System (GPS) began in the 1980s, and space-borne Interferometric Synthetic Aperture Radar (InSAR) in the 1990s. All these techniques augment each other. Borehole extensometers and GPS stations can provide continuous records to compare with water-level records and determine elastic and inelastic (or permanent) deformation. GPS establishes a context of measurements in a fixed reference frame and allows continuous monitoring of horizontal and vertical deformation at a location. InSAR can provide remotely sensed measures of small magnitude land-surface displacements over large areal extents. The Gravity Recovery and Climate Experiment (GRACE) measures changes in the position of mass and is being used for measuring very-large-scale water-level changes in unconfined aquifer systems (Famiglietti, et al., 2011). GRACE by itself provides no information on land subsidence, and satellite-based gravity measurements do not appear to have sufficient resolution for the
Topic: Groundwater Land Subsidence from Groundwater Use in California
CA Water Plan Update 2013 Vol 4 Reference Guide Page 92

APRIL 2014 REPORT OF FINDINGS Land Subsidence from Groundwater Use in California
LSCE, BORCHERS AND CARPENTER 73
typical regional and local scales of aquifer systems in California. GRACE operates at relatively low resolution in space and time; it can measure monthly changes in gravity, for regions with a minimum area 150,000 km2 (more than 93,000 mi2), with an accuracy of 1.5 cm (0.6 in) of equivalent water height (Bridget Scanlon, University of Texas at Austin, pers. commun. October 31, 2012). Its performance improves with increasing area and time period. Due to spatial resolution limitations, the GRACE method is not discussed further in this report.
Viable methods for measuring and monitoring subsidence are discussed further below. 5.1.1 Measuring Changes in Land Surface Elevation Surveying and the Global Positioning System Ground deformations associated with land subsidence are measured in several ways (Table 5-1), generally referenced to the position of land surface at geodetic monuments. Geodetic monuments, such as bench marks (which are capped with a brass disk identifying the installing agency and a unique name), are anchored well below land surface to assure that changes in elevation represent deep-seated processes rather than shallow surface processes such as soil shrink and swell or frost heave. Changes in vertical and/or horizontal position of geodetic monuments are referenced to other monuments that are assumed to be stable, or to a global reference frame. In California, where local land surveys using spirit levels indicated historical subsidence activity, accurate quantification of subsidence was sometimes hindered by uncertainty regarding the stability of the bench mark(s) used for control. For the United States, the National Geodetic Survey, or NGS (formerly U.S. Coast and Geodetic Survey), is the most complete source for digital National Spatial Reference System (NSRS) data. The NGS is responsible for defining, managing, and providing public access to the NSRS, which provides a consistent national coordinate system for mapping latitude, longitude, and elevation with high accuracy. Unfortunately, past records of vertical land elevation are difficult to compile and utilize; the NGS emphasizes the most recent x, y, and z value for a bench mark as the most valuable. The ‘superseded’, or historic, vertical elevation values sometimes are embedded in an ASCII file called a Datasheet, one per monument, whereby one can extract some previous elevation values for each monument3. Usually, only the most recent historical elevation is shown on the Datasheet, although in subsidence-prone regions, there may be dozens of superseded elevations.
3 There also is an issue with the vertical datum for all sites. Newer values are referenced to a different vertical datum than historical values, and an adjustment is needed to convert all values to the same datum.
Topic: Groundwater Land Subsidence from Groundwater Use in California
CA Water Plan Update 2013 Vol 4 Reference Guide Page 93
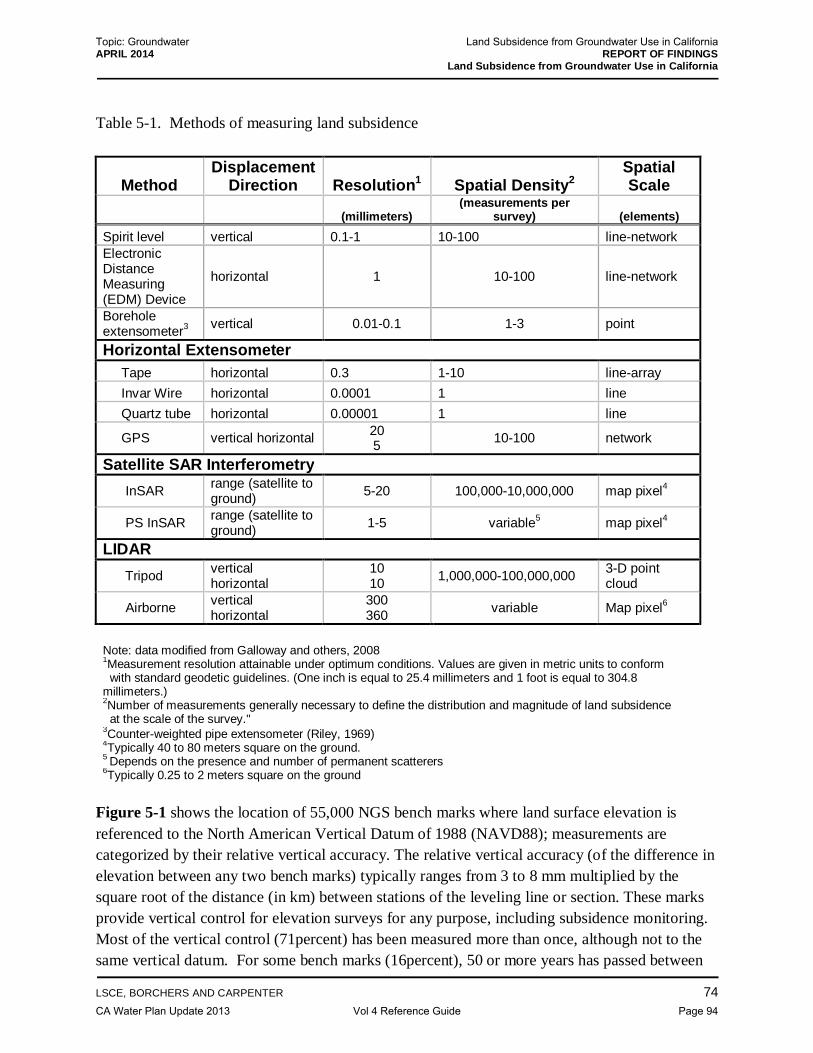
APRIL 2014 REPORT OF FINDINGS Land Subsidence from Groundwater Use in California
LSCE, BORCHERS AND CARPENTER 74
Table 5-1. Methods of measuring land subsidence
Method Displacement
Direction Resolution1 Spatial Density2 Spatial Scale
(millimeters)
(measurements per survey) (elements)
Spirit level vertical 0.1-1 10-100 line-network Electronic Distance Measuring (EDM) Device
horizontal 1 10-100 line-network
Borehole extensometer3 vertical 0.01-0.1 1-3 point
Horizontal Extensometer Tape horizontal 0.3 1-10 line-array Invar Wire horizontal 0.0001 1 line Quartz tube horizontal 0.00001 1 line
GPS vertical horizontal 20 5 10-100 network
Satellite SAR Interferometry InSAR range (satellite to
ground) 5-20 100,000-10,000,000 map pixel4
PS InSAR range (satellite to ground) 1-5 variable5 map pixel4
LIDAR Tripod vertical
horizontal 10 10 1,000,000-100,000,000 3-D point
cloud
Airborne vertical horizontal
300 360 variable Map pixel6
Note: data modified from Galloway and others, 2008 1Measurement resolution attainable under optimum conditions. Values are given in metric units to conform with standard geodetic guidelines. (One inch is equal to 25.4 millimeters and 1 foot is equal to 304.8 millimeters.) 2Number of measurements generally necessary to define the distribution and magnitude of land subsidence at the scale of the survey." 3Counter-weighted pipe extensometer (Riley, 1969) 4Typically 40 to 80 meters square on the ground. 5 Depends on the presence and number of permanent scatterers 6Typically 0.25 to 2 meters square on the ground
Figure 5-1 shows the location of 55,000 NGS bench marks where land surface elevation is referenced to the North American Vertical Datum of 1988 (NAVD88); measurements are categorized by their relative vertical accuracy. The relative vertical accuracy (of the difference in elevation between any two bench marks) typically ranges from 3 to 8 mm multiplied by the square root of the distance (in km) between stations of the leveling line or section. These marks provide vertical control for elevation surveys for any purpose, including subsidence monitoring. Most of the vertical control (71percent) has been measured more than once, although not to the same vertical datum. For some bench marks (16percent), 50 or more years has passed between
Topic: Groundwater Land Subsidence from Groundwater Use in California
CA Water Plan Update 2013 Vol 4 Reference Guide Page 94

APRIL 2014 REPORT OF FINDINGS Land Subsidence from Groundwater Use in California
LSCE, BORCHERS AND CARPENTER 75
the first and last measurements performed by NGS. This historic record of time-series elevation data would be of great value for a statewide assessment of subsidence, but unfortunately the data are not readily available and would require quite a bit of effort to be made suitable for use4.
Figure 5-1. NGS Sites with vertical control.
4 There are several storage boxes of paper records that include additional coordinates and elevation data for historical bench marks. Because there is no current NGS geodetic advisor in the state, the boxes likely will be removed from California and warehoused in the Washington, D. C. area. The historic data sheets will never be made available as a digital database, but if they were scanned and stored electronically this valuable data would be available for statewide assessments of historic land subsidence referenced to NGVD29.
Topic: Groundwater Land Subsidence from Groundwater Use in California
CA Water Plan Update 2013 Vol 4 Reference Guide Page 95

APRIL 2014 REPORT OF FINDINGS Land Subsidence from Groundwater Use in California
LSCE, BORCHERS AND CARPENTER 76
Historically, spirit-level surveys were used to measure changes in land-surface elevation of bench marks. If land surveys collected both horizontal and vertical information, a theodolite or, since the 1980s, a device such as a total station, which includes an electronic distance measurement distance measuring (EDM) device, was employed.5 In 1995, the Navstar GPS, based on 24 earth-orbiting satellites, became fully operational, providing continuously available access to at least 6 satellites visible to users in North America. The Navstar system allows 3-dimensional positions to be determined for geodetic monuments with an accuracy of 20 mm (0.0656 ft) vertically and 5 mm (0.0164 ft) horizontally, when geodetic procedures are employed and under ideal conditions. GPS measurements are expressed relative to a reference ellipsoid. A reference ellipsoid is a mathematically-defined surface that approximates the geoid, an idealized model of the Earth. Because of their relative simplicity, reference ellipsoids are the preferred surface on which geodetic-network computations are performed and point coordinates such as latitude, longitude, and elevation are defined. The reference ellipsoid is frequently updated as improved information becomes available. GPS measurements can be made with portable GPS receivers on a campaign basis or can incorporate data from more permanent installations at Continuous GPS sites (CGPS). The height modernization program of the NGS defines geodetic procedures and standards in order to provide the highest possible accuracy for elevations determined via GPS surveys (referenced to NAVD88). Elevations determined by GPS surveys that meet these standards are available in the NGS database as ‘Height-mod’ sites (Figure 5-1). There are more than 800 CGPS sites in California. These are autonomous sites that receive data from GPS and sometimes other navigation satellite systems, and record their location (including vertical position) every 1, 5, 15, or 30 seconds. They are installed, owned, and operated by public agencies, consortiums, and private entities. Several of these entities archive geodetic information from their own sites and from sites operated by other entities and make the data available via the internet. These include: 1) Plate Boundary Observatory (PBO), which is a component of the University Navstar Consortium (UNAVCO) and funded by the National Science Foundation, 2) NASA/JPL, 3) UC Berkeley’s Bay Area Regional Deformation (BARD) network, 4) Scripps Orbit and Permanent Array Center (SOPAC), 5) U. S. Geological Survey, 6) California Spatial Reference Center (CSRC), 7) NGS, 8) U. S. Coast Guard, 9) California Department of Transportation, and 10) various commercially owned CGPS sites that distribute data to their subscribers. CGPS sites are used as components of land deformation monitoring networks that primarily measure the horizontal movement of tectonic plates; very few were installed with the intent to monitor land subsidence. Although they own and operate only one CGPS site in California, the NGS archives and provides on their website x, y, and z coordinates as well as time series data for approximately 284 CGPS 5 Generally, surveys using the total station do not meet the high standards of vertical accuracy required for inclusion in the NGS database. Electronic Distance Measuring devices are most often used to determine changes in horizontal distance such as occurs across an earth fissure in a subsiding area.
Topic: Groundwater Land Subsidence from Groundwater Use in California
CA Water Plan Update 2013 Vol 4 Reference Guide Page 96

APRIL 2014 REPORT OF FINDINGS Land Subsidence from Groundwater Use in California
LSCE, BORCHERS AND CARPENTER 77
sites in California (Figure 5-2) that were constructed and are operated by other agencies or consortiums of other agencies. These sites form the Continuously Operating Reference Station (CORS) network of the NGS. The CORS network data provide much-needed insight into the daily, seasonal, and climatic variations of land surface elevation and horizontal location, referenced to the NAD83 ellipsoid. The availability of high frequency position information (sampled at 1-second intervals, Figure 5-2) improves the accuracy of GPS data collected from moving planes and other aerial platforms (Snay and Soler, 2008) and shortens the time necessary for collection of data by portable GPS receivers. CORS time-series elevation data can be paired with groundwater-level measurements to define relationships between groundwater stresses and land-surface elevation changes.
Figure 5-2. Continuously Operating Reference Station (CORS) Network (retrieved from NGS September 16, 2013).
Time-series data retrieved from other providers such as PBO or SOPAC can be used for the same purpose as CORS data, although mixing data from different providers can be problematic; NGS and SOPAC use a different reference frame than does PBO.
Topic: Groundwater Land Subsidence from Groundwater Use in California
CA Water Plan Update 2013 Vol 4 Reference Guide Page 97

APRIL 2014 REPORT OF FINDINGS Land Subsidence from Groundwater Use in California
LSCE, BORCHERS AND CARPENTER 78
Satellite Synthetic Aperture Radar Interferometry Interferometric Synthetic Aperture Radar (InSAR) is an invaluable satellite-based remote-sensing technique that uses radar signals to measure land-surface deformation at an unprecedented level of spatial detail and high degree of measurement resolution (Table 5-1). InSAR can provide detailed subsidence mapping over larger areas than can be measured by any other technique. Measurements can be done entirely retroactively, by acquiring historic (1992 to present) repeat satellite Synthetic Aperture Radar (SAR) data sets for the area of interest, and then processing the SAR data using interferometric techniques to determine changes in elevation over large areas with a precision of a few millimeters. Much of the Earth was repeatedly surveyed by the SAR satellites for establishing digital elevation models and to detect deformation associated with earthquakes, volcanoes, and glaciers. Those data sets provide the early basis for InSAR. Unfortunately, constructing long-term time series with SAR data can be difficult because of the short life spans of the satellites (i.e., they are generally decommissioned after about 5 years of service). The U.S. does not have a civilian SAR satellite, so presently data must be acquired from international sources (e.g., Canada, Germany, Italy, Japan, and Europe). Under ideal conditions, InSAR can detect surface deformation of less than a centimeter over hundreds of square kilometers, at a spatial resolution of 90 m (295 ft) or better (Sneed et al., 2013). Radar signals generated from a satellite are bounced off stable and unstable radar reflectors on the Earth’s surface. Stable reflectors are, roads, buildings, other engineered structures, mountains, and undisturbed ground and rocks. The travel time of the radar signal from the satellite to the ground and back to the satellite is proportional to the distance between the satellite and the ground. Over a period of time changes in the position of radar reflectors on the Earth’s surface can be measured by subtracting, or “interfering”, two radar scans (scenes) of the same area that are made at different times. A difference in the calculated distance of a pixel indicates that the Earth’s surface there has moved closer to the satellite (usually uplift) or away from the satellite (usually subsidence) during the time between acquisition of the two scenes. Processing of SAR data in this manner data results in map images called interferograms that show the magnitude of measured displacements by variation in the color of pixels overlain on a map of the scanned area. Typically this conventional processing technique is unsuccessful in areas where the surface has been disturbed or tilled, contains rapidly growing or harvested vegetation, or experiences dramatic changes in surface moisture. Manufactured devices designed to reflect Radar signals are sometimes installed in areas that otherwise would be poor candidates for InSAR analysis. In agricultural areas or other areas where vegetation or ground disturbances affect ground reflectors between SAR acquisitions, Persistent Scatterer InSAR (PS InSAR) processing techniques have been used to measure subsidence and uplift. PS InSAR processing is similar to
Topic: Groundwater Land Subsidence from Groundwater Use in California
CA Water Plan Update 2013 Vol 4 Reference Guide Page 98

APRIL 2014 REPORT OF FINDINGS Land Subsidence from Groundwater Use in California
LSCE, BORCHERS AND CARPENTER 79
the conventional technique but requires that 20 or more SAR images be processed simultaneously to identify pixels that have consistent strength (amplitude) of the radar pulse reflected from the surface (Ferretti et al., 2000, 2001; Warner et al., 2003). Such persistent reflections are returned from roads, power-transmission towers, levees, canals, buildings and other engineered structures that are often found within the otherwise disturbed surface of agricultural areas. Interferometric calculations are done only for stable pixels (pixels containing these persistent reflectors (scatterers) rather than every pixel in each SAR image pair. Again, colors representing the magnitude of displacement are assigned to each pixel that contains persistent scatters and overlain on a map. The size of each colored pixel is gradually increased until uncolored gaps in the map (as long as the gaps are not too large) disappear. The result is very similar to interferograms created using conventional InSAR techniques. The quality of SAR data and the usefulness of interferograms can be affected by atmospheric conditions (fog and clouds), land-use, satellite orbit geometry, ground cover, and topographic relief. Methods have been developed to identify and discard, or correct for SAR images with these issues. InSAR techniques have proved invaluable for remotely assessing large areas with a high degree of measurement resolution.
LiDAR LiDAR is a remote sensing technology that measures distance by illuminating a target with a laser and analyzing the reflected light. LiDAR has been used extensively both in tripod-mounted ground scanning and in airborne mapping surveys. LiDAR collects measurements independent of weather conditions or time of day, but is limited to line-of-sight measurements unless a target is scanned from different vantage points. Tripod mounted LiDAR provides distance from the instrument to millions of points on the land surface with a resolution of at least 1 cm (0.4 in). It has been used to measure displacement of land surface by faulting, landslides, and other geologic processes, and to estimate the volume of rock falling from cliffs by using scans before and after the event. Airborne LiDAR has been invaluable in geologic mapping and understanding geomorphic processes that shape the land surface. There are many potential sources of error in elevations acquired by airborne LiDAR: LiDAR equipment, interpolation, horizontal displacement, flight height, terrain slope, and ground cover all influence LiDAR-determined elevations (Hodgson and Bresnahan, 2004). Airborne LiDAR measurements have a lower vertical resolution compared to other methods of measuring the elevation of land surface.
Measuring Aquifer Compaction Borehole extensometers measure the continuous change in vertical distance between the land surface and a subsurface reference point in a borehole (Riley, 1986). Several different kinds of borehole extensometers have been used to measure aquifer-system compaction, including pipe,
Topic: Groundwater Land Subsidence from Groundwater Use in California
CA Water Plan Update 2013 Vol 4 Reference Guide Page 99

APRIL 2014 REPORT OF FINDINGS Land Subsidence from Groundwater Use in California
LSCE, BORCHERS AND CARPENTER 80
cable (steel), rod, and magnetic/radioactive marker. Fiber-optic components for borehole extensometers have been proposed. Only pipe and steel-cable extensometers are discussed in this section. The pipe and steel cable extensometers are most common and have been used extensively in California. Generally, pipe extensometers are built with a small diameter pipe inside a larger diameter well casing (Figure 5-3A). The pipe inside the well casing extends from land surface to a concrete pad that is usually emplaced at the base of compressible aquifer-system sediments. A table at the land surface holds instruments that monitor change in distance between the top of the pipe and the table (Figure 5-3B). Often pipe extensometers include a pipe, to reduce frictional coupling of the extensometer pipe to the extensometer casing. Cable extensometers typically consist of a cable anchored at the bottom of the borehole and counter weighted at the surface. The cable travels across a pulley that is connected to instruments that measure the distance that the cable travels. Both pipe and cable extensometers provide continuous measurements of the shortening and lengthening of the distance between land surface and the base of the monitored aquifer. Aquifer-system compaction measured using extensometers can be used to determine whether groundwater extraction from a particular part of the aquifer system may be contributing to land subsidence. These measurements can be compared to measurements of total land subsidence at the site (e.g., as determined from surveying, co-located continuous GPS sites, or InSAR) to determine whether processes other than aquifer-system compaction are also contributing to land subsidence. Extensometers are necessary to distinguish subsidence caused by groundwater extraction from deeper-acting processes such as hydrocarbon extraction and tectonics. Aquifer systems often contain several major aquifers and confining units. Because it often is desirable to monitor compaction in more than one depth interval extensometers monitoring different depths are sometimes constructed at the same site. Multi-stage extensometers (and magnetic marker extensometers) at the same location have been used to monitor compaction simultaneously in different depth intervals. This is the only way to measure compaction occurring in different parts of the aquifer system, that is, in different depth intervals.. Pipe extensometers have been constructed that are sensitive enough to record the minute elastic compression and expansion that accompany even very small changes in water levels in unconsolidated alluvial aquifer systems, as well as the relatively large deformations typical of the inelastic and irreversible compaction of aquitards (Galloway et al., 1999). When combined with water-level data, the deformation history provided by an extensometer can be used to constrain the average compressibility and vertical hydraulic conductivity of confining units; these are characteristics that must be determined to estimate eventual subsidence magnitude under various pumping scenarios and to optimally manage the storage capacity of an aquifer system.
Topic: Groundwater Land Subsidence from Groundwater Use in California
CA Water Plan Update 2013 Vol 4 Reference Guide Page 100

APRIL 2014 REPORT OF FINDINGS Land Subsidence from Groundwater Use in California
LSCE, BORCHERS AND CARPENTER 81
Figure 5-3. Fordel extensometer, Mendota. A) The 2″ pipe inside slip-jointed well casing is anchored in a concrete plug completed in the Corcoran Clay that underlies the aquifer sediments. B) A dial indicator monitors the change in distance between the top of the 2″ pipe and the reference table (land surface). This records the amount of compaction in the aquifer sediments (from LSCE, May 1999).
5.2 Earth Fissures – Methods for Measuring and Monitoring
Monitoring of earth fissures requires measuring complex horizontal and vertical pattern of deformation over relatively small horizontal distances. Monuments for repeated horizontal-
Topic: Groundwater Land Subsidence from Groundwater Use in California
CA Water Plan Update 2013 Vol 4 Reference Guide Page 101

APRIL 2014 REPORT OF FINDINGS Land Subsidence from Groundwater Use in California
LSCE, BORCHERS AND CARPENTER 82
distance surveys and leveling must be closely spaced. In the absence of continuous data, surveys should be done twice a year, including at the end of the groundwater pumping season and at the end of the groundwater-level recovery period. Continuous measurements are invaluable to understanding the relationship between fissure deformation and pumping. Earth fissures behave like extensional tears in an elastic body. When fissures open astensile cracks, nearby surficial material compresses horizontally, and that compression decreases farther from the fissure. The vertical component of deformation associated with horizontal opening exhibits uplift near the crack and subsidence farther from the crack. A dip-slip (vertical movement) fault exhibits uplift near the crack and subsidence farther from the crack on the up-thrown side, and subsidence near the crack and uplift farther from the crack on the downthrown side. Wherever both horizontal and vertical deformations near earth fissures have been measured, vertical movement has been as large as or larger than horizontal movement, although the vertical movement is seldom visually apparent. What might seem a ‘counterintuitive’ pattern of deformation could result from: (1) the crack having a limited depth, (2) measurements that started after the material had already stretched, or simply (3) the effects of the elastic properties of earth materials. The measurable zone of deformation of a fissure is about twice the depth. However, surface deformation should be measured over a minimum of four times depth to enable removal of background regional deformation. Normal strain is a change in distance divided by the distance over which the change is measured. It has no units or dimensions and can be thought of as a ratio. Assuming elastic material, Jachens and Holzer’s (1982) suggested range of horizontal tensile strain-at-failure is 0.02-0.1percent. Measurements of deformation always begin after subsidence has already occurred, so tensile failure is likely to occur when measured strain is toward the lower end of this range. The earlier in the process that precise measurement commences, the better the ability to predict and deal with negative consequences associated with fissuring. 5.2.1 Precise Leveling and Horizontal Distance Surveys The horizontal strains to be measured across a fissure zone range from 10-6 to 10-3. As monument spacing decreases, the resolution and precision of the measuring instrument must be finer to determine the same strain. Precision of both leveling and EDM (horizontal distance surveys) should be about 0.1 mm (0.0039 in) or better. It is desirable to obtain one order of magnitude better resolution than the required precision. Wherever possible, survey lines should be established perpendicular to a fissure with permanent monuments such as 10 cm (4 in) diameter pipes, set 3 m (10 ft) deep, with 12 m (40 ft) or finer spacing within about 60 m (200 ft) of an existing or developing fissure zone. Ideally, regular surficial monuments would extend from a fissure with 24 m (80 ft) spacing for about 150 m (500
Topic: Groundwater Land Subsidence from Groundwater Use in California
CA Water Plan Update 2013 Vol 4 Reference Guide Page 102

APRIL 2014 REPORT OF FINDINGS Land Subsidence from Groundwater Use in California
LSCE, BORCHERS AND CARPENTER 83
ft) and 48 m (160 ft) spacing for about 300 m (1000 ft). Significant movement on a survey line would be cause to establish a parallel line in the probable area of new fissuring off the end of the existing fissure. Survey lines should be established with several repeated sets of measurements to determine measurement errors, then measured quarterly for one year and twice a year in ensuing years. These survey lines should be tied into broader survey networks and GPS networks using surrounding CORS and HARNs (High Accuracy Reference Network6) monuments. 5.2.2 3-D Deformation and Continuous Measurements of Fissure Movement Three-dimensional movement of the land surface is the surface expression of what is occurring at depth. In addition to measuring vertical compression and expansion with borehole extensometers and lateral surface deformation as discussed above, describing differential horizontal movement at depth is a key to understanding and accurately modeling three-dimensional deformation and movement of the skeletal frame of an aquifer system (Verruijt, 1969). Lateral movement at depth is currently the least known (least measured) subsurface phenomenon. Variation with depth in the lateral deflection of borehole inclinometer casing in response to wells extracting groundwater from an aquifer system would provide insights to 3-dimensional deformation and perhaps fissure initiation processes (Burbey, 1996; Burbey, 2001). Coordinated use of precise surface and subsurface instruments can provide substantial understanding of fissuring processes. Integration of highly precise leveling and horizontal-distance surveys with continuous measurements of horizontal strain using horizontal quartz tube extensometry, and of vertical movement and tilt using biaxial tilt meters, can provide independent corroboration for measurements at the limit of their resolution. The combination of horizontal strain, liquid level, and tilt information complement each other to give an estimate of the depth of deformation. Integration of these techniques with GPS, CGPS, and subsurface deformation information collected from inclinometer logging of boreholes installed in fissure-prone areas will provide 3-D deformation information helpful for understanding fissuring processes. Long-term monitoring of fissures as hydrologic conditions change will allow scientists to identify the likely modes of fissure formation about which there is considerable uncertainty in
6 A High Accuracy Reference Network (HARN) and a High Precision Geodetic Network (HPGN) were two designations used for a statewide geodetic network upgrade. The generic acronym HARN is now used for both HARN and HPGN and was adopted to remove the confusion arising from the use of two acronyms. A HARN is a statewide or regional upgrade in accuracy of NAD 83 coordinates using Global Positioning System (GPS) observations. HARNs were observed to support the use of GPS by Federal, state, and local surveyors, geodesists, and many other applications (http://www.ngs.noaa.gov/faq.shtml, accessed November 26, 2013).
Topic: Groundwater Land Subsidence from Groundwater Use in California
CA Water Plan Update 2013 Vol 4 Reference Guide Page 103

APRIL 2014 REPORT OF FINDINGS Land Subsidence from Groundwater Use in California
LSCE, BORCHERS AND CARPENTER 84
the scientific community currently. This would address an intriguing set of unanswered questions about fissures:
(1) Do fissures initiate at depth and propagate to the surface (or the reverse), or does initiation and fissure growth vary with site conditions?
(2) How and why do fissures close over time? (3) Is there a sustainable rate of water-level decline and subsidence that can be maintained
without causing fissures? (4) Will renewed drawdown cause renewed fissuring, and where will this occur with respect to
older fissures?
5.3 Numerical Modeling
The earliest numerical model to successfully simulate time-dependent aquitard compaction, expansion, and residual subsidence was COMPAC (Helm, 1972, 1975, 1976). It was part of Riley’s (1969) and Poland’s (Poland, et al, 1975, Ireland, et al, 1984, Poland and Ireland, 1988) pioneering effort to develop a field-laboratory method of site-specific parameter evaluation. Precise vertical displacement and field-scale stress data (namely borehole extensometer and water-level measurements) allowed parameter values that control future land subsidence at any site of interest to be determined directly and effectively at the field scale. These field-laboratory parameter values, calibrated from a few years’ data, allowed accurate predictions of land subsidence using COMPAC at the same site over a period of decades (Helm, 1977, 1978). The COMPAC model treats compaction of a specified cell within an aquitard to be recoverable (elastic) when the effective stress within this cell is calculated to be less than the cell-specific preconsolidation stress and to be nonrecoverable (inelastic and permanent) when this calculated transient effective stress becomes greater than the continuously updated cell-specific preconsolidation stress. To be consistent with actual field data, Helm’s effort restricted COMPAC to modeling only the vertical component of deformation at any specified site. In contrast, more recent efforts in modeling land subsidence approximate an average amount of subsidence that is occurring over larger areas at the regional scale. Leake and Prudic (1991) wrote a one-dimensional model, the Interbed Storage Package (IBS1) that became the standard for modeling subsidence in groundwater basins. Leake (1990) improved the capabilities of subsidence modeling using MODFLOW by creating IBS2 which allowed the evaluation of delayed drainage from aquitards. Leake (1991) further refined MODFLOW with IBS3 in which total load (from, for example, a changing water table elevation) can be treated as a variable and storage parameters are stress dependent. The USGS Subsidence and Aquifer System Compaction Package (SUB) (Hoffman et al., 2003) updates the functionality of ISB1 and ISB2 for use with newer versions of MODFLOW. SUB,
Topic: Groundwater Land Subsidence from Groundwater Use in California
CA Water Plan Update 2013 Vol 4 Reference Guide Page 104

APRIL 2014 REPORT OF FINDINGS Land Subsidence from Groundwater Use in California
LSCE, BORCHERS AND CARPENTER 85
like COMPAC, simulates the drainage, changes in groundwater storage, and compaction of aquifers, interbeds, and confining units while accounting for delayed drainage from aquitards. An additional modeling package called SUB-WT (Leake and Galloway, 2007), updates the IBS3 package for use with newer versions of MODFLOW. It is specifically tailored for water-table aquifers, simulating, like COMPAC (Helm, 1984a) the effects of subsidence and compaction in shallow, unconfined flow systems, and similar to COMPAC, simulates stress dependent changes in storage properties. The USGS MODFLOW subsidence packages are one-dimensional models of vertical deformation of the aquifer system skeleton. They have proven useful for regional simulations of groundwater flow, aquifer system compaction, and land subsidence. They do not simulate horizontal components of displacement and therefore are not applicable for describing deformation where horizontal motions are significant—at local scales, for example near pumping wells (Galloway and Burbey, 2011). They also cannot simultaneously simulate aquifer systems that exhibit both time-dependent drainage and compaction of thick aquitards, and stress-dependent skeletal specific storage; and they do not simulate changing hydraulic conductivity as aquitards compact. Poroelsticity theory describes the more fully coupled processes of groundwater flow and 3-D deformation of aquifer systems. Hseih (1995, 1996) developed a model on based poroelasticity theory originally developed by Biot (1941) to analyze deformation and deformation induced changes in hydraulic head in a confined aquifer system near a pumping well. Zhang (2009) has developed an even newer subsidence code that is truly three-dimensional as a module within MODFLOW. Its overall modeling strategy is described in detail by Helm (2013). It makes use of MODFLOW’s own solution schemes, which makes it orders of magnitude faster than Burbey’s (1994) earlier truly three-dimensional subsidence code, which was also written as a module within MODFLOW. Li and Ding (2013) have added to Zhang’s code a capability to simulate compaction-related changes in specific storage (actually, the changes in compressibility due to ongoing changes in the grain-to-grain structure of the skeletal frame of the aquifer system). In other words, Li and Ding have added SUB’s nonlinear capabilities, only they have done so within a three-dimensional model. The paucity of three-component deformation data at depth and at the land surface has been one factor limiting the use of poroelastic models. Other limitations are the intensive computational requirements, and the scarcity of data describing aquifer system physical and hydraulic properties sufficient to constrain the models (Galloway and Burbey, 2011). To date, only COMPAC (Helm, 1976) has successfully simulated compaction-related reduction in hydraulic conductivity (permeability). Substantial reduction in the hydraulic conductivity of compacting aquitards in the San Joaquin Valley during 1920s-1970s is believed to be one factor
Topic: Groundwater Land Subsidence from Groundwater Use in California
CA Water Plan Update 2013 Vol 4 Reference Guide Page 105

APRIL 2014 REPORT OF FINDINGS Land Subsidence from Groundwater Use in California
LSCE, BORCHERS AND CARPENTER 86
(along with reductions in skeletal specific storage) contributing to subsequent rapid water-level declines during the droughts of 1976-1977 and 1987-1992, after water levels had recovered substantially in the early to mid-1970s.
5.4 Networks Monitoring Land Subsidence Caused by Groundwater Extraction
The following descriptions are a brief overview of various California programs that included one or more components of subsidence monitoring described above. These programs and networks are described in published reports or in written communications received from various government agencies and consulting firms. Other entities in the state also monitor land subsidence using one or more subsidence measurement techniques, including water districts, large farms and probably other local agencies. Their information is not readily available. Federal and State Cooperative land subsidence studies in the San Joaquin Valley, 1954-1980 – A state and federal interagency cooperative investigation of land subsidence was initiated in the San Joaquin Valley in 1954, in response to concerns that the subsidence that had decreased the nominal flow capacity of the San Joaquin River by 30 percent by 1953 would also affect the Delta-Mendota Canal, being constructed by the U. S. Bureau of Reclamation, and the California Aqueduct, then being planned by the California Department of Water Resources. The program relied primarily on topographic maps and spirit-level surveys by the NGS to measure the magnitude of land subsidence and determine the correlation between declining groundwater levels and subsidence. Eventually, a substantial network of 35 extensometers and paired water-level observation wells was established in the valley (Figure 5-4). These extensometers operated mostly during the 1950s and 1960s; most have not been actively monitored since the early 1980s. In 2009, only 4 extensometers were still being monitored, and all of these were completed above the top of the Corcoran Clay. Consequently, aquifer-system compaction within and deeper than the Corcoran Clay, such as that occurring currently in the El Nido area near Highway 152, is not being measured. The USGS has acquired the original field data sheets for historically operated extensometers in the San Joaquin Valley (Michelle Sneed, written commun., September, 2013). The compaction data on the field sheets has been extracted and entered into spreadsheets for the complete period of record for all sites. A list of sites for which historical data is available through the USGS is shown in Table 5-2. No extensometers currently monitor the very broad subsidence feature in the southern San Joaquin Valley, east from the Tulare Lake bed. Current subsidence in this area was identified by InSAR techniques at NASA/JPL. Subsidence measured by InSAR in this area is preliminary and presented at the courtesy of NASA/JPL for general information purposes, rather than quantitative conclusions (Figure 4-8).
Topic: Groundwater Land Subsidence from Groundwater Use in California
CA Water Plan Update 2013 Vol 4 Reference Guide Page 106

APRIL 2014 REPORT OF FINDINGS Land Subsidence from Groundwater Use in California
LSCE, BORCHERS AND CARPENTER 87
Figure 5-4. Extensometers installed in the 1950s and 1960s, San Joaquin Valley.
Topic: Groundwater Land Subsidence from Groundwater Use in California
CA Water Plan Update 2013 Vol 4 Reference Guide Page 107

APRIL 2014 REPORT OF FINDINGS Land Subsidence from Groundwater Use in California
LSCE, BORCHERS AND CARPENTER 88
Table 5-2. Central Valley historical extensometer data newly available through the USGS
State Well No. USGS DWR SLDMWA LSCE 11N/1E-24Q8 1988-19921,2 12S/12E-16H23 1958-1983, 2010-2012 1985-2000 2009-2010 12S/12E-16H3 1958-1982, 2010-2011 1997-2000 2009-2010 13S/15E-31J4 1999-2012 13S/15E-35D5 1966-1983 14S/12E-12H1 1964-1983 1983-1998 14S/13E-11D63 1961-1983, 2010-2012 1983-2009 15S/13E-11D2 1964-1983 1983-1988 15S/16E-31N3 1967-1983 16S/15E-34N1 17S/15E-14Q1 1969-19825 1983-1998 18S/16E-33A13 1965-19825, 2012 1983-1998 20S/18E-06D13 2012 22S/27E-30D2 1970-1983 23S/25E-16N1 1958-1983 23S/25E-16N4 1959-1983 24S/26E-34F1 1957-1983 24S/26E-36A2 1959-1983 26S/23E-16H2 1978-1983 26S/23E-16H3 1978-1983 32S/28E-20Q1 1963-19786 Note: All data, unless specified otherwise, represents relative cumulative compaction based on field measurements from US Geological Survey (USGS), California Department of Water Resources (DWR), San Luis and Delta-Mendota Water Authority (SLDMWA), and/or Luhdorff and Scalmanini Consulting Engineers (LSCE)
1 USGS data from National Water Information System (NWIS), daily values do not represent field measurements. 2 DWR has operated the Zamora extensometer, 11N01E24Q008M, since 1992 and stores compaction data from
1988-present.
3 Four extensometers (6D1, 33A1, 11D6, 12S/12E-16H2) were refurbished and have compaction and water levels measured hourly since early 2012.
4 The extensometer at this location is referred to as the “Fordel extensometer”. Daily water levels are measured in
the nearby USGS monitoring well 31J3. 5 USGS data from cumulative annual compaction values from Table 1 of USGS Water Resources Investigation Report 85-4196. 6 USGS data, digitized from Figure 64 of USGS Professional paper 437-I, daily values do not represent field
measurements.
Topic: Groundwater Land Subsidence from Groundwater Use in California
CA Water Plan Update 2013 Vol 4 Reference Guide Page 108

APRIL 2014 REPORT OF FINDINGS Land Subsidence from Groundwater Use in California
LSCE, BORCHERS AND CARPENTER 89
Mendota Pool Group Pumping and Monitoring Program – The Mendota Pool Group pumps groundwater as part of a water transfer exchange project with the San Joaquin River Exchange Contractors Water Authority, Paramount Land Company, and Paramount Pomegranate Orchards. Part of this agreement involves a pumping and monitoring program. Compaction and land subsidence are monitored along with pumpage, groundwater levels, groundwater quality, surface-water flow, surface-water quality, and sediment quality, and annual reports are created. Continuous compaction data are collected from two extensometers in the Mendota area (Fordel Extensometer and the Yearout Ranch Extensometer). The Fordel Extensometer was installed by the Mendota Pool Group in 1999 and has been recording since; the Yearout Ranch Extensometer was installed by DWR in 1965 and DWR recorded data from 1966 to 1982. This instrument was reinitiated in 1999 by Central California Irrigation District and has been recording since then. In addition to these extensometers, which only measure compaction above the Corcoran Clay, a nearby CORS site in the Mendota area is used to determine total compaction. The CORS site (P304) has been recording land elevation since 2004. North Solano Groundwater Monitoring Program – The Solano County Water Agency has successfully implemented a groundwater-monitoring program, including multiple-completion monitoring wells, and installed two new CGPS sites that are part of a groundwater monitoring and subsidence network in northern Solano County. This network complements other groundwater monitoring wells in the area. The two CGPS sites (DIXN and VCVL) have been recording data since June 2012. Yolo County GPS and Extensometer Subsidence Network – Yolo County has developed a network of geodetic control that they have surveyed in 1999, 2002, and 2005 to determine the extent of land subsidence. Results of their surveys show greatest subsidence along the corridor north from Davis, through Woodland, north to Zamora and through the northeast corner of Yolo County. Sacramento/San Joaquin Delta Subsidence Project – DWR organized three series of GPS measurements (1997, 2002, and 2011) on a network of between 100 and 130 passive stations to assess the occurrence and distribution of land subsidence in the Delta. Several Delta stations were measured during the GPS surveys of the Sacramento Valley in 2008 (described below). 2004 Glenn County GPS Subsidence Project – In 2004, Glenn County undertook a survey of 58 stations to establish a baseline against which future subsidence can be measured. DWR CVFED Project – GPS surveying was done in 2010 by contractors to DWR’s Central Valley Floodplain Evaluation and Delineation (CVFED) Program in order to rectify vertical control for LiDAR surveys in the San Joaquin River Restoration Program area downstream from Mendota. This survey identified discrepancies with historic elevations at survey monuments.
Topic: Groundwater Land Subsidence from Groundwater Use in California
CA Water Plan Update 2013 Vol 4 Reference Guide Page 109

APRIL 2014 REPORT OF FINDINGS Land Subsidence from Groundwater Use in California
LSCE, BORCHERS AND CARPENTER 90
Observations at geodetic control stations followed NGS procedures for the highest level of vertical accuracy. However, within a couple of years, the control points had subsided; the magnitude was found to be consistent with data from InSAR analyses by the USGS (Sneed et al., 2013). The USBR and DWR now monitor a large area adjacent to the San Joaquin River and flood bypass channels on an annual or semi-annual basis as needed for implementation of the San Joaquin River Restoration Program. Sacramento Valley Subsidence Project – DWR’s Sacramento Valley subsidence-monitoring network includes 11 extensometers and a GPS network. The 11 extensometers (Table 5-3), built to monitor compaction of the aquifer system, straddle the center of the valley from Sutter and Yolo Counties to the south to Butte County in the north. In 2008, DWR and USBR established a comprehensive Sacramento Valley GPS subsidence network that would serve as a framework for monitoring land subsidence and for extending high-accuracy geodetic control to facilities operated by the USBR (including portions of Shasta and Folsom Lakes). This project included all GPS stations from the Glenn and Yolo County projects described above and ultimately consisted of 335 stations (Frame and D’Onofrio, 2008). As of 2014, the network has not been resurveyed. Table 5-3 Sacramento Valley extensometers currently operated by the California Department of Water Resources
Caltrans Highways 152 and 198, San Joaquin Valley – Caltrans surveyed bench marks along highways 152 and 198 in order to expand the North American Vertical Datum of 1988 (NAVD88) network to the east side of the San Joaquin Valley from its alignment on the west side near the California Aqueduct and Interstate Route 5. Surveys in 1972, 1988, and 2004 revealed about 1.6 m (5.25 ft) of subsidence during 1972-2004 along Highway 152; surveys in the 1960s and 2004 show that as much as 2.86 m (9.37 ft) occurred along Highway 198.
State Well No. Latitude Longitude Depth County Type Recording Resolution
Start of Record
Total Displac-ement
Avg Annual Subsid-
ence (ft) (ft) (ft) (ft) 19N01E35B002M 39.46344 -21.82776 1026 Butte Cable 0.005 7/7/2005 0.010 0.001 20N01E18L001M 39.57706 -121.9082 1060 Butte Cable 0.005 3/3/2005 0.000 0.000 18N01E35L001M 39.36744 -21.82787 1006 Butte Cable 0.005 7/8/2005 0.005 0.0007 16N02W05B001M 39.27527 -122.10568 813 Colusa Cable 0.005 2/3/2005 -0.020 -0.003 17N02W09H002M 39.34169 -122.08377 863 Colusa Cable 0.005 8/10/2005 0.005 0.0007 19N02W08Q001M 39.5157 -122.11224 1000 Glenn Cable 0.005 12/1/2005 0.000 0.000 21N02W33M001M 39.62991 -122.10067 1020 Glenn Cable 0.005 3/2/2005 -0.050 -0.007 22N02W15C002M 39.76341 -122.07714 880 Glenn Cable 0.005 3/1/2005 0.050 0.007 11N04E04N005M 38.823863 -21.543073 780 Sutter Pipe 0.001 4/13/1994 -0.029 -0.001 11N01E24Q008M 38.779855 -21.812422 1002 Yolo Pipe 0.001 6/17/1988 -1.381 -0.055 09N03E08C004M 38.64643 -21.667379 716 Yolo Pipe 0.001 1/24/1992 -0.297 -0.014
Topic: Groundwater Land Subsidence from Groundwater Use in California
CA Water Plan Update 2013 Vol 4 Reference Guide Page 110

APRIL 2014 REPORT OF FINDINGS Land Subsidence from Groundwater Use in California
LSCE, BORCHERS AND CARPENTER 91
Delta Mendota Canal Subsidence Project – The USGS (Sneed et al., 2013) used InSAR techniques to determine that the El Nido region, north of Madera near the San Joaquin River Restoration Project area, had subsided 53 cm (21 inches) between January 2008 and January 2010. Data from historical leveling and GPS surveys, continuous GPS sites, water-level observation wells, and compaction recorders were used to assess land subsidence in the vicinity of the Delta-Mendota Canal. As a part of this work by the USGS, USBR, and San Luis Delta-Mendota Water Authority, five multi-piezometer well sites were constructed and instrumented to collect continuous water-level data above and below the Corcoran Clay. Four extensometer sites were instrumented to collect continuous water levels. Antelope Valley Groundwater Basin, 2003 – Increasing demands on groundwater and a potential for further land subsidence throughout Antelope Valley prompted a regional groundwater and land-subsidence investigation by the USGS. A large-scale network of bench marks was established to calculate historical subsidence and enable precise measurements of future subsidence (Ikehara and Phillips, 1994) (Figure 5-5). The network was designed and GPS-surveyed for a valley-wide subsidence-monitoring program. Geodetic surveying of 85 stations using GPS tied newer parts of the network to the previously established subsidence-monitoring network at Edwards Air Force Base (EAFB). Eventually the network also incorporated two extensometer sites, the Holly site at EAFB, 256 m (840 ft) deep, and a dual shallow and deep extensometer 224 m (735 ft) and 367 m (1,205 ft) deep at Lancaster; elevations from differential leveling spanning more than 60 years; and InSAR. Coachella Valley – Concerns about land subsidence resulting from declining groundwater levels prompted a series of USGS investigations to detect and quantify subsidence using GPS surveying and InSAR tools. Subsidence monitoring began in the southern Coachella Valley with the establishment of 17 geodetic monuments during GPS surveying in 1996 (Ikehara et al., 1997). The network was modified in 1998 by replacing two monuments that had been destroyed. The network was modified again by replacing an unstable monument and adding four new monuments prior to the 2000 GPS survey (Sneed et al., 2001, 2002). A GPS survey was conducted in 2005 (Sneed et al., 2013) and the network was again expanded before the 2010 GPS survey. Data showing groundwater level changes between the early and mid-1990s to 2010 were compared to GPS measurements and InSAR-generated maps of land-surface displacement to determine whether vertical changes in land surface elevation were related to changes in groundwater levels (Sneed, USGS, oral communication, October 18, 2013). The land subsidence monitoring program in the Coachella Valley is expected to continue to provide information useful to optimize groundwater management in the valley.
Topic: Groundwater Land Subsidence from Groundwater Use in California
CA Water Plan Update 2013 Vol 4 Reference Guide Page 111

APRIL 2014 REPORT OF FINDINGS Land Subsidence from Groundwater Use in California
LSCE, BORCHERS AND CARPENTER 92
Figure 5-5. Antelope Valley and Edwards Air Force Base Global Positioning System Networks. Santa Clara Valley – The Santa Clara Valley Water District conducts annual monitoring of bench marks and continuous monitoring of extensometers to determine whether land subsidence is occurring or threatening to exceed established subsidence thresholds. Monitoring of land subsidence is performed by annual spirit leveling of three established routes and continuous measurement of vertical ground movement at two extensometers. The District has established an acceptable subsidence rate of no more than 0.01 feet per year, which has been endorsed by the Water Retailer Groundwater Subcommittee. Monitoring data indicate that this target has generally been met. In 1991, the District evaluated the remaining land subsidence potential in order establish water-level thresholds to avoid additional permanent subsidence due to groundwater overdraft. Ten index wells throughout the Santa Clara Subbasin were selected as control points for subsidence calibration and prediction and the tolerable rate of 0.01 feet per year of inelastic subsidence was applied to determine threshold groundwater levels for these wells. These subsidence thresholds are the groundwater levels that must be maintained to ensure a low risk of land subsidence. The USGS installed the extensometers in Santa Clara County in 1960 as part of an early study of aquifer compaction. The extensometers measure vertical ground motion relative to a central, isolated pipe that is set beneath the water-bearing units. The USGS terminated field monitoring in January 1983, at which time monitoring was transferred to the District. Two 1,000 foot deep extensometer sites are currently monitored, one in Sunnyvale near
Topic: Groundwater Land Subsidence from Groundwater Use in California
CA Water Plan Update 2013 Vol 4 Reference Guide Page 112

APRIL 2014 REPORT OF FINDINGS Land Subsidence from Groundwater Use in California
LSCE, BORCHERS AND CARPENTER 93
Moffett Field (“Sunny”) and the other near downtown San Jose (“Martha”). Hanson and others (2004) reconceptualized the aquifer system and built a numerical groundwater-flow model, incorporating a subsidence package, for use as a management tool by the Santa Clara Valley Water District. Mojave Desert Basins – A GPS survey of a geodetic network was used to determine the location, extent, and magnitude of vertical land-surface changes in Lucerne Valley in the Morongo groundwater basin. The GPS survey was conducted in 1998 to estimate historical elevation changes by comparing GPS-derived elevations with historical elevations (which were available for some of the monuments in the network as early as 1944) and to establish baseline values that can be used for comparisons with future GPS surveys. Results were compared to SAR interferograms and historical groundwater-level trends in nearby wells. SAR interferograms and historical groundwater-level data were used similarly for subsidence reconnaissance near Newberry Springs, the Lockhart-Harper Lake area, and near El Mirage Lake. Concerns about the stability of runways on Bicycle Playa that are used to transport troops and supply the Fort Irwin National Training Center prompted an investigation to determine mechanisms causing fissuring, giant desiccation cracks and deformation of the playa surface. The USGS monitors fissuring using repeated geodetic leveling, Electronic Distance Measurement (EDM) surveys, ground-based LIDAR, tiltmeters on each side of the fissure, and horizontal tape extensometer (tapex) measurements. Desiccation mechanisms are studied with heat-dissipation sensors paired with controlled bench-scale desiccation experiments. Water-level measurements are collected at monitoring wells. Chino Basin – The Chino Basin is a large alluvial groundwater basin that has experienced declines in groundwater levels during the past century, in some places more than 61 m (200 ft). The decline in groundwater levels has resulted in inelastic compaction and land subsidence, including ground fissuring in a portion of the basin. The Chino Basin Watermaster manages the basin to minimize land subsidence and ground fissuring. Monitoring includes a network of over 200 ground-level surveying bench marks, remote-sensing analyses to monitor ground surface deformation (InSAR), one horizontal and six vertical borehole extensometers (Table 5-4), and groundwater level measurements (Wildermuth Environmental, 2013) (Figure 5-6). Extensometers paired with water-level monitoring wells record data every 15 minutes. Results of the ongoing monitoring are included in annual State of the Basin reports. SAR data is collected every few months. The period of InSAR analysis is 1993 to present, with some gaps due to unavailability of satellite data. Leveling surveys have been performed every one to three years since 1987, and are used with the InSAR data and extensometer data to determine the state of land subsidence.
Topic: Groundwater Land Subsidence from Groundwater Use in California
CA Water Plan Update 2013 Vol 4 Reference Guide Page 113

APRIL 2014 REPORT OF FINDINGS Land Subsidence from Groundwater Use in California
LSCE, BORCHERS AND CARPENTER 94
Table 5-4 Extensometers currently monitored by the Chino California Water Master.
Continuous measurements of fissure deformation are being made in Chino by Wildermuth Environmental under the auspices of the Chino Basin Watermaster. Measurements of horizontal strain, tilt, liquid-level, temperatures, air pressure, and humidity are recorded. East Bay Municipal Utility District – The USGS and EBMUD cooperatively constructed and, since 2008, have operated a dual-stage extensometer (Table 5-5) paired with six water-level monitoring wells at the Bayside Artificial Storage and Recovery (ASR) facility in San Lorenzo, California. The extensometer is designed to measure aquifer system compaction and expansion during extraction and injection of water at ASR wells. Table 5-5. Construction details and period of record for extensometers currently monitored by the East Bay Municipal Utility District at the Bayside Artificial Storage and Recovery Facility in San Lorenzo.
Name Latitude Longitude Depth
Monitored Type Start of Record (ft)
Ayala Park Shallow 33.993718 -117.687000 30-550 ft Pipe 2003 Ayala Park Deep 33.993718 -117.687000 30-1400 ft Pipe 2003 PC 4 33.995118 -117.686343 50-727 ft Cable 2008 PC 2 33.995118 -117.686343 50-1120 ft Cable 2008 CCX-1 33.967195 -117.647403 0-140 ft Cable July 2012 CCX-2 33.967195 -117.647403 0-610 ft Cable July 2012
Well No. Latitude* Longitude* Monitored
Depth Interval Start of Record Type
Total Measured Compaction
Meter (ft) ft
003S003W14K015 37°40'04.4" 122°09'20.4" 0-182 (598) 7/10/2010 Pipe No permanent
compaction
003S003W14K016 37°40'04.8" 122°09'20.2" 0-299 (980) 7/10/2010 Pipe No permanent
compaction *NAD83
Topic: Groundwater Land Subsidence from Groundwater Use in California
CA Water Plan Update 2013 Vol 4 Reference Guide Page 114

APRIL 2014 REPORT OF FINDINGS Land Subsidence from Groundwater Use in California
LSCE, BORCHERS AND CARPENTER 95
Figure 5-6. Land subsidence monitoring network in the Chino Basin (from Wildermuth Environmental Inc., 2012).
Topic: Groundwater Land Subsidence from Groundwater Use in California
CA Water Plan Update 2013 Vol 4 Reference Guide Page 115

APRIL 2014 REPORT OF FINDINGS Land Subsidence from Groundwater Use in California
LSCE, BORCHERS AND CARPENTER 96
Semitropic Water Storage District, Kern County – Semitropic WSD installed a 277–m (910 ft) deep extensometer (Table 5-6) about 16 miles west of Delano in April 2006. The SWSD monitors aquifer compaction and measures water levels in a multi-completion monitoring well nearby.
Table 5-6. Construction details and period of record for the extensometer currently monitored by the Semitropic Water Storage District near Kern Wildlife Area, Delano.
Well No. Latitude Longitude Monitored Depth
Interval m (ft)
Start of Record Type Total Measured
Compaction (ft)
25S22E35B001M 35°43'07" 119°33'58.2" 0-277 (910) 4/1/2006 Cable No permanent compaction
Cuyama Valley -- As part of groundwater investigations conducted in cooperation with the Water Agency Division of the Santa Barbara County Department of Public Works, the USGS is collecting and analyzing data from the GPS and SAR satellites and 68 wells in the valley. These data are used to estimate the magnitude and extent of land subsidence related to groundwater withdrawal. Data from five GPS stations and 133 unique interferograms (conventional and PS InSAR) spanning December 5, 2002 to May 22, 2008 have been examined to date. No compatible SAR data were available after June 2008.
Topic: Groundwater Land Subsidence from Groundwater Use in California
CA Water Plan Update 2013 Vol 4 Reference Guide Page 116

APRIL 2014 REPORT OF FINDINGS Land Subsidence from Groundwater Use in California
LSCE, BORCHERS AND CARPENTER 97
6 SUMMARY California’s groundwater is a vital resource for municipal, rural residential, agricultural, and commercial water users, and for the health of ecosystems and biological habitats. In an average year, groundwater supplies about 40 percent of the state’s overall water demands. During droughts when surface supplies are limited, groundwater offers a critical buffer, providing a higher percent of the state’s water supply. In 2014, it is anticipated statewide groundwater use will be closer to 65 percent because of the critical nature of this year’s drought. Increasing population and changing cropping and land-use patterns in agricultural areas— replacement of annual row crops orchards or conversion of range land to crops— place more demands on California’s aquifer systems. Historically in California, groundwater has been pumped as needed with little regard for the deleterious effects of over pumping. Chronic groundwater mining, when pumping exceeds recharge, results in a long-term decline of groundwater levels, eventual inelastic compaction of the aquifer system, permanent subsidence of the land surface, and in some cases earth fissures. Some of the more costly consequences of subsidence include coastal flooding, increased extent and depth of inland flooding, reduced freeboard and carrying capacity of canals, aqueducts, rivers and flood bypass channels, and damage to engineered structures such as buildings, roadways, bridges, pipelines, canals, aqueducts, levees, sewerages, and wells. The northern Santa Clara Valley, an alluvial lowland at the south end of the San Francisco Bay, was the first area in California where land subsidence due to groundwater overdraft was recognized, monitored, and stopped. Subsidence probably began by the 1920s but was first recognized during surveys in 1933. Massive withdrawals of groundwater, initially to support agricultural development and later for domestic and industrial uses, eventually resulted in subsidence over much of the area. Subsidence reached a maximum of 4.2 m (14 ft) in downtown San Jose. Direct costs of land subsidence, including damaged and destroyed wells, construction of levees around the southern San Francisco Bay and the bayward ends of stream channels, raising grades of roads and bridges, enlarging sewers, construction and operation of pumping facilities to remove sewage effluent and storm drainage, are estimated at $756 million (2013 dollars). This estimate does not include costs to raise railroad grades, repair damage to flooded roads, construct 80 km (50 mi) of levees to protect salt evaporation ponds that fringe the bay, construct and operate facilities for importation of surface water or artificial recharge of the aquifer system, or to conduct subsidence studies and monitoring programs. It also does not include costs for levees constructed since 1973, the decreased value of property with obstructed views, and limited access to the bay and streams as a result of levee construction. Subsidence in the Santa Clara Valley was halted by 1969 due to the well-coordinated and effective conjunctive use of surface and groundwater that was implemented and is managed by the Santa Clara Valley Water District. Components of the conjunctive use program include
Topic: Groundwater Land Subsidence from Groundwater Use in California
CA Water Plan Update 2013 Vol 4 Reference Guide Page 117

APRIL 2014 REPORT OF FINDINGS Land Subsidence from Groundwater Use in California
LSCE, BORCHERS AND CARPENTER 98
importation of surface water, construction of reservoirs to store local runoff, operation of infiltration ponds for aquifer recharge, implementation of conservation programs, and strict adherence to low tolerance for inelastic compaction of the aquifer system (not more than 3 mm/yr (0.01 ft/yr) on average). Conformance with the requirements for minimal inelastic compaction and subsidence is assessed by a comprehensive monitoring program that continually evaluates data collected from survey lines, groundwater-level index wells, extensometers, and data on both groundwater extraction and groundwater infiltration at surface recharge facilities. The successful arrest of subsidence has been facilitated by the fact that responsibility for water supplies, facility operations, and monitoring of subsidence and related water resources information is centralized at a single agency, the Santa Clara Valley Water District. Impetus for stringent management of subsidence was provided by the obvious effects of coastal flooding. Despite information available describing land subsidence due to groundwater overdraft in the northern Santa Clara Valley (Poland and Tolman, 1940) and recognition of the relation between water-level decline and subsidence near Delano in the Tulare-Wasco area of the San Joaquin Valley by I. H. Althouse (Ingerson, 1940), subsidence from groundwater overdraft was not investigated regionally in the Central Valley until the early 1950s. This is when government agencies became concerned about reductions in the flow capacity of the San Joaquin River and effects of subsidence on the Delta-Mendota Canal, then under construction. Part of the reason for the delayed reaction to subsidence is that it typically occurred uniformly and over such a broad area that few residents or agencies realized that it had happened. As late as the mid-1950s, subsidence in the Arvin-Maricopa area of the valley was ascribed to tectonically uplifted survey control points in the Tehachapi Mountains south of the valley (Whitten, 1955) rather than to the actual causative agent, decline of groundwater levels (Lofgren, 1975). Cooperative studies by DWR and the USGS beginning in 1954 identified three large areas of subsidence from groundwater overdraft, the Los Banos-Kettleman City area on the west side of the mid-valley, the Wasco-Tulare area of the southern valley east of the Tulare Lake bed, and the Arvin-Maricopa area in the extreme southern end of the valley. Eventually, groundwater levels in the deep aquifer system on the west side of the valley declined by more than more than 122 m (400 ft). By 1970, more than 13,400 km2 (5,200 mi2) had subsided more than 0.3 m (1 ft) and the maximum subsidence, near Mendota, was more than 8.5 m (28 ft). Damage to water infrastructure was widespread, but the costs of historical subsidence are not easily determined. Repairs and design changes to the federal canals (Delta-Mendota Canal, Friant-Kern Canal, and the San Luis Drain) totaled more than $103 million. Costs to remediate subsidence on Central California Irrigation District’s Outside Canal will total more than $8.2 million after the scheduled Russell Avenue bridge replacement is complete. Steel casings of thousands of wells were probably destroyed by vertical compression as the land subsided, but there was no centralized collection of this information. Current costs to replace the 275 wells that were reported to have failed casings during 1950-1961 would be $90 million. Surface water imports
Topic: Groundwater Land Subsidence from Groundwater Use in California
CA Water Plan Update 2013 Vol 4 Reference Guide Page 118

APRIL 2014 REPORT OF FINDINGS Land Subsidence from Groundwater Use in California
LSCE, BORCHERS AND CARPENTER 99
from federal and state projects allowed groundwater levels to recover by more than 61 m (200 ft) in some areas on the west side of the valley by 1974. Although increasing water levels slowed subsidence by the early 1970s, some subsidence continued due to delayed drainage of water from compacting clayey aquitards. The rapid decline of groundwater levels during subsequent droughts (1976-1977, 1987-2003) and regulatory reductions in surface water diversions (2007-2010), in response to relatively small amounts of renewed pumping (compared to that of the 1960s), resulted from a loss of storage space in the aquifer system—mostly from inelastic compaction of aquitards and decrease in the hydraulic conductivity (permeability) of compacted aquitards. Observations showed that drought-period water levels were considerably higher than those during the 1960s, yet still triggered renewed land subsidence. This illustrates the complex effects of unequal distribution of preconsolidation stress both within aquitards and between the aquitards and more permeable units of the aquifer system. Comprehensive leveling surveys of the San Joaquin Valley ended in 1970 and, over time, funding for coordinated subsidence investigations ended, and field installations such as borehole extensometers and water-level monitoring wells fell into disrepair. DWR continued to collect compaction data from a few extensometers and from deep monitoring wells where available, and state, federal, and local water agencies continued to run surveys on canal alignments intermittently, but storage and analysis of this information were not centralized. Although anecdotal information from water districts and occasional surveys indicated that continued subsidence was affecting canals and roads, the magnitude, rate, and extent of subsidence revealed from interferometric analysis (InSAR) of data from space-based, SAR satellites during 2003-2011 was startling (Sneed, et al., 2013; Thomas Farr, NASA-JPL, written commun., September, 2013; Jessica Reeves, Stanford University, written commun., July 9, 2013). Two large areas in the San Joaquin Valley are currently subsiding at rates similar to the highest rates observed historically. Subsidence in the northernmost area, encompassing more than 3,100 km2 (1,200 mi2) south of Merced has been occurring in parts of the area at rates of up to 43 cm/yr (11 in/yr)— similar to the maximum rates that occurred in the 1950s and 1960s. Alternative alignments for the Merced to San Jose section of the California high-speed rail line pass through this area (CHSRA, May 2013). Geodetic surveys confirm the InSAR rates and magnitude in the area of the San Joaquin River Restoration Program (SJRRP). There, the flow capacity and levee freeboard of the San Joaquin River, the Eastside Bypass flood channel, and major irrigation canals have been substantially reduced. The capacity of the Eastside Bypass to carry flood flows from the San Joaquin Joaquin River will be reduced by more than 40 percent by 2016 if subsidence continues at current rates. The Sack Dam, which diverts water from the San Joaquin River to the Arroyo Canal, subsided 0.18 m (0.6 ft) during 2008-2010 and 0.5 ft/yr during 2011-2013, halting redesign efforts intended as a part of the SJRRP as water agencies
Topic: Groundwater Land Subsidence from Groundwater Use in California
CA Water Plan Update 2013 Vol 4 Reference Guide Page 119

APRIL 2014 REPORT OF FINDINGS Land Subsidence from Groundwater Use in California
LSCE, BORCHERS AND CARPENTER 100
consider how to adapt to the lowered land surface. It is likely that if interest had not been focused on the San Joaquin River in this reach by SJRRP much less would be known about subsidence there. Current subsidence in the southernmost area, between Tulare and Kettleman City, occurs at rates similar or greater than in the northern area, and this area is more than twice as large as the subsiding area to the north. Maximum subsidence here was 1.2 m (3.9 ft) during 2007-2011. The effects of subsidence on water (and other) infrastructure in this region are probably large, but have only been anecdotally reported, except for a single Caltrans survey line on Highway 198 that shows more than 2.7 m (9 ft) of subsidence between the 1940s and 2004, and subsidence estimated by Corbett (2011) at Lemoore Naval Air Station. Because the alignment of the California high-speed rail line also passes through this subsiding area, studies focused by CHSRA are expected to provide additional information. Land subsidence has been tremendously expensive; partial costs of subsidence to private and local infrastructure in the San Joaquin Valley during 1955-1972 were estimated at $1.321 billion (Gilbert Bertoldi, U. S. Geological Survey (ret.), oral commun., November 29, 2013) and $88.9 million to federal and state canals since they were constructed. Even so, there is currently no centralized, land-subsidence monitoring program in the valley. Funding for monitoring programs usually has not been available except for local surveying, or for the duration of specific and loca1 design, construction, or research projects. Land subsidence from overdraft of groundwater in the Sacramento Valley produced a trough of subsidence from just north of the Colusa-Yolo County line southward through Woodland and Davis to the Dixon area of Solano County. The greatest subsidence, 1.65 m (5.4 feet) (Ikehara, 1994), occurs south of the terminous of the Tehama-Colusa Canal, where agriculture developed relying solely on groundwater for irrigation. Steel casings of many wells in the subsiding area have failed. The current cost to replace 80 wells that were scanned with a downwell television camera to confirm subsidence damage would be $7.2 million. In 2008, DWR and USBR established a comprehensive Sacramento Valley GPS subsidence network, consisting of 335 geodetic monuments that would serve as a framework for monitoring land subsidence. As of 2013, the network has not been fully reoccupied, although Glenn and Yolo Counties have resurveyed monuments within their borders. Extensive pumping in Antelope Valley in the western Mojave Desert since the 1930s contributed to groundwater-level declines of as much as 91 m (300 ft) near Lancaster, California and 45.7 m (150 ft) at Edwards Air Force Base (EAFB). Subsidence of 2 m (more than 6 ft) near Lancaster and more than 1 m (almost 4 ft) at the south edge of Rogers Lake resulted from groundwater pumping that vastly exceeded recharge to the aquifer system. A 600-m-long (0.37 mi-long) fissure located about 11 km (6.8 mi) east-northeast of Lancaster formed in 1978 as a result of
Topic: Groundwater Land Subsidence from Groundwater Use in California
CA Water Plan Update 2013 Vol 4 Reference Guide Page 120

APRIL 2014 REPORT OF FINDINGS Land Subsidence from Groundwater Use in California
LSCE, BORCHERS AND CARPENTER 101
water-level declines of 75 m (245 ft) that occurred prior to its appearance. Differential subsidence caused sink-like depressions and earth fissures on the playa surface of Rogers Lake bed, adversely affecting the runways on the lake bed that are used for landing aircraft. A network of 85 bench marks was designed and GPS-surveyed in Antelope Valley to establish a valley-wide subsidence-monitoring program. Eventually, the subsidence monitoring network expanded to include bench marks at EAFB, InSAR, and extensometers at EAFB and Lancaster. Numerical modeling at the Holly extensometer site at EAFB indicated that two thick confining units account for most of the compaction measured there, and that only half of the ultimate compaction was likely to occur during the 30 years subsequent to the modeling (Galloway and Sneed, 2000). Intensive monitoring of water-levels, aquifer compaction, elevations at 113 bench marks and two GPS stations, surface tilt, well pumpage and injection rates, and subsequent optimization modeling allowed tools to be developed for artificial storage and recovery (ASR) programs to stop land subsidence and store surface water in the aquifer for later use. Groundwater overdraft has also caused subsidence and fissuring in other Mojave Desert basins (Holzer, 1984; Sneed, et al., 2003a; Stamos et al., 2007). In Fremont Valley, water levels in formerly artesian wells declined as much as 74 m (243 ft). Subsidence has tilted the surface of the Koehn Lake playa so that winter rains now flood subsided areas. Differential subsidence has occurred across faults that act as barriers to groundwater flow, creating stepped topography. Large fissures, one of which damaged a house in Rancho Seco, likely formed as a result of differential compaction in areas where aquifer-system thickness varies substantially. There is no active subsidence monitoring in the Fremont Valley. In Lucerne Valley, InSAR and GPS surveys indicate that as much as 6 m (2 ft) of land subsidence may have occurred since 1969 in areas where groundwater levels have declined as much as 30 m (100 ft) since the 1950s. Earth fissures on Lucerne Lake playa likely formed by differential compaction of unconsolidated aquifer sediments southeast of the lake shore, where sediments are believed thickest. InSAR-measured subsidence of 5 cm (0.16 ft) during April 21, 1995-May 1, 1999 at El Mirage (dry) Lake was likely due, in part, to residual inelastic compaction from water-level declines of as much as 53 m (175 ft) during 1950-1999. Subsidence of as much as 8.5 cm (0.28 ft) at Harper Dry Lake playa during 1992-1999 is likely a permanent result of inelastic compaction caused when groundwater levels declined 27 m (90 ft) between the late 1960s and 1999. Subsidence of as much as 45 mm (0.15 ft) indicated by InSAR during 1993-1999 near Troy Dry Lake is likely a permanent result of inelastic compaction of the predominantly clayey aquifer sediments in the area. At Fort Irwin National Training Center, increased groundwater pumping in the 1990s lowered groundwater levels 25 m (82 ft) by 2009 and contributed to 27 cm (10.6 in) of land subsidence during 1993-2006. Concerns about stability of runways on Bicycle Playa that are used to transport troops and supplies prompted an investigation to determine mechanisms causing fissuring, giant desiccation cracks and sink-like depressions. The USGS currently monitors surface deformation there.
Topic: Groundwater Land Subsidence from Groundwater Use in California
CA Water Plan Update 2013 Vol 4 Reference Guide Page 121

APRIL 2014 REPORT OF FINDINGS Land Subsidence from Groundwater Use in California
LSCE, BORCHERS AND CARPENTER 102
The results of USGS GPS surveys beginning in 1996 and InSAR analysis beginning in 2001 indicate that substantial subsidence has occurred in the southern Coachella Valley. Groundwater overdraft has resulted in subsidence of as much as 60 cm (1.97 ft) between June 27, 1995 and September 19, 2010 in the La Quinta and Palm Desert areas. Average subsidence rates were relatively stable, increasing from about 3.9 cm/yr (0.13 ft/yr) during 1995-2000 to about 4.5 cm/yr (0.15 ft/yr) during 2003-2010 in Palm Desert. Subsidence rates in Indian Wells were fairly constant and as high 3.4 cm/yr (0.11 ft/yr) during the same period. Average subsidence rates in the La Quinta area were as high as 3.7 cm/yr (0.12 ft/yr) during 1995-2000, held constant or increased during 2003-2009, and decreased or reversed during 2009-2010 as water levels rose in response to deliveries of Colorado River water to groundwater recharge facilities. An earth fissure was discovered in the 1948 in the La Quinta area (Sneed, USGS, oral commun., May 30, 2013), and fissuring recently reoccurred there. The Coachella branch of the All American Canal subsided as much as 41 cm (1.35 ft) in the La Quinta area during June 27, 1995 to September 19, 2010. Groundwater level declines of more than 40 m (131 ft) during 1978-early 1990s caused as much as 1.2 m (almost 4 ft) of land subsidence during 1986-1993 in the Chino Groundwater Basin. Earth fissures developed in 1973 and again during 1987-1995. The fissure zone extends almost 3,200 m (2 mi) and may be more than 200 m (656 ft) wide and 420 m (1400 ft) deep. In the 1990s, it drained a manure pond and split a house that was condemned and razed. The fissure likely formed in response to flexure or differential compaction across a fault barrier in the deep aquifer. The Chino Groundwater Basin is intensely monitored. Monitoring includes a network of over 200 ground-level surveying bench marks, InSAR analyses, one horizontal and 6 vertical borehole extensometers, and about 50 groundwater-level monitoring wells. Differential subsidence also occurs across the Pomo fault in Pomona, California area. Monitoring likely will continue indefinitely to provide the Chino Basin water master with the data needed to manage the basin while minimizing land subsidence and ground fissuring. Small amounts of land subsidence were noted in InSAR analysis (March 28-August 15, 1997) in three places in the Paso Robles area. Subsidence ranging from about 1.4 cm (0.6 in) to 5.4 cm (2 in) occurred in areas where groundwater levels declined seasonally. Some of this subsidence then was likely elastic. Recently, though, substantially declining groundwater levels have been reported that may trigger inelastic compaction and permanent subsidence. Land subsidence is not currently being monitored. There is no land subsidence monitoring program in the San Luis Obispo area, either, despite significant damage from land subsidence. In 1991, during the fourth year of a drought, the City of San Luis Obispo decided to increase groundwater extraction to meet demand that could no longer be supplied by their dwindling surface reservoirs. The resulting differential land subsidence damaged a strip shopping mall, a car dealership, and homes in a nearby development.
Topic: Groundwater Land Subsidence from Groundwater Use in California
CA Water Plan Update 2013 Vol 4 Reference Guide Page 122

APRIL 2014 REPORT OF FINDINGS Land Subsidence from Groundwater Use in California
LSCE, BORCHERS AND CARPENTER 103
Eventually, the City paid about $2 million to claimants. This is the only example of a damage suit for subsidence caused by groundwater extraction decided in favor of the plaintiffs. Water-supply wells in the affected area have been abandoned and groundwater levels are monitored by the City staff. Earth fissures that formed in Cambria in response to lowered groundwater levels during the 1976-1977 drought damaged buildings and other infrastructure. The City of Cambria developed additional sources of water, and fissures have not reoccurred. The area has no land subsidence monitoring. Active tectonic uplift and subsidence due to hydrocarbon extraction complicates assessment of aquifer compaction in the Santa Clara-Calleguas Basin. However, a bench mark distant from known tectonic influences and oil fields subsided as much as 0.8 m (2.6 ft) between 1939 and 1978. Water-level declines greater than 30 m (100 ft), subsurface collapse of well casings in the South Pleasant Valley subbasin and South Oxnard Plain subarea, the necessity of repeated leveling of irrigated fields for proper drainage, degraded drainage ditches in agricultural areas, and lowering of levees along the Calleguas Creek all indicate that subsidence has occurred. Numerical modeling of the aquifer system indicates that subsidence of 0.9-1.5 m (3-5 ft) occurred during agricultural expansion in the 1950s and 1960s (Hanson et al., 2003). Monitoring of land subsidence is not described in published reports. Earth fissures formed in Wolf Valley in 1987 and moved northward seven miles through the Elsinore Trough, a fault-bounded structural basin, to the Temecula-Murrieta area. By 1991, fissures had caused damage to surface structures that exceeded $50 million. The location of the fissures is primarily controlled by two faults, but most investigators concur that that fissures formed when increased pumping caused inelastic compaction and differential subsidence across the faults. Many lawsuits and consulting reports describe this event. Since pumping stopped, fissures have not increased in number or in size. Current subsidence monitoring is not described in the available literature. Subsidence in the San Jacinto Valley has components of both tectonics and aquifer compaction. Groundwater levels declined more than 68.6 m (225 ft) during the 1970s, and fissures and sinkholes formed after 1953, coincident with faults on the east and basin-bounding hills to the west. Differential subsidence of 71 cm (2.34 ft) measured across the basin-bounding fault likely resulted from differential compaction of the aquifer system. Aquifer compaction measurements collected at an extensometer during 1970-1974 indicated that 70-80 percent of permanent subsidence measured in the valley resulted from aquifer compaction; the remainder was attributed to tectonics. The current status of subsidence is unknown.
Topic: Groundwater Land Subsidence from Groundwater Use in California
CA Water Plan Update 2013 Vol 4 Reference Guide Page 123

APRIL 2014 REPORT OF FINDINGS Land Subsidence from Groundwater Use in California
LSCE, BORCHERS AND CARPENTER 104
The Yucaipa Valley has a long history of water development. By 1909, about 95 percent of the area’s water supply was used for agricultural irrigation. Irrigation wells to support agriculture and post-World War II urbanization contributed to groundwater-level declines of more than 35 m by 1952. In January 1952, a 600-m-long (1970 ft-long) fissure opened about 5 km (3.1 mi) west of the town of Yucaipa. Hydrogeologic studies were not performed to determine whether historically low groundwater levels in 1952 triggered the fissure. Subsidence currently is not monitored in the Valley. Tectonic deformation and hydrocarbon production also complicate assessment of subsidence due to aquifer compaction in the Cuyama Valley, where groundwater is the sole source of supply for a large agricultural industry. The subsidence due to groundwater level decline of as much as 100 m (300 ft) since the 1940s is unknown. Continuous GPS measurements indicate that the valley moves tectonically 0.7 to 1.3 mm (0.03 to 0.05 in) upward and 25 to 36 mm (1 to 1.4 in) to the northwest each year. In parts of the valley where groundwater levels declined below historically low levels during December 2002-May 2008, InSAR detected longer-term subsidence of about 8 to 12 mm/yr (0.31 to 0.47 in/yr), which amounts to 40 to 65 mm (1.6 to 2.6 in) of total subsidence during the period of observation. This long-term subsidence results from inelastic compaction of the aquifer system. Extraction of hydrocarbons at two oil fields in the valley and nearby oil wells apparently had little effect on subsidence during 2002-2011. USGS monitoring and evaluation of the Cuyama Valley aquifer system continues.
6. 1 Conclusions
Subsidence is a significant problem in California that has gone largely unrecognized by the general public. Recently, the work by Sneed et al. (2013) has raised awareness of ongoing land subsidence within the geotechnical community. But much more remains to be done to educate the general public on the significance and implications of land subsidence. Land subsidence resulting from inelastic compaction of aquifer systems has generally gone unnoticed until substantial infrastructure disruption occurs. Cost estimates for infrastructure repair have been very high; the future costs of infrastructure malfunction, disrepair, and destruction are unknown. Data collection related to subsidence, and the interpretation of such information, is fragmented. It is critical to develop coordinated data colllection, storage, and analysis standards for subsidence-related information. No state or federal governmental agency in California has the responsibility or a program in place, specifically to monitor land subsidence. Consequently, there are no state-wide monitoring networks. Smaller local monitoring networks are sometimes constructed to address a specific subsidence issue. These small networks usually are not geared for long-term monitoring, but rather operate for a project-specific period of time. There a few exceptions. Adjudicated basins sometimes have management objectives that require detailed subsidence monitoring and reporting, as do some agencies that are the primary purveyor of water
Topic: Groundwater Land Subsidence from Groundwater Use in California
CA Water Plan Update 2013 Vol 4 Reference Guide Page 124

APRIL 2014 REPORT OF FINDINGS Land Subsidence from Groundwater Use in California
LSCE, BORCHERS AND CARPENTER 105
in a region. In response to SB 1938 for subsidence monitoring as part of Groundwater Management Plans, some such plans now include local monitoring for subsidence.
Topic: Groundwater Land Subsidence from Groundwater Use in California
CA Water Plan Update 2013 Vol 4 Reference Guide Page 125

APRIL 2014 REPORT OF FINDINGS Land Subsidence from Groundwater Use in California
LSCE, BORCHERS AND CARPENTER 106
7 RECOMMENDATIONS There is a strong need for regional-to-statewide coordination of ongoing data collection and monitoring, including groundwater level data. And whereas solutions to subsidence issues may be developed (sub)regionally, consistent procedures for collection and storage of water-resources data pertinent to subsidence need to be centrally coordinated by a single agency. Although the costs of subsidence in the San Joaquin Valley were estimated as more than $1.321 billion in 2013 dollars, there is currently no centralized, land-subsidence monitoring program in the valley. Funding for monitoring programs usually has not been available except for the duration of a specific loca1 design, construction, or research project. The lack of a multi-agency coordinated data repository, which is essential to the evaluation of subsidence, and the lack of funding to support technical synthesis and evaluation of land-based and remotely sensed data, point to a real need to address an ongoing problem that has immense implications for the State of California. This section presents recommendations for the monitoring and research needed to address historical and recent subsidence issues, better understand areas susceptible to future subsidence, and minimize future subsidence-related damages.
7. 1 Data Collection, Storage, and Dissemination
Currently, collection, storage, dissemination, and reporting of the data required to monitor and evaluate land subsidence is dispersed among many federal, state, and local agencies. Centralized data maintenance responsibility could assure consistent procedures for the collection, storage, and availability of pertinent water-resources data. Alternatively, regional coordination of these responsibilities and an ongoing repository for the storage and disbursement of these data would facilitate their efficient use by government agencies, water purveyors and their consultants, and the public. The Arizona Department of Water Resources (ADWR) has developed a land subsidence monitoring program (Conway, 2013) that could provide a model for implementing a statewide subsidence-monitoring program in California. ADWR has developed an extensive library of over 1,200 SAR scenes used to develop InSAR data, covering an area greater than 150,000 square miles at a cost of more than $750,000, mostly paid for by grants and cooperating agencies. ADWR has compiled a statewide dataset for the active land subsidence areas identified with InSAR in Arizona. Using these data, ADWR has identified more than 25 land subsidence features in Arizona, collectively covering more than 1,100 square miles. ADWR provides land subsidence maps on their website. As of May 2013, 163 land subsidence maps are available for download and are used on a daily basis by the geotechnical community. GPS surveying supports the InSAR program. ADWR uses InSAR data for monitoring land subsidence and seasonal land deformation; assessing natural and artificial recharge events; geological mapping and
Topic: Groundwater Land Subsidence from Groundwater Use in California
CA Water Plan Update 2013 Vol 4 Reference Guide Page 126
APRIL 2014 REPORT OF FINDINGS Land Subsidence from Groundwater Use in California
LSCE, BORCHERS AND CARPENTER 107
investigations; locating earth fissures; identifying areas where conditions may exist for future earth fissure formation; and dam mitigation and land subsidence modeling. Recommendations for data collection are listed topically below. 7.1.1 Monitoring Land Surface Elevation Changes and Compaction
Remote Surveillance and Analysis
InSAR InSAR provides the most cost efficient method to generate high-resolution land-surface deformation information over large areas with high spatial detail. Different InSAR products would provide the information and imagery to communicate to the general public the occurrence of subsidence.
· The United States does not have an operating radar satellite that can provide data for InSAR analysis. Encourage the federal government to launch new SAR satellites or participate in a consortium to do the same. (NASA and the Indian Space agency are cooperating to construct and launch a SAR satellite this decade.)
· Acquire all available SAR data covering unconsolidated aquifer systems in the State of California.
· Systematically prepare conventional InSAR interferograms (C-band and L-band as needed) for reconnaissance assessment of land subsidence in alluvial basins.
· Identify areas of decorrelation on interferograms that also are areas likely to subside. · Install radar reflectors in key positions in areas that appear consistently decorrelated. · Prepare Persistent Scatterer (PS) InSAR interferograms in areas where SAR data are
adequate and conventional InSAR or ancillary data to indicate potential aquifer compaction.
· Immediately process PS InSAR for all major canal systems in agricultural areas or areas of known over pumping of groundwater.
· Make time series of the interferograms available for web-based access by the public (see http://ca.water.usgs.gov/mojave/gmaps/mojave.cgi).
Continuous GPS Many CGPS sites are used as components of land deformation monitoring networks that were designed to quantify the horizontal movement of tectonic plates. Because very few CGPS sites were installed with the intent to monitor land subsidence, most are not optimally located for subsidence monitoring purposes. More CGPS sites and data evaluation in conjunction with InSAR analysis will greatly enhance the interpretation of land subsidence.
· Examine CGPS data statewide for deformation/motion signals and likely deformation sources.
Topic: Groundwater Land Subsidence from Groundwater Use in California
CA Water Plan Update 2013 Vol 4 Reference Guide Page 127
APRIL 2014 REPORT OF FINDINGS Land Subsidence from Groundwater Use in California
LSCE, BORCHERS AND CARPENTER 108
· Evaluate CGPS locations with respect to unconsolidated aquifer systems. · Correlate CGPS motions from suitable locations with InSAR results. · Install new CGPS stations, including locations relevant to areas of actual or potential
aquifer system compaction. Co-locate new CGPS installations with extensometers.
Ground Surveillance and Analysis
Surveying · Collect and archive (digitize) historical leveling surveying information. · Make historical leveling data available for web-based access by the public. · Conduct GPS surveys where InSAR or infrastructure effects indicate that subsidence is
occurring or where groundwater use is increasing. · Correlate surveys with InSAR and CGPS data. · Correlate surveys with groundwater-level data (including temporal data that indicate
highest and lowest groundwater levels historically). · Improve geodetic networks by upgrading and protecting geodetic monuments. · Investigate conjunctive application of innovative techniques of surface (and subsurface)
monitoring to elucidate the processes responsible for fissuring and aid development of predictive capabilities.
Borehole Extensometry · Evaluate the distribution of extensometers in groundwater basins and subbasins;
determine which basins/subbasins are covered and which are not. · Compile and assess compaction data for the period of extensometer records. · Refurbish abandoned extensometers in priority areas. · In unmonitored areas identify aquifer system intervals likely to compact if stressed by
groundwater pumping. · Design and install new extensometers to monitor likely compacting intervals in areas
where InSAR, CGPS, surveying, or infrastructure effects indicate that subsidence is occurring, or where groundwater use is increasing.
· Collocate extensometers and multi-level (multi-depth) piezometers so that water-level change (stress) can be analyzed jointly with compaction (stress) in compacting intervals of aquifer systems.
7.1.2 Characterize Aquifer System and Monitor Groundwater Levels
Because groundwater level declines can trigger land subsidence, it is important to monitor, compile, and interpret groundwater levels throughout the state. Because aquitard compaction supplies much of the water produced from confined aquifers, monitoring changing hydraulic head in thick aquitards would advance the understanding of delayed yield from these layers and their compaction when hydraulic heads vary in adjacent aquifers. In order to make groundwater level monitoring measurements meaningful, and to use these measurements to understand the response of the aquifer system to natural factors (e.g., precipitation and
Topic: Groundwater Land Subsidence from Groundwater Use in California
CA Water Plan Update 2013 Vol 4 Reference Guide Page 128

APRIL 2014 REPORT OF FINDINGS Land Subsidence from Groundwater Use in California
LSCE, BORCHERS AND CARPENTER 109
droughts), imposed factors (e.g., pumping and artificial recharge) and the potential for land subsidence, requires that the construction of monitored wells be understood in the context of the aquifer system. Subsurface lithology used to characterize the aquifer system can be obtained from a variety of sources; the most prevalent form of this information is well completion reports submitted by drilling contractors. Although these reports vary greatly in the quality of information recorded, they capture subsurface information that is critical to understanding the relationships between measured groundwater levels and the subsurface location and thickness of clayey layers susceptible to compaction.
· Centralize the collection and storage of groundwater-level data collected by all federal, state, and local entities.
· Provide web access to these data as charts, text files, spreadsheets, and database files. · Provide timely updates to web-based data files upon collection of new groundwater-level
data. · Correlate wells in the groundwater-level data base with the representation of their
construction relative to the aquifer system so the measured data can be used to assess the representation of hydraulic head.
· In cases where construction information for groundwater-level monitoring wells is unavailable, establish a program to collect this information by borehole investigations such as down-well TV camera scans, depth measurement, and interviewing owners and drilling companies.
· Assess the distribution of groundwater-level monitoring wells areally and vertically within the aquifer system to identify locations where additional monitoring wells are needed to track changes in hydraulic head. Find or construct suitable wells in these areas.
· Investigate and experiment with innovative techniques to measure changing hydraulic head in aquitards at collocated extensometers.
· Establish standards for drillers to report well locations as GPS-determined latitude and longitude or other horizontal coordinate system. Continue traditional reporting by sketch or other maps.
· Create a data base of unconsolidated deposits/basin-texture information based on a consistent coding of lithology or sediment type reported on DWR well completion reports, which would aid in locating fine-grained materials which are susceptible to subsidence.
7.2 Prioritizing and Evaluating Subsiding Groundwater Basins
If the above data were in centrally available databases and archives, groundwater basins statewide could be more easily and consistently prioritized for subsidence-relevant planning. In priority basins, a step-wise planning assessment might proceed as follows:
· After evaluating historical groundwater-level monitoring information, establish augmented groundwater-level monitoring networks to fully characterize the variation in hydraulic head throughout the aquifer system.
Topic: Groundwater Land Subsidence from Groundwater Use in California
CA Water Plan Update 2013 Vol 4 Reference Guide Page 129

APRIL 2014 REPORT OF FINDINGS Land Subsidence from Groundwater Use in California
LSCE, BORCHERS AND CARPENTER 110
· After characterizing land surface deformation in priority basins with InSAR techniques, and follow-up geodetic surveys in subsiding areas, establish a program of regular InSAR monitoring. Data needed for InSAR analysis are not always available or of sufficient reliability for this, therefore, ground-based surveying is needed to verify and augment InSAR analysis.
· Establish a network of CGPS stations in subsiding areas to provide time-series data at critical points.
· Establish borehole extensometers and associated multi-level monitoring well arrays to measure compaction and hydraulic head in various depth intervals of the aquifer system at selected points. This enables determination of aquifer mechanical and hydraulic properties and identification of critical groundwater levels that trigger permanent land subsidence; this information is needed to inform design of subsidence mitigation efforts.
· Test innovative new techniques to improve the accuracy and lower the cost of extensometers, incorporating magnetic markers, fiber optics and other new materials.
· In seriously affected areas, assess alternative sources of water and evaluate the potential for artificial recharge.
· Establish measurable basin management objectives (BMOs) that identify goals for groundwater levels, land-surface elevations, and rates of change of each to avoid amounts or rates of inelastic compaction judged to be inappropriate for efficient operation of local infrastructure. These BMOs could be implemented through pumping strategies, artificial recharge, conservation strategies, and other sustainable groundwater management alternatives.
· Develop numerical models that can be applied basin-wide (regionally) and account for delayed drainage of aquitards, stress-dependent parameters hydraulic conductivity and skeletal specific storage.
· Continue to develop data needed to improve numerical models of three-dimensional deformation of aquifer systems and fissuring.
7.2.1 Reporting Groundwater management plans and water-supply investigations in alluvial basins should include historical information on land subsidence, spatial and temporal variation of groundwater levels, and estimate critical water-levels that will trigger permanent land subsidence. The evaluation of critical water levels should consider relations between, confining unit thickness and hydraulic conductivity and open intervals in wells, to assess the likelihood that groundwater levels declining in the future, but not exceeding historically low levels, might trigger subsidence. Land subsidence should be regularly assessed for each groundwater basin and/or subbasin (especially priority basins) and reported to establish and record current conditions and future trends.
Topic: Groundwater Land Subsidence from Groundwater Use in California
CA Water Plan Update 2013 Vol 4 Reference Guide Page 130

APRIL 2014 REPORT OF FINDINGS Land Subsidence from Groundwater Use in California
LSCE, BORCHERS AND CARPENTER 111
8 REFERENCES Agen, Z., G. Shiliang, L. Carbognin, and A.I. Johnson, eds. 2005. Land Subsidence-- Proceedings of the Seventh International Symposium on Land Subsidence, Shanghai, China, October 23-28, 2005, Shanghai Scientific & Technical Publishers, v. 1: 465 p., v. 2: 466-924. Albright, M. B., Jr. 1968. Subsidence and recent development operations in Wilmington oil field, California. In The Interstate Oil Compact Commission Committee Bulletin 10, 2: 3-14. Allen, A. S. 1969. Geologic settings of subsidence. Reviews in Engineering Geology 2, 305–342. Allen, D.R. 1969. Collar and radioactive bullet logging for subsidence monitoring. In Transactions of the Society of Petrophysicists and Well Log Analysts Tenth Annual Logging Symposium, Houston Texas, May 25-28, 1969, preprint, 19p. Allen, D. R. 1974. Oil field structure and subsidence bowl, Long Beach, California. South Coast Geol. Surv. Irvine, Calif., United States. 36-41. Allen, D.R. 1976. Subsidence susceptibility: methods for appraisal. In A.I. Johnson, ed., Proceedings of the Second International Symposium on Land Subsidence, Anaheim, California, December 13–17,1976, International Association of Hydrological Sciences Publication 121: 309-317. Allen, D. R. and M. N. Mayuga. 1969. The mechanics of compaction and rebound, Wilmington oil field, Long Beach, California, USA. In Land subsidence-- Proceedings of the Tokyo Symposium, Tokyo, Japan, September 1969, vol. 2, International Association of Scientific Hydrology Publication 89: 410–423. http://iahs.info/redbooks/a088/088046.pdf. Anonymous. 1937. Ground subsides on 2-mile line [near Los Angeles, California]. Engineering News Record. 119; 4, Pages: 136. New York, New York: McGraw Hill. Atwater, B.F. 1980. Attempts to correlate Late Quaternary climatic records between the San Francisco Bay, the Sacramento- San Joaquin Delta, and the Mokelumne River, California. Ph.D. diss., University of Delaware. Barends, F. B. J., F.J.H. Brouwer, and F.H. Schröder. 1995. Land subsidence. In Proceedings of the Fifth International Symposium on Land Subsidence, October 16-20, 1995, The Hague, Netherlands, International Association of Hydrological Sciences Publication 234, 492. http://iahs.info/redbooks/234.htm. Basagaoglu, H., M. A. Marino, T. M. Botzan. 1999. Land subsidence in the Los Banos-Kettleman City area, California; past and future occurrence. Physical Geography 20, no. 1: 67-82. Publisher V. H. Winston and Son Silver Spring, MD, United States.
Topic: Groundwater Land Subsidence from Groundwater Use in California
CA Water Plan Update 2013 Vol 4 Reference Guide Page 131
APRIL 2014 REPORT OF FINDINGS Land Subsidence from Groundwater Use in California
LSCE, BORCHERS AND CARPENTER 112
Bawden, G.W. 2003. Separating ground-water and hydrocarbon-induced surface deformation from geodetic tectonic contraction measurements across metropolitan Los Angeles, California. In K.R. Prince and Galloway, D.L., eds., U.S. Geological Survey subsidence interest group conference, proceedings of the technical meeting, Galveston, Texas, November 27-29, 2001. U.S. Geological Survey Open-File Report 03-308. http://pubs.usgs.gov/of/2003/ofr03-308/. Bawden, G.W., M. Sneed, S.V. Stork, and D.L. Galloway. 2003. Measuring human-induced land subsidence from space. U.S. Geological Survey Fact Sheet 069-03. http://pubs.er.usgs.gov/publication/fs06903. Bawden, G.W., W. Thatcher, R.S. Stein, K.W. Hudnut, and G. Peltzer. 2001. Tectonic contraction across Los Angeles after removal of groundwater pumping effects. Nature 412, 812–815. Bean, R.T. 1998. Pioneering field study of hydrocompaction in the San Joaquin Valley. In J.W. Borchers, ed. Land Subsidence ― Case Studies and Current Research, Proceedings of the Dr. Joseph F. Poland Symposium on Land Subsidence, Association of Engineering Geologists Special Publication 8, 37-44. Belitz, K. and F.J. Heimes. 1990. Character and evolution of the ground-water flow system in the central part of the western San Joaquin Valley, California. U.S. Geological Survey Water-Supply Paper 2348. http://pubs.er.usgs.gov/publication/wsp2348. Bell, J.W. 1981. Subsidence in Las Vegas Valley. Nevada Bureau of Mines and Geology Bulletin 5. Bertoldi, G.L. 1992. Subsidence and consolidation in alluvial aquifer systems: changing practices in ground-water management-- the pros and cons of regulation. In Proceedings of the Eighteenth Biennial Conference on Ground Water, September 16-17, 1991. Sacramento, California. 63-74. Bertoldi, G.L., R.H. Johnston, and K.D. Evenson. 1991. Ground water in the Central Valley, California—a summary report. U.S. Geological Survey Professional Paper 1401-A, 44 p. http://pubs.er.usgs.gov/publication/pp1401A. Biot, M.A. 1941. General theory of three-dimensional consolidation, Journal of Applied Physics. 12, no. 2: 155-164. Blodgett, J.C. 1995. Land subsidence and problems affecting land use at Edwards Air Force Base and vicinity, California, 1990. In K.R. Prince, D.L. Galloway, S.A. and Leake, eds., U.S. Geological Survey Subsidence Interest Group Conference, Edwards Air Force Base, Antelope Valley, California, November 18-19, 1992, Abstracts and summary, U.S. Geological Survey Open-File Report 94-532, 40-43. http://pubs.usgs.gov/of/1994/ofr94-532/. Blodgett, J.C., M.E. Ikehara, and J.S. Williams. 1990. Monitoring land subsidence in Sacramento Valley, California, using GPS. American Society of Civil Engineers Journal of Survey Engineering 116, no. 2:112–130.
Topic: Groundwater Land Subsidence from Groundwater Use in California
CA Water Plan Update 2013 Vol 4 Reference Guide Page 132

APRIL 2014 REPORT OF FINDINGS Land Subsidence from Groundwater Use in California
LSCE, BORCHERS AND CARPENTER 113
Blodgett, J.C. and J.S. Williams. 1992. Land subsidence and problems affecting land use at Edwards Air Force Base, California, 1990. U.S. Geological Survey Water-Resources Investigations Report 92-4035. http://pubs.er.usgs.gov/usgspubs/wri/wri924035. Blom, R., E. Fielding, J. Frink, T. Patzek, and D. Silin. 2006. Monitoring subsidence at the Lost Hills Diatomite Oil Field, California using SAR interferometry and other remote sensing technologies, NASA technical document 20060022663, 40 p. http://archive.org/details/nasa_techdoc_20060022663, accessed August 26, 2013. Bondor, P.L. and E. de Rouffignac. 1995. Land subsidence and well failure in the Belridge diamomite oil field, Kern County, California. Part II. Applications, In F.B.J. Barends, J.J.B. Frits, and F.H. Schroder, eds., Land Subsidence-- Proceedings of the Fifth International Symposium on Land Subsidence. The Hague, Netherlands, October 16-20, 1995, International Association of Hydrological Sciences Publication 234, 69-78. Borchers, J.W., ed. 1998. Land Subsidence – Case Studies and Current Research. Proceedings of the Dr. Joseph F. Poland Symposium on Land Subsidence. October 4-5, 1995, Sacramento, California, Association of Engineering Geologists Special Publication 8, 576 p. Borchers, J.W. 1998. Remembering Joe: Anecdotes from his colleagues. In J.W. Borchers, ed., Land Subsidence ― Case Studies and Current Research, Proceedings of the Dr. Joseph F. Poland Symposium on Land Subsidence. Association of Engineering Geologists Special Publication 8, 59-71. Borchers, J.W., Gerber, M. J. Wiley, and H.T. Mitten. 1998. Using down-well television surveys to evaluate land subsidence damage to water wells in the Sacramento Valley, California. In J. W. Borchers, ed., Land Subsidence― Case Studies and Current Research, Proceedings of the Dr. Joseph F. Poland Symposium on Land Subsidence. Association of Engineering Geologists Special Publication 8, 89-105. Borchers, J.W., D.L. Galloway, H. Phipps, and A. Thomas. 1999. Land subsidence ― an often overlooked consequence of our water-use practices. Hydrovisions (newsletter of the Groundwater Resources Association of California) 8, no. 2.: 1-8. Botzan, Tudor M., M.A. Marino, and H. Basagaoglu. 1999. Drought subsidence prediction model for the western San Joaquin Valley, California. Water International 24, no. 3: 221-228. Bouwer, H. 1977. Land subsidence and cracking due to groundwater depletion. Ground Water 15, no. 5: 358-364. Bowersox, J.R. 2004. Late Neogene paleobathymetry, relative Sea Level, and basin-margin subsidence, northwest San Joaquin Basin, California, Search and Discovery article 30029, American Association of Petroleum Geologists Data Pages, 7 p. http://www.searchanddiscovery.com/documents/2004/bowersox/images/bowersox.pdf
Topic: Groundwater Land Subsidence from Groundwater Use in California
CA Water Plan Update 2013 Vol 4 Reference Guide Page 133

APRIL 2014 REPORT OF FINDINGS Land Subsidence from Groundwater Use in California
LSCE, BORCHERS AND CARPENTER 114
Bradley, M.D. and M.C. Carpenter. 1986. Subsiding land and falling ground-water tables; public policy, private liability, and legal remedy. Economic Geography 62, 3: 241-253. Brandt, J.T., G. Bawden, and M. Sneed. 2005. Evaluating subsidence in the San Joaquin Valley, California using InSAR. EOS Transactions, American Geophysical Union 86, no. 52, Fall Meeting Supplement, Abstract G51C-0851. Broadbent, F.E. 1960. Factors influencing the decomposition of organic soils in the California Delta, Hilgardia 29: 587-612. Brooks, B.A., G. Bawden, D. Manjunath, C. Werner, N. Knowles, J. Foster, J. Dudas, and D.R. Cayan. 2012. Contemporaneous subsidence and levee overtopping potential, Sacramento-San Joaquin Delta, California, San Francisco Estuary and Watershed Science, v. 10, no. 1, p. 1-17. Bruno, M.S., and C.A. Bovberg. 1992. Reservoir compaction and surface subsidence above the Lost Hills Field, California, Rock Mechanics, Tillerson and Wawersik (eds.), p. 263-272. Bull, W.B. 1961. Causes and mechanics of near-surface subsidence in western Fresno County, California. U.S. Geological Survey Professional Paper 424-B, p. 187-189. http://pubs.er.usgs.gov/publication/pp424B. Bull, W. B. 1964. Alluvial fans and near-surface subsidence in Western Fresno County, California. U.S. Geological Survey Professional Paper 437-A, 71 p. http://pubs.er.usgs.gov/usgspubs/pp/pp437A. Bull, W.B. 1972. Prehistoric near-surface subsidence cracks in western Fresno County, California, U.S. Geological Survey Professional Paper 437-C, 85 p. http://pubs.er.usgs.gov/publication/pp437C. Bull, W.B. 1973. Geologic factors affecting compaction of deposits in a land subsidence area. Geological Society of America Bulletin 84: 3783-3802. Bull, W.B. 1975. Land subsidence due to ground-water withdrawal in the Los Banos-Kettleman City area, California. Part 2, Subsidence and compaction of deposits, U.S. Geological Survey Professional Paper 437-F, 90 p. http://pubs.er.usgs.gov/usgspubs/pp/pp437F. Bull, W.B. 1998.Tectonic controls of geomorphic processes in a land subsidence area, in J. W. Borchers, ed., In Land Subsidence― Case Studies and Current Research, Proceedings of the Dr. Joseph F. Poland Symposium on Land Subsidence, Association of Engineering Geologists Special Publication 8, 29-35. Bull, W.B. and R.E. Miller. 1975. Land subsidence due to ground-water withdrawal in the Los Banos-Kettleman City area, California. Part 1. Changes in the hydrologic environment conducive to subsidence. U.S. Geological Survey Professional Paper 437-E, 70 p. http://pubs.er.usgs.gov/publication/pp437E.
Topic: Groundwater Land Subsidence from Groundwater Use in California
CA Water Plan Update 2013 Vol 4 Reference Guide Page 134

APRIL 2014 REPORT OF FINDINGS Land Subsidence from Groundwater Use in California
LSCE, BORCHERS AND CARPENTER 115
Bull, W. B. and J. F. Poland. 1975. Land subsidence due to ground-water withdrawal in the Los Banos-Kettleman City area, California, Part 3. Interrelations of water-level change, change in aquifer-system thickness, and subsidence. U. S. Geological Survey Professional Paper 437-G, 62 p. http://pubs.er.usgs.gov/usgspubs/pp/pp437G. Burbey, T.J. 1994. A finite-difference model of three-dimensional granular displacement. Thesis presented to the University of Nevada, Reno, in partial fulfillment of the requirement for the degree of Doctor of Philosophy in hydrology/hydrogeology. Burbey, T.J. 1996. The role of horizontal displacement in evaluating earth-fissure development in the vicinity of faults in subsidence-prone areas. Abstracts with Programs, 38, Association of Engineering Geologists 39th Annual Meeting, East Brunswick, New Jersey. Burbey, T.J. and D.C. Helm. 1999. Modeling three-dimensional deformation in response to pumping of unconsolidated aquifers. Environmental and Engineering Geoscience 5: 199-212. Burbey, T.J. 2001. Storage coefficient revisited: is purely vertical strain a good assumption? Ground Water, 39, no.3, 458-464. Burbey, T.J. 2002. The influence of faults in basin-fill deposits on land subsidence, Las Vegas Valley, Nevada, USA. Hydrogeology Journal 10: 525-538. Burbey, T.J. 2006. Three-dimensional deformation and strain induced by municipal pumping,
Part 2: Numerical analysis. Journal of Hydrology 35, no. 3: 422-434. Burbey, T.J. 2010. Mechanisms for earth fissure formation in heavily pumped basins, Proceedings of the Eighth International Symposium on Land Subsidence, Querétaro, Mexico, October 17–22, 2010. International Association of Hydrological Sciences Publication 339, p. 3-8. Burke, H.K. 1980. Report on causes of subsidence in the Sacramento-San Joaquin Delta and a strategy for controlling its rate. California Department of Water Resources, 63 p. California Department of Conservation, Division of Oil Gas and Geothermal Resources. 2010. 2009 Annual report of the state oil and gas supervisor, Report PR06, 274 p. California Department of Water Resources. 1960. Regional subsidence exploration, debris flow study, in Engineering geology of debris flows along the southwest side of the San Joaquin Valley, California, 1957-59. California Department Water Resources, 130 p.
Topic: Groundwater Land Subsidence from Groundwater Use in California
CA Water Plan Update 2013 Vol 4 Reference Guide Page 135

APRIL 2014 REPORT OF FINDINGS Land Subsidence from Groundwater Use in California
LSCE, BORCHERS AND CARPENTER 116
California Department of Water Resources. 1964. Design and construction studies of shallow land subsidence for the California Aqueduct in the San Joaquin Valley—Interim report. California Department of Water Resources, 130 p. California Department of Water Resources.1964. Investigation of failure-- Baldwin Hills Reservoir, 64 p. California Department of Water Resources. 1971. Meeting water demands in the Raymond Basin area. California Department of Water Resources Bulletin 104-6, 54 p. California Department of Water Resources. 1993. Sacramento-San Joaquin Delta atlas: Sacramento, California Department of Water Resources, 121 p. California Department of Water Resources. 1995. Delta levees. California Department of Water Resources, 19 p. California Department of Water Resources. 2003. California’s groundwater: Bulletin 118 – update 2003. California Department of Water Resources. 2014. Evaluation of the effect of subsidence on the flow capacity in the Chowchilla and Eastside Bypasses, 21 p. California Department of Water Resources. 2014. California water plan update 2013 (Public Review Draft). California High-Speed Rail Authority. 2013. Monthly Program Report, Program Management Team, California High-Speed Rail Project, May 2013, 25 p., appendix. California State Water Resources Board. 1955. Santa Clara Valley investigation. Bulletin 7, 154 p. Carpenter, M.C. 1993. Earth-fissure movements associated with fluctuations in ground-water levels near the Picacho Mountains, south-central Arizona, 1980-84: U.S. Geological Survey Professional Paper 497-H, 49 p., reference: http://pubs.er.usgs.gov/publication/pp497H, full text report: http://pubs.usgs.gov/pp/0497h/report.pdf. Carpenter, M. C. 1995. Deformation across and near earth fissures; measurement techniques and results. In Keith R. Prince, Devin L. Galloway, and Stanley A. Leake, eds., US. Geological Survey Subsidence Interest Group Conference, Edwards Air Force Base, Antelope Valley, California, November 18-19, 1992. U. S. Geological Survey Open-File Report 94-532; p. 55-58 Carpenter, M.C. and M.D. Bradley. 1986. Legal perspectives on subsidence caused by ground-water withdrawal in Texas, California, and Arizona, U.S.A. In A.I. Johnson, Carborgnin, L. and Ubertini, L., eds., Proceedings of the Third International Symposium on Land Subsidence, Venice, Italy, March 19-25, 1984. International Association of Hydrological Sciences Publication 151, p. 817–828.
Topic: Groundwater Land Subsidence from Groundwater Use in California
CA Water Plan Update 2013 Vol 4 Reference Guide Page 136

APRIL 2014 REPORT OF FINDINGS Land Subsidence from Groundwater Use in California
LSCE, BORCHERS AND CARPENTER 117
Carbognin, L., G. Gambolati, and A.I. Johnson, eds. 2000. Land Subsidence: Proceedings of the Sixth International Symposium on Land Subsidence, Ravenna, Italy, September 24-29, 2000, Padua, Italy: La Garangola, National Research Council of Italy (CNR). 384 p., v. 2, 433 p. Carreon-Freyre, D., M. Cerca, D.L. Galloway and J.J. Silva-Corona, eds. 2010. Land subsidence-- associated hazards and the role of natural resources development, Proceedings of the Eighth International Symposium on Land Subsidence, Querétaro, Mexico, October 17–22, 2010. International Association of Hydrological Sciences Publication 339, 522 p. Carrillo, N. 1949. Subsidence in the Long Beach-San Pedro area. Stanford Research Institute. Stanford, California. p. 67-79, 227-242. Carter, P. G., and A. I. Johnson. 1993. Land subsidence—The last five years: Report by Technical Committee TC 12. In Proceedings of the International Conference on Soil Mechanics and Foundation Engineering 5, Issue 12, Rio De Janeiro, 13-18 Aug. 1989. Netherlands, Balkema. Castle, R.O., and R. F. Yerkes. 1976. Recent surface movements in the Baldwin Hills, Los Angeles County, California, U. S. Geological Survey Professional Paper 882, 125 p. Castle, R.O., J.P. Church, R.F. Yerkes and J.C. Manning. 1983. Historical surface deformation near Oildale, California. U.S. Geological Survey Professional Paper 1245, 42 p. http://pubs.er.usgs.gov/publication/pp1245. Castle, R. O. and R. F. Yerkes. 1977. Recent surface movements in the Baldwin Hills, Los Angeles County, California. Geological guidebook to the Ridge Basin, northwestern Los Angeles County. California Publisher: South Coast Geologic Society Irvine, Calif., United States. Castle, R. O., R. F. Yerkes, and F. S. Riley. 1969. A linear relationship between liquid production and oil-field subsidence. In Land subsidence-- Proceedings of the Tokyo Symposium, Tokyo, Japan, September 1969, vol. 1, International Association of Scientific Hydrology Publication 88, p. 162–173. http://iahs.info/redbooks/a088/088020.pdf. Chi, S.C. and R.E. Reilinger. 1984. Geodetic evidence for subsidence due to groundwater withdrawal in many parts of the United States of America. Journal of Hydrology 67, 155–182. Chilingarian, G.V., E.C. Donaldson, and T.F. Yen, eds. 1995. Subsidence Due to Fluid Withdrawal. Developments in Petroleum Science 41, Amsterdam: Elsevier Science, 498 p. Chilingarian, G. V. and L. Knight. 1960. Relationship between pressure and moisture content of kaolinite, illite, and montmorillonite clays. Bulletin of the Am. Assoc. Petroleum Geologists 44, no. 1: 101–106.
Topic: Groundwater Land Subsidence from Groundwater Use in California
CA Water Plan Update 2013 Vol 4 Reference Guide Page 137

APRIL 2014 REPORT OF FINDINGS Land Subsidence from Groundwater Use in California
LSCE, BORCHERS AND CARPENTER 118
Clark, M.M., J.M. Buchanan-Banks, and T.L. Holzer. 1978. Creep along parts of the Garlock fault: Possible relation to decline in ground-water levels [abs.]. Geological Society of America Abstracts with Programs 10, no. 3: 100. Cleveland, G. B. 1980. Drought and ground deformation Cambria, San Luis Obispo County, California, California Geology, vol. 33, no. 2, p. 29-35. Colazas, X.C. and R.W. Strehle. 1995. Subsidence in the Wilmington Oil Field, Long Beach, California, USA. In G.V. Chiligarian, E.C. Donaldson , and T.C. Yen, eds. Subsidence and Fluid Withdrawal, Developments in Petroleum Science 41. Amsterdam: Elsevier Science, 285-336. Colazas, X.C., and R.W. Strehle. 1995. Introduction to compaction/subsidence (Chapter VI), in Subsidence Due to Fluid Withdrawal, Developments in Petroleum Science, v. 41, E.C., Donaldson, E.D., G.V. Chilingarian, T.F. Yen, (eds.), 1995, Subsidence in the Wilmington Oil Field, Long Beach California, USA, p. 285-336. Conway, B. 2013. Land subsidence monitoring report number 1, Arizona Department of Water Resources, 29 p.
Corapcioglu, M. Y. and W. Brutsaert. 1977. Viscoelastic aquifer model applied to subsidence due to pumping. Water Resources Research 13, no. 3, Pages: 597-604. Publisher American Geophysical Union: Washington, DC, United States. http://onlinelibrary.wiley.com/doi/10.1029/WR013i003p00597/abstract Corbett, F., T. Harter, and M. Sneed. 2011. Subsidence due to excessive groundwater withdrawal in the San Joaquin Valley, California. Abstract #H23H-1397 presented at 2011 Fall Meeting, AGU San Francisco, CA, 5-9 Dec. Corbett, F., T. Schetrit, T. Harter. 2011. Crop water use, groundwater flow, and subsidence at Naval Air Station Lemoore, Fresno and Kings County, California, UC Davis Extension Cooperative Ecosystem Studies Unit, 353 p. Corwin, E.J., S.C. Alahadeff, S.P. Oggel, and R.J. Shlemon. 1991. Earth fissures, urbanizaton, and litigation: A case study from the Temecula area, Southwestern Riverside County, California. In A.I. Johnson, ed., Land Subsidence: Proceedings of the Second International Symposium on Land Subsidence, Houston Texas, May 12-17, 1991. International Association of Hydrological Sciences Publication 200, 291-299. Coxe, L.C. 1949. Long Beach Naval Shipyard endangered by subsidence: Civil Engineer, vol. 19, no. 11: 44-47, 90. Crippen, R. 2012. Lost Hills subsidence animation, National Aeronautics and Space Administration, Jet Propulsion Laboratory, animation PIA13204, http://photojournal.jpl.nasa.gov/catalog/PIA13204, accessed 5/21/2013.
Topic: Groundwater Land Subsidence from Groundwater Use in California
CA Water Plan Update 2013 Vol 4 Reference Guide Page 138

APRIL 2014 REPORT OF FINDINGS Land Subsidence from Groundwater Use in California
LSCE, BORCHERS AND CARPENTER 119
Crow, N.B. 1979. An environmental overview of geothermal development: The Geysers-Calistoga KGRA. Volume 4, Environmental geology: Lawrence Livermore National Laboratory Publication No. UCRL-52496, vol. 4, 72 p. Crow, N.B., and P.W. Kasameyer. 1978. Monitoring natural subsidence and seismicity in the Imperial Valley as a basis for evaluating potential impacts of geothermal production, Transactions of the Geothermal Resources Council, v. 2, July 1978, p. 125-128. Danskin, W.R., K.R. McPherson and L.R. Woolfenden. 2006. Hydrology, description of computer models, and evaluation of selected water-management alternatives in the San Bernardino area, California. U.S. Geological Survey Open-File Report 2005-1278, 178 p. and 2 pl. http://pubs.er.usgs.gov/usgspubs/ofr/ofr20051278. Davis, G.H. 1963. Formation of ridges through differential subsidence of peatlands of the Sacramento-San Joaquin Delta, California, Article 101. U.S. Geological Survey Professional Paper 475-C, p. C162-C165. http://pubs.er.usgs.gov/publication/pp475C. Davis, G.A. and B.C. Burchfield. 1973. Garlock fault: An intracontinental transform feature, Southern California. Bulletin of the Geological Society of America 84, no. 4: 1407-1422. Densmore, J.N., K. Ellett, J. Howle, M. Carpenter, and M. Sneed. 2010. Monitoring land-surface deformation on Bicycle Lake playa, Fort Irwin, California, USA. In D. Carreon-Freyre, M. Cerca, D.L. Galloway, J.J. Silva-Corona, eds., Land Subsidence-- Associated Hazards and the Role of Natural Resources Development, Proceedings of the Eighth International Symposium on Land Subsidence, Querétaro, Mexico, October 17–22, 2010, International Association of Hydrological Sciences Publication 339, 39-43. Densmore, J.N., D. L. Galloway, and D.W. Valentine. 2003. Use of InSAR to identify land-surface displacement and aquifer-system compaction, Paso Robles area, California. In K.R. Prince, and D.L. Galloway, eds., U.S. Geological Survey subsidence interest group conference, proceedings of the technical meeting, Galveston, Texas, November 27-29, 2001, U.S. Geological Survey Open-File Report 03-308, 99-102. http://pubs.usgs.gov/of/2003/ofr03-308/. de Rouffignac, E., and P. L. Bondor. 1995. Land subsidence and well failure in the Belridge diamomite oil field, Kern County, California. Part I. Experiments, model and verification, in F.B.J. Barends, J.J.B. Frits, and F.H. Schroder, eds., Land Subsidence-- Proceedings of the Fifth International Symposium on Land Subsidence, The Hague, Netherlands, October 16-20, 1995, International Association of Hydrological Sciences Publication 234, 61-68. Deverel, S.J. and Rojstaczer, S.A. 1996. Subsidence of agricultural lands in the Sacramento-San Joaquin Delta, California: Role of aqueous and gaseous carbon fluxes. Water Resources Research 32, 2,359–2,367. Deverel, S.J., B. Wang, and S. A. Rojstaczer. 1998. Subsidence of organic soils, Sacramento-Sacramento Delta, California. In J.W. Borchers, ed., Land Subsidence― Case Studies and
Topic: Groundwater Land Subsidence from Groundwater Use in California
CA Water Plan Update 2013 Vol 4 Reference Guide Page 139

APRIL 2014 REPORT OF FINDINGS Land Subsidence from Groundwater Use in California
LSCE, BORCHERS AND CARPENTER 120
Current Research, Proceedings of the Dr. Joseph F. Poland Symposium on Land Subsidence, Association of Engineering Geologists Special Publication 8, 489-502. Dillon, R. 1982. Delta Country. Novato, California: Presidio Press, 134 p. Domenico, P.A. and M.D. Mifflin. 1965. Water from low-permeability sediments and land subsidence. Water Resources Research 1, no. 4: 563-576. Donaldson, E.D., G.V. Chilingarian, T.F. Yen. 1995. Introduction to compaction/subsidence (Chapter I), in Subsidence Due to Fluid Withdrawal, Developments in Petroleum Science, v. 41, E.C., Chilingarian, and T.F. Yen, (eds.), p. 1-46. E and B Natural Resources. 2012. Subsidence and induced seismicity report, Appendix H, in Planning application for E and B Natural Resources oil development project City of Hermosa Beach, variously paginated. http://www.hermosabch.org/modules/showdocument.aspx?documentid=2149
Earth Consultants International. 2000. Natural hazard mapping, analysis and mitigation: a technical background report in support of the safety element new Riverside County 2000 General Plan, Chapter 2.6 Ground Subsidence, p.217-226. EDAW-ESA. 1978. Environmental and economic effects of subsidence. Lawrence Berkeley Laboratory Geothermal Subsidence Research Program Final Report—Category IV, Project 1. Eggleston, J. and Pope, J. 2013. Land subsidence and relative sea-level rise in the southern Chesapeake Bay region: U.S. Geological Survey Circular 1392, 30 p. Ellett, K. M., J. Densmore, M. Sneed, J. Howle, M. Carpenter, and D. Galloway. 2011 (In Prep), Driving mechanisms of ground-failure hazards at Fort Irwin, California: The role of shallow and deep hydrological processes, to be submitted to Engineering Geology. Endres, B. and G.W. Chilingarian. 2005. Environmental Hazards and Some Modeling Concepts of Subsidence. In Z. Agen, , G. Shiliang, , L. Carbognin, and A.I. Johnson, eds., Land subsidence-- Proceedings of the Seventh International Symposium on Land Subsidence, Shanghai, China, October 23-28, 2005, Shanghai Scientific & Technical Publishers, vol. 2., p. 819-824. Erickson, R.C. 1977. Subsidence control and urban oil production—a case history, Beverly Hills (east) Oilfield, California. In A.I. Johnson, ed., Proceedings of the Second International Symposium on Land Subsidence, Anaheim, California, December 13–17, 1976, International Association of Hydrological Sciences Publication 121, 285-297. Everett, R.R., D.R. Gibbs, R.T. Hanson, D.S. Sweetkind, J.T. Brandt, S.E. Falk, and C.R. Harich. 2013. Geology, water-quality, hydrology, and geomechanics of the Cuyama Valley groundwater basin, California, 2008-12: U.S. Geological Survey Scientific Investigations Report 2013-5108, 62 p.
Topic: Groundwater Land Subsidence from Groundwater Use in California
CA Water Plan Update 2013 Vol 4 Reference Guide Page 140

APRIL 2014 REPORT OF FINDINGS Land Subsidence from Groundwater Use in California
LSCE, BORCHERS AND CARPENTER 121
Fairchild, F.B. and Wiebe, K.H. 1976. Subsidence of organic soils and salinity barrier design in coastal Orange County, California. In A.I. Johnson, ed., Proceedings of the Second International Symposium on Land Subsidence, Anaheim, California, December 13–17,1976, International Association of Hydrological Sciences Publication 121, 334-346. Famiglietti, J. S., M. Lo, S. L. Ho, J. Bethune, K. J. Anderson, T. H. Syed, S. C. Swenson, C. R. de Linage, and M. Rodell. 2011. Satellites measure recent rates of groundwater depletion in California's Central Valley, Geophysical Research Letters., 38, L03403, doi:10.1029/2010GL046442 http://dx.doi.org/10.1029/2010GL046442 Farrar, C.D., M.L. Sorey, G.A. Marshall, J.F. Howle and M.E. Ikehara. 1995. Deformation in the Casa Diablo geothermal well field, Long Valley Caldera, eastern California. In K.R. Prince, D.L. Galloway, and S.A. Leake, eds., U.S. Geological Survey Subsidence Interest Group Conference, Edwards Air Force Base, Antelope Valley, California, November 18-19, 1992, Abstracts and summary, U.S. Geological Survey Open-File Report 94-532, 25-28. http://pubs.usgs.gov/of/1994/ofr94-532/. Faunt, C.C., ed. 2009. Ground-water availability of California’s Central Valley Aquifer, California. U.S. Geological Survey Professional Paper 1766, 225 p. http://pubs.usgs.gov/pp/1766/. Faunt, C.C., R.T. Hanson, and K. Belitz. 2009. Introduction and conceptual model of the Central Valley, California. U.S. Geological Survey Professional Paper 1766, Chapter A, p.1-56. Faunt, C.C., R.T. Hanson, and K. Belitz. 2009. Ground-water availability in California’s Central Valley. U.S. Geological Survey Professional Paper 1766, Chapter B, p. 58-120. Faunt, C.C., R.T. Hanson, W. Schmid, K. Belitz, and S. Predmore. 2009. Documentation of the Ground-water Flow Model. U.S. Geological Survey Professional Paper 1766, Chapter C, p. 121-212. Ferretti, A., R. Novali, R. Bürgmann, G. Hilley, and C. Prati. 2004. InSAR permanent scatterer analysis reveals ups and downs in the San Francisco Bay Area. EOS 85, no. 34: 317–324. Ferretti, A., C. Prati, and F. Rocca. 2000. Nonlinear subsidence rate estimation using permanent scatterers in differential SAR interferometry. IEEE Trans Geosci Remote Sens 38(5):2202-2212. Ferretti, A., C. Prati, and F. Rocca. 2001. Permanent scatterers in SAR interferometry. IEEE Trans Geosci Remote Sens 39(1):8-20. Fett, J.D., D.H. Hamilton, and F.A. Fleming. 1967. Continuing surface displacement along the Casa Loma and San Jacinto faults in San Jacinto Valley, Riverside County, California. Association of Engineering Geologists, Engineering Geology 4, no. 1: 22-32.
Topic: Groundwater Land Subsidence from Groundwater Use in California
CA Water Plan Update 2013 Vol 4 Reference Guide Page 141

APRIL 2014 REPORT OF FINDINGS Land Subsidence from Groundwater Use in California
LSCE, BORCHERS AND CARPENTER 122
Fialko, Y. and M. Simons. 2000. Deformation and seismicity in the Coso geothermal area, Inyo County, California: Observations and modeling using satellite radar interferometry. Journal of Geophysical Research 25: 21,781–21,794. Fielding, E.J., R.G. Blom, and R.M. Goldstein. 1998. Rapid subsidence over oil fields measured by SAR interferometry. Geophysical Research Letters 25: 3,215–3,218. Fife, D.L., D.A. Rodgers, G.W. Chase, R.H. Chapman, and E.C. Sprotte. 1976. Geologic hazards in Southwestern San Bernardino County, California. California Division of Mines and Geology Special Report 113, 40 p. Finnemore, E.J. and M. L. Gillam. 1977. Compaction process and mathematical models of land subsidence geothermal areas. In A.I. Johnson, ed., Proceedings of the Second International Symposium on Land Subsidence, Anaheim, California, December 13–17, 1976, International Association of Hydrological Sciences Publication 121, 157-166. Fletcher, J..E., K. Harris, H.B. Peterson, and V.N. Chandler. 1954. Piping: American Geophysical Union, Transactions, v. 35, no. 2, p. 258-262. Fowler, L.C. 1981. Economic consequences of land subsidence. American Society of Civil Engineers Journal of the Irrigation and Drainage Division 107, no. IR2: 151-159. Fram, M. S., B. A. Bergamaschi, K. D. Goodwin, R. Fujii, and J. F. Clark. 2003. Processes affecting the trihalomethane concentrations associated with the third injection, storage, and recovery test at Lancaster, Antelope Valley, California, March 1998 through April 1999. U.S. Geological Survey Water-Resources Investigations Report 03-4062, 72 p. http://pubs.usgs.gov/wri/wri034062/. Frame, R.J. 1952. Earthquake damage, its cause and prevention in the Wilmington Oil Field, Summary of operations California oil fields, Thirty-eighth annual report of the state oil and gas supervisor, Department of Natural Resources, Division of Oil and Gas, p. 5-15. Frame, J., D. and D'Onofrio. 2008. Project Report: 2008 California Department of Water Resources and U.S. Bureau of Reclamation Sacramento Valley Subsidence Project, 7 p., appendices. Freeman, L. A. 1996. Time-series ground-water level and aquifer-system compaction data, Edwards Air Force Base, Antelope Valley, California, January 1991 through September 1993. U.S. Geological Survey Open-File Report 96-186, 32 p. http://pubs.er.usgs.gov/usgspubs/ofr/ofr96186. Freeze, R.A. and J.A. Cherry. 1979. Groundwater. 1st ed., New Jersey, Prentice-Hall, Inc. Galloway, D.L., W.M. Alley, P.M. Barlow, T.E. Reilly, and P. Tucci. 2003. Ground-water depletion and aquifer storage and recovery, Antelope Valley (Mojave Desert), California. In
Topic: Groundwater Land Subsidence from Groundwater Use in California
CA Water Plan Update 2013 Vol 4 Reference Guide Page 142

APRIL 2014 REPORT OF FINDINGS Land Subsidence from Groundwater Use in California
LSCE, BORCHERS AND CARPENTER 123
Evolving issues and practices in managing ground-water resources — Case studies on the role of science. U.S. Geological Survey Circular 1247, 45–58. http://pubs.usgs.gov/circ/2003/circ1247/. Galloway, D. L., G. W. Bawden, S. A. Leake, and D. G. Honegger. 2008. Land subsidence hazards. In Baum, R. L. et al., Landslide and land subsidence hazards to pipelines. U.S. Geological Survey Open-File Report 2008-1164, chap. 2, 33–106, http://pubs.usgs.gov/of/2008/1164/. Galloway, D.L. and T.J. Burbey. 2011. Review: Regional land subsidence accompanying groundwater extraction. Hydrogeology Journal 19, no. 8: 1459-1486. Galloway, D.L., R. Bürgmann, E. Fielding, F. Amelung, and R. L. Laczniak. 2000. Mapping recoverable aquifer-system deformation and land subsidence in Santa Clara Valley, California, USA, using space-borne synthetic aperture radar. In L. Carbognin, G. Gambolati, and A.I. Johnson, eds., Land Subsidence— Proceedings of the Sixth International Symposium on Land Subsidence, Ravenna, Italy, September 24-29, 2000, Padua, Italy, La Garangola, National Research Council of Italy (CNR), v. 2, 229-236. Galloway, D. L. and J. Hoffmann. 2007. The application of satellite differential SAR interferometry-derived ground displacements in hydrogeology. Hydrogeology Journal 15, no. 1: 133–154. Galloway, D.L., K.W. Hudnut, S.E. Ingebritsen, S.P. Phillips, G. Peltzer, F. Rogez, and P.A. Rosen. 1998. Detection of aquifer-system compaction and land subsidence using interferometric synthetic aperture radar, Antelope Valley, Mojave Desert, California. Water Resources Research 34: 2,573-2,585. Galloway, D.L., S.E. Ingebritsen, F.S. Riley, M.E. Ikehara, and M.C. Carpenter. 1999. The role of science: in land subsidence in the United States. U.S. Geological Survey Circular 1182, p. 141-158. http://pubs.er.usgs.gov/publication/cir1182. Galloway, D., D.R. Jones, and S.E Ingebritsen. 1999. Land subsidence in the United States. U.S. Geological Survey Circular 1182, 177 p. http://pubs.er.usgs.gov/publication/cir1182. Galloway, D.L., D.R. Jones, and S.E. Ingebritsen. 2000. Measuring land subsidence from space. U.S. Geological Survey Fact Sheet 051-00. http://pubs.er.usgs.gov/publication/fs05100. Galloway, D.L., D.R. Jones, and S.E. Ingebritsen. 2000. Land subsidence in the United States. U.S. Geological Survey Fact Sheet 165-00. http://pubs.er.usgs.gov/publication/fs16500. Galloway, D.L., S.P. Phillips, and M.E. Ikehara. 1998. Land subsidence and its relation to past and future water supplies in Antelope Valley, California. In J.W. Borchers, ed., Land Subsidence― Case Studies and Current Research, Proceedings of the Dr. Joseph F. Poland Symposium on Land Subsidence: Association of Engineering Geologists Special Publication 8, p. 529-539, http://ca.water.usgs.gov/groundwater/poland/.
Topic: Groundwater Land Subsidence from Groundwater Use in California
CA Water Plan Update 2013 Vol 4 Reference Guide Page 143

APRIL 2014 REPORT OF FINDINGS Land Subsidence from Groundwater Use in California
LSCE, BORCHERS AND CARPENTER 124
Galloway, D.L. and F.S. Riley. 1999. San Joaquin Valley, California—Largest human alteration of the Earth’s surface. In D.L. Galloway, D.R. Jones, and S.E. Ingebritsen, eds., Land Subsidence in the United States: U.S. Geological Survey Circular 1182, 23–34, http://pubs.usgs.gov/circ/circ1182/. Galloway, D.L. and M. Sneed. 2013. Analysis and simulation of regional subsidence accompanying groundwater abstraction and compaction of susceptible aquifer systems in the USA, Boletín de la Sociedad Geológica Mexicana Volume 65, No. 1, 2013, p. 123-136. Geomatrix Consultants, Inc. 1994. Final report ground fissuring study. California Department of Corrections, California Institution for Men, Chino, California. Project No. 2360. San Francisco, California: GCI. Gibbs, H.J. 1959. Research Report: United States Department of the Interior Bureau of Reclamation. A laboratory testing study of land subsidence [California] U. S. Bureau of Reclamation Washington, DC, United States. 10 p. Gilluly, J. and U.S. Grant. 1949. Subsidence in the Long Beach Harbor Area, California. Geological Society of America Bulletin 60: 461–530. Grant, U. S. 1954. Subsidence of the Wilmington Oil Field, California. California Division of Mines, Bulletin 170, Chapter 10: 19–24. Grant, U.S. 1944. Subsidence and elevation in the Los Angeles [California] region. Science in the University, By Members of the Faculties of the University Of California, 129-158. Green, J.H. 1962. Compaction of the aquifer system and land subsidence in the Santa Clara Valley, California. U.S. Geological Survey Professional Paper 450-D, 175-178. http://pubs.er.usgs.gov/publication/pp450D. Green, J.H. 1964. The effect of artesian-pressure decline on confined aquifer systems and its relation to land subsidence. U.S. Geological Survey Water-Supply Paper 1779-T, 11 p. http://pubs.er.usgs.gov/publication/wsp2348. Grimsrud, G.P., B.L. Turner, and P.A. Frame. 1978. Areas of ground subsidence due to geofluid withdrawal, Berkeley, California. Lawrence Berkeley Laboratory Publication No. 8618. Guacci, G. 1979. The Pixley fissure, San Joaquin Valley, California. In Saxena, S.K., ed., Proceedings from the Engineering Foundation Conference on Evaluation and Prediction of Subsidence, Pensacola Beach, Florida, January 1978. American Society of Civil Engineers, 303-319. Hall, C.E. and J.W. Carlson. 1965. Stabilization of soils subject to hydrocompaction, Engineering Geology. Bulletin of the Association of Engineering Geologists 2, no. 2: 47-58.
Topic: Groundwater Land Subsidence from Groundwater Use in California
CA Water Plan Update 2013 Vol 4 Reference Guide Page 144

APRIL 2014 REPORT OF FINDINGS Land Subsidence from Groundwater Use in California
LSCE, BORCHERS AND CARPENTER 125
Hamilton, H.H., and L. Meehan. 1971. Ground rupture in the Baldwin Hills, Science, 23 April, 1971, v. 172, p.333-344. Hanson, B.R. and A.B. Carlton. 1985. Water and salt movement during subirrigation of organic soils of the Sacramento-San Joaquin Delta, Transactions of the American Society of Agricultural Engineering 28, 815-818. Hanson, R.T. 1995. Land subsidence in the Oxnard Plain of the Santa Clara–Calleguas Basin, Ventura County, California. In K.R. Prince, D.L. Galloway, and S.A. Leake, eds., U.S. Geological Survey Subsidence Interest Group Conference, Edwards Air Force Base, Antelope Valley, California, November 18-19, 1992, Abstracts and summary, U.S. Geological Survey Open-File Report 94-532, p. 32-34. http://pubs.usgs.gov/of/1994/ofr94-532/. Hanson, R.T., A.L. Flint, L.E. Flint, C.C. Faunt, W. Schmid, M.D. Dettinger, S.A. Leake, and D.R. Cayan. 2010. Integrated simulation of consumptive use and land subsidence in the Central Valley, California, for the past and for a future subject to urbanization and climate change. In D. Carreon-Freyre, M. Cerca, D.L. Galloway, J.J. Silva-Corona, eds., Land Subsidence-- Associated Hazards and the Role of Natural Resources Development, Proceedings of the Eighth International Symposium on Land Subsidence, Querétaro, Mexico, October 17–22, 2010, International Association of Hydrological Sciences Publication 339, 467-471. Hanson, R. T., Z. Li, C.C. Faunt. 2004. Documentation of the Santa Clara Valley regional ground-water/surface-water flow model, Santa Clara Valley, California. U.S. Geological Survey Scientific Investigations Report 2004-5231, 85 p., http://pubs.usgs.gov/sir/2004/5231/. Hanson, R.T., Z. Li, and C.C. Faunt. 2005. Simulation of Subsidence for the Regional-Aquifer System in the Santa Clara Valley, California. In Z. Agen, G. Shiliang, L. Carbognin, A.I. Johnson, eds., Land subsidence-- Proceedings of the Seventh International Symposium on Land Subsidence, Shanghai, China, October 23-28, 2005, Shanghai Scientific & Technical Publishers 2: 616-627. Hanson, R. T., P. Martin, and K. M. Koczot. 2003. Simulation of ground-water/surface-water flow in the Santa Clara—Calleguas ground-water basin, Ventura County, California. U.S. Geological Survey Water–Resources Investigations Report 02-4136, 214 p. http://pubs.er.usgs.gov/usgspubs/wri/wri024136. Harris, F.M. and E.H. Harlow. 1947. Subsidence of the Terminal Island-Long Beach Area, California. American Society of Civil Engineers Proceedings 73, no. 8: 1197-1218. Helm, D. C. 1972. Simulation of aquitard compaction due to changes in stress [abs.]. EOS Trans American Geophysical Union 53, no. 11: 979. http://onlinelibrary.wiley.com/doi/10.1029/EO053i011p00964/abstract. Helm, D.C. 1975. One-dimensional simulation of aquifer system compaction near Pixley, California 1, Constant parameters. Water Resources Research 11, no. 3: 465–478.
Topic: Groundwater Land Subsidence from Groundwater Use in California
CA Water Plan Update 2013 Vol 4 Reference Guide Page 145

APRIL 2014 REPORT OF FINDINGS Land Subsidence from Groundwater Use in California
LSCE, BORCHERS AND CARPENTER 126
Helm, D.C. 1976. One-dimensional simulation of aquifer system compaction near Pixley, California 2, Stress-dependent parameters. Water Resources Research 12, no. 3: 375–391. Helm, D.C. 1977. Estimating parameters of compacting fine-grained interbeds within a confined aquifer system by a one-dimensional simulation of field observations. In A.I. Johnson, ed., Proceedings of the Second International Symposium on Land Subsidence, Anaheim, California, December 13–17, 1976, International Association of Hydrological Sciences Publication 121, 145-156. Helm, D.C. 1978. Field verification of a one-dimensional mathematical model for transient compaction and expansion of a confined aquifer system, Verification of Mathematical and Physical Models in Hydraulic Engineering. in Proceedings 26th Hydraulic Division Specialty Conference, American Society of Civil Engineers: 189–196. Helm, D.C. 1979. A postulated relation between granular movement and Darcy’s law for transient flow, (in) S.K. Saxena (ed.), Evaluation and Prediction of Subsidence, 417-440. New York: American Society of Civil Engineers. Helm, D.C. 1984. Analysis of sedimentary skeletal deformation in a confined aquifer and the resulting drawdown, (in) J.S. Rosenshein and G.D. Bennett (eds.), Groundwater Hydraulics: Water Resources Monograph, American Geophysical Union: 29-82. Helm, D.C. 1984. Field-based computational techniques for predicting subsidence due to fluid withdrawal. In Man-Induced Land Subsidence ed. T.L. Holzer, 1–22. Geological Society of America Reviews in Engineering Geology 6: 1–22. Helm, D.C. 1984. Latrobe Valley Subsidence Predictions – The Modelling of Time-Dependent Ground Movement (2 vols.), State Electricity Commission of Victoria. Joint publications of the Fuel Department (GD9) and the Design Engineering and Environment Department DD195), Melbourne, Australia. Helm, D.C. 1994a. Hydraulic forces that play a role in generating fissures at depth, Bulletin of the Association of Engineering Geologists 31, no. 3: 293-304. Helm, D.C. 1994b. Horizontal aquifer movement in a Theis-Thiem confined system. Water Resources Research 30, no. 4: 953-964. Helm, D.C. 1998. Poroviscosity. In Land Subsidence Case Studies and Current Research ed. J.W. Borchers: 395-405. Belmont, California: Star Publishing and the Association of Engineering Geologists. Helm, D.C. 2013. Understanding Darcian flow leads to understanding aquifer mechanics. In Global View of Engineering Geology and the Environment eds. F. Wu and S. Qi: 27-33. Taylor and Francis Group, London.
Topic: Groundwater Land Subsidence from Groundwater Use in California
CA Water Plan Update 2013 Vol 4 Reference Guide Page 146

APRIL 2014 REPORT OF FINDINGS Land Subsidence from Groundwater Use in California
LSCE, BORCHERS AND CARPENTER 127
Hernandez-Marin, M. and T.J. Burbey. 2010. Controls on initiation and propagation of pumping-induced earth fissures: insights from numerical simulations. Hydrogeology Journal 18, no. 8: 1773-1785. Hilbert, L.B., R.L. Gwinn, T.A. Moroney, and G.L. Deitrick. 1999. Field-scale and wellbore modeling of Compaction induced casing failures. Society of Petroleum Engineers Journal of Drilling and Completion14, no. 2: 92-101. Hodgson, M.E, and Bresnahan, P. 2004. Accuracy or airborne LIDAR-derived elevation: empirical assessment and error budget, Photogrammetric Engineering and Remote Sensing, vol. 70, no. 3, p. 331-339. Hoffmann, J. 2003. The application of satellite radar interferometry to the study of land subsidence over developed aquifer systems. Ph.D. diss., Stanford University. Hoffmann, J., D.L. Galloway, and H.A. Zebker. 2003. Inverse modeling of interbed storage parameters using land subsidence observations, Antelope Valley, California. Water Resources Research 39, no. 2: 1-13. Hoffmann, J., D.L. Galloway, and H.A. Zebker. 2003. Inverse modeling of regional aquifer-system compaction based on land subsidence measurements, Antelope Valley (Mojave Desert), California. In K.R. Prince and D.L. Galloway, ed., 2003, U.S. Geological Survey subsidence interest group conference, proceedings of the technical meeting, Galveston, Texas, November 27-29, 2001, U.S. Geological Survey Open-File Report 03-308, 103-113. http://pubs.usgs.gov/of/2003/ofr03-308/. Hoffmann, J. and H. A. Zebker. 2003. Prospecting for horizontal surface displacements in Antelope Valley, California, using satellite radar interferometry. Journal of Geophysical Research 108, no. F1. Holzer, T.L. 1977. Ground failure in areas of subsidence due to ground-water decline in the United States. In A.I. Johnson, ed., Proceedings of the Second International Symposium on Land Subsidence, Anaheim, California, December 13–17, 1976, International Association of Hydrological Sciences Publication 121, 423-433. Holzer, T.L. 1980a. Faulting caused by ground-water level declines, San Joaquin Valley, California. Water Resources Research 16, no. 6: 1065-1070. Holzer, T.L. 1980b. Research at the U. S. Geological Survey on faults and earth fissures associated with land subsidence. The Engineering Geologist 15, no. 3: 1-3. Holzer, T.L. 1981. Preconsolidation stress of aquifer systems in areas of induced land subsidence. Water Resources Research 17, no. 3: 693-704.
Topic: Groundwater Land Subsidence from Groundwater Use in California
CA Water Plan Update 2013 Vol 4 Reference Guide Page 147

APRIL 2014 REPORT OF FINDINGS Land Subsidence from Groundwater Use in California
LSCE, BORCHERS AND CARPENTER 128
Holzer, T.L. 1984. Ground failure induced by ground-water withdrawal from unconsolidated sediment. In Holzer, T.L., ed., Man-Induced Land Subsidence, Geological Society of America Reviews in Engineering Geology 6, 67-105. Holzer, T.L. 1984. Man induced land subsidence. Geological Society of America Reviews in Engineering Geology 6: 221. Holzer, T.L. 1986. Ground failure in areas of subsidence due to ground-water decline in the United States. In A.I. Johnson, L. Carborgnin, and L. Ubertini, L., eds., Proceedings of the Third International Symposium on Land subsidence, Venice, Italy, March 19-25, 1984, International Association of Scientific Hydrology Publication 151, 747-756. Holzer, T.L. 1990. State and local response to damaging land subsidence in United States urban areas. Engineering Geology 27, no. 1-4: 449-466. Holzer, T.L. 1998. The history of the aquifer-drainage model. In J.W. Borchers, ed., Land Subsidence: Case Studies and Current Research, Proceedings of the Dr. Joseph F. Poland Symposium, Association of Engineering Geologists Special Publication 8, 7–12. Holzer, T.L. 2010. Implications of ground-deformation measurements across earth fissures in subsidence areas in the southwestern USA. In D. Carreon-Freyre, M. Cerca, D. Galloway, J.J. Silva-Corona, eds. Land Subsidence: Associated Hazards and the Role of Natural Resources Development, Proceedings of the Eighth International Symposium on Land Subsidence, Querétaro, Mexico, October 17–22, 2010, International Association of Hydrological Sciences Publication 339, 9-19. Holzer, T.L., and D.L. Galloway. 2005. Impacts of land subsidence caused by withdrawal of underground fluids in the United States. In J. Ehlen, W.C. Haneberg, and R.A. Larson, eds., Humans as Geologic Agents: Geological Society of America Reviews in Engineering Geology, v. XVI, p. 87–99, doi: 10.1130/2005.4016(08). Holzer, T.L. and A.M. Johnson. 1985. Land subsidence caused by ground-water withdrawal in urban areas. GeoJournal 11, no. 3: 245-255. Holzer, T.L. and E.H. Pampeyan. 1981. Earth fissures and localized differential subsidence. Water Resources Research 17, no. 1: 223-227. Howle, J.F. 1995. Deformation in the Casa Diablo Geothermal Well Field, Long Valley Caldera, Eastern California. In K.R. Prince and S.A. Leake, eds., U.S. Geological Survey Subsidence Interest Group Conference, Proceedings of the Technical Meeting, Las Vegas Nevada, February 14-16, 1995, U.S. Geological Survey Open-File Report 97-47, 31-35. Howle, J.F., J. O. Langbein, C.D. Farrar, and S.K. Wilkinson. 2003. Deformation near the Casa Diablo geothermal well field and related processes Long Valley Caldera, Eastern California, 1993-2000. Journal of Volcanology and Geothermal Research 127, no. 3-4: 365–390.
Topic: Groundwater Land Subsidence from Groundwater Use in California
CA Water Plan Update 2013 Vol 4 Reference Guide Page 148

APRIL 2014 REPORT OF FINDINGS Land Subsidence from Groundwater Use in California
LSCE, BORCHERS AND CARPENTER 129
HRB Singer, Inc. 1977. Nature and distribution of subsidence problems affecting HUD and urban areas. U.S. Department of Housing and Urban Development, 113 p. (Available from NTIS, PB 80172778). Hseih, P. A. 1995. Poroelasticiy simulation of ground-water flow and subsurface deformation, in K R Prince and S A Leake (eds), U.S. Geological Survey Subsidence Interest Group conference, Proceedings of the technical meeting, Las Vegas, Nevada, February 14-16, 1995, U.S. Geological Survey Open-File Report 97-47, p. 5-9. Hseih, P. A. 1996. Deformation-induced changes in hydraulic head during ground-water withdrawal, Ground Water, 36(6), p. 1082-1089. Hudnut, K. W. and J. Beavan. 1989. Vertical deformation (1952-1987) in the Salton Trough, California, from water level recordings. Journal of Geophysical Research 94, no. B7: 9463-9476. http://www.agu.org/journals/jgr/. Hutson, S.S., Barber, N.L., Kenny, J.F., Linsey, K.S., Lumia, D.S., and Maupin, M.A. 2004. Estimated use of water in the United States in 2000: Reston, Va.. U.S. Geological Survey Circular 1268, 46 p. http://pubs.usgs.gov/circ/2004/circ1268/pdf/circular1268.pdf IASH. 1969. Land subsidence: Proceedings of the Tokyo Symposium, Tokyo, Japan, September 1969. International Association of Scientific Hydrology Publications 88-89, nos. 1-2,661 p., http://iahs.info/redbooks/088.htm. Ikehara, M.E. 1994. Global Positioning System surveying to monitor land subsidence in Sacramento Valley, California. Hydrological Sciences Journal 39, no. 5: 417-429. Ikehara, M.E. 1995. Data from the Woodland land-subsidence monitoring station, Yolo County, California, water years 1988-92. U.S. Geological Survey Open-File Report 94-494. Ikehara, M.E. 1995. Description of global positioning system networks surveyed in California, 1992. In K.R. Prince, D.L. Galloway, and S.A. Leake, S.A., eds., U.S. Geological Survey Subsidence Interest Group Conference, Edwards Air Force Base, Antelope Valley, California, November 18-19, 1992, Abstracts and summary, U.S. Geological Survey Open-File Report 94-532, p. 46-49. http://pubs.usgs.gov/of/1994/ofr94-532/. Ikehara, M.E. 1995. Static global positioning system survey design and sources of error in subsidence investigations. In K.R. Prince, D.L. Galloway, and S.A. Leake, eds., U.S. Geological Survey Subsidence Interest Group Conference, Edwards Air Force Base, Antelope Valley, California, November 18-19, 1992, Abstracts and summary, U.S. Geological Survey Open-File Report 94-532, p. 50-52. http://pubs.usgs.gov/of/1994/ofr94-532/. Ikehara, M.E. 1997. Results of global positioning system surveys in Antelope Valley, California. In K.R. Prince and S.A. Leake, eds., U.S. Geological Survey Subsidence Interest Group
Topic: Groundwater Land Subsidence from Groundwater Use in California
CA Water Plan Update 2013 Vol 4 Reference Guide Page 149

APRIL 2014 REPORT OF FINDINGS Land Subsidence from Groundwater Use in California
LSCE, BORCHERS AND CARPENTER 130
Conference, Proceedings of the technical meeting, Las Vegas, Nevada, February 14-16, 1995, U.S. Geological Survey Open-File Report 97-47, 27-30. Ikehara, M.E., D.L. Galloway, E. Fielding, R. Bürgmann, A.S. Lewis, and B. Ahmadi. 1998. InSAR imagery reveals seasonal and longer-term land-surface elevation changes influenced by ground-water levels and fault alignment in Santa Clara Valley, California [abs.]: EOS (supplement) Transactions, American Geophysical Union, no. 45, November 10, 1998, p. F37. Ikehara, M.E. and S.P. Phillips. 1994. Determination of land subsidence related to ground-water level declines using global positioning system and leveling surveys in Antelope Valley, Los Angeles and Kern Counties, California, 1992. U.S. Geological Survey Water-Resources Investigations Report 94-4184, 101 p. http://pubs.er.usgs.gov/publication/wri944184. Ikehara, M.E., S.K. Predmore, and D.J. Swope. 1997. Geodetic network to evaluate historical elevation changes and to monitor land subsidence in Lower Coachella Valley, California, 1996. U.S. Geological Survey Water-Resources Investigations Report 97-4237, scale 1:63,000, 1 sheet [folded in envelope],. http://pubs.er.usgs.gov/usgspubs/wri/wri974237, accessed August 18, 2008. Ingebritsen, S.E. and M.E. Ikehara. 1999. Sacramento-San Joaquin Delta: The sinking heart of the state. In D.L. Galloway, D.R. Jones, and S.E. Ingebritsen, S.E., eds., Land subsidence in the United States: U.S. Geological Survey Circular 1182, p.: 83-94. http://pubs.er.usgs.gov/publication/cir1182. Ingebritsen, S.E., M.E. Ikehara, D.L. Galloway, and D.R. Jones. 2000. Delta subsidence in California: The sinking heart of the state. U.S. Geological Survey Fact Sheet 005-00. http://ca.water.usgs.gov/rep/fs00500/fs00500.pdf. Ingebritsen, S.E. and D.R. Jones. 1999. Santa Clara Valley, California: A case of arrested subsidence. In D.L. Galloway, D.R., Jones, and S.E., Ingebritsen. S.E., eds., Land subsidence in the United States: U.S. Geological Survey Circular 1182, p. 15-22. http://pubs.er.usgs.gov/publication/cir1182. Ingerson, I.M. 1940. The hydrology of the sothern San Joaquin Valley, California and its relation to imported water supplies, Transactions of the American Geophysical Union, p. v. 22, p. 20-45. Inter-Agency Committee on Land Subsidence in the San Joaquin Valley. 1955. Proposed program for investigating land subsidence in the San Joaquin Valley, California. Sacramento, California. 60 p. Inter-Agency Committee on Land Subsidence in the San Joaquin Valley. 1958. Progress report on land-subsidence investigations in the San Joaquin Valley through 1957. Sacramento, California, 160 p.
Topic: Groundwater Land Subsidence from Groundwater Use in California
CA Water Plan Update 2013 Vol 4 Reference Guide Page 150

APRIL 2014 REPORT OF FINDINGS Land Subsidence from Groundwater Use in California
LSCE, BORCHERS AND CARPENTER 131
Ireland, R.L. 1986. Land subsidence in the San Joaquin Valley, California, as of 1983. U.S. Geological Survey Water-Resources Investigations Report 85–4196, 50 p. http://pubs.er.usgs.gov/usgspubs/wri/wri854196. Ireland R.L., J.F. Poland, and F.S. Riley. 1984. Land subsidence in the San Joaquin Valley, California, as of 1980. U.S. Geological Survey Professional Paper 437-I, 93 p. http://pubs.er.usgs.gov/usgspubs/pp/pp437I. Jachens, R.C., and Holzer, T.L. 1982. Differential compaction mechanism for earth fissures near Casa Grande, Arizona: Geological Society of America Bulletin, v. 93, no. 10, p. 998-1012 Jacob, C.E. 1950. Flow of groundwater. In Engineering Hydraulics ed. H. Rouse: 321-386 James, L., R. Richter, and R. Bean. 1997. History of engineering geology in the California Department of Water Resources, Environmental and Engineering Geoscience, v.3, 89-110. Jansen, R.B., G.W. Dukleth, B.B. Gordon, L.B. James, Shields, C.E. 1967. Earth movement at Baldwin Hills Reservoir, American Society of Civil Engineers, Journal of Soil Mechanics and Foundation Division, v. 73, no. SM4, p 551-575. Johnson, A.I., ed. 1977. Land Subsidence-- Proceedings of the Second International Symposium on Land Subsidence, Anaheim, California, December 13-17. 1976, International Association of Hydrological Sciences Publication 121, 669 p. Johnson, A.I., ed. 1981. Legal, socio-economic and environmental significance of land subsidence in the United States. American Society of Civil Engineering Journal of the Irrigation and Drainage Division 107, no. IR2:113-185. Johnson, A. I., ed. 1991. Land Subsidence: Proceedings of the Fourth International Symposium on Land Subsidence, Houston, Texas, May 12-17, 1991. International Association of Hydrological Sciences Publication 200, 690 p. Johnson, A.I. 1998. Land subsidence due to fluid withdrawal in the United States: An overview. In J.W. Borchers, ed., Land Subsidence ― Case Studies and Current Research, Proceedings of the Dr. Joseph F. Poland Symposium on Land Subsidence Association of Engineering Geologists Special Publication 8: 51-57. Johnson, A. I. 2005. A historical overview of land subsidence through the past six symposia. In A. Zhang, S. Gong, L. Carbognin, and A. I. Johnson, eds., Land subsidence—Proceedings of the 7th International Symposium on Land Subsidence, October 2005, vol. 1: 7–9. Johnson, A.I., L. Carbognin, and L. Ubertini, eds. 1984. Land Subsidence: Proceedings of the Third International Symposium on Land Subsidence, Venice, Italy, March 19-24, 1984. International Association of Hydrological Sciences Publication 151, 939 p.
Topic: Groundwater Land Subsidence from Groundwater Use in California
CA Water Plan Update 2013 Vol 4 Reference Guide Page 151

APRIL 2014 REPORT OF FINDINGS Land Subsidence from Groundwater Use in California
LSCE, BORCHERS AND CARPENTER 132
Johnson, A.I. and R.P. Moston. 1969. Relationship of consolidation characteristics and Atterberg limits for subsiding sediments in central California, U.S.A. In Land subsidence-- Proceedings of the Tokyo Symposium, Tokyo, Japan, September 1969, vol. 2, International Association of Scientific Hydrology Publications 89: 579–587. http://iahs.info/redbooks/a088/088062.pdf. Johnson, A.I., R.P. Moston, and D.A. Morris. 1968. Physical and hydrologic properties of water-bearing deposits in subsiding areas in central California. U.S. Geological Survey Professional Paper 497-A, 71 p., 14pls. http://pubs.er.usgs.gov/publication/pp497A. Johnson, H.O. and D.C. Agnew. 2001. Fluid Withdrawal and Precise Measurements of Horizontal Crustal Motion: A Test. University of California, San Diego: Institute of Geophysics and Planetary Physics. Johnston, R. H. 1989. The hydrologic responses to development in regional sedimentary aquifers. Ground Water 27, no. 3: 316-322. Publisher National Water Well Association, Ground-Water Technology Division Urbana, IL, United States. http://onlinelibrary.wiley.com/doi/10.1111/j.1745-6584.1989.tb00455.x/abstract King, N.E., D. Argus, J. Langbein, D.C. Agnew, G.W. Bawden, R.S. Dollar, Z. Liu, D.L. Galloway, E. Reichard, A. Yong, F.H. Webb, Y. Bock, K. Stark, and D. Barseghian. 2007. Space geodetic observation of expansion of the San Gabriel Valley, California, aquifer system, during heavy rainfall in winter 2004–2005. Journal of Geophysical Research, v. 112, B03409, doi:10.1029/2006JB004448. Kleinfelder, Inc. 1996. Chino Basin subsidence and fissuring study, Chino, California. Project No. 58-5264-02. Diamond Bar, California. Kleinfelder, Inc.1999. Update of subsidence map, Chino, California. Project No. 58-9040-01. Diamond Bar, California. Konikow, L.F. 2013. Groundwater depletion in the United States. U.S. Geological Survey Scientific Investigations Report 2013-5079, 63 p. http://pubs.usgs.gov/sir/2013/5079/. Kopper, W. and Finlayson, D. J. 1979. Legal aspects of subsidence due to well pumping. Am. Soc. Civil Engineers Annual Meeting, Atlanta, Georgia, Oct., preprint no. 3748, p 24. Kopper, W., and D. J. Finlayson. 1981. Legal aspects of subsidence due to well pumping, Proceedings of the American Society of Civil Engineers, v. 107, no. IR2, p. 137-147. Koslof, D., R.F. Scott, and J. Scranton. 1980. Finite element simulation of Wilmington Oil Field subsidence: I, Linear modeling. Tectonophysics 65: 339-368. Koslof, D., R.F. Scott, and J. Scranton. 1980. Finite element simulation of Wilmington Oil Field subsidence: II, Nonlinear modeling. Tectonophysics 70: 159-183.
Topic: Groundwater Land Subsidence from Groundwater Use in California
CA Water Plan Update 2013 Vol 4 Reference Guide Page 152

APRIL 2014 REPORT OF FINDINGS Land Subsidence from Groundwater Use in California
LSCE, BORCHERS AND CARPENTER 133
Kovach, R.L. 1965. Source mechanisms for Wilmington Oil Field, California, subsidence earthquakes. Seismological Society of America Bulletin 64, no. 3: 699-711. Kreider, C.M. 1957. City has that sinking feeling, Poplar Mechanics, January, 1957, p. 152-155, and 250. Kupferman, S.A. 1992. Regulating land use and development in areas subject to subsidence and ground fissures, Riverside County, California. In Proceedings 35th Annual Meeting of the Association of Engineering Geologists, Southern California Section, Long Beach, California, 170-174. Kupferman, S.A. 1998. Regulating land use and development in areas subject to subsidence and earth fissures: An update, Riverside County, California. In J.W. Borchers, ed., Land Subsidence― Case Studies and Current Research, Proceedings of the Dr. Joseph F. Poland Symposium on Land Subsidence, Association of Engineering Geologists Special Publication 8: 541-548. Land, P.E. 1984. Lost Hills Oil Field, in Lost Hills Oil Field and South Salt Lake Oil Field (1984, 1990), California Division of Oil and Gas, Publication No. TR32, p. 1-16. Landon, R.O. 2006. Subsidence and flow report for Russell Avenue bridge at Outside Canal, Central California Irrigation District, variously paginated. Larson, K.J., H. Basagaolu, and M.A. Marino. 2001. Numerical simulation of land subsidence in the Los Banos-Kettleman City area, California—University of California Davis Water Resources Center Technical Completion Report Contribution 207, 83 p. Larson, K., J.H. Basagaoglu, and M.A. Marino. 2001. Prediction of optimal safe ground water yield and land subsidence in the Los Banos Kettleman City area, California, using a calibrated numerical simulation model. Journal of Hydrology 242, no. 1-2: 79-102. Publisher Elsevier Amsterdam, Netherlands. http://www.sciencedirect.com/science/journal/00221694 Leake, S.A. 1990. Interbed storage changes and compaction in models of regional ground-water flow: Water Resources Research 26, no. 9:1939–1950. Leake, S.A. and D.L. Galloway. 2007. MODFLOW ground-water model-user guide to the subsidence and aquifer-system compaction package (SUB-WT) for water-table aquifers . U.S. Geological Survey Techniques and Methods 6-A23, 42 p. Leake, S.A. and D.E. Prudic. 1991. Documentation of a computer program to simulate aquifer-system compaction using the modular finite-difference groundwater flow model. U.S. Geological Survey Techniques of Water-Resources Investigations, book 6, chap. A2, 68 p. http://pubs.er.usgs.gov/publication/twri06A2. Lee, K.L. 1977. Calculated horizontal movements at Baldwin Hills, California. In A.I. Johnson, ed., Proceedings of the Second International Symposium on Land Subsidence, Anaheim,
Topic: Groundwater Land Subsidence from Groundwater Use in California
CA Water Plan Update 2013 Vol 4 Reference Guide Page 153

APRIL 2014 REPORT OF FINDINGS Land Subsidence from Groundwater Use in California
LSCE, BORCHERS AND CARPENTER 134
California, December 13–17, 1976. International Association of Hydrological Sciences Publication 121, p. 299-308. Lee, K.L. and C.K. Shen. 1969. Horizontal movements related to subsidence. American Society of Civil Engineers Journal of Soil Mechanics 94, no. SM6: 140-166. Leighton, D.A. and S.P. Phillips. 2003. Simulation of ground-water flow and land subsidence in the Antelope Valley ground-water basin, California. U.S. Geological Survey Water-Resources Investigations Report 03-4016, 118 p. http://pubs.er.usgs.gov/usgspubs/wri/wri034016. Leighton-Yen and Associates. 1974. Geotechnical Inputs: Report to the Huntington Beach Planning Department, 68 p. Li, J., and D. Ding. 2013. Modeling 3D land movement due to groundwater pumping with a variable parameter. In Global View of Engineering Geology and the Environment eds. F. Wu and S. Qi: 457-462. Taylor and Francis Group, London. Li, J., and D.C. Helm. 1998. Viscous drag, driving forces, and their reduction to Darcy’s law. Water Resources Research 34, no.7: 1675-1684. Lofgren, B.E. 1960. Near-surface land subsidence in western San Joaquin Valley, California. Journal of Geophysical Research 65, no. 3: 1053-1062. Lofgren, B.E. 1961. Measurement of compaction of aquifer systems in areas of land subsidence. In Short Papers in the Geologic and Hydrologic Sciences, Articles 1–146. U.S. Geological Survey Professional Paper 424-B, B49–B52. http://pubs.er.usgs.gov/publication/pp424B. Lofgren, B. 1966. Subsidence related to ground water withdrawal. Landslides and subsidence--Geologic Hazards Conf., 2d, Los Angeles, Calif., 1965, 105-110 http://www.amazon.com/Landslides-Subsidence-Geologic-Conference-California/dp/B00BXTM668 Lofgren, B.E. 1968. Analysis of stresses causing land subsidence. U.S. Geological Survey Professional Paper 600-B, p. 219-225. http://pubs.er.usgs.gov/publication/pp600B. Lofgren, B. E. 1969. Estimated subsidence in the Chino and Bunker Hill–Yucaipa areas in southern California for postulated water-level lowering, 1965–2015. U.S. Geological Survey Open-File Report, 20 p. Lofgren, B. E. 1969. Field measurement of aquifer-system compaction, San Joaquin Valley, California, U.S.A. In L.J. Tison, ed., Land subsidence, Volume 1: International Association of Scientific Hydrology Publication 88, 272-284. Lofgren, B.E. 1969. Land subsidence due to the application of water. In D.J. Varnes and G. Kiersch, eds., Reviews in Engineering Geology 2. Geological Society of America, 271-303.
Topic: Groundwater Land Subsidence from Groundwater Use in California
CA Water Plan Update 2013 Vol 4 Reference Guide Page 154

APRIL 2014 REPORT OF FINDINGS Land Subsidence from Groundwater Use in California
LSCE, BORCHERS AND CARPENTER 135
Lofgren, B.E. 1971. Significant role of seepage stresses in compressible aquifer systems [abs.]: Eos (American Geophysical Union, Transactions), v. 52, no. 11, p 832.
Lofgren, B.E. 1975. Land subsidence due to ground-water withdrawal, Arvin-Maricopa area, California. U.S. Geological Survey Professional Paper 437-D, 55 p. http://pubs.er.usgs.gov/publication/pp437D. Lofgren, B.E. 1976. Land subsidence and aquifer-system compaction in the San Jacinto Valley, Riverside County, California: A progress report. U.S. Geological Survey Journal of Research 4, no. 1: 9-18. Lofgren, B.E. 1977. Hydrogeologic effects of subsidence, San Joaquin Valley, California. In A.I. Johnson., ed., Proceedings of the Second International Symposium on Land Subsidence, Anaheim, California, December 13–17, 1976. International Association of Hydrological Sciences Publication 121, 113-123. Lofgren, B.E. 1978. Monitoring crustal deformation in the Geysers-Clear Lake geothermal area, California. U.S. Geological Survey Open-File Report 78-597, 19 p. Lofgren, B. E. 1978. Hydraulic stresses cause ground movement and fissures, Picacho, Arizona. Geological Society of America Abstracts with Programs 10, no. 3: 271 Lofgren, B.E.1979. Changes in aquifer-system properties with ground-water depletion. In S.K. Saxena, ed., Evaluation and prediction of subsidence: Proceedings, Engineering Foundation Conference, January 1978, Pensacola Beach, Florida. American Society of Civil Engineers, 26-46. Lofgren, B.E. 1998. Post-audit of subsidence concepts of the Poland era after two decades of subsidence research. In J.W. Borchers, ed., Land Subsidence ― Case studies and current research, Proceedings of the Dr. Joseph F. Poland Symposium on Land Subsidence. Association of Engineering Geologists Special Publication 8, 45-49. Lofgren, B. E. and R. L. Ireland. 1973. Preliminary investigation of land subsidence in the Sacramento Valley, California. U.S. Geological Survey Open-File Report 74–1064, 32 p. http://pubs.er.usgs.gov/usgspubs/ofr/ofr741064. Lofgren, B.E., and R.L. Klausing. 1969. Land subsidence due to ground-water withdrawal, Tulare-Wasco area California. U.S. Geological Survey Professional Paper 437-B, 103 p. http://pubs.er.usgs.gov/usgspubs/pp/pp437B. Lofgren, B.E., M.K. Merriam, and R.L. Lander. undated. Land subsidence in the Davis and Stockton areas, California. A consulting report for the California Superconducting Super Collider Siting Committee, 1-56. Londquist, C.J. 1995. Hydrogeology and land subsidence, Antelope Valley, California. In K.R. Prince, D.L. Galloway, and S.A. Leake, eds., U.S. Geological Survey Subsidence Interest Group Conference, Edwards Air Force Base, Antelope Valley, California, November 18-19, 1992.
Topic: Groundwater Land Subsidence from Groundwater Use in California
CA Water Plan Update 2013 Vol 4 Reference Guide Page 155

APRIL 2014 REPORT OF FINDINGS Land Subsidence from Groundwater Use in California
LSCE, BORCHERS AND CARPENTER 136
Abstracts and summary, U.S. Geological Survey Open-File Report 94-532: 38-39. http://pubs.usgs.gov/of/1994/ofr94-532/. Londquist, C.J., D.L. Rewis, D.L. Galloway, and W.F. McCaffrey. 1993. Hydrogeologic and land subsidence assessment, Edwards AFB, Antelope Valley, California, January 1989-December 1991. U.S. Geological Survey Water-Resources Investigations Report 93-4114, 74 p. http://pubs.usgs.gov/of/1994/ofr94-532/. Lu, Z. and W.R. Danskin. 2001. InSAR analysis of natural recharge to define structure of a ground-water basin, San Bernardino, California. Geophysical Research Letters 28, no. 13: 2661-2664. Lucas, C.V., and S.B James. 1977. Land subsidence in the California state water project, in Johnson, A.I., ed., Proceedings of the Second International Symposium on Land Subsidence, Anaheim, California, December 13–17, 1976, International Association of Hydrological Sciences Publication 121, p. 533-543. Luhdorff and Scalmanini, Consulting Engineers. 1999. Specifications and Contract Documents for Extensometer Construction, Extensometer No. 1 Fordel, Inc., May 1999. Luhdorff and Scalmanini, Consulting Engineers. 2013. Summary of groundwater and land surface monitoring results for northern Solano County, Californa. Technical Memorandum for Solano County Water Agency. Magleby, D.C. and I.E. Klein. 1965. Ground-water conditions and potential pumping resources above the Corcoran Clay: an addendum to the ground-water geology and resources definite plan appendix, 1963. U.S. Bureau of Reclamation Open-File Report, 21 plates. Mankey, E. T. 1963. Tabulation of elevation differences for earth movement study in Antelope Valley from 1928 to 1960. County of Los Angeles, Department of County Engineer, Survey Division, J.N. 0301.02, Survey Division File Map No. 65-56. Martin, J.C., and S. Serdengecti. 1984. Subsidence over oil and gas fields, in Man-Induced Land Subsidence, Geological Society of America Reviews in Engineering Geology v. 6, T. L. Holver (ed.), p. 23-34. Massonnet, D., T. Holzer, and H. Vadon. 1997. Land subsidence caused by the East Mesa geothermal field, California, observed using SAR interferometry. Geophysical Research Letters 24: 901–904. Maupin, M. A. and N. L. Barber. 2005. Estimated withdrawals from principal aquifers in the United States, 2000. U.S. Geological Survey Circular 1279, 46 pp. Mayuga, M. N. and D. R. Allen. 1969. Subsidence in the Wilmington oil field, Long Beach, California, USA. In Land Subsidence: Proceedings of the Tokyo Symposium, Tokyo, Japan,
Topic: Groundwater Land Subsidence from Groundwater Use in California
CA Water Plan Update 2013 Vol 4 Reference Guide Page 156

APRIL 2014 REPORT OF FINDINGS Land Subsidence from Groundwater Use in California
LSCE, BORCHERS AND CARPENTER 137
September 1969, vol. 1, International Association of Scientific Hydrology Publications 88, 66–79. http://iahs.info/redbooks/a088/088013.pdf. McCann, G. D. and C. H. Wilts. 1951. A mathematical analysis of the subsidence in the Long Beach-San Pedro area. California Institute Technology, Tech. Report., 117 p. McMillan, J. F. 1973. Land subsidence Antelope Valley area of Los Angeles County. County of Los Angeles, Department of County Engineer, Survey Division and Survey Division File Map No. 65–58. Meade, R.H. 1964. Removal of water and rearrangement of particles during the compaction of clayey sediments review. U.S. Geological Survey Professional Paper 497-B, 23 p. http://pubs.er.usgs.gov/publication/pp497B. Meade, R. H. 1967. Petrology of sediments underlying areas of land subsidence in central California. U.S. Geological Survey Professional Paper 497-C, 83 p. http://pubs.er.usgs.gov/usgspubs/pp/pp497C. Meade, R.H. 1968. Compaction of sediments underlying areas of land subsidence in central California. U.S. Geological Survey Professional Paper 497-D, p 39. http://pubs.er.usgs.gov/usgspubs/pp/pp497D. Mellors, R. J. and A. Boisvert. 2003. Deformation near the Coyote Creek Fault, Imperial County, California: tectonic or groundwater-related. In Geochemistry Geophysics Geosystems G Super 3, vol.4, no. 2. American Geophysical Union and The Geochemical Society United States. 14 p. http://onlinelibrary.wiley.com/doi/10.1029/2001GC000254/abstract Metzger, L.F., M.E. Ikehara, and J.F. Howle. 2002. Vertical-deformation, water-level, microgravity, geodetic, water-chemistry, and flow-rate data collected during injection, storage, and recovery tests at Lancaster, Antelope Valley, California, September 1995 through September 1998. U.S. Geological Survey Open-File Report 01-414, 149 p. http://pubs.usgs.gov/of/2001/ofr01414/. Miller, R. E. 1961. Compaction of an aquifer system computed from consolidation tests and decline in artesian head. In Short Papers in the Geologic and Hydrologic Sciences, Articles 1–146, U.S. Geological Survey Professional Paper 424-B, p. B54–58. http://pubs.er.usgs.gov/usgspubs/pp/pp424B. Miller, R.E., J.H. Green, and G.H. Davis. 1971. Geology of the compacting deposits in the Los Banos-Kettleman City subsidence area, California. U.S. Geological Survey Professional Paper 497-E, 46 p. http://pubs.er.usgs.gov/publication/pp497E. Miller, R.E. and J.A. Singer. 1971. Subsidence in the Bunker Hill–San Timoteo area, southern California. U.S. Geological Survey Open-File Report, 28 p. http://pubs.er.usgs.gov/publication/ofr71209, [currently not available on line].
Topic: Groundwater Land Subsidence from Groundwater Use in California
CA Water Plan Update 2013 Vol 4 Reference Guide Page 157

APRIL 2014 REPORT OF FINDINGS Land Subsidence from Groundwater Use in California
LSCE, BORCHERS AND CARPENTER 138
Miller, O.E. and W.H. Somerton. 1955. Operators eye heroic measures to halt Wilmington sinking. Oil and Gas Journal 54, no. 33: 7. Morton, D.M. 1977. Surface deformation in part of the San Jacinto Valley, southern California. U.S. Geological Survey Journal of Research5, no. 1: 117-124. Morton, D.M. 1995. Subsidence and ground fissures in the San Jacinto Basin area, southern California. In K.R. Prince, D.L. Galloway, and S.A. Leake, eds., U.S. Geological Survey Subsidence Interest Group Conference, Edwards Air Force Base, Antelope Valley, California, November 18-19, 1992: Abstracts and summary, U.S. Geological Survey Open-File Report 94-532, 29-31. http://pubs.usgs.gov/of/1994/ofr94-532/. Morton. P.K., R.V. Miller, and J.R. Evans. 1976. Environmental geology of Orange County, California, California Division of Mines and Geology Open-File Report 79-8 LA.
Mount, J., and R. Twiss. 2004. Subsidence, sea level rise, Seismicity in the Sacramento-San Joaquin Delta: Report to the levee integrity subcommittee of the California Bay-Delta Authority Independent Science Board, 22 p. Nagel, N.B. 2001. Compaction and subsidence issues within the petroleum industry, From Wilmington to Ekofisk and beyond. Physics and Chemistry of the Earth 26: 3–14. Narasimhan, T.N. 1984. Subsidence due to geothermal fluid withdrawal. In Holzer, T.L., ed., Man-induced land subsidence: Geological Society of America Reviews in Engineering Geology 6: 35–66. National Research Council. 1991. Mitigating losses from land subsidence in the United States. Washington, D.C.: National Academy Press, 58 p. Neuman, S.P. and P.A. Witherspoon. 1971. Aquitards in the coastal ground-water basin of Oxnard plain, Ventura County. California Department of Water Resources, Bulletin 63-4, 569 p. Nguyen, T.Q. 1996. Simulating and predicting land subsidence at Amedee, Lassen County, California. University of Nevada, Reno. Nishikawa, T., D.L. Rewis, and P. Martin. 2001. Numerical simulation of ground-water flow and land subsidence at Edwards Air Force Base, Antelope Valley, California. U.S. Geological Survey Water-Resources Investigations Report 01-4038, 111 p. http://pubs.er.usgs.gov/publication/wri20014038. O'Rourke, J.E. and B.B. Ranson. 1979. Instruments for monitoring of Geothermal subsidence: Geothermal subsidence research management program. Earth Sciences Division, Lawrence Berkeley Laboratory, University of California, LBL-8616, GSRMP-2,UC-37, 96 P., appendix. Page, R.W. 1998. A compressible diatomaceous clay Sacramento Valley, California. In J. Borchers, ed., Land Subsidence—Case Studies and Current Research, Proceedings of the Dr.
Topic: Groundwater Land Subsidence from Groundwater Use in California
CA Water Plan Update 2013 Vol 4 Reference Guide Page 158

APRIL 2014 REPORT OF FINDINGS Land Subsidence from Groundwater Use in California
LSCE, BORCHERS AND CARPENTER 139
Joseph F. Poland Symposium, Association of Engineering Geologists Special Publication 8: 81-87. Page, R.W. and, G.L. Bertoldi. 1983. A Pleistocene diatomaceous clay and a pumiceous ash. California Geology 36, no. 1: 14–20. Pampeyan, E.H., T.L. Holzer, and M.M. Clark. 1988. Modern ground failure in the Garlock fault zone, Fremont Valley, California. Geological Society of America Bulletin 100: 677–691. Parsons Brinckerhoff. 2013. California High-Speed Rail Project Monthly Program Report, May 2013, 26 p. Phillips, S.P. 1995. Land subsidence as a resource management objective in Antelope Valley, California. In K.R. Prince, D.L. Galloway, and S.A. Leake, eds., U.S. Geological Survey Subsidence Interest Group Conference, Edwards Air Force Base, Antelope Valley, California, November 18-19. 1992. Abstracts and summary, U.S. Geological Survey Open-File Report 94-532, p. 44-45. http://pubs.usgs.gov/of/1994/ofr94-532/. Phillips, S.P., C.S. Carlson, L.F. Metzger, J.F. Howle, D.L. Galloway, M. Sneed, M.E. Ikehara, K.W. Hudnut, and N.E. King. 2003. Analysis of tests of subsurface injection, storage, and recovery of freshwater in Lancaster, Antelope Valley, California. U.S. Geological Survey Water-Resources Investigations Report 03-4061, 122 p. http://pubs.er.usgs.gov/publication/wri034061. Phillips, S.P., C.S. Carlson, L.F. Metzger, M. Sneed, D.L. Galloway, K.W. Hudnut, and M.E. Ikehara. 2002. Optimal management of an ASR program to control land subsidence in Lancaster, California. In P.J. Dillon, P.J., ed., Management of aquifer recharge for sustainability, Proceedings of the 4th International Symposium on Artificial Recharge of Groundwater, ISAR-4, Adelaide, South Australia, September 22-26, 2002, 361-366. Delft, Netherlands: A.A. Balkema Publishers. Pierce, R.L. 1970. Reducing land subsidence in the Wilmington Oil Field by use of saline water: Water Resources Research 6, no. 5: 1505-1514. Poland, J.F. 1960. Land subsidence in the San Joaquin Valley and its effect on estimates of ground-water resources, International Association of Scientific Hydrology Commission of Subterranean Waters. International Association of Scientific Hydrology Publication 52: 324–335. Poland, J.F. 1961. The coefficient of storage in a region of major subsidence caused by compaction of an aquifer system. In Short Papers in the Geologic and Hydrologic Sciences, Articles 1–146, U.S. Geological Survey Professional Paper 424-B, 52-54. http://pubs.er.usgs.gov/publication/pp424B. Poland, J. F. 1968. Compressibility and clay minerals of sediments in subsiding ground-water basins, southwestern United States. In Geological Society of America 81st Annual Meeting Program, Mexico City, Mexico, 1968, Geological Society of America Special Paper 121, 50-71.
Topic: Groundwater Land Subsidence from Groundwater Use in California
CA Water Plan Update 2013 Vol 4 Reference Guide Page 159

APRIL 2014 REPORT OF FINDINGS Land Subsidence from Groundwater Use in California
LSCE, BORCHERS AND CARPENTER 140
Poland, J.F. 1969. Land subsidence and aquifer system compaction, Santa Clara Valley, California. In Land subsidence, Proceedings of the Tokyo Symposium, Tokyo, Japan, September 1969, vol. 1, International Association of Scientific Hydrology Publication 88, 285–294. http://iahs.info/redbooks/a088/088032.pdf. Poland, J.F. 1969. Status of present knowledge and needs for additional research on compaction of aquifer systems. In L.J. Tison, ed., Land subsidence, Volume 1, International Association of Scientific Hydrology Publication 88, 11–21. Poland, J. F. 1972. Land subsidence in the Western states due to groundwater overdraft. Water Resources Bulletin 8, 1: 118-131; Publisher American Water Resources Association Herndon, VA, United States. Poland, J.F. 1972. Subsidence and its control. In T. D. Cook, ed., Underground waste management and environmental implications, American Association of Petroleum Geologists Memoir 18, 50–71. Poland, J.F. 1973. Subsidence in United Sates due to ground-water overdraft: a review. In Proceedings of the Irrigation and Drainage Division (American Society of Civil Engineers) specialty Division, Specialty Conference, Fort Collins, Colorado, April 22-24, 1973, American Society of Civil Engineers, 11-38. Poland, J.F. 1977. Land subsidence stopped by artesian-head recovery, Santa Clara Valley, California. In A.I. Johnson, ed., Proceedings of the Second International Symposium on Land Subsidence, Anaheim, California, December 13–17, 1976, International Association of Hydrological Sciences Publication 121, 124–132. http://iahs.info/redbooks/a121/iahs_121_0124.pdf. Poland, J. F. 1978. Land subsidence in the Santa Clara Valley. Water Spectrum 10, 2: 11-16. Publisher U. S. Army Corps of Engineers Fort Belvoir, VA, United States. Poland, J.F. 1981. Subsidence in the United States due to ground-water withdrawal. In A.I. Johnson, ed., Legal, socio-economic and environmental significance of land subsidence in the United States: American Society of Civil Engineering Journal of the Irrigation and Drainage Division, v. 107, no. IR2, 115-135. Poland, J.F. ed. 1984. Guidebook to studies of land subsidence due to ground-water withdrawal. United Nations Educational, Scientific and Cultural Organization, Paris. Studies and Reports in Hydrology 40:305app. A-E. http://wwwrcamnl.wr.usgs.gov/rgws/Unesco/. Poland, J.F. 1984. Case history No. 9.14, Santa Clara Valley, California, USA. In J.F. Poland, ed., Guidebook to studies of land subsidence due to ground-water withdrawal. United Nations Educational, Scientific and Cultural Organization, Paris, Studies and reports in hydrology 40: 279–290, http://wwwrcamnl.wr.usgs.gov/rgws/Unesco/.
Topic: Groundwater Land Subsidence from Groundwater Use in California
CA Water Plan Update 2013 Vol 4 Reference Guide Page 160

APRIL 2014 REPORT OF FINDINGS Land Subsidence from Groundwater Use in California
LSCE, BORCHERS AND CARPENTER 141
Poland, J. F. 1988. Subsidence due to ground water withdrawal. Oxford Univ. Press New York, NY, United States. Pages: 272-285; 1988. Book Title Perspectives on water; uses and abuses Publisher Oxford Univ. Press New York, NY, United States. Poland, J.F. and G.H. Davis. 1956. Subsidence of the land surface in the Tulare Wasco (Delano) and Los Banos-Kettleman City areas, San Joaquin Valley, California. American Geophysical Union Transactions, vol. 37, no. 3: 287-296. Poland, J. F. and G. H. Davis. 1969. Land subsidence due to withdrawal of fluids. In D. J. Varnes and G. Kiersch, George, eds., Reviews in Engineering Geology, v. 2, Boulder, Co1orado: Geological Society of America, 187–269. Poland, J.F. and J.H. Green. 1962. Subsidence in the Santa Clara Valley, California: a progress report. U.S. Geological Survey Water-Supply Paper 1619-C, 16 p. http://pubs.er.usgs.gov/publication/wsp1619C. Poland, J.F. and R.L. Ireland. 1965. Shortening and protrusion of a well casing due to compaction of sediments in a subsiding area in California. U.S. Geological Survey Prof. Paper 525-B, pp B180-B183,. http://pubs.er.usgs.gov/usgspubs/pp/pp525B. Poland, J. F. and R. L. Ireland. 1984. Land subsidence in the Santa Clara Valley, California as of 1980. U.S. Geological Survey Open-File Report 84-818, 26 p. http://pubs.er.usgs.gov/publication/ofr84818 Poland, J.F. and R.L. Ireland. 1988. Land subsidence in the Santa Clara Valley, California, as of 1982. U.S. Geological Survey Professional Paper 497-F, 61 p. http://pubs.er.usgs.gov/usgspubs/pp/pp497F. Poland, J. F. and B. E. Lofgren. 1984. Case history No. 9.13, San Joaquin Valley, California, USA. In J.F. Poland, ed., Guidebook to studies of land subsidence due to ground-water withdrawal. United Nations Educational, Scientific and Cultural Organization, Paris, Studies and reports in hydrology 40, 263–277, http://wwwrcamnl.wr.usgs.gov/rgws/Unesco/. Poland, J.F., B.E. Lofgren, R.L. Ireland, and R.G. Pugh. 1975. Land subsidence in the San Joaquin Valley, California, as of 1972. U.S. Geological Survey Professional Paper 437-H, 78 p. http://pubs.er.usgs.gov/publication/pp437H. Poland, J.F., B.E. Lofgren, and F.S. Riley. 1972. Glossary of selected terms useful in studies of the mechanics of aquifer systems and land subsidence due to fluid withdrawal. U.S. Geological Survey Water Supply Paper 2025, 9 p. Prince, K. R. and D. L. Galloway. 2003. U.S. Geological Survey Subsidence Interest Group Conference, Proceedings of the technical meeting, Galveston, Texas, November 27–29, 2001. U.S. Geological Survey Open-File Report 03-308, 162 p., http://pubs.usgs.gov/of/2003/ofr03-308/.
Topic: Groundwater Land Subsidence from Groundwater Use in California
CA Water Plan Update 2013 Vol 4 Reference Guide Page 161

APRIL 2014 REPORT OF FINDINGS Land Subsidence from Groundwater Use in California
LSCE, BORCHERS AND CARPENTER 142
Prince, K. R., D. L. Galloway, and S. A. Leake. 1995. U.S. Geological Survey Subsidence Interest Group Conference, Edwards Air Force Base, Antelope Valley, California, Nov. 18-19, 1992. Abstracts and Summary, U.S. Geological Survey Open-File Report 94-532, 84 p. http://pubs.usgs.gov/of/1994/ofr94-532/. Prince, K. R. and S. A. Leake. 1997. U.S. Geological Survey Subsidence Interest Group Conference, Proceedings of the technical meeting, Las Vegas, Nevada, February 14-16, 1995. U.S. Geological Survey Open-File Report 97-47, 37 p. http://pubs.usgs.gov/of/1997/ofr97-047/. Prince, K.R., R. Sonenshein, and G. Karavitis. 2003. International land subsidence data base. In K.R. Prince, and D.L. Galloway, D.L., eds., U.S. Geological Survey subsidence interest group conference, proceedings of the technical meeting, Galveston, Texas, November 27-29, 2001. U.S. Geological Survey Open-File Report 03-308, p. 147-153. http://pubs.usgs.gov/of/2003/ofr03-308/. Prince, K.R., R. Sonenshein, and G. Karavitas. 2005. International Land Subsidence Data Base. In Z. Agen, G. Shiliang, L. Carbognin, A.I., Johnson, eds., Land subsidence-- Proceedings of the Seventh International Symposium on Land Subsidence, Shanghai, China, October 23-28, 2005, Shanghai Scientific & Technical Publishers, v. 2: 524-531. Pritchett, J.W., S.K. Garg, and D.H. Brownell Jr., and H.B. Levina. 1975. Geohydrological environmental effects of geothermal power production. Report no. 555-R-75-2733, Systems, Science and Software, La Jolla, California. Proctor, R. J. 1962. Geologic features of a section across the Casa Loma fault, exposed in a aqueduct trench near San Jacinto, California, Geological Society of America, v. 73, no. 10 p. 1293-1296. Prokopovich, N.P. 1967. Land subsidence along Delta-Mendota Canal, San Joaquin Valley, California. Engineering geology and soils engineering symposium, 5th Ann., Pocatello, Idaho, Proceedings, 173-196. Prokopovitch, N.P. 1969. Land subsidence along the Delta-Mendota Canal, California. Journal of the International Society for Rock Mechanics no. 1: 134-144. Prokopovitch, N.P. 1971. Predictions of ultimate residual subsidence along the San Luis Canal, California. Fourth Asian Regional Conference on Soil Mechanics and Foundation Engineering, Bankok, Thailand, 67-73. Prokopovich, N.P. 1973. Engineering geology of the Central Valley Project. Journal American Water Works Association, 65, no. 1: 186-194. Prokopovich, N. P. 1974. Land subsidence and pollution. Proceedings of the Second International Congress of the International Association of Engineering Geology, São Paulo, Brazil, August, 1974,Volume 1, Theme III: 2.1-2.10.
Topic: Groundwater Land Subsidence from Groundwater Use in California
CA Water Plan Update 2013 Vol 4 Reference Guide Page 162

APRIL 2014 REPORT OF FINDINGS Land Subsidence from Groundwater Use in California
LSCE, BORCHERS AND CARPENTER 143
Prokopovitch, N.P. 1975. Past and future subsidence along the San Luis Drain. Bulletin of the Association of Engineering Geologists 12, no. 1: 1-22. Prokopovitch, N. P. 1977. Quality of predictions of land subsidence along the Delta-Mendota and San Luis Canals in California, USA. In A.I. Johnson, ed., Proceedings of the Second International Symposium on Land Subsidence, Anaheim, California, December 13–17, 1976, International Association of Hydrological Sciences Publication 121, 587-599. Prokopovitch, N.P. 1983. Neotectonic movements and subsidence caused by piezometric decline. Bulletin of the Association of Engineering Geologists20, no. 4: 393-404. Prokopovich, N.P. 1983. Past and future land subsidence Friant-Kern Canal, Central Valley Project, California (preliminary and unpublished), U. S. Bureau of Reclamation, variously paginated. Prokopovitch, N.P. 1984. Predictions of future subsidence along the Friant-Kern Canal in California. Bulletin of the Association of Engineering Geologists 21, no. 2: 215-228. Prokopovitch, N.P. 1985. Subsidence of peat in California and Florida. Bulletin of the Association of Engineering Geologists 22: 395-420. Prokopovitch, N.P. 1986. Economic impact of subsidence on water conveyance in California's San Joaquin Valley, U. S. A. In A.I. Johnson, L. Carborgnin, and L. Ubertini, eds., Proceedings of the Third International Symposium on Land subsidence, Venice, Italy, March 19-25, 1984, International Association of Hydrological Sciences Publication 151, 795-804. Prokopovitch, N.P. 1986. Origin and treatment of hydrocompaction in the San Joaquin Valley, CA, USA. In A.I. Johnson, L. Carborgnin, and L. Ubertini, L., eds., Proceedings of the Third International Symposium on Land subsidence, Venice, Italy, March 19-25, 1984, International Association of Hydrological Sciences Publication 151, 537-546. Prokopovich, N.P., and D.J. Hebert. 1968. Land subsidence along the Delta-Mendota Canal, California, Journal American Water Works Association, v. 60, no. 2, 915-920. Prokopovich, N.P. and D.C. Magleby. 1968. Land subsidence in Pleasant Valley area, Fresno County, California. Journal American Water Works Association 60, no. 4: 413-424. Publisher American Water Works Association Denver, CO, United States. Prokopovitch, N.P. and M.J. Marriott. 1983. Cost of subsidence to the Central Valley Project, California, Bulletin of the Association of Engineering Geologists 20, no. 3: 325-332. Provost and Pritchard Engineering Group. 2012. Memoranda: Crop water use and recharge basin calculations - revised, Western Madera County subsidence study, 10 p., attachments. Prudic, D.E. and A.K. Williamson. 1986. Evaluation of a technique for simulating a compacting aquifer system in the Central Valley of California, U.S.A. In A.I. Johnson, L. Carborgnin, and L.
Topic: Groundwater Land Subsidence from Groundwater Use in California
CA Water Plan Update 2013 Vol 4 Reference Guide Page 163

APRIL 2014 REPORT OF FINDINGS Land Subsidence from Groundwater Use in California
LSCE, BORCHERS AND CARPENTER 144
Ubertini, eds., Proceedings of the Third International Symposium on Land Subsidence, Venice, Italy, March 19-25, 1984, International Association of Scientific Hydrology Publication 151: 53-63. Purnendu, N. 2005. Land Subsidence, Storage and Hydraulic Properties of an Aquifer. University of California, Davis: Singh Publisher. Quinn, N.W.T. and J.A. Faghih. 2008. WESTSIM: Groundwater conjunctive use, agricultural drainage and wetland return flow simulation on the west-side of the San Joaquin Basin. In C.F. Brush and N.L. Miller, eds. Proceedings of the California Central Valley Groundwater Modeling Workshop, July 10–11. 2008. Lawrence Berkeley National Laboratory: Berkeley, California. Sacramento, California. California Water and Environmental Modeling Forum, 26–32. Reichard, E.G., and J.D. Bredehoeft. 1984. An engineering economic analysis of a program for artificial groundwater recharge. Water Resources Bulletin 20: 929–939. Reichard, E.G., Z. Li, and C. Hermans. 2010. Emergency use of groundwater as a backup supply: quantifying hydraulic impacts and economic benefits. Water Resources Research 46: 9. American Geophysical Union Washington, DC, United States. http://onlinelibrary.wiley.com/doi/10.1029/2009WR008208/abstract Riley, F.S. 1969. Analysis of borehole extensometer data from central California. In Land subsidence-- Proceedings of the Tokyo Symposium, Tokyo, Japan, September 1969, International Association of Scientific Hydrology Publications 89: 423–431. http://iahs.info/redbooks/a088/088047.pdf. Riley, F.S. 1970. Land-surface tilting near Wheeler Ridge, southern San Joaquin Valley, California. U.S. Geological Survey Professional Paper 497-G, 29 p. http://pubs.er.usgs.gov/publication/pp497G. Riley, F.S. 1986. Developments in borehole extensometry. In A.I. Johnson, L. Carborgnin, and L. Ubertini, eds., Proceedings of the Third International Symposium on Land subsidence, Venice, Italy, March 19-25, 1984, International Association of Scientific Hydrology Publication 151, 169–186. http://iahs.info/redbooks/a151/iahs_151_0169.pdf. Riley, F.S. 1998. Mechanics of aquifer systems. The scientific legacy of Dr. Joseph F. Poland. In J.W. Borchers, ed., Land subsidence case studies and current research, Proceedings of the Dr. Joseph F. Poland Symposium on Land Subsidence, Association of Engineering Geologists Special Publication 8: 13–27. Riley, F.S. 2003. On aquifer mechanics: how did we get here and where might we go? In K.R. Prince and D.L. Galloway, eds., U.S. Geological Survey subsidence interest group conference, proceedings of the technical meeting, Galveston, Texas, November 27-29, 2001. U.S. Geological Survey Open-File Report 03-308. 1-11. http://pubs.usgs.gov/of/2003/ofr03-308/.
Topic: Groundwater Land Subsidence from Groundwater Use in California
CA Water Plan Update 2013 Vol 4 Reference Guide Page 164

APRIL 2014 REPORT OF FINDINGS Land Subsidence from Groundwater Use in California
LSCE, BORCHERS AND CARPENTER 145
Roberts, J.E. 1969. Sand compression as a factor in oil field subsidence. In L.J. Tison, ed., Land subsidence, Volume 2: International Association of Scientific Hydrology Publication 89, 368–376. Rojstaczer, S.A. and S.J. Deverel. 1993. Time dependence of atmospheric carbon inputs from drainage of organic soils. Geophysical Research Letters20:1,383–1,386. Rojstaczer, S.A. and S.J. Deverel. 1995. Land subsidence in drained histosols and highly organic mineral soils of the Sacramento-San Joaquin Delta. Soil Science Society of America Journal59: 1162-1167. Rojstaczer, S.A., R.E. Hamon, S.J. Deverel, and C.A. Massey. 1991. Evaluation of selected data to assess the causes of subsidence in the Sacramento-San Joaquin Delta, California. U.S. Geological Survey Open-File Report 91-193, 16 p. Roll, R.J. 1967. Effect of subsidence on well fields. Journal of the American Water Works Association 59, no. 1: 80-88. San Joaquin Valley Geology, History of the oil industry. http://www.sjvgeology.org/history/sjv_chronology.html accessed August 23, 2013. Schatz, J. F., P. W. Kasameyer, and J. A. Cheney. 1978. A method of using in situ porosity measurements to place an upper bound on geothermal reservoir compaction. In Proc. Second Invit. Well Testing Symposium, Berkeley, California: Lawrence Berkeley Laboratory. http://www.osti.gov/bridge/servlets/purl/6046229-aMxN17/6046229.PDF. Schmidt, D.A. and R. Bürgmann, 2003. Time dependent land uplift and subsidence in the Santa Clara Valley, California, from a large InSAR data set. Journal of Geophysical Research 108, no. B9:2416. doi:10.1029/2002JB002267. Schmidt, K.D. and Associates. 2012. Groundwater conditions and land subsidence in the Sack Dam-Red Top area. 38 p., appendix. Shelton, M.J. and L.B. James. 1959. Engineer-geologist team investigates subsidence. Journal of the Pipeline Division, American Society of Civil Engineers, 18 p. Sheng, Z. and D.C. Helm. 1994. Displacement discontinuity modeling of fissuring caused by groundwater withdrawal. In Computer Methods and Advances in Geomechanics eds. H.J. Siriwardane and M.M. Zaman: 1263-1268. Sheng, Z., D.C. Helm, and J. Li. 2003. Mechanisms of earth fissuring caused by groundwater withdrawal, Environmental and Engineering Geoscience 9, no. 4: 351-362. Shlemon, R.J. 1995. Groundwater rise and hydrocollapse: technical and political implications of "Special Geologic Report Zones" in Riverside County, California, USA. In F.B.J. Barends, J.J.B. Frits, and F.H. Schroder, eds., Land Subsidence-- Proceedings of the Fifth International
Topic: Groundwater Land Subsidence from Groundwater Use in California
CA Water Plan Update 2013 Vol 4 Reference Guide Page 165

APRIL 2014 REPORT OF FINDINGS Land Subsidence from Groundwater Use in California
LSCE, BORCHERS AND CARPENTER 146
Symposium on Land Subsidence, The Hague, Netherlands, October 16-20, 1995, International Association of Hydrological Sciences Publication 234, 481-486. Shlemon, R.J., M.J. Barry, S.C. Alhadeff, and S.A. Kupferman. 1998. Legal, geotechnical, and political aspects of subsidence zone formation in California. In J.W. Borchers, ed., Land Subsidence― Case Studies and Current Research, Proceedings of the Dr. Joseph F. Poland Symposium on Land Subsidence, Association of Engineering Geologists Special Publication 8, 549-552. Shlemon, R.J. and P. Davis. 1992. Ground fissures in the Temecula area, southwestern Riverside County, California. In B.W. Pipkin and R.J. Proctor, eds., Engineering Geology Practice in Southern California, Association of Engineering Geologists, Southern California Section Special Publication No. 4, 275–288. Shlemon, R.J. and M. Hakakian. 1992. Fissures produced both by groundwater rise and by groundwater fall: a geological paradox in the Temecula-Murrieta area, southwestern Riverside County, California. In M.L. Stout, ed., Proceedings, Association of Engineering Geologists, 35th Annual Meeting, Long Beach, California, 165-169. Shoemaker, R.R. and T.J. Thorley. 1955. Problems of ground subsidence. American Water Works Association Journal 47, no. 4: 412-418. Snay, R.A., Soler, T. 2008. Continuously operating reference station (C)RS): history, applications, and future enhancements, Journal of Surveying Engineering, 134(3), p. 95-104. Sneed, M. 2001. Hydraulic and mechanical properties affecting ground-water flow and aquifer-system compaction, San Joaquin Valley, California. U.S. Geological Survey Open-File Report 01–35, 26 p. Sneed, M. 2010. Measurement of land subsidence using interferometry, Coachella Valley, California. In D. Carreon-Freyre, M. Cerca, D. L. Galloway, J.J. Silva-Corona, eds., Land Subsidence: Associated Hazards and the Role of Natural Resources Development, Proceedings of the Eighth International Symposium on Land Subsidence, Querétaro, Mexico, October 17–22, 2010, International Association of Hydrological Sciences Publication 339, 260-263. Sneed, Michelle, and Brandt, J.T. 2007. Detection and measurement of land subsidence using global positioning system and interferometric synthetic aperture radar, Coachella Valley, California, 1996–2005, U.S. Geological Survey Scientific Investigations Report 2007–5251, 31 p. Sneed, M., J. Brandt, and M. Solt. 2011. Integration of remotely-sensed and ground-based measurements to constrain simulations of groundwater flow and land subsidence, San Joaquin Valley, California. Abstract H43D-1248. American Geophysical Union, San Francisco, California, 5–9 December 2011 Fall Meeting,
Topic: Groundwater Land Subsidence from Groundwater Use in California
CA Water Plan Update 2013 Vol 4 Reference Guide Page 166

APRIL 2014 REPORT OF FINDINGS Land Subsidence from Groundwater Use in California
LSCE, BORCHERS AND CARPENTER 147
Sneed, M., J. Brandt, M. Solt. 2013. Land subsidence along the Delta-Mendota Canal in the northern part of the San Joaquin Valley, California, 2003-10. US Geological Survey in cooperation with the U.S. Bureau of Reclamation and the San Luis and Delta-Mendota Water Authority, USGS Scientific Investigations Report 2013-5142. http://pubs.usgs.gov/sir/2013/5142/pdf/sir2013-5142.pdf Sneed, M. and D. L. Galloway. 2000. Aquifer-system compaction and land subsidence: measurements, analyses, and simulations―the Holly site, Edwards Air Force Base, Antelope Valley, California. U.S. Geological Survey Water-Resources Investigations Report 00-4015, p. 91-97. http://ca.water.usgs.gov/archive/reports/wrir004015/. Sneed, M., M.E. Ikehara, D.L. Galloway, and F. Amelung. 2001. Detection and measurement of land subsidence using global positioning system and interferometric synthetic aperture radar, Coachella Valley, California, 1996-98. U.S. Geological Survey Water-Resources Investigations Report 01-4193, 31 p. http://pubs.er.usgs.gov/usgspubs/wri/wri014193. Sneed, M., M.E. Ikehara, S.V. Stork, F. Amelung, and D.L. Galloway. 2003a. Detection and measurement of land subsidence using interferometric synthetic aperture radar and global positioning system, San Bernardino County, Mojave Desert, California. U.S. Geological Survey Water-Resources Investigations Report 03-4015, 60 p. http://pubs.er.usgs.gov/usgspubs/wri/wri034015. Sneed, M. and T. Nishikawa. 2005. Land subsidence at Edwards Air Force Base, Antelope Valley, California: A 15-year perspective. In Z. Agen, G. Shiliang, L. Carbognin, and A.I. Johnson, eds., Land Subsidence: Proceedings of the Seventh International Symposium on Land Subsidence, Shanghai, China, October 23-28, 2005, eds. 30-38. Shanghai Scientific & Technical Publishers, vol. 1, p. 30-38. Sneed, M., M.T. Pavelko, and D.L. Galloway. 2000. Modeling residual aquifer-system compaction―constraining the vertical hydraulic diffusivity of thick aquitards. In L. Carbognin, G. Gambolati, and A.I. Johnson, eds., Land subsidence—Proceedings of the Sixth International Symposium on Land Subsidence, Ravenna, Italy, September 24-29, 2000, Padova, Italy, La Garagola, National Research Council of Italy (CNR), v. 2, 343-353. Sneed, M. and S.P. Phillips. 2012. Recently measured rapid land subsidence in Eastern San Joaquin Valley, California. Proceedings from the 2012 National Ground Water Association Summit. Sneed, M., S.V. Stork, and M.E. Ikehara. 2002. Detection and measurement of land subsidence using global positioning system and interferometric synthetic aperture radar, Coachella Valley, California, 1998–2000. U.S. Geological Survey Water-Resources Investigations Report 02–4239, 29 p. http://pubs.er.usgs.gov/usgspubs/wri/wri024239. Sneed, M., S.V. Stork, and R.J. Laczniak. 2003. Aquifer-system characterization using InSAR. In K.R. Prince and D.L. Galloway D.L., eds., U.S. Geological Survey subsidence interest group
Topic: Groundwater Land Subsidence from Groundwater Use in California
CA Water Plan Update 2013 Vol 4 Reference Guide Page 167

APRIL 2014 REPORT OF FINDINGS Land Subsidence from Groundwater Use in California
LSCE, BORCHERS AND CARPENTER 148
conference, proceedings of the technical meeting, Galveston, Texas, November 27-29, 2001. U.S. Geological Survey Open-File Report 03-308, 91-97. http://pubs.usgs.gov/of/2003/ofr03-308/. Sorey, M.L., C.D. Farrar, F.A. Marshall, and L.R. Moore. 1987. Effects of geothermal development of deformation in the Long Valley Cladera, Eastern California, 1982-1986. American Geophysical Union, Journal of Geophysical Research 100,no. B7:12,475-12,486. Stamos, C.L., Martin, Peter, Nishikawa, Tracy, and Cox, B.F. 2001. Simulation of ground-water flow in the Mojave River Basin, California: U.S. Geological Survey Water-Resources Investigations Report 01-4002, 129 p. Stamos, C.L., K.R. McPherson, M. Sneed, and J.T. Brandt. 2007. Water-level and land subsidence studies in the Mojave River and Morongo ground-water basins. U.S. Geological Survey Scientific Investigations Report 2007-5097. http://pubs.er.usgs.gov/usgspubs/sir/sir20075097. (interactive map at: http://ca.water.usgs.gov/mojave/gmaps/mojave.cgi) Stewart, C.A., N.D. Colby, R.T. Kent, J.A. Eagan, and N.T. Hall. 1998. Earth fissuring, ground-water flow, and water quality in the Chino basin, California. In J.W. Borchers, ed., Land Subsidence― Case studies and current research, Proceedings of the Dr. Joseph F. Poland Symposium on Land Subsidence, Association of Engineering Geologists Special Publication 8, 195-205. Stosur, J.J., and A. David. 1976. Petrophysical evaluation of the diatomite formation of the Lost Hills Field, California, Journal of Petroleum Technology, v. 28, October 1976, p. 1138-1144. Swanson, A.A. 1998. Land subsidence in the San Joaquin Valley, updated to 1995. In J.W. Borchers, ed., Land Subsidence― Case studies and current research, Proceedings of the Dr. Joseph F. Poland Symposium on Land Subsidence, Association of Engineering Geologists Special Publication 8, 75–79. Sweetkind, D.S., C.C. Faunt, and R.T. Hanson. 2013. Construction of 3-D geologic framework and textural models for Cuyama Valley groundwater basin, California, U.S. Geological Survey Scientific Investigations Report 2013-5127, 46 p. Talbert, T.B. 1952. My sixty years in California, Huntington Beach News Press.
Terzaghi, K. 1925. Settlement and consolidation of clay. Engineering News Record: 874-878 Testa, S.M. 1991. Elevation changes associated with groundwater withdrawal and reinjection in the Wilmington area, Los Angeles Coastal Plain, California. In A. I. Johnson, ed., Land Subsidence-- Proceedings of the Fourth International Symposium on Land Subsidence, Houston, Texas, May 12-17, 1991, International Association of Hydrological Sciences Publication 200, 485-502.
Topic: Groundwater Land Subsidence from Groundwater Use in California
CA Water Plan Update 2013 Vol 4 Reference Guide Page 168
APRIL 2014 REPORT OF FINDINGS Land Subsidence from Groundwater Use in California
LSCE, BORCHERS AND CARPENTER 149
Thatcher, W. and D. Massonnet. 1997. Crustal deformation at Long Valley caldera, eastern California, 1992–1996 inferred from satellite radar interferometry. Geophysical Research Letters 24, no. 20: 2,519–2,522. Tibbetts, F.H. 1933. Areal subsidence. Engineering News Record 111: 204. Tolman, C. F. and J. F. Poland. 1940. Ground-water, salt-water infiltration, and ground- surface recession in Santa Clara Valley, Santa Clara County, California. Trans American Geophysical Union 1: 23–35. U. S. Army Corps of Engineers. 1988. Lower Santa Ana River Phase II General Design Memorandum No. 1, Volume 3, Appendix H, Geotechnical, variously paginated. U.S. Army Corp of Engineers. 1990. Storm damage reduction for King Harbor at Redondo Beach. General Design Memorandum No. 3. U. S. Army Corps of Engineers. 2002. Sacramento and San Joaquin River Basins comprehensive study interim report, appendix A: information papers, variously paginated. U.S. Bureau of Reclamation. 1974. Central Valley Project : History, general description, and geology, volume 1 of technical record of design and construction. West San Joaquin Division, San Luis Unit, California, 164 p. U. S. Bureau of Reclamation. 2013. Hydraulic evaluation of the effect of subsidence on freeboard capacity in the Chowchilla and Eastside Bypasses, 11p. Utley, J.A. 2004. Using InSAR and GPS to detect subsidence in Pahrump Valley, Southern Nevada and California. M.S. thesis, University of Nevada, Reno, 91 p. Valentine, D.W., J.N. Densmore, D.L. Galloway, and F. Amelung. 2001. Use of InSAR to identify land-surface displacements caused by aquifer-system compaction in the Paso Robles area, San Luis Obispo County, California, March to August 1997. U.S. Geological Survey Open-File Report 00-447. http://pubs.er.usgs.gov/usgspubs/ofr/ofr00447. Van Herk, J., H. Roest, I. Kroon, J. Breunese, and H. De Waal. 2010. How much subsidence is allowed: the introduction of the "effective subsidence capacity" concept in The Netherlands. In D. Carreon-Freyre, M. Cerca, D.Galloway, J.J. Silva-Corona, eds., Land Subsidence: Associated Hazards and the Role of Natural Resources Development, Proceedings of the Eighth International Symposium on Land Subsidence, Querétaro, Mexico, October 17–22, 2010, eds. International Association of Hydrological Sciences Publication 339, 420-425. Van Til, C. J. 1979. Guidelines manual for surface monitoring of geothermal areas, Report prepared by Woodward-Clyde Consultants for University California, Berkeley, Lawrence Berkeley Laboratory, Berkeley, California, LBL-8617, app. A-G, 132 p., http://www.osti.gov/energycitations/servlets/purl/6145768-gL6Oxv/6145768.PDF.
Topic: Groundwater Land Subsidence from Groundwater Use in California
CA Water Plan Update 2013 Vol 4 Reference Guide Page 169

APRIL 2014 REPORT OF FINDINGS Land Subsidence from Groundwater Use in California
LSCE, BORCHERS AND CARPENTER 150
Verruijt, A. 1969. Elastic storage in aquifers. In Flow Through Porous Media, ed. R.J.M. DeWiest, Academic Press, New York: 331-376. Viets, V. F., C. K. Vaughan, and R. C. Harding. 1979. Environmental and economic effects of subsidence: Report prepared by EDAW, Inc. and Earth Sciences Associates for University of California, Berkeley, Lawrence Berkeley Laboratory, Berkeley, California, LBL-8615, app. A-B, 242 p., http://www.osti.gov/bridge/servlets/purl/6113332-7R9bEr/6113332.PDF. Ward, A.W., G.L. Dixon, and R.C. Jachens. 1994. Geologic setting of East Antelope Basin, with emphasis on fissuring on Rogers Lake, Edwards Air Force Base, Mojave Desert, California. In K.R. Prince, D.L. Galloway, and S.A. Leake, S.A., eds., U.S. Geological Survey Subsidence Interest Group Conference, Edwards Air Force Base, Antelope Valley, California, November 18-19, 1992, Abstracts and summary, U.S. Geological Survey Open-File Report 94-532. 35-37. http://pubs.usgs.gov/of/1994/ofr94-532/. Watson K.M., Y., Bock, and D.T. Sandwell. 2002. Satellite interferometric observations of displacements associated with seasonal groundwater in the Los Angeles Basin. Journal of Geophysical Research 107. doi: 10.1029/2001JB000470 Werner C., U. Wegmüller, T. Strozzi, and A. Wisemann. 2003. Interferometric point target analysis for deformation mapping. Proc 2003 IEEE Int. Geoscience Remote Sensing Symp., vol 7, p 4362-4364. Doi: 10.1109/IGARSS.2003.1295516. Weir, W. W. 1950. Subsidence of peat lands of the Sacramento-San Joaquin Delta, California Hilgardia. University of California, Agricultural Experiment Station 20, no. 3: 37–56. Whitten, C. A. 1955. Measurements of earth movements in California, in Oakeshott, G.B., ed., Earthquakes in Kern County, California during 1952: California Department of Natural Resources, Division of Mines Bulletin 717, Part 1, 245 p. Wildermuth Environmental, Inc. 2006. Chino Basin optimum basin management program: Management zone 1 interim monitoring program: MZ1 summary report, prepared for the MZ-1 Technical Committee, February 2006. Wildermuth Environmental. 2007. MZ-1 Subsidence Management Plan, variously paginated. http://ayala.wildermuthenvironmental.com:8888/AyalaPark/documents/20071017_MZ1_Plan.pdf Wildermuth Environmental Inc. 2013. Chino Basin Land Subsidence Committee 2012 Draft Annual Report, variously paginated. Williamson, A.K. and D. E.Prudic. 1986. Simulation of flow and compaction in the regional aquifer system of the Central Valley of California, U.S. A. In A.I. Johnson, L. Carborgnin, and L. Ubertini, eds., Proceedings of the Third International Symposium on Land Subsidence, Venice, Italy, March 19-25, 1984, International Association of Scientific Hydrology Publication 151, 271-280.
Topic: Groundwater Land Subsidence from Groundwater Use in California
CA Water Plan Update 2013 Vol 4 Reference Guide Page 170

APRIL 2014 REPORT OF FINDINGS Land Subsidence from Groundwater Use in California
LSCE, BORCHERS AND CARPENTER 151
Williamson, A. K., D. E.Prudic, and L. A. Swain. 1989. Ground-water flow in the Central Valley, California. U.S. Geological Survey Professional Paper 1401-D, 127 p. http://pubs.er.usgs.gov/usgspubs/pp/pp1401D. Wilson, A.M. and S. Gorelick. 1996. The effects of pulsed pumping on land subsidence in the Santa Clara Valley, California. Journal of Hydrology 174: 375–396. Wilson, W.E. 1968. Casing failures in irrigation wells in an area of land subsidence, California. Geological Society of America Annual Meeting Program, p. 324. Wisely, B.A. and D. Schmidt. 2010. Deciphering vertical deformation and poroelastic parameters in a tectonically active fault-bound aquifer using InSAR and well level data, San Bernardino Basin, California. Geophysical Journal International 181, no. 3: 1185-1200. Publisher Wiley-Blackwell on behalf of The Royal Astronomical Society, the Deutsche Geophysikalische Gesellschaft and the European Geophysical Society International. http://onlinelibrary.wiley.com/doi/10.1111/j.1365-246X.2010.04568.x/abstract Yerkes, R.F. and R.O. Castle. 1970. Surface deformation associated with oil and gas field operations in the United States. In L.J.Tison, eds., Land Subsidence, vol. 1, International Association of Scientific Hydrology Publication 88, 55–66. Xu, H. 2002. Production induced reservoir compaction and surface subsidence with applications to 4D seismic, PhD. Dissertation, Stanford University, 94 p. Xu, H., J. Dvorkin, and A. Nur. 2012. Linking oil production to surface subsidence from satellite radar interferometry, Geophysical Research Letters, v. 28, Issue 7, p. 1307-1310. Yerkes, R.F., and R.O. Castle. 1976. Seismicity and faulting attributable to fluid extraction. Engineering Geology 10, no. 2-4: 151-166. Zhang, A., S. Gong, L. Carbognin, and A. I. Johnson. 2005. Land Subsidence: Proceedings of the 7th International Symposium on Land Subsidence, October 2005, vol. 1-2. Shanghai, PRC, Shanghai Scientific & Technical Publishers, 918 p. Zhang, L. 2009. A Model for Transient Three-Dimensional Underground Deformation in Response to Groundwater Pumpage. Thesis presented to Morgan State University in partial fulfillment of the requirement for the degree of Doctor of Engineering in civil engineering. _____, 2011, Settlement agreement and mutual general release of July 15, 2011, variously paginated. http://www.inglewoodoilfield.com/res/docs/SettlementAgreementDatedJuly152011.pdf, accessed August 23, 2013.
Topic: Groundwater Land Subsidence from Groundwater Use in California
CA Water Plan Update 2013 Vol 4 Reference Guide Page 171

APRIL 2014 REPORT OF FINDINGS Land Subsidence from Groundwater Use in California
LSCE, BORCHERS AND CARPENTER
APPENDIX A
Subsidence Processes in California
Topic: Groundwater Land Subsidence from Groundwater Use in California
CA Water Plan Update 2013 Vol 4 Reference Guide Page 172

APRIL 2014 REPORT OF FINDINGS Land Subsidence from Groundwater Use in California
LSCE, BORCHERS AND CARPENTER A-1
SUBSIDENCE PROCESSES IN CALIFORNIA In California, land subsidence occurs as a result of collapse of underground cavities, tectonic activity, natural consolidation of sediment, oxidation of organic deposits, hydrocompaction of moisture-deficient soil and sediments, development of geothermal energy, extraction of hydrocarbons from the subsurface, and extraction of groundwater. Physical processes causing land subsidence resulting from groundwater extraction, and locations of areas subsiding as a result of groundwater extraction, are described in the main body of this report.
A 1 Collapse of Underground Cavities
Collapse of underground cavities (solution and piping cavities, mines and other engineered openings), can be catastrophic but is rare in California and unusual in areas where groundwater is pumped from unconsolidated sedimentary aquifers. Collapse of shallow underground mines has occasionally disrupted the land surface (Figure A-1), and collapse of voids created by piping of sediment, due to leaking storm sewers or water pipes for example, has created shallow collapse features in urbanized areas. Because the geographic extent of soluble limestone or marble is rather limited in California, sinkholes formed by cavern collapse are rare. However, the School of Earth Sciences building at U.C. Santa Cruz suffered some damage when a sinkhole partly collapsed beneath it, and similar but smaller-scale collapse has affected roads on the campus. Caverns occur in marble of the Sierra Nevada foothills, butinfrastructure damage from sinkholes formed over collapsing caves has not been reported there. Collapse is a threat in areas underlain by lava tubes, in littoral caves and soil pipes along the seacoast, and in mud caves similar to those at Anza-Borrego State Park.
Figure A-1. Collapse into the Old Brunswick Mine, Grass Valley, California (photo courtesy of California Department of Conservation).
Topic: Groundwater Land Subsidence from Groundwater Use in California
CA Water Plan Update 2013 Vol 4 Reference Guide Page 173

APRIL 2014 REPORT OF FINDINGS Land Subsidence from Groundwater Use in California
LSCE, BORCHERS AND CARPENTER A-2
A 2 Tectonic Activity
California is earthquake country. California is earthquake country. Ground shaking during earthquakes can induce liquefaction in subsurface sand layers. Liquefaction induces bearing capacity failure that damages overlying structures. Post liquefaction consolidation of the sand layers can result in wide-spread lowing of land surface due to both the loss of pore space in the sand layers and ‘soil loss’ from sand that escapes to land surface at ‘sand boils’. Earthquakes and the faults on which they occur are caused by the movement of tectonic plates. North of Cape Mendocino, oceanic crust subducts beneath the North American continental plate. South from Cape Mendocino, the Pacific Plate rubs past the North American Plate along the San Andreas Fault (Figure A-2). Motion of the tectonic plates creates other faults and can substantially elevate or depress land surface inland from the coast. Huge tectonically subsided basins have filled with thousands of feet of sediment eroded from adjacent mountains. Sediments filling these basins contain oil, gas, and groundwater (Figure A-3).
Figure A-2. Plate tectonics of western North America (Source: Geology.campus.ad.csulb.edu /people/bperry /Geol303photos/ContinentalBorderland/PlateTectonicsWestNAmericaUSGS.jpg).
Topic: Groundwater Land Subsidence from Groundwater Use in California
CA Water Plan Update 2013 Vol 4 Reference Guide Page 174

APRIL 2014 REPORT OF FINDINGS Land Subsidence from Groundwater Use in California
LSCE, BORCHERS AND CARPENTER A-3
Figure A-3. Alluvial aquifers, major areas of subsidence due to water level decline, oil and gas fields, locations of geothermal development, areas of hydrocompaction in the San Joaquin Valley, and the towns of Murietta, Hermosa Beach, and Fountain Valley in Orange County, California.
Topic: Groundwater Land Subsidence from Groundwater Use in California
CA Water Plan Update 2013 Vol 4 Reference Guide Page 175
APRIL 2014 REPORT OF FINDINGS Land Subsidence from Groundwater Use in California
LSCE, BORCHERS AND CARPENTER A-4
Vertical movement in response to tectonic forces can be slow and continuous or episodic on geologic time scales. For example, Bowersox (2004) calculated that, during the last 5.5 million years, the rate of tectonic subsidence in the northwestern San Joaquin Valley has varied considerably in response to changing tectonic forces, from about 10 cm (4 in) per thousand years to more than 140 cm (55 in) per thousand years. Tectonic downwarping of the southern San Joaquin Valley averaged about 0.3 m (1 ft) per thousand years during the last 600,000 years, while the rate of sediment deposition in the trough of the valley varied from 0.46 to 1.2 m (1.5 to 4 ft) per thousand years (Lofgren, 1975). At shorter time scales, tectonic uplift of survey control points in the mountains flanking the San Joaquin Valley likely was responsible for about 0.3 m (1 ft) of apparent subsidence at stable bench marks in the southern San Joaquin Valley between 1930 and the mid-1960s (Lofgren, 1975) and for the nearly uniform 0.15 m (0.5 ft) apparent subsidence indicated by surveying a 7.2 km (4.5 mi) transect through the town of Lost Hills, in the southern San Joaquin Valley, during 1953-1966 (Ireland et al., 1980). The rate of apparent subsidence that is caused by tectonic uplift of reference bench marks assumed to be stable is variable depending on location but averages about 20 times the rate of tectonic downwarping of the valley floor (Lofgren, 1975). Because tectonic forces influence all of California, it is important to consider their effect on land surface elevation in both subsiding areas and areas used for reference elevations when evaluating subsidence resulting from groundwater extraction.
A 3 Natural Consolidation of Sediment
Sediments buried deeply in basins compress, expel water, and consolidate, thinning in the vertical dimension and causing overlying materials and the land surface to move downward. This can be thought of as 'natural' subsidence from sediment consolidation occurring slowly over long periods of time. Rates of natural sediment consolidation are generally low compared to other local and regional processes that contribute to total subsidence in an area. Brooks and others (2012) noted small amounts of subsidence that likely were caused by natural consolidation of sediment beneath the inland Delta of the Sacramento-San Joaquin Rivers, but this subsidence is insubstantial compared to that caused by oxidation of peaty soils in the Delta.
A 4 Oxidation of Organic Deposits (Peaty Soils)
Draining water from peat deposits in marshes allows oxygen to reach richly organic soil layers, promoting the growth of aerobic bacteria, which increase the rate of decomposition of organic material by as much as 100 times relative to the anaerobic rates of decomposition that occur under natural, undrained conditions. Inasmuch as organic carbon is aerobically converted to carbon dioxide, peaty soil disappears and the land surface lowers (Broadbent, 1960).
Topic: Groundwater Land Subsidence from Groundwater Use in California
CA Water Plan Update 2013 Vol 4 Reference Guide Page 176

APRIL 2014 REPORT OF FINDINGS Land Subsidence from Groundwater Use in California
LSCE, BORCHERS AND CARPENTER A-5
Land subsidence resulting from oxidation of organic soils is a serious issue in California. Large areas of the inland Delta of the Sacramento-San Joaquin Rivers in California have lowered by more than 4.6 m (15 ft), and as much as 6.4 m (21 ft) on some islands in the central Delta (Figure A-4) in response to peat oxidation on Delta islands and tracts after these areas were leveed and shallow groundwater was drained for agricultural development (Deverel et al., 1998). Subsidence of Delta islands adds stress to island levees (Figure A-5), which, should they fail, imperils water supplies for millions of Southern Californians and Central Valley farms that rely on the levees to shunt water through the Delta to intake pumps for the California Aqueduct and Delta Mendota Canal (DMC). If Delta levees failed catastrophically, for example during a coincident earthquake and storm or high tide, or in response to rising sea levels resulting from global warming, salty water from downstream bays would flood into the Delta, denying fresh water to California Aqueduct and DMC intakes (Mount and Twiss, 2004). Repairs that might take years would require over pumping of groundwater in the San Joaquin Valley and elsewhere to satisfy water demand south of the Delta. Ironically then, shallow subsidence in the Delta would be indirectly responsible for a huge increase in land subsidence south of the Delta as aquifer sediments compact in response to groundwater levels lowered by over pumping. (Galloway et al., 1999)
Topic: Groundwater Land Subsidence from Groundwater Use in California
CA Water Plan Update 2013 Vol 4 Reference Guide Page 177

APRIL 2014 REPORT OF FINDINGS Land Subsidence from Groundwater Use in California
LSCE, BORCHERS AND CARPENTER A-6
Figure A-4. Shaded contours of subsidence in the Sacramento-San Joaquin Delta and the Delta pumping plant (from Ingebritsen et al., 2000).
Topic: Groundwater Land Subsidence from Groundwater Use in California
CA Water Plan Update 2013 Vol 4 Reference Guide Page 178

APRIL 2014 REPORT OF FINDINGS Land Subsidence from Groundwater Use in California
LSCE, BORCHERS AND CARPENTER A-7
Figure A-5. Wind-whipped waves spilling over the levees on the north side of Jersey Island in the Sacramento-San Joaquin Delta December 3, 1983 (photo by Kenneth L. Kjeldsen). Oxidation of peaty deposits in drained marshlands has also resulted in land subsidence elsewhere in California. Fairchild and Weibe (1977) describe subsidence due to decomposition of peat that filled old stream channels and land-surface depressions from about 1.6 km (1 mi) inland from the coast at Hermosa Beach discontinuously westward at least as far south as Fountain Valley in Orange County (Figure A-3). There, fresh-water marshes supplied by upwelling groundwater produced peat deposits as much as 7.6 m (25 ft) thick. Upwelling groundwater discharged from what became locally know as “peat springs.” Subsurface tile drains installed during the late 1800s and early 1900s, and later water-supply development, lowered groundwater levels by more than 13.7 m (45 ft), drying up the springs and causing as much as 6 m (20 ft) of land subsidence locally by 1976. Localized subsidence possibly due to peat decomposition has also been reported in scattered areas inland from the coast between Sunset and Newport Beaches in Orange County, California (U. S. Army Corps of Engineers, 1988, citing Leighton-Yeh and Associates, 1974).
A 5 Hydrocompaction
Hydrocompaction is compaction caused by wetting of near-surface, moisture-deficient sediments. It occurs in alluvial-fan deposits that lie above the highest prehistoric water table in areas where sparse rainfall and ephemeral runoff do not penetrate the soil below the root zone. These sediments are deposited as muddy debris flows in areas of very low average rainfall and infrequent, flashy, sediment-laden runoff from small, relatively steep upland watersheds that are underlain by easily erodible shale and mudstone. The resulting deposits typically contain a substantial amount of montmorillonite clay that, when dry, acts as a cementing agent providing substantial dry strength to the deposits and preserving a highly porous structure of vesicles
Topic: Groundwater Land Subsidence from Groundwater Use in California
CA Water Plan Update 2013 Vol 4 Reference Guide Page 179

APRIL 2014 REPORT OF FINDINGS Land Subsidence from Groundwater Use in California
LSCE, BORCHERS AND CARPENTER A-8
(bubble cavities) and desiccation cracks. Where the water table is deep, in the western and southern San Joaquin Valley, these sun-baked deposits retain their high dry strength, even as they are subjected to the increasing load of more than 30 m (100 ft) of accumulating overburden. When water is first applied in quantities sufficient to penetrate below the root zone, cementing clays are drastically weakened by wetting, and the weight of the overburden crushes out the excess porosity (Galloway et al., 1999). The deposits may lose as much as ten percent of their thickness depending on their depth and the overburden load. If the deposits are thoroughly wetted, compaction is rapid, proceeding with the downward movement of infiltrating water. In the 1940s and 1950s, farmers irrigating virgin soils in the western San Joaquin Valley (Figure A-3) found that hydrocompaction caused an irregular, hummocky settling of their fields and localized settlements of as much as 3 m (10 ft) where water ponded or flowed in canals. Hydrocompaction disrupted the distribution of irrigation water and damaged pipelines, power lines, roadways, airfields, and buildings. Recognition of its obvious impact on the design and construction of the proposed California Aqueduct played a major role in the initiation in 1956 of intensive studies to identify, characterize, and quantify the subsidence processes at work beneath the surface of the San Joaquin Valley (Figures A-6, A-7, and A-8) (Lofgren, 1960; Bull, 1964, 1973, 1998; Lucas and James, 1977; James et al., 1997; Bean, 1998; Galloway et al., 1999)
Figure A-6. Concentric tension fissures and differential subsidence resulting from hydrocompaction at a 6-ft diameter corrugated infiltration test pit on the proposed alignment of the California Aqueduct, December 12, 1960.
Topic: Groundwater Land Subsidence from Groundwater Use in California
CA Water Plan Update 2013 Vol 4 Reference Guide Page 180

APRIL 2014 REPORT OF FINDINGS Land Subsidence from Groundwater Use in California
LSCE, BORCHERS AND CARPENTER A-9
Figure A-7. Flooding basin in Kern County, California, used to “presubside” sediments subject to hydrocompaction along the proposed route of the California Aqueduct. Note the step-wise, differential subsidence between tension-fissured scarps on the basin dikes. To prevent deleterious effects of hydrocompaction, large sections of the alignment of the Aqueduct were precompacted in this manner prior to construction (photograph by Joseph F. Poland, October 13, 1965).
Figure A-8. Hydrocompaction damage to a canal test section in the west–central San Joaquin Valley. The earthfill embankment cracked and settled, the concrete lining and earthfill embankment separated, and the 4-in thick concrete lining cracked and buckled after the test section was flooded. (Photograph from Prokopovich, 1983). Precompacting the alignment of the California Aqueduct by flooding helped to prevent similar damage.
Topic: Groundwater Land Subsidence from Groundwater Use in California
CA Water Plan Update 2013 Vol 4 Reference Guide Page 181

APRIL 2014 REPORT OF FINDINGS Land Subsidence from Groundwater Use in California
LSCE, BORCHERS AND CARPENTER A-10
Differential subsidence and earth fissuring in response to irrigation at California Oaks, a new development in Murrieta (Figure A-3), in urbanizing Riverside County also was due to hydrocompaction of moisture-deficient soils. Groundwater levels rising in response to golf course and landscape irrigation triggered hydrocompaction of Holocene alluvium that had been left in place during grading. Residences and infrastructure that were in various stages of construction sustained damage from earth fissures that disrupted the land surface. Subsequent litigation and damage claims led Riverside County to establish the California Oaks Subsidence Reporting Zone that required geotechnical studies and removal of sediments susceptible to hydrocompaction before construction (Shlemon, 1995; Shelmon et al., 1998; Kupferman, 1998).
A 6 Geothermal Energy Development
Development of geothermal resources to produce electric power causes subsidence by two primary mechanisms. Firstly, removing hot water and steam from subsurface formations reduces the pressure in fractures, pore space, and other voids in the hot bedrock. The pressure drop causes a loss of void space as mineral grains and fractures squeeze more tightly together to support the weight of overlying material. Secondly, removing hot fluids and steam or injecting cold fluids to create steam for power production causes a thermal contraction of the hot bedrock that is expressed as subsidence at the land surface. Some geothermal development occurs in areas underlain by unconsolidated aquifers (Figure A-3). Geothermal energy producers operate subsidence monitoring networks in the Imperial Valley.
A 7 Extraction of Hydrocarbons from the Subsurface
Gas and oil wells produce hydrocarbons and saline formation water from sedimentary rocks and deposits deep in the subsurface (Figure A-3). Because aquifers that provide groundwater for water supply purposes and environmental needs often overlie hydrocarbon reservoirs, distinguishing subsidence resulting from hydrocarbon extraction from that resulting from pumping groundwater can be difficult. Similar to removing groundwater from an aquifer, removing hydrocarbons and associated formation water reduces the fluid pressure, causing mineral grains to squeeze more tightly together. The resulting compaction allows overlying deposits and the land surface to subside, often forming a bowl-shaped depression in the land surface. Land subsidence occurs directly above and in some cases beyond the lateral boundaries of many oil and gas fields (Yerkes and Castle, 1969). Subsidence is greatest where hydrocarbon reservoir deposits are thick, relatively shallow, and poorly consolidated (Martin and Serdengecti, 1984). However, if deposits overlying oil and gas reservoirs are consolidated rocks, they may resist settling and partly bridge compacting hydrocarbon-bearing deposits, in which case subsidence at the land surface may be less than the change in thickness of the oil and gas reservoir (Nagel, 2001). Subsidence at two
Topic: Groundwater Land Subsidence from Groundwater Use in California
CA Water Plan Update 2013 Vol 4 Reference Guide Page 182

APRIL 2014 REPORT OF FINDINGS Land Subsidence from Groundwater Use in California
LSCE, BORCHERS AND CARPENTER A-11
gas fields, River Island and Rio Vista, is indicated on Table A-1 (at end of Appendix), but Yerkes and Castle (1970) do not identify the specific source of the measurements. Gas fields, located north of Fresno, (Figure A-3) mostly produce gas from consolidated sandstone. Production of gas reportedly has not caused significant land subsidence issues at most locations; the single reported incident of subsidence, when a plow struck a buried gas well casing, was reportedly due to subsidence caused by oxidation of peaty soils on a Delta island rather than gas withdrawal (B. G. Tackett, California Division of Oil Gas and Geothermal Resources, oral commun., September 17, 2013). Fluid pressure decline within a producing hydrocarbon reservoir can be substantial—increasing the force on mineral grain contacts (the effective stress) by thousands of pounds per square inch (psi) in some cases. Laboratory tests on sandy hydrocarbon reservoir rocks have shown that increasing the effective stress between 1,000 and 20,000 psi, which includes the range of effective stress increases in many oil fields, fractures and crushes sand grains. Crushing and subsequent rearrangement of broken grains leads to a dense packing of compacted mineral fragments. Depressured reservoir sands can be as compressible as or more compressible than clays (Roberts, 1969). Allen and Mayuga (1969) showed that about two thirds of the compaction in the Wilmington oil field in Long Beach occurred in sands and only about one third occurred in clayey shale layers. Some of the most productive oil and gas fields in California produce hydrocarbons from clayey diatomaceous deposits (diatomites) that have 50-70 percent porosity, that is, more than half of volume of the deposit is void space filled with oil, gas, or water. Diatoms are microscopic algae, single-celled or colonial, and encased by silica frustules—fragile hollow shells that accumulate in thick sedimentary layers in marine and some fresh-water environments. When oil production reduces reservoir pressure, effective stress increases and hydrocarbon-bearing diatomites compact substantially because of their high porosity and because delicate diatom frustules are crushed (Stosur and David, 1976; Bruno and Boverg, 1992; De Rouffignac and Bondor, 1995). Laboratory testing indicates diatomites compact inelastically at nearly all stress levels; compaction is permanent regardless of future reductions in effective stress (Bruno and Boverg, 1992). Compaction of hydrocarbon reservoir sediments provides substantial energy that forces hydrocarbons toward producing wells, increasing production and ultimate recovery of petroleum from an oil field (Nagel, 2001). Unfortunately, substantial thinning of a compacting hydrocarbon reservoir often produces consequent and sometimes rapid subsidence of the land surface. At some oil and gas fields in California subsidence to date has been minimal (Table A-1). At other fields, production of hydrocarbons from oil and gas wells has resulted in substantial land subsidence and lateral movement of earth materials toward the center of a bowl-shaped
Topic: Groundwater Land Subsidence from Groundwater Use in California
CA Water Plan Update 2013 Vol 4 Reference Guide Page 183

APRIL 2014 REPORT OF FINDINGS Land Subsidence from Groundwater Use in California
LSCE, BORCHERS AND CARPENTER A-12
depression in the land surface, creating 1) vertical downward compressional forces and in some cases tensional forces, 2) lateral tensional forces and subsequent earth fissures near the edges of a subsidence bowl, 3) lateral compressional forces near the bowl interior, 4) lateral subsurface shearing forces in weak clayey layers and at contacts between sediments of different lithology, 5) small earthquakes, 6) new faults, and 7) movement on existing faults (Frame, 1952; Yerkes and Castle, 1969; Allen and Mayuga, 1969; Bruno and Boverg, 1992; Hilbert et al., 1998). Oil and gas field operation has resulted in damage to near surface infrastructure—bridge and building foundations, dams, roads, railroads, and pipelines—and has increased flooding, inundating coastal areas. Oil and gas extraction has also damaged or destroyed subsurface infrastructure by vertically compressing, and in some cases stretching and laterally shearing, steel casing in hydrocarbon producing wells hundreds to thousands of meters below land surface (Bruno and Boverg, 1992; Bondor and De Rouffignac, 1995; Hilbert et al., 1998; Nagel, 2001). Most oil produced in California is from fields in four structural basins: the Los Angeles, Ventura, Santa Maria, and San Joaquin basins. Deformations at 27 California oil and gas fields are listed in Table A-1. The most thoroughly documented deformations are described for illustrative purposes below – at a coastal and an upland field in the Los Angeles basin and at two fields in the San Joaquin Valley (Figure A-9).
Topic: Groundwater Land Subsidence from Groundwater Use in California
CA Water Plan Update 2013 Vol 4 Reference Guide Page 184

APRIL 2014 REPORT OF FINDINGS Land Subsidence from Groundwater Use in California
LSCE, BORCHERS AND CARPENTER A-13
Figure A-9. Map of oil and gas fields in the Los Angeles basin and southern San Joaquin Valley.
A 7.1 Los Angeles Basin
Wilmington Oil Field, Long Beach, California
The Wilmington field is the fourth largest oil field in the United States and the second largest in California, having produced 2.7 billion barrels (429 million m3) of oil since it was discovered in 1932 (California Department of Conservation, 2010). More than 100 reports, articles, and legal briefs have described the geology, oil-production history, the nearly 10 m (33 ft) of subsidence
Topic: Groundwater Land Subsidence from Groundwater Use in California
CA Water Plan Update 2013 Vol 4 Reference Guide Page 185

APRIL 2014 REPORT OF FINDINGS Land Subsidence from Groundwater Use in California
LSCE, BORCHERS AND CARPENTER A-14
(Figure A-10) (Hilbert et al., 1998) and subsequent litigation that occurred since oil production began in 1936. Oil and gas are produced from seven sand or silty sand zones between 762-1,829 m (2,500 and 6,000 ft) below land surface in the Long Beach Harbor area (Poland and Davis, 1969). Subsidence noted in the early 1940s was first thought to have resulted from dewatering of a shallow aquifer to allow a 65-ft-deep excavation for construction of a dry dock at the Long Beach Naval Shipyard located on Terminal Island adjacent to the City of Long Beach. It was assumed that subsidence would stop when construction activities ceased (Mayuga and Allen, 1969). However, by January 1945 pressure in the upper four oil-producing zones had dropped by 1100 psi (Gilluly and Grant, 1949; Harris and Harlow, 1947) and leveling by the U.S. Coast and Geodetic Survey in July 1945 indicated subsidence of 1.3 m(4.2 ft) on Terminal Island. Leveling surveys conducted every three months in a network of 300 bench marks installed by the Long Beach Harbor Department tracked subsidence, which reached a maximum rate of 0.7 m/yr (2.37 ft/yr) in 1951, the same year that oil withdrawal from the Wilmington Field reached its maximum rate of 140,000 barrels per day (Poland and Davis, 1969). In the late 1950s effective stress in oil-producing sands 610-1,220 m (2,000 - 4,000 ft) deep had increased to 1,500-3,000 psi, fracturing and compacting sand grains there. Quantitative measurements of subsidence, oil production volume, and producing zone pressure established a causative relation between subsidence and oil production (Poland and Davis, 1969; Miller and Summerton, 1955).
By 1968, a subsidence bowl 8.8 m (29 ft) deep had formed over the Wilmington Oil Field (Mayuga and Allen, 1969). Sea water backed up through the storm drain system and, at high tide, flooded streets in the 8 km2 (5 my2) of the industrial area around the harbor that had sunk below sea level. Damage to infrastructure was extensive. Building foundations, bridges, roads, railroads, and pipelines were damaged or destroyed. Horizontal shearing forces that developed in deep, weak shale layers in the subsidence bowl triggered three earthquakes that damaged 515 oil wells at a cost of $21,250,000 (Frame, 1952, 1952 dollars assumed, $186 million 2013 dollars). Huge dikes and retaining walls were built to protect industrial property and oil wells. Bulkheads (flood walls) were constructed on harbor docks to keep out the sea. Eventually, large parts of the harbor industrial area were raised with fill materials, requiring replacement of pipelines and raising of oil well casings, roads, buildings and other infrastructure. The cost of remedial activities had exceeded $100,000,000 by 1962 (Poland, 1962, 1962 dollars assumed, $880 million 2013 dollars). These remedial activities did nothing to reduce subsidence or eliminate its cause.
The Anti-Subsidence Act of 1958 consolidated 117 oil producers in the Wilmington Oil Field to a single entity and compelled it to undertake repressurization of the field (Kopper and Finlayson, 1981). A pilot repressurization program injecting shallow, salty, groundwater into oil-producing zones to halt subsidence began in 1953 (Poland and Davis, 1969). By 1969, subsidence was halted over much of the oil field and some areas had rebounded about 0.3 m (1 ft).
Topic: Groundwater Land Subsidence from Groundwater Use in California
CA Water Plan Update 2013 Vol 4 Reference Guide Page 186

APRIL 2014 REPORT OF FINDINGS Land Subsidence from Groundwater Use in California
LSCE, BORCHERS AND CARPENTER A-15
Figure A-10. Subsidence over the Wilmington Oil Field, Long Beach, California during 1928-1974, in feet (photo courtesy of John Jepson, Long Beach Gas and Oil, City of Long Beach, California).
The City of Long Beach implemented a surveillance program to monitor land subsidence over the Wilmington oil field. They measure the elevation of 900 bench marks in the affected areas on a quarterly basis and periodically conduct subsurface pressure surveys in selected oil wells. Tide gages have been installed as a means of detecting subsidence, and several strategically located wells are surveyed throughout their depth annually to detect changes in the length of casing sections which would indicate the depth and amount of subsurface compaction (Mayuga and Allen, 1969).
Currently, the operator of the southern part of the Wilmington Oil Field (the part closest to the coast) is required to maintain water injection equivalent to 105 percent of oil produced from the field in order to prevent subsidence (Nagel, 2001). Between 1993 and 1996, subsidence of 0.7 m (2.4 ft) in the western parts of the Wilmington Oil Field was reportedly caused by steam flooding—a recovery technique that improves extraction of heavy oil (E & B Natural Resources, 2012, citing Mike Henry, personal communication, undated). In 1999, steam flooding was curtailed, and land surface elevation stabilized by 2006. The repressurization program enacted to prevent subsidence also enhanced the recovery of oil from the Wilmington Field.
Topic: Groundwater Land Subsidence from Groundwater Use in California
CA Water Plan Update 2013 Vol 4 Reference Guide Page 187

APRIL 2014 REPORT OF FINDINGS Land Subsidence from Groundwater Use in California
LSCE, BORCHERS AND CARPENTER A-16
Deformation of the land surface (subsidence or rebound) in response to oil and gas field operations has been noted or suggested in other coastal southern California oil and gas fields- Torrance (U.S. Army Corps of Engineers, 1990), Huntington Beach, Long Beach (Gilluly and Grant, 1949), and Venice Beach-Playa del Rey (Grant, 1944) (Table A-1). Subsidence in coastal areas is sometimes more obvious than subsidence elsewhere because inundation and flooding are immediately noticeable.
Inglewood Oil Field
Baldwin Hills, California
On the afternoon of December 14, 1963, issues of ground deformation above oil and gas fields came sharply into focus for residents downslope from the Baldwin Hills Reservoir, Los Angeles. Three hours after seepage was noticed at its east abutment, the reservoir dam breached, emptying 250 million gallons of water downhill into the adjacent neighborhood. The flood killed five people and destroyed 277 homes, resulting in $12 million ($69 million in 2013 dollars) in property damage (Hamilton and Meehan, 1971). The cause of the disaster was controversial and variously attributed to tectonic movements, movement on existing faults induced by the weight of water filling the reservoir, redistribution of weight during cut-and-fill construction activities, improper compaction of the emplaced clay layer lining the reservoir, inappropriately permeable reservoir-lining materials, land subsidence from extraction of oil, movement on existing faults or on new fissures lubricated by water injected to enhance recovery of oil, or a combination of these causes.
The Baldwin Hills Reservoir was constructed above the Inglewood oil field (Figure A-9) during 1947-1951 on an active fault subsidiary to the Inglewood fault. During construction, 7.9 m (26 ft) of previous vertical offset were noted on this 'reservoir fault' (Hamilton and Meehan, 1971). Between 1910 and 1964, an elliptical depression developed over the oil field with more than 3 m (10 ft) of subsidence at its center, 1,500 feet west of the reservoir, and about 0.6 m (2 ft) of subsidence at the reservoir (Hamilton and Meehan, 1971, citing unpublished data from Leps and Walley, 1971). Although DWR (1964) attributed the dam failure to an “unfortunate combination of physical factors,” a State Engineering Board of Inquiry (Jansen et al., 1967) concluded that ground ruptures that triggered the failure likely were related to land subsidence. Hamilton and Meehan (1971) concluded that the “earth-crack ground rupturing of the Baldwin Hills” that triggered reservoir failure was genetically related to high-pressure injection of fluid for disposal of salty oil field waters and enhanced recovery of oil into the previously faulted and subsidence-stressed subsurface. After exhaustive study of earth movements at Baldwin Hills, Castle and Yerkes (1976) concluded that differential subsidence and associated horizontal movements were due to exploitation of the Baldwin Hills oil field; other failure mechanisms were judged implausible.
Topic: Groundwater Land Subsidence from Groundwater Use in California
CA Water Plan Update 2013 Vol 4 Reference Guide Page 188

APRIL 2014 REPORT OF FINDINGS Land Subsidence from Groundwater Use in California
LSCE, BORCHERS AND CARPENTER A-17
Controversy about continued oil and gas development and the causes of recent (2012) ground deformation above the Inglewood oil field south of the reservoir site continues today, 50 years after failure of the Baldwin Hills Reservoir. A 2011 settlement agreement between litigating parties defined the conditions under which the field may continue to be developed (http://www.inglewoodoilfield.com/res/docs/SettlementAgreementDatedJuly152011.pdf).
Subsidence and other ground deformation above oil and gas fields in the Los Angeles basin generally is of smaller magnitude then at the Wilmington and Baldwin Hills fields. Ground deformation at areas more remote than the Los Angeles basin often are not as well documented as deformation at the Wilmington and Baldwin Hills oil fields, where the effects on urban infrastructure were widely noted.
A 7.2 San Joaquin Valley
The southern San Joaquin Valley is a major oil-producing region (north from Fresno, California hydrocarbon fields produce mostly gas) (Figure A-9). In 1858, asphalt deposits that were noticed on the land surface near the future Sunset oil field hinted at the availability of hydrocarbon deposits in the subsurface of the southwestern valley. By 1993, Kern County alone had 16 oil fields that each had produced more than 100 million barrels of oil (http://www.sjvgeology.org/history/sjv_chronology.html). Oil fields are still being discovered; in 2009, Occidental Petroleum Corporation discovered a major new field, estimated to hold about 150 million barrels of oil, between the Elk Hills and Railroad Gap fields. Oil fields lie beneath the rolling foothills of the Sierra Nevada on the east side of the valley, beneath the low domed ridges on west side of the valley, and beneath farms and ranches on the flat valley floor. Subsidence due to oil production in the San Joaquin Valley is rarely mentioned in the hydrologic literature, although subsidence there occasionally has been described in petroleum industry literature, mostly because damage to oil wells and pipelines has focused attention on monitoring activities designed to help oil producers avoid damage to infrastructure.
South Belridge
Discovered in 1911, the fourth largest oil field in California had 6,125 active wells and had produced more than 1.56 billion barrels (248 million m3) of oil by 2009 (California Department of Conservation, 2010) from sands and highly compressible diatomaceous sediments (Bondor and De Rouffignac, 1995). Ground deformation at the field accelerated during the mid-1980s due to aggressive production practices that contributed to about 6.1 m (20 ft) of subsidence (about 0.46 m/yr (1.5 ft/yr), Bondor and De Rouffignac, 1995) at the center of the large subsidence bowl over the field. During four years in the mid-1980s, 15 to 20 percent of the oil wells were destroyed per year (Nagel, 2001) by compressive and shearing forces that developed in the subsurface in response to compaction of oil-bearing sediments. Large surface fissures formed in
Topic: Groundwater Land Subsidence from Groundwater Use in California
CA Water Plan Update 2013 Vol 4 Reference Guide Page 189

APRIL 2014 REPORT OF FINDINGS Land Subsidence from Groundwater Use in California
LSCE, BORCHERS AND CARPENTER A-18
response to tensional forces that developed near the edges of the subsidence bowl (Bondor and De Rouffignac, 1995). Subsidence rates decreased in 1987 when water-injection operations, designed to increase oil recovery, slowed the rate of pressure declines in oil producing sediments. However, subsidence was not completely halted. During spring 1995, Fielding and others (1998) measured subsidence of about 1 mm/ day, equivalent to an annual rate of more than 1 ft/yr. Substantial subsidence has also occurred over the contiguous North Belridge field (Figure A-9; Table A-1).
Lost Hills
Land subsidence has been costly for oil companies operating in the Lost Hills field (Figure A-9), where oil and gas has been produced from five geologic units from 91 m (300 ft) to more than 1,829 m (6,000 ft) below land surface in an elongated anticline. This arched dome of otherwise horizontally layered bedrock runs parallel to and about a mile west of the California Aqueduct. Discovered in 1910 by ranchers drilling for water for their livestock, the field had 2,819 producing oil wells as of 2009. Land subsidence was on the order of tenths of inches per year until 1980. Rapid field development in the mid-1980s through 1992 increased the rate of subsidence to about 0.3 m (1 ft/yr). Geophysical logging indicated that the oil-producing diatomite interval compacted about 0.6 m (2 ft) from 1990 to 1991 (Bruno and Boverg, 1992). Fielding and others (1998) measured subsidence occurring at an annual rate of more than 0.4 m (1.3 ft/yr) during May 26, 1995 to January 26, 1996 (Table A-1). Subsidence has destroyed substantial numbers of oil wells and shallow pipelines in the large subsidence bowl over the field. Enhanced recovery operations employing injected water (water flooding), steam injection, and in-situ combustion (fire flooding) may have contributed to localized subsidence at the field. During steam stimulation on April 23, 1976, an oil well, pump and concrete pad disappeared into a crater 4.6 m (15 ft) deep and 9.1 m (30 ft) wide. The concrete pad and pump were recovered after excavating 13.7 m (45 ft) below land surface but no trace of the 7-in casing, 5 1/2-in casing liner, or well-head piping were found, even though the excavation was deepened to 24.4 m (80 ft). Similarly, in 1978, a well undergoing steam stimulation collapsed into a crater 6.1 m (20 ft) deep. The pump was recovered from a depth of 7.6 m (25 ft), but excavation to 15.2 m (50 ft) failed to find the casing and well-head piping (Land, 1984). Despite damage to infrastructure costing an average of one million dollars annually, the value of oil produced at the field, one million dollars per day, justifies the considerable maintenance expense (Blom et al., 2006).
Other Areas in the San Joaquin Valley
Most readily available subsidence information at oil and gas fields is from fields west and upslope from flat-lying agricultural areas in the southern San Joaquin Valley. Investigations of subsidence at oil and gas fields are primarily conducted within field boundaries by oil companies
Topic: Groundwater Land Subsidence from Groundwater Use in California
CA Water Plan Update 2013 Vol 4 Reference Guide Page 190

APRIL 2014 REPORT OF FINDINGS Land Subsidence from Groundwater Use in California
LSCE, BORCHERS AND CARPENTER A-19
or their contractors focused on optimizing operations to minimize subsidence damage to oil and gas wells and pipelines. A study by the NASA Jet Propulsion Laboratory (JPL) used topographic data acquired from the 2000 Shuttle Radar Topography Mission (SRTM) and a digital elevation model published by the USGS in 1989 to produce an animation describing subsidence near the Lost Hills and Belridge fields (Crippen, 2012). The animation indicates that the oil fields subsided about 3 m (9.8 ft) during 1982-1990 and that flat-lying agricultural areas adjacent to the oil fields (including the California Aqueduct) also subsided. The JPL topographic comparison was not designed to evaluate subsidence that might have been caused by groundwater extraction in flat-lying agricultural areas. Ireland and others (1984) concluded that subsidence of the California Aqueduct east of the Lost Hills field was at least partly due to compaction of shallow oil zones at the Lost Hills field. However, subsidence extends more than 9.3 km (15 mi) south of the oil field, and the subsidence rate increases in dry periods and decreases in wet periods, indicating a relation that might be correlated with groundwater pumping (Swanson, 1998). Groundwater levels are not monitored in the area, and no extensometers are located there; both types of data would be needed to determine the cause of subsidence exterior to the oil field. Lofgren (1975) evaluated land subsidence caused by groundwater extraction in areas underlain by oil and gas fields in the Arvin-Maricopa area of the southern San Joaquin Valley. Comparing the elevation changes at surveying monuments (bench marks) directly overlying the oil and gas fields to elevation changes noted in adjacent agricultural areas, he suggested that only the component of subsidence in the oil fields that exceeded subsidence in adjacent agricultural areas was caused by oil and gas extraction. He concluded that subsidence in oil fields was of little concern compared to subsidence related to groundwater extraction, although he admitted that only a small part of the oil production and, therefore, the consequent subsidence from oil production occurred during the period of available leveling measurements. Subsidence caused by groundwater extraction has reportedly damaged the steel casings of oil and gas wells located near the San Joaquin River west of Fresno, California (Glenn Muggelberg, California Division of Oil, Gas, and Geothermal Resources, Oral Communication, September 17, 2013). Measuring compaction in appropriate subsurface intervals is the only way to discriminate which compacting process has contributed to subsidence measured at the land surface.
Topic: Groundwater Land Subsidence from Groundwater Use in California
CA Water Plan Update 2013 Vol 4 Reference Guide Page 191
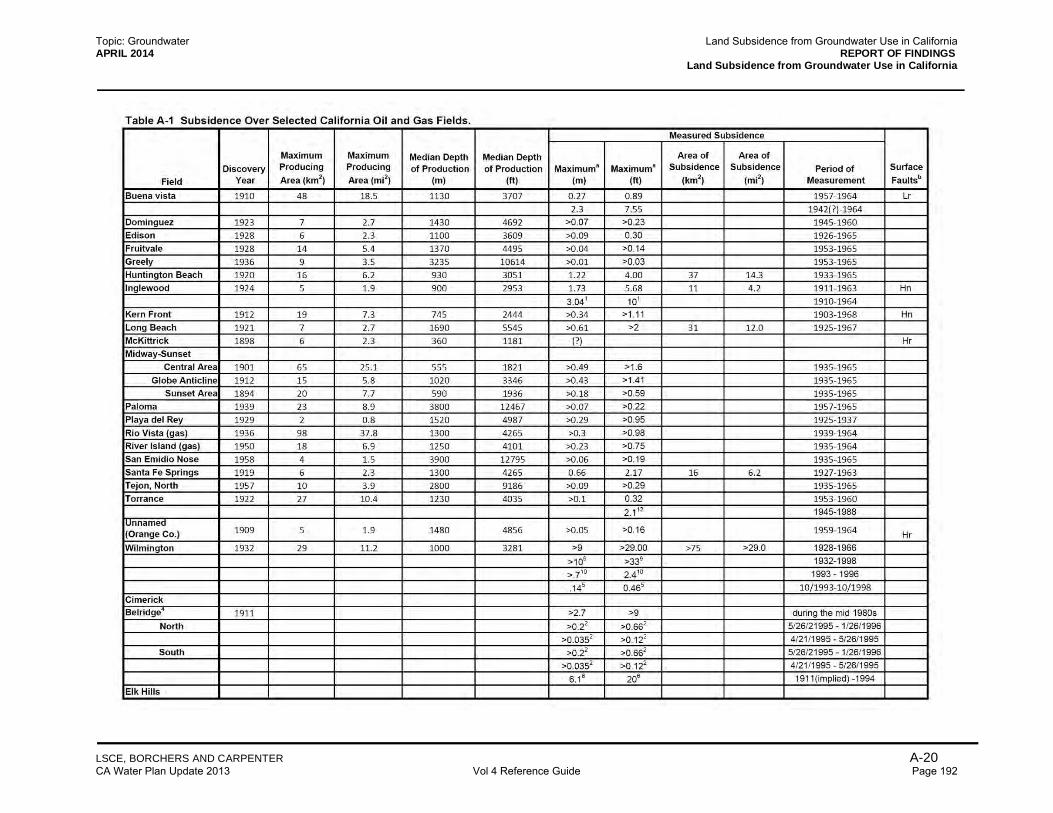
APRIL 2014 REPORT OF FINDINGS Land Subsidence from Groundwater Use in California
LSCE, BORCHERS AND CARPENTER A-20
Topic: Groundwater Land Subsidence from Groundwater Use in California
CA Water Plan Update 2013 Vol 4 Reference Guide Page 192

APRIL 2014 REPORT OF FINDINGS Land Subsidence from Groundwater Use in California
LSCE, BORCHERS AND CARPENTER A-21
Topic: Groundwater Land Subsidence from Groundwater Use in California
CA Water Plan Update 2013 Vol 4 Reference Guide Page 193